Embed Size (px)
Citation preview
PROCEEDINGS, Twenty-Ninth Workshop on Geothermal Reservoir EngineeringStanford University, Stanford, California, January 26-28, 2004SGP-TR-175
IN SITU STRESS, FRACTURE, AND FLUID FLOW ANALYSIS IN WELL 38C-9:AN ENHANCED GEOTHERMAL SYSTEM IN THE COSO GEOTHERMAL FIELD
Judith M. Sheridan1 and Stephen H. Hickman2
1GeoMechanics International Inc., Palo Alto, California, USA (e-mail: [email protected])2U.S. Geological Survey, Menlo Park, California, USA (e-mail: [email protected])
ABSTRACT
Geoscientists from the Coso Operating Company,EGI-Utah, GeoMechanics International, and the U.S.Geological Survey are cooperating in a multi-yearstudy to develop an Enhanced Geothermal System(EGS) in the Coso Geothermal Field. Key to thecreation of an EGS is an understanding of therelationship among natural fracture distribution, fluidflow, and the ambient tectonic stresses that existwithin the resource in order to design a hydraulic andthermal stimulation of an east-flank injection well,the first step in the creation of a heat exchanger atdepth. Well datasets from the east flank of the CosoGeothermal Field are being analyzed to develop anunderstanding of the relationships between naturalfracture distribution, fluid flow, and the ambienttectonic stresses that exist within the resource.
During the second year of this project, wellbore logsand stress data were acquired in a new productionwell drilled in the Coso Geothermal Field, 38C-9.The image analysis results include the discriminationof natural from drilling induced fractures in wellboreimage data, natural fracture characterization, andwellbore failure analysis. A hydraulic fracturingstress test at 3,703 feet TVD was used to constrain anormal faulting and strike-slip faulting stress tensorfor this reservoir. The shear and normal stressesresolved on the fracture and fault planes werecalculated and used to identify the subset of criticallystressed planes that act to maintain permeabilitywithin the Coso Geothermal Field.
INTRODUCTION
The east flank of the Coso Geothermal Field is anexcellent setting for testing Enhanced GeothermalSystem (EGS) concepts. Fluid temperaturesexceeding 300°C have been measured at depths lessthan 10,000 feet and the reservoir is both highlyfractured and tectonically stressed. However, some ofthe wells within this portion of the reservoir arerelatively impermeable. High rock temperatures, ahigh degree of fracturing, high tectonic stresses, andlow intrinsic permeability are the combination of
qualities that define an ideal candidate EGS reservoir.The long-term goal of this five-year project is todevelop and evaluate an approach for the creation ofan EGS within the east flank of the Coso GeothermalReservoir.
Barton et al. (1995, 1998) have shown that optimallyoriented, critically stressed fractures controlpermeability in areas of active tectonics. Thissuggests that critically stressed fracture sets are likelyto be responsible for the majority of the geothermalproduction in the Coso Geothermal Field. A detailedanalysis is required in order to develop ageomechanical model of the reservoir, to determinewhich fractures are optimally oriented and criticallystressed for shear failure, and determine their role inreservoir permeability. The geomechanical modelincludes pore pressure (Pp), uniaxial compressiverock strength (C0), and the magnitudes andorientations of the principal stresses including themaximum horizontal stress (SHmax), the minimumhoriztonal stress (Shmin), and the vertical stress (Sv).These are derived from in situ pore pressuremeasurements, laboratory rock strength tests,wireline log data, hydraulic fracturing (minifrac) testresults, and observations of wellbore failure. Onlythrough fracture and wellbore failure analyses ofimage data, correlated petrographic analyses, andidentifying critically stressed fault orientations andfault orientations in fluid flow intervals can we thenunderstand the effects of subsequent stimulationexperiments on fracture permeability.
We adopted a multi-step approach used in previousstudies at Coso and elsewhere (Barton et al., 1997,1998; Hickman et al., 1998, 2000; Sheridan et al.,2003). We measured the orientation and distributionof fractures in two logged intervals in Coso well 38C-9, the newly drilled production well of the EGSdoublet. We developed preliminary constraints on thein situ state of stress based on observations ofwellbore failure, the results of a hydraulic fracturetest at 3,703 feet true vertical depth (TVD) to obtainShmin, and stress modeling to constrain the magnitudeof SHmax. All fractures were then analyzed for theirproximity to frictional failure using both a strike-slipand normal faulting stress model.
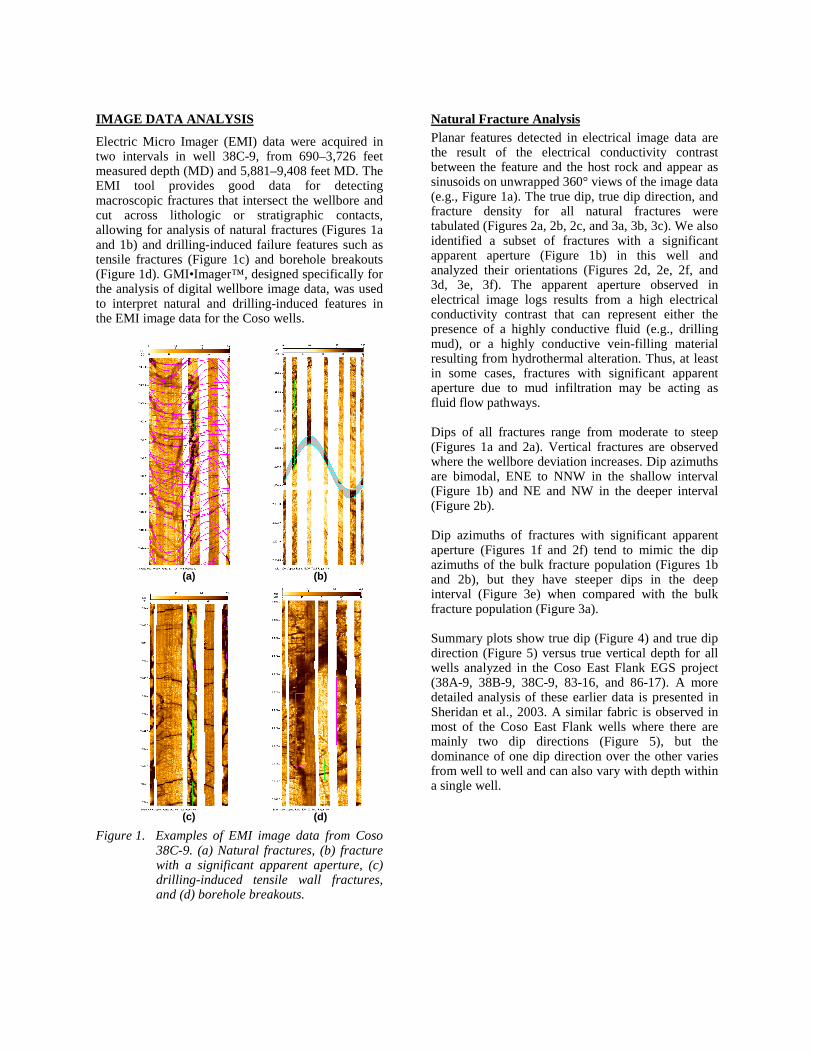
IMAGE DATA ANALYSIS
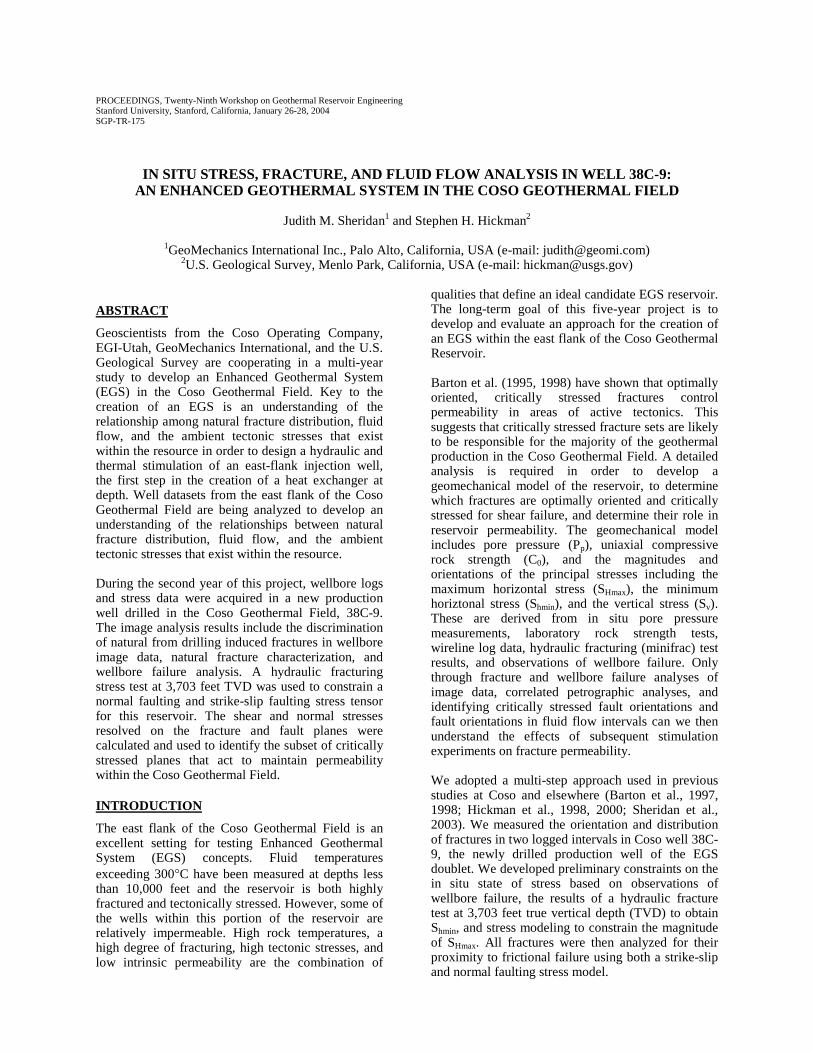
Electric Micro Imager (EMI) data were acquired intwo intervals in well 38C-9, from 690–3,726 feetmeasured depth (MD) and 5,881–9,408 feet MD. TheEMI tool provides good data for detectingmacroscopic fractures that intersect the wellbore andcut across lithologic or stratigraphic contacts,allowing for analysis of natural fractures (Figures 1aand 1b) and drilling-induced failure features such astensile fractures (Figure 1c) and borehole breakouts(Figure 1d). GMI•Imager™, designed specifically forthe analysis of digital wellbore image data, was usedto interpret natural and drilling-induced features inthe EMI image data for the Coso wells.
(a) (b)
(c) (d)
Figure 1. Examples of EMI image data from Coso38C-9. (a) Natural fractures, (b) fracturewith a significant apparent aperture, (c)drilling-induced tensile wall fractures,and (d) borehole breakouts.
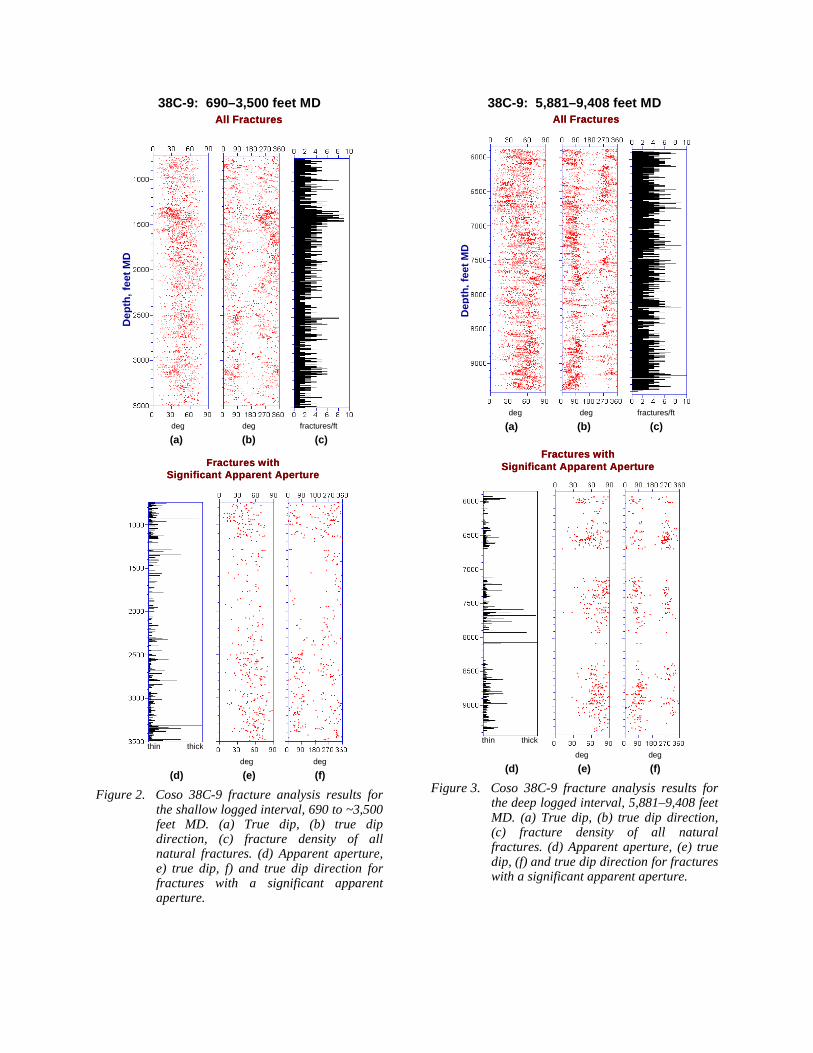
Natural Fracture AnalysisPlanar features detected in electrical image data arethe result of the electrical conductivity contrastbetween the feature and the host rock and appear assinusoids on unwrapped 360° views of the image data(e.g., Figure 1a). The true dip, true dip direction, andfracture density for all natural fractures weretabulated (Figures 2a, 2b, 2c, and 3a, 3b, 3c). We alsoidentified a subset of fractures with a significantapparent aperture (Figure 1b) in this well andanalyzed their orientations (Figures 2d, 2e, 2f, and3d, 3e, 3f). The apparent aperture observed inelectrical image logs results from a high electricalconductivity contrast that can represent either thepresence of a highly conductive fluid (e.g., drillingmud), or a highly conductive vein-filling materialresulting from hydrothermal alteration. Thus, at leastin some cases, fractures with significant apparentaperture due to mud infiltration may be acting asfluid flow pathways.
Dips of all fractures range from moderate to steep(Figures 1a and 2a). Vertical fractures are observedwhere the wellbore deviation increases. Dip azimuthsare bimodal, ENE to NNW in the shallow interval(Figure 1b) and NE and NW in the deeper interval(Figure 2b).
Dip azimuths of fractures with significant apparentaperture (Figures 1f and 2f) tend to mimic the dipazimuths of the bulk fracture population (Figures 1band 2b), but they have steeper dips in the deepinterval (Figure 3e) when compared with the bulkfracture population (Figure 3a).
Summary plots show true dip (Figure 4) and true dipdirection (Figure 5) versus true vertical depth for allwells analyzed in the Coso East Flank EGS project(38A-9, 38B-9, 38C-9, 83-16, and 86-17). A moredetailed analysis of these earlier data is presented inSheridan et al., 2003. A similar fabric is observed inmost of the Coso East Flank wells where there aremainly two dip directions (Figure 5), but thedominance of one dip direction over the other variesfrom well to well and can also vary with depth withina single well.
38C-9: 690–3,500 feet MDAll Fractures
Dep
th, f
eet
MD
All FracturesD
epth
, fee
t M
D
deg deg fractures/ft
(a) (b) (c)
Fractures with Significant Apparent Aperture
Fractures with Significant Apparent Aperture
deg deg
(d) (e) (f)
Figure 2. Coso 38C-9 fracture analysis results forthe shallow logged interval, 690 to ~3,500feet MD. (a) True dip, (b) true dipdirection, (c) fracture density of allnatural fractures. (d) Apparent aperture,e) true dip, f) and true dip direction forfractures with a significant apparentaperture.
38C-9: 5,881–9,408 feet MDAll Fractures
Dep
th, f
eet
MD
All Fractures
Dep
th, f
eet
MD
deg deg fractures/ft
(a) (b) (c)
Fractures with Significant Apparent Aperture
Fractures with Significant Apparent Aperture
deg deg
(d) (e) (f)
Figure 3. Coso 38C-9 fracture analysis results forthe deep logged interval, 5,881–9,408 feetMD. (a) True dip, (b) true dip direction,(c) fracture density of all naturalfractures. (d) Apparent aperture, (e) truedip, (f) and true dip direction for fractureswith a significant apparent aperture.
thin thickthin thick
Dep
th, f
eet T
VD
38A-9 38B-9 38C-9 83-16 86-17D
epth
, fee
t TV
D38A-9 38B-9 38C-9 83-16 86-17
degrees
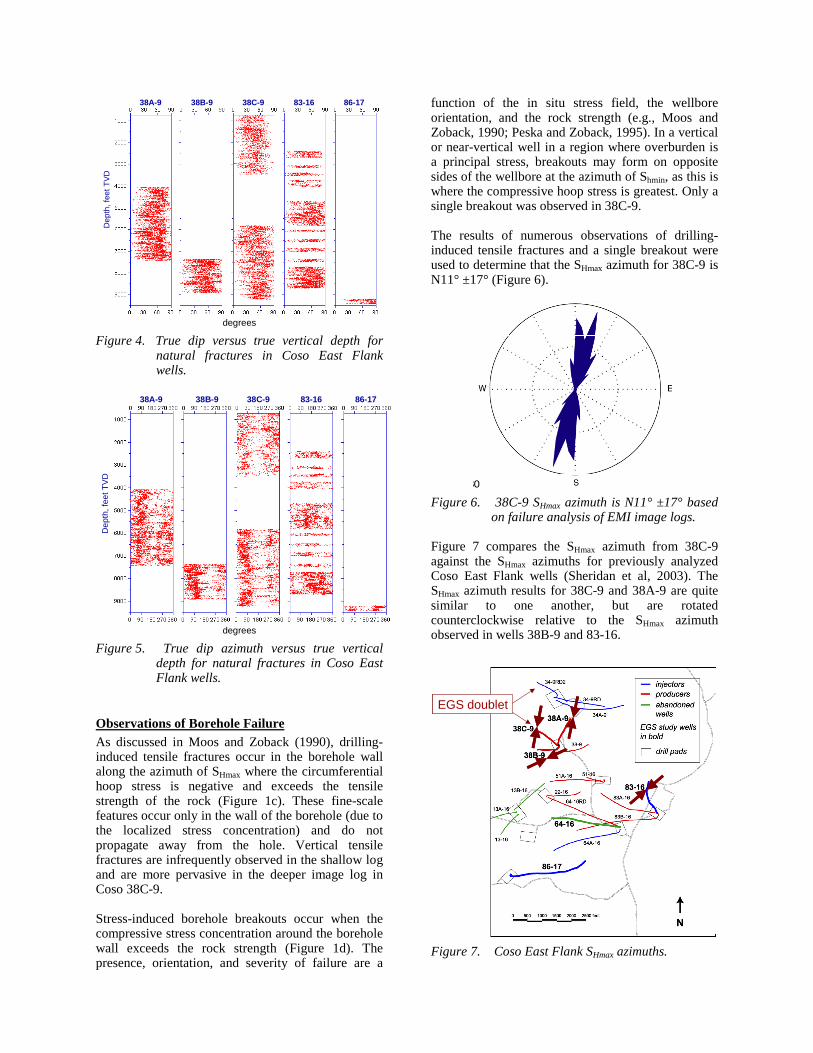
Figure 4. True dip versus true vertical depth fornatural fractures in Coso East Flankwells.
Dep
th, f
eet T
VD
38A-9 38B-9 38C-9 83-16 86-17
Dep
th, f
eet T
VD
38A-9 38B-9 38C-9 83-16 86-17
degrees
Figure 5. True dip azimuth versus true verticaldepth for natural fractures in Coso EastFlank wells.
Observations of Borehole FailureAs discussed in Moos and Zoback (1990), drilling-induced tensile fractures occur in the borehole wallalong the azimuth of SHmax where the circumferentialhoop stress is negative and exceeds the tensilestrength of the rock (Figure 1c). These fine-scalefeatures occur only in the wall of the borehole (due tothe localized stress concentration) and do notpropagate away from the hole. Vertical tensilefractures are infrequently observed in the shallow logand are more pervasive in the deeper image log inCoso 38C-9.
Stress-induced borehole breakouts occur when thecompressive stress concentration around the boreholewall exceeds the rock strength (Figure 1d). Thepresence, orientation, and severity of failure are a
function of the in situ stress field, the wellboreorientation, and the rock strength (e.g., Moos andZoback, 1990; Peska and Zoback, 1995). In a verticalor near-vertical well in a region where overburden isa principal stress, breakouts may form on oppositesides of the wellbore at the azimuth of Shmin, as this iswhere the compressive hoop stress is greatest. Only asingle breakout was observed in 38C-9.
The results of numerous observations of drilling-induced tensile fractures and a single breakout wereused to determine that the SHmax azimuth for 38C-9 isN11° ±17° (Figure 6).
Figure 6. 38C-9 SHmax azimuth is N11° ±17° basedon failure analysis of EMI image logs.
Figure 7 compares the SHmax azimuth from 38C-9against the SHmax azimuths for previously analyzedCoso East Flank wells (Sheridan et al, 2003). TheSHmax azimuth results for 38C-9 and 38A-9 are quitesimilar to one another, but are rotatedcounterclockwise relative to the SHmax azimuthobserved in wells 38B-9 and 83-16.
EGS doubletEGS doublet
Figure 7. Coso East Flank SHmax azimuths.
HYDRAULIC FRACTURING STRESSMEASUREMENT
As done in other geothermal fields (see Hickman etal., 1998, 2000), following cementation of the casingat a depth of 3,684 feet MD, a 57-foot long pilot holewas drilled out the bottom of the well in which toconduct the hydrofrac test. The entire casing stringwas pressurized to induce a hydraulic fracture in theuncased pilot hole. Repeated pressurization cycleswere then employed to extend this fracture awayfrom the borehole. Pressures and flow rates weremeasured at the surface and a high-accuracy,temperature-compensated quartz pressure gauge wassuspended 42 feet above the center of the test intervalto provide a continuous record of downhole pressureduring this test.
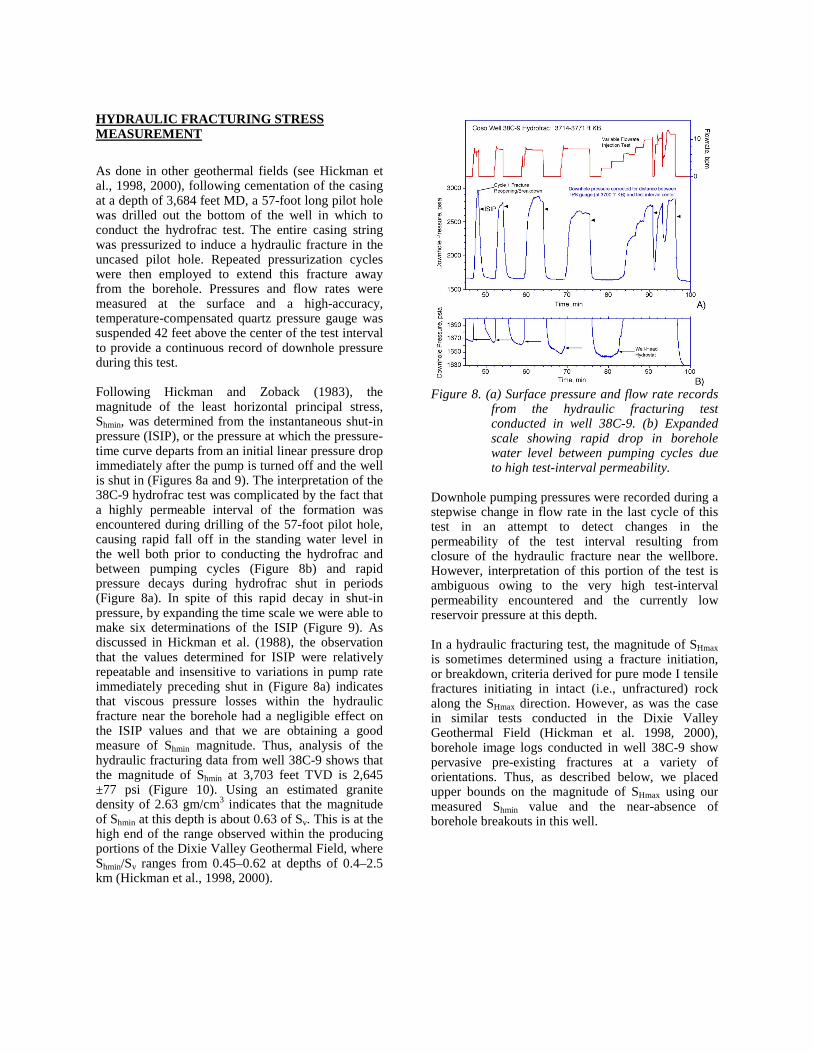
Following Hickman and Zoback (1983), themagnitude of the least horizontal principal stress,Shmin, was determined from the instantaneous shut-inpressure (ISIP), or the pressure at which the pressure-time curve departs from an initial linear pressure dropimmediately after the pump is turned off and the wellis shut in (Figures 8a and 9). The interpretation of the38C-9 hydrofrac test was complicated by the fact thata highly permeable interval of the formation wasencountered during drilling of the 57-foot pilot hole,causing rapid fall off in the standing water level inthe well both prior to conducting the hydrofrac andbetween pumping cycles (Figure 8b) and rapidpressure decays during hydrofrac shut in periods(Figure 8a). In spite of this rapid decay in shut-inpressure, by expanding the time scale we were able tomake six determinations of the ISIP (Figure 9). Asdiscussed in Hickman et al. (1988), the observationthat the values determined for ISIP were relativelyrepeatable and insensitive to variations in pump rateimmediately preceding shut in (Figure 8a) indicatesthat viscous pressure losses within the hydraulicfracture near the borehole had a negligible effect onthe ISIP values and that we are obtaining a goodmeasure of Shmin magnitude. Thus, analysis of thehydraulic fracturing data from well 38C-9 shows thatthe magnitude of Shmin at 3,703 feet TVD is 2,645±77 psi (Figure 10). Using an estimated granitedensity of 2.63 gm/cm3 indicates that the magnitudeof Shmin at this depth is about 0.63 of Sv. This is at thehigh end of the range observed within the producingportions of the Dixie Valley Geothermal Field, whereShmin/Sv ranges from 0.45–0.62 at depths of 0.4–2.5km (Hickman et al., 1998, 2000).
Figure 8. (a) Surface pressure and flow rate recordsfrom the hydraulic fracturing testconducted in well 38C-9. (b) Expandedscale showing rapid drop in boreholewater level between pumping cycles dueto high test-interval permeability.
Downhole pumping pressures were recorded during astepwise change in flow rate in the last cycle of thistest in an attempt to detect changes in thepermeability of the test interval resulting fromclosure of the hydraulic fracture near the wellbore.However, interpretation of this portion of the test isambiguous owing to the very high test-intervalpermeability encountered and the currently lowreservoir pressure at this depth.
In a hydraulic fracturing test, the magnitude of SHmax
is sometimes determined using a fracture initiation,or breakdown, criteria derived for pure mode I tensilefractures initiating in intact (i.e., unfractured) rockalong the SHmax direction. However, as was the casein similar tests conducted in the Dixie ValleyGeothermal Field (Hickman et al. 1998, 2000),borehole image logs conducted in well 38C-9 showpervasive pre-existing fractures at a variety oforientations. Thus, as described below, we placedupper bounds on the magnitude of SHmax using ourmeasured Shmin value and the near-absence ofborehole breakouts in this well.
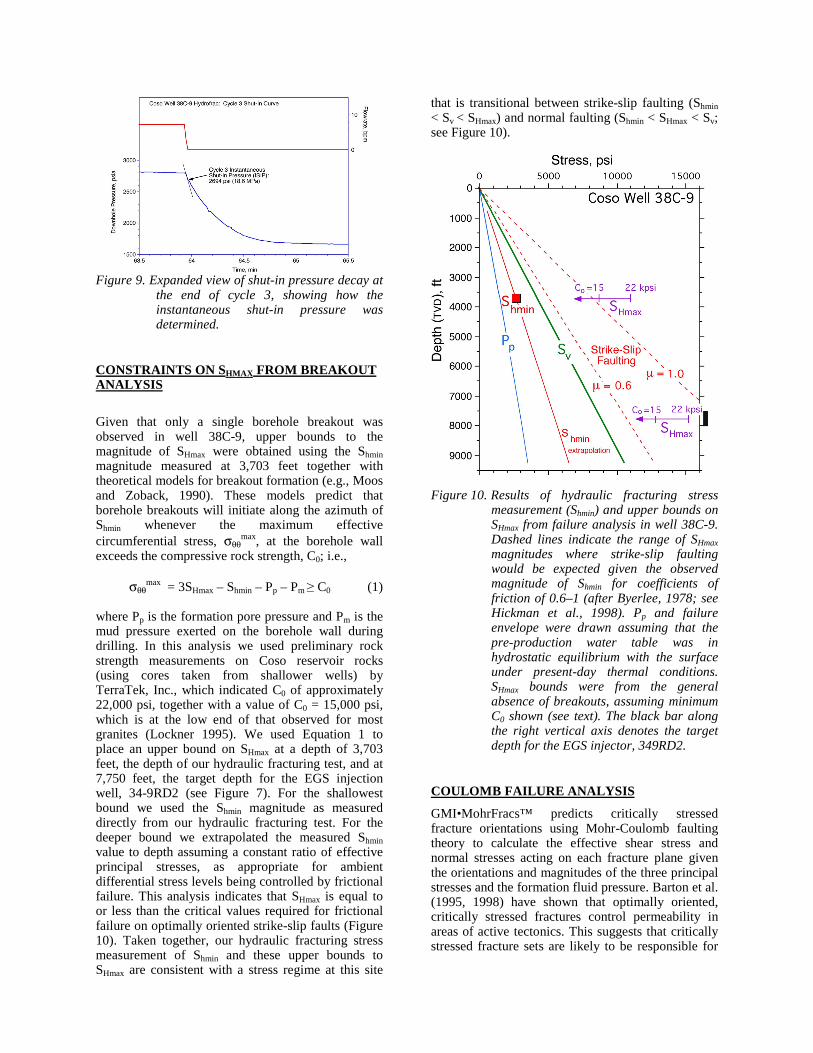
Figure 9. Expanded view of shut-in pressure decay atthe end of cycle 3, showing how theinstantaneous shut-in pressure wasdetermined.
CONSTRAINTS ON SHMAX FROM BREAKOUTANALYSIS
Given that only a single borehole breakout wasobserved in well 38C-9, upper bounds to themagnitude of SHmax were obtained using the Shmin
magnitude measured at 3,703 feet together withtheoretical models for breakout formation (e.g., Moosand Zoback, 1990). These models predict thatborehole breakouts will initiate along the azimuth ofShmin whenever the maximum effectivecircumferential stress, σθθ
max, at the borehole wallexceeds the compressive rock strength, C0; i.e.,
σθθmax = 3SHmax – Shmin – Pp – Pm ≥ C0 (1)
where Pp is the formation pore pressure and Pm is themud pressure exerted on the borehole wall duringdrilling. In this analysis we used preliminary rockstrength measurements on Coso reservoir rocks(using cores taken from shallower wells) byTerraTek, Inc., which indicated C0 of approximately22,000 psi, together with a value of C0 = 15,000 psi,which is at the low end of that observed for mostgranites (Lockner 1995). We used Equation 1 toplace an upper bound on SHmax at a depth of 3,703feet, the depth of our hydraulic fracturing test, and at7,750 feet, the target depth for the EGS injectionwell, 34-9RD2 (see Figure 7). For the shallowestbound we used the Shmin magnitude as measureddirectly from our hydraulic fracturing test. For thedeeper bound we extrapolated the measured Shmin
value to depth assuming a constant ratio of effectiveprincipal stresses, as appropriate for ambientdifferential stress levels being controlled by frictionalfailure. This analysis indicates that SHmax is equal toor less than the critical values required for frictionalfailure on optimally oriented strike-slip faults (Figure10). Taken together, our hydraulic fracturing stressmeasurement of Shmin and these upper bounds toSHmax are consistent with a stress regime at this site
that is transitional between strike-slip faulting (Shmin
< Sv < SHmax) and normal faulting (Shmin < SHmax < Sv;see Figure 10).
Figure 10. Results of hydraulic fracturing stressmeasurement (Shmin) and upper bounds onSHmax from failure analysis in well 38C-9.Dashed lines indicate the range of SHmax
magnitudes where strike-slip faultingwould be expected given the observedmagnitude of Shmin for coefficients offriction of 0.6–1 (after Byerlee, 1978; seeHickman et al., 1998). Pp and failureenvelope were drawn assuming that thepre-production water table was inhydrostatic equilibrium with the surfaceunder present-day thermal conditions.SHmax bounds were from the generalabsence of breakouts, assuming minimumC0 shown (see text). The black bar alongthe right vertical axis denotes the targetdepth for the EGS injector, 349RD2.
COULOMB FAILURE ANALYSIS
GMI•MohrFracs™ predicts critically stressedfracture orientations using Mohr-Coulomb faultingtheory to calculate the effective shear stress andnormal stresses acting on each fracture plane giventhe orientations and magnitudes of the three principalstresses and the formation fluid pressure. Barton et al.(1995, 1998) have shown that optimally oriented,critically stressed fractures control permeability inareas of active tectonics. This suggests that criticallystressed fracture sets are likely to be responsible for
the majority of the geothermal production in the CosoGeothermal Field.
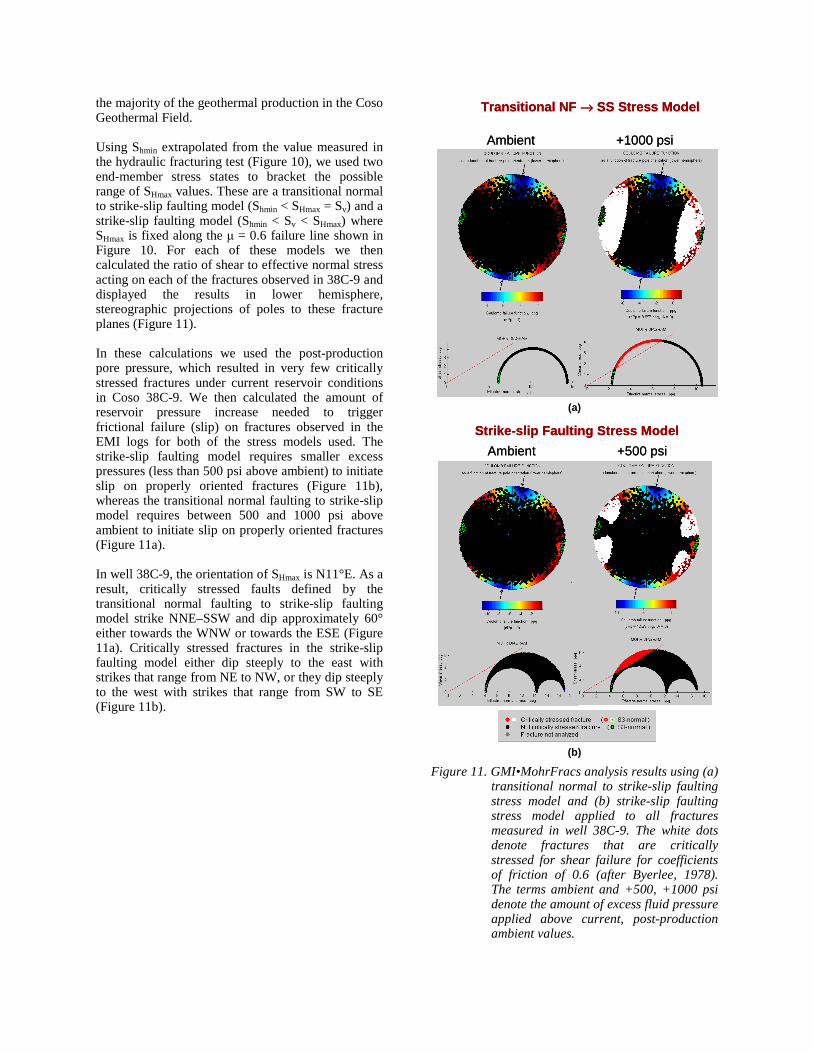
Using Shmin extrapolated from the value measured inthe hydraulic fracturing test (Figure 10), we used twoend-member stress states to bracket the possiblerange of SHmax values. These are a transitional normalto strike-slip faulting model (Shmin < SHmax = Sv) and astrike-slip faulting model (Shmin < Sv < SHmax) whereSHmax is fixed along the µ = 0.6 failure line shown inFigure 10. For each of these models we thencalculated the ratio of shear to effective normal stressacting on each of the fractures observed in 38C-9 anddisplayed the results in lower hemisphere,stereographic projections of poles to these fractureplanes (Figure 11).
In these calculations we used the post-productionpore pressure, which resulted in very few criticallystressed fractures under current reservoir conditionsin Coso 38C-9. We then calculated the amount ofreservoir pressure increase needed to triggerfrictional failure (slip) on fractures observed in theEMI logs for both of the stress models used. Thestrike-slip faulting model requires smaller excesspressures (less than 500 psi above ambient) to initiateslip on properly oriented fractures (Figure 11b),whereas the transitional normal faulting to strike-slipmodel requires between 500 and 1000 psi aboveambient to initiate slip on properly oriented fractures(Figure 11a).
In well 38C-9, the orientation of SHmax is N11°E. As aresult, critically stressed faults defined by thetransitional normal faulting to strike-slip faultingmodel strike NNE–SSW and dip approximately 60°either towards the WNW or towards the ESE (Figure11a). Critically stressed fractures in the strike-slipfaulting model either dip steeply to the east withstrikes that range from NE to NW, or they dip steeplyto the west with strikes that range from SW to SE(Figure 11b).
Transitional NF → SS Stress Model
Ambient +1000 psi
Transitional NF → SS Stress Model
Ambient +1000 psi
(a)
Strike-slip Faulting Stress Model
Ambient +500 psi
Strike-slip Faulting Stress Model
Ambient +500 psi
(b)
Figure 11. GMI•MohrFracs analysis results using (a)transitional normal to strike-slip faultingstress model and (b) strike-slip faultingstress model applied to all fracturesmeasured in well 38C-9. The white dotsdenote fractures that are criticallystressed for shear failure for coefficientsof friction of 0.6 (after Byerlee, 1978).The terms ambient and +500, +1000 psidenote the amount of excess fluid pressureapplied above current, post-productionambient values.
CONCLUSIONS
Coso well 38C-9 is the first drilled of two new wellsplanned for an Enhanced Geothermal System in theCoso East Flank area. 38C-9 datasets were analyzedto characterize fracture orientations and stressmagnitudes and orientations in order to identify thesubset of critically stressed planes that act to maintainpermeability within the Coso Geothermal Field.These results will also be incorporated in the designof the EGS reservoir injection and stimulationprogram for the East Flank. The image analysis for38C-9 shows a preponderance of moderate to steeplydipping fractures, dipping towards either thenortheast or northwest, similar to results from otherwells in the area. The orientation of drilling-inducedtensile fractures and a single borehole breakoutindicate an SHmax azimuth of 11º ±17º in well 38C-9.This is parallel to the SHmax azimuth observed in well38A-9, but differs from that observed in bothsouthern wells, 38B-9 and 83-16. Hydraulicfracturing stress test results show that the magnitudeof Shmin is relatively low (about 0.63 of the verticalstress) but slightly above that predicted for normalfaulting failure. However, borehole failure analysisand simple frictional faulting theory indicate that thisvalue of Shmin and approximate bounds on SHmax areconsistent with crustal strength being controlled bystrike-slip faulting. Plans to run a hydraulic fracturingstress test in a deeper interval in 34-9RD2, the secondwell in the EGS doublet, will constrain the stressmodel further. Fracture failure analyses using theimproved Coso stress model indicate that normalfaulting failure will not occur under ambientconditions, but can be induced through increases inreservoir pressure in excess of 500 psi. Strike-slipfailure can be induced by lesser increases in reservoirpressure.
REFERENCES
Barton, C. A., Zoback, M. D. and Moos, D. (1995),“Fluid flow along potentially active faults incrystalline rock,” Geology, 23 (8), 683–686.
Barton, C. A., Moos, D. and Zoback, M. D. (1997),“In situ stress measurements can help define localvariations in fracture hydraulic conductivity atshallow depth,” The Leading Edge, 1,653–1,656.
Barton, C. A., Hickman, S., Morin, R., Zoback, M.D. and Benoit, D. (1998), “Reservoir-scale fracturepermeability in the Dixie Valley, Nevada,Geothermal Field,” Proceedings 23rd Workshop onGeothermal Reservoir Engineering, Stanford Univ.,299–306.
Byerlee, J. (1978), “Friction of rocks,” Pure andApplied Geophysics, 116, 615–626.
Jaeger, J. C. and Cook, N. G. W. (1979),“Fundamentals of Rock Mechanics (Third Edition),”New York, Chapman and Hall, 28–30.
Hickman, S. H. and Zoback, M. D. (1983), “Theinterpretation of hydraulic fracturing pressure-timedata for in-situ stress determination,” in HydraulicFracturing Measurements, edited by M. D. Zobackand B. C. Haimson, National Academy Press,Washington, D.C., 44–54.
Hickman, S., Zoback, M. D. and Healy, J. H. (1988),“Continuation of a deep borehole stress measurementprofile near the San Andreas Fault, I: Hydraulicfracturing stress measurements at Hi Vista, MojaveDesert, CA,” Journal of Geophysical Research, 93,15,183–15,195.
Hickman, S., Zoback M. D. and Benoit R. (1998),“Tectonic controls on reservoir permeability in theDixie Valley, Nevada, geothermal field,” Proceed-ings 23rd Workshop on Geothermal Reservoir Engi-neering, Stanford Univ., 291–298.
Hickman, S., Zoback, M. D., Barton, C., Benoit, R.,Svitek, J. and Summers R. (2000), “Stress andpermeability heterogeneity within the Dixie Valleygeothermal reservoir: Recent results from well 82-5,”Proceedings 25th Workshop on Geothermal ReservoirEngineering, Stanford Univ., 256–265.
Lockner, D. (1995), “Rock Failure,” in Rock Physicsand Phase Relations: A Handbook of PhysicalConstants, T. Ahrens (ed.), American GeophysicalUnion Reference Shelf 3, 127–147.
Moos, D. and Zoback, M. D. (1990), “Utilization ofObservations of Well Bore Failure to Constrain theOrientation and Magnitude of Crustal Stresses:Application to Continental, Deep Sea DrillingProject, and Ocean Drilling Program Boreholes,” J.Geophys. Res., 95, 9305–9325.
Peska, P. and Zoback, M. D. (1995), “Observationsof borehole breakouts and tensile wall fractures indeviated boreholes: A technique to constrain in situstress and rock strength,” Journal of GeophysicalResearch, 100, 12791-12811.
Sheridan, J., Kovac, K., Rose, P. E., Barton, C.,McCulloch, J., Berard, B., Moore, J., Petty, S. andSpielman, P. (2003), “In situ stress, fracture and fluidflow analysis-East Flank of the Coso GeothermalField,” Proceedings 28th Workshop on GeothermalReservoir Engineering, Stanford Univ., 34-49.