Embed Size (px)
Citation preview
In-situ Penetration as Alternative to Extensive Boreholes and
Lab Testing for Exploration in Sandy Soils
Mwajuma Ibrahim Lingwanda
Licentiate Thesis
Department of Civil and Architectural Engineering
Division of Soil and Rock Mechanics
Royal Institute of Technology
Stockholm, 2015


iii
Preface
This research work was pursued in the period between April 2012 and December 2014 at the
Division of Soil and Rock Mechanics, KTH Royal Institute of Technology and University of Dar es
Salaam, Tanzania particularly the Department of Transportation and Geotechnical Engineering in
the College of Engineering and Technology. The work was closely supervised by Professor Stefan
Larsson of KTH who was assisted by Dr Dalmas L. Nyaoro of University of Dar es Salaam.
The research is part of Rural and Urban Infrastructure Development Program conducted in
Tanzania and funded by Swedish International Development Cooperation Agency (Sida). Their
financial support is highly appreciated. In connection, I would like to express my gratitude to the
management of the department of Transportation and Geotechnical Engineering for giving me the
opportunity to be part of the Sida funded program and to the Principal of Mbeya Institute of Science
and Technology for allowing me the time to pursue the research.
I would like to extend my acknowledgement to the supervisors Professor Stefan Larsson and Dr
Dalmas Nyaoro for the guidance, support and motivation throughout the study. I had an
opportunity to learn a lot from each of them apart from matters relating to this particular research
work.
My sincere gratitude also goes to Mr Juma and his group for their participation in the laborious
field work activities. Laboratory technicians at the Soil Mechanics Lab, University of Dar es Salaam
are equally thanked for their assistance in conducting the lab tests. I also thank my colleagues at
the Department of Transportation and Geotechnical Engineering especially Ms Motta Kyando for
her contribution in making the data collection process possible.
To my colleagues at the Division of Soil and Rock Mechanics, I would like to thank everyone for
their contribution especially during the constructive seminars. It has been a pleasure to have the
opportunity to participate in such a productive and wonderful group.
Lastly, to my family, brothers and sisters for their love and support. Each one of you has
contributed in a way to my academic achievement. My mother Asia, father Engineer Ibrahim, son
Isaac and in a special way to my beloved husband Issa for his encouragement and patience.
Dar es Salaam, December 2014
Mwajuma Lingwanda
iv
Abstract
Geotechnical investigation is an important part of rural and urban infrastructure development. The
cost of which is a significant part of a construction project, therefore it should be of concern. Any
program or research to assist reduction of geotechnical investigation cost is valuable and should
be appreciated. In Tanzania, the most commonly used method for site exploration is the standard
penetration test (SPT) accompanied by bore-holing and laboratory testing of retrieved samples.
However, this method is expensive in monetary and time cost. Consequently, in attempt to save
time and money, a few number of tests are normally executed for site investigations. When it is
necessary to increase the scope of investigation, geotechnical engineers normally supplement
the bore-holing with a cheaper and much quicker method, the light dynamic probing (DPL).
Through this research, the static cone penetration test (CPT) has been introduced to enable
collection of larger amount of data in a shorter time and reduce the cost of data acquisition. Both
the SPT and CPT are very popular in the world as compared to the DPL.
Determination of soil design values in geotechnical engineering normally relies on established
relationships between measured values and desired soil design parameters. As a result, there
exist various empirical correlations between soil test results and design values. In-situ and
laboratory tests are the major categories of soil testing methods. Although the light dynamic
probing has been in use for quite some time in Tanzania, there are no published local relationships
between its data and soil design values. This makes it underutilized in the sense that data
collected with it are only applicable for site stratification purposes. The need to increase
usefulness of DPL values for design is one objective of this study. The approach adopted to fulfil
this objective is to establish relationships between results of DPL and those from the popular
methods of SPT and CPT.
The geotechnical community has long been aware of uncertainties induced in the design systems
due to variations in soils and loads properties, inaccuracies in design equations, errors in
measurements and in the construction process. Traditionally, at the design stage, the engineer
relies on factors of safety to reduce the risk of adverse effects. This is done without a separate
evaluation of each of the factor contributing to the uncertainty. A global safety factor is assigned,
therefore subjective. Reliability based design (RBD) is a relatively new concept of structural safety
which provide a consistent evaluation of design risk using probability theory. Essential to its
application, is the quantification and consideration of uncertainties involved. Quantified
uncertainties of soil parameter values may also find application in evaluating effectiveness of soil
exploration programs.
A rather extensive soil exploration was performed on a sandy soil in Dar es Salaam where CPT,
DPL, SPT and samples were collected for laboratory testing. With the information gathered,
empirical correlations were established between CPT and DPL data, SPT and DPL data, as well
as between CPT and SPT data. Based on the coefficient of regression and the transformation
uncertainties, DPL to CPT transformation appears better than DPL to SPT transformation,
therefore recommended for use. Geotechnical uncertainties associated with CPT, DPL and SPT
methods were quantified and compared to uncertainties in determination of soil secant
constrained modulus (𝑀𝑠) obtained directly from the oedometer test. In order to establish
transformation model uncertainties, correlations were established between 𝑀𝑠 and the in-situ
measurement data. Results indicates that the three in-situ methods are associated with similar
order of magnitudes of total uncertainties in predicting 𝑀𝑠 which are about twice as much as
uncertainties in obtaining 𝑀𝑠 directly from the oedometer test. For further studies, it is
recommended to determine the consequences of the quantified uncertainties to a designed
foundation.
v
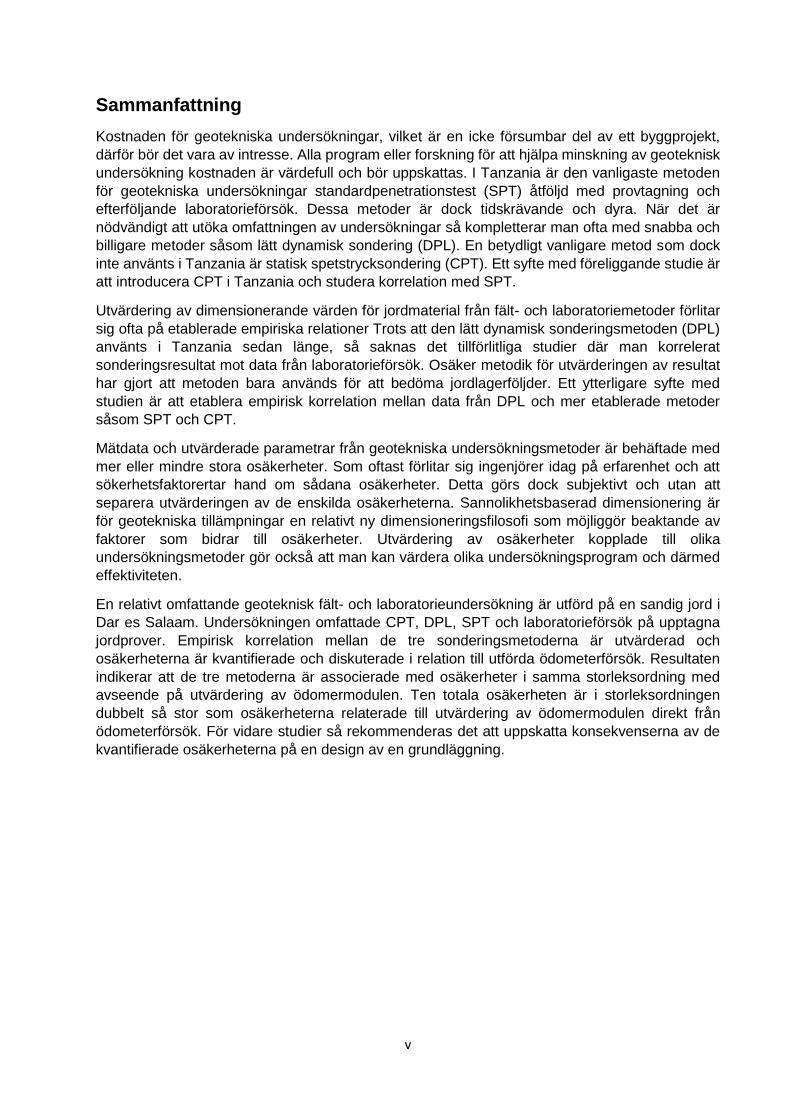
Sammanfattning
Kostnaden för geotekniska undersökningar, vilket är en icke försumbar del av ett byggprojekt,
därför bör det vara av intresse. Alla program eller forskning för att hjälpa minskning av geoteknisk
undersökning kostnaden är värdefull och bör uppskattas. I Tanzania är den vanligaste metoden
för geotekniska undersökningar standardpenetrationstest (SPT) åtföljd med provtagning och
efterföljande laboratorieförsök. Dessa metoder är dock tidskrävande och dyra. När det är
nödvändigt att utöka omfattningen av undersökningar så kompletterar man ofta med snabba och
billigare metoder såsom lätt dynamisk sondering (DPL). En betydligt vanligare metod som dock
inte använts i Tanzania är statisk spetstrycksondering (CPT). Ett syfte med föreliggande studie är
att introducera CPT i Tanzania och studera korrelation med SPT.
Utvärdering av dimensionerande värden för jordmaterial från fält- och laboratoriemetoder förlitar
sig ofta på etablerade empiriska relationer Trots att den lätt dynamisk sonderingsmetoden (DPL)
använts i Tanzania sedan länge, så saknas det tillförlitliga studier där man korrelerat
sonderingsresultat mot data från laboratorieförsök. Osäker metodik för utvärderingen av resultat
har gjort att metoden bara används för att bedöma jordlagerföljder. Ett ytterligare syfte med
studien är att etablera empirisk korrelation mellan data från DPL och mer etablerade metoder
såsom SPT och CPT.
Mätdata och utvärderade parametrar från geotekniska undersökningsmetoder är behäftade med
mer eller mindre stora osäkerheter. Som oftast förlitar sig ingenjörer idag på erfarenhet och att
sökerhetsfaktorertar hand om sådana osäkerheter. Detta görs dock subjektivt och utan att
separera utvärderingen av de enskilda osäkerheterna. Sannolikhetsbaserad dimensionering är
för geotekniska tillämpningar en relativt ny dimensioneringsfilosofi som möjliggör beaktande av
faktorer som bidrar till osäkerheter. Utvärdering av osäkerheter kopplade till olika
undersökningsmetoder gör också att man kan värdera olika undersökningsprogram och därmed
effektiviteten.
En relativt omfattande geoteknisk fält- och laboratorieundersökning är utförd på en sandig jord i
Dar es Salaam. Undersökningen omfattade CPT, DPL, SPT och laboratorieförsök på upptagna
jordprover. Empirisk korrelation mellan de tre sonderingsmetoderna är utvärderad och
osäkerheterna är kvantifierade och diskuterade i relation till utförda ödometerförsök. Resultaten
indikerar att de tre metoderna är associerade med osäkerheter i samma storleksordning med
avseende på utvärdering av ödomermodulen. Ten totala osäkerheten är i storleksordningen
dubbelt så stor som osäkerheterna relaterade till utvärdering av ödomermodulen direkt från
ödometerförsök. För vidare studier så rekommenderas det att uppskatta konsekvenserna av de
kvantifierade osäkerheterna på en design av en grundläggning.
vi
List of publications
This licentiate thesis is based on work presented in three publications as listed below:
Paper I Lingwanda, M. I., Larsson, S. and Nyaoro, D. L. 2014. Correlations of SPT, CPT and DPL data for sandy soil in Tanzania. Geotechnical and Geological Engineering
Paper II Lingwanda, M. I., Larsson, S. and Nyaoro, D. L. 2014. Inherent soil variability linked to different characterization methods. In proceedings of Sida Annual Regional conference, Entebbe, July, 2014
Paper III Lingwanda, M. I., Larsson, S., Prästings, A. and Nyaoro, D. L. 2014. Comparison of geotechnical uncertainties linked to different soil characterization methods. Geomechanics and Geoengineering: An International Journal
The author of this thesis did the planning of field works, participated in the field and laboratory
works, analysed the measured data, and did the calculations, graphing and writing work all under
the supervision of the co-authors Larsson and Nyaoro. The co-author Larsson closely supervised
the calculation work as well as shaping the papers through critical discussions conducted time to
time therefore has contributed to the great extent of the final products. Co-author Nyaoro
contributed much during conduction of field and laboratory works while co-author Prästings
contributed intellectually to paper III.
vii
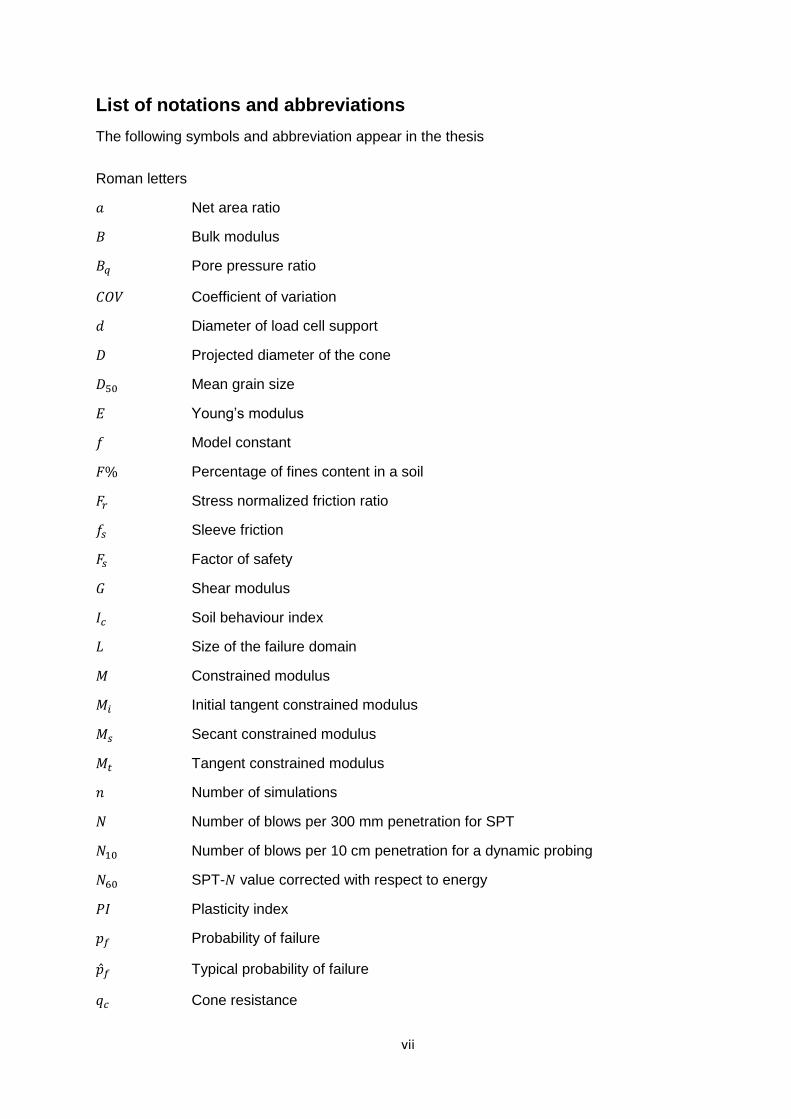
List of notations and abbreviations
The following symbols and abbreviation appear in the thesis
Roman letters
𝑎 Net area ratio
𝐵 Bulk modulus
𝐵𝑞 Pore pressure ratio
𝐶𝑂𝑉 Coefficient of variation
𝑑 Diameter of load cell support
𝐷 Projected diameter of the cone
𝐷50 Mean grain size
𝐸 Young’s modulus
𝑓 Model constant
𝐹% Percentage of fines content in a soil
𝐹𝑟 Stress normalized friction ratio
𝑓𝑠 Sleeve friction
𝐹𝑠 Factor of safety
𝐺 Shear modulus
𝐼𝑐 Soil behaviour index
𝐿 Size of the failure domain
𝑀 Constrained modulus
𝑀𝑖 Initial tangent constrained modulus
𝑀𝑠 Secant constrained modulus
𝑀𝑡 Tangent constrained modulus
𝑛 Number of simulations
𝑁 Number of blows per 300 mm penetration for SPT
𝑁10 Number of blows per 10 cm penetration for a dynamic probing
𝑁60 SPT-𝑁 value corrected with respect to energy
𝑃𝐼 Plasticity index
𝑝𝑓 Probability of failure
�̂�𝑓 Typical probability of failure
𝑞𝑐 Cone resistance
viii
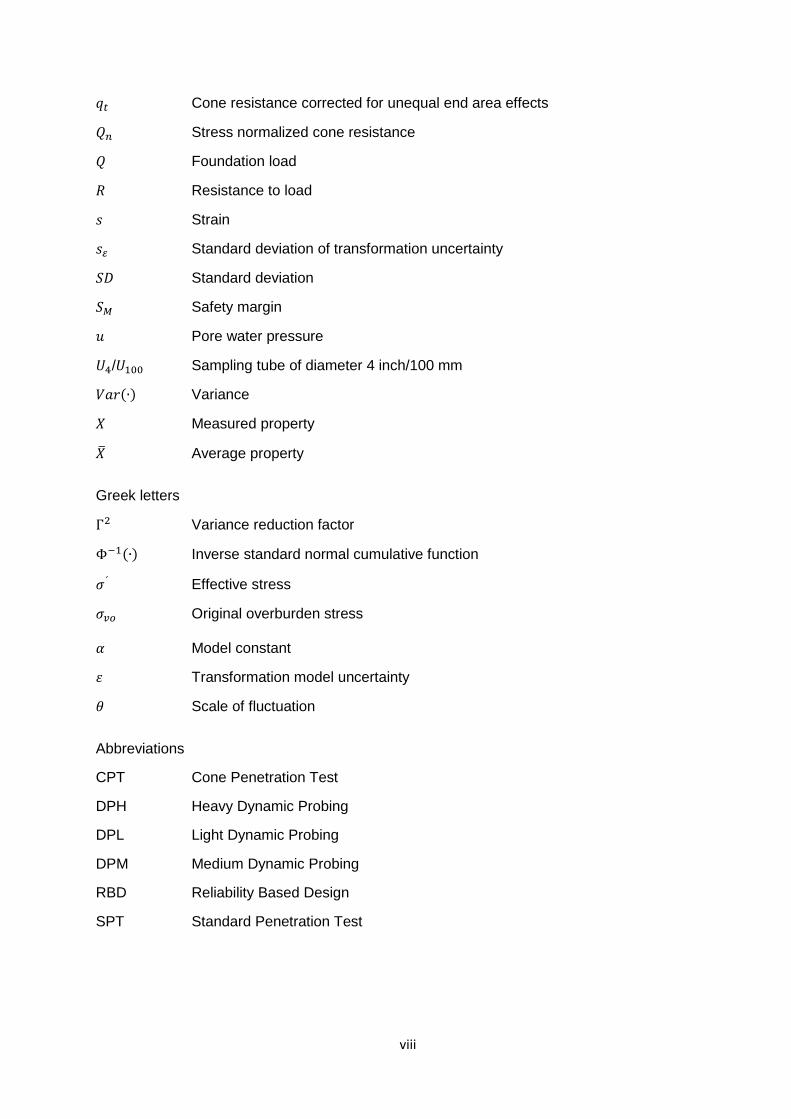
𝑞𝑡 Cone resistance corrected for unequal end area effects
𝑄𝑛 Stress normalized cone resistance
𝑄 Foundation load
𝑅 Resistance to load
𝑠 Strain
𝑠𝜀 Standard deviation of transformation uncertainty
𝑆𝐷 Standard deviation
𝑆𝑀 Safety margin
𝑢 Pore water pressure
𝑈4/𝑈100 Sampling tube of diameter 4 inch/100 mm
𝑉𝑎𝑟(∙) Variance
𝑋 Measured property
�̅� Average property
Greek letters
Γ2 Variance reduction factor
Φ−1(∙) Inverse standard normal cumulative function
𝜎´ Effective stress
𝜎𝑣𝑜 Original overburden stress
𝛼 Model constant
𝜀 Transformation model uncertainty
𝜃 Scale of fluctuation
Abbreviations
CPT Cone Penetration Test
DPH Heavy Dynamic Probing
DPL Light Dynamic Probing
DPM Medium Dynamic Probing
RBD Reliability Based Design
SPT Standard Penetration Test
ix
Table of Contents
Preface ........................................................................................................................................................ iii
Abstract ...................................................................................................................................................... iv
Sammanfattning ........................................................................................................................................ v
List of publications .................................................................................................................................. vi
List of notations and abbreviations ................................................................................................... vii
Table of Contents ..................................................................................................................................... ix
Chapter 1 – Introduction .........................................................................................................................1
1.1 Background ..................................................................................................................................1
1.2 Research objectives and significance ......................................................................................2
1.3 Outline of the thesis ....................................................................................................................2
Chapter 2 – In-situ tests and correlations between data ................................................................3
2.1 Advantages of in-situ tests over sampling and lab testing ....................................................3
2.2 Cone Penetration Test (CPT) ....................................................................................................3
2.3 Standard Penetration Test (SPT) .............................................................................................4
2.4 Light Dynamic Probing test (DPL) ............................................................................................5
2.5 General observations for data collected in-situ ......................................................................5
2.5.1 Skin friction effect on DPL ..................................................................................................5
2.5.2 Effect of soil type on SPT results ......................................................................................7
2.5.3 Effect of overburden stress on in-situ test results ..........................................................7
2.6 In-situ tests influence zones ......................................................................................................8
2.7 Previous correlations ..................................................................................................................8
2.7.1 CPT – DPL and SPT – DPL correlations .........................................................................8
2.7.2 CPT – SPT correlations ......................................................................................................9
Chapter 3 – Soil modulus and its determination ........................................................................... 11
3.1 General ...................................................................................................................................... 11
3.2 Types of soil moduli ................................................................................................................. 12
3.3 Determination of constrained modulus ................................................................................. 12
3.4 Correlations with in-situ tests.................................................................................................. 13
Chapter 4 – Geotechnical uncertainties and their determination ............................................. 15
5.1 Sources of uncertainties .......................................................................................................... 15
5.2 Evaluation of uncertainties ...................................................................................................... 16
5.3 Variance reduction ................................................................................................................... 16
x
5.4 Importance of quantifying uncertainties ................................................................................ 17
Chapter 5 – Consequences of uncertainties .................................................................................. 18
5.1 Importance of evaluating the consequences of uncertainties ........................................... 18
5.2 Computation of failure probability .......................................................................................... 18
5.3 Input to the performance function .......................................................................................... 19
5.4 Comparing probabilities of failure .......................................................................................... 20
Chapter 6 – Summary of appended papers .................................................................................... 21
6.1 Paper I ........................................................................................................................................ 21
6.2 Paper II....................................................................................................................................... 21
6.3 Paper III ..................................................................................................................................... 22
Chapter 7 – Conclusions and recommendations .......................................................................... 23
References ............................................................................................................................................... 24
Appended Papers ................................................................................................................................... 29
1
Chapter 1 – Introduction
1.1 Background
Before construction of a foundation for a civil engineering structure, the two major phases of a
geotechnical undertaking are; determination of design soil parameters through site investigation
and foundation design. In the first phase, geotechnical investigation is performed with in-situ
and/or laboratory testing of samples retrieved from the respective area. In practice, the test results
are then manipulated to determine soil design parameters normally through previously established
empirical correlations. There are numerous accepted in-situ testing methods to determine details
of the subsurface conditions with respect to foundation design. The standard penetration test
(SPT) and the cone penetration test (CPT) are most common and popular methods worldwide.
The light dynamic probing (DPL) method is not as popular as compared to SPT and CPT but is
quite common for site stratification in Tanzania. A very comprehensive history and development
of these in-situ methods was recently given by Massarsch (2014). Laboratory testing methods are
of different categories and their selection depend mainly on the type of information desired for a
particular design.
In relation to determination of soil design parameters, the current practice in Tanzania is to perform
SPT accompanied with sampling for further laboratory testing. This practice is known to be costly
in time and money, as a result, limited investigation scopes are normally performed in attempt to
save money. According to Temple and Stukhart (1987), inadequate geotechnical investigation is
the number one source of costly, overdesigned foundations, project delays, disputes, claims and
project cost overruns therefore need proper attention. Consequently, in such situations,
geotechnical engineers are tempted to reduce the risk of failure by over-designing the foundations
(Parsons and Frost, 2002; Jaksa et al., 2003). A common approach in Tanzania for increasing the
amount of information at affordable cost is to perform the cheaper and much quicker DPL as a
supplement to SPT. However, DPL results are limited to site stratification use as there are no
previously established relationships between soil design values and its data as opposed to the
more popular SPT and CPT methods. Before this research, the CPT was yet to be introduced to
practitioners in Tanzania and it is one of the objectives of the research to introduce the method.
Geotechnical engineers in Tanzania still apply the traditional total factor of safety method for
designing of geotechnical structures. Subjectively, a global factor of safety between 2 and 3 is
normally applied to accommodate the effects of uncertainties to the designed foundations.
Reliability based design (RBD) is a relatively new concept of safety which basically provide a
consistent evaluation of design risk using probability theory. Essential to the application of RBD is
the quantification and consideration of uncertainties involved. Quantified uncertainties of soil
parameter values may also find application in evaluating effectiveness of soil exploration
programs. Different soil investigation methods may be associated with different magnitudes of
uncertainties. Their quantification and comparisons will aid in decision making when it comes to
selecting one investigation method out of the available ones. In general terms, the CPT is
considered superior to the SPT in terms of quality of information gathered. There is even
suggestions to abandon the SPT as investigation method on the basis of its crudeness
(Robertson, 2012). A rational comparison of uncertainties between information gathered with
different methods together with their consequences to the final design will shade light to the extent
of effects of method choice on the cost of designed foundation in addition to the ordinary practice
of considering only time and cost of executed method when deciding the type and scope of
geotechnical investigations.
2
1.2 Research objectives and significance
The main objective of this research is to achieve cost effective geotechnical investigation with
application of in-situ methods but without sacrificing the quality of information gathered. As
geotechnical engineers are experienced in using SPT and lab obtained data for design, the
proposal of relatively new methods such as CPT and DPL data to be incorporated in designs
should come hand in hand with understanding of the consequences. Three specific objectives
were set to be studied;
I. Determining relationship between data from the three in-situ methods considered in the study.
SPT – CPT relationships are common in literature but SPT – DPL and CPT – DPL are
uncommon. After the relationships are established with the statistical quality determined,
recommendation shall be made on the best way of intermediate transformation of DPL data
to design values. In addition, SPT – CPT relationship shall be compared to those existing in
literature and commented on.
II. Quantifying uncertainties related to soil testing methods
A comparison of uncertainties linked to the in- situ methods is a rational way of determining
how each method can accurately predict a desired soil design value from the measured
values. A laboratory method shall be selected to provide a benchmark for the comparison.
Since the last decade, the geotechnical community has seen an increased interest in the
application of RBD for geotechnical structures. Studies related to RBD application at different
soil conditions and methods of investigation have been conducted and reported. The
quantified uncertainties may save as inputs to reliability based design problems in similar
geotechnical conditions as such information is normally not readily available in ordinary
geotechnical projects due to limitation in investigation scope. Studies of this nature are
demanded as they provide information and a room for improving analytical methods. As
recently remarked by Ching and Phoon (2014), characterization of geotechnical variability is
still an immature research area.
III. Determining the impact of geotechnical uncertainties to final designed foundations
To determine the effects of a selected soil investigation method to the designed foundation, it
is decided to quantify the consequences of the uncertainties. This shall be done through a
foundation design case study where data from the four different soil investigation methods
shall be used as inputs to a foundation settlement prediction problem using RBD. The
observed outputs shall be compared and conclusion drawn about the effect of employing each
individual method in obtaining foundation design data.
1.3 Outline of the thesis
This thesis comprises of two main parts; the research summary and three appended papers. The
summary is presented in seven chapters. The first chapter is the introduction to the research in
general which basically is the background, objective and significance of the research. The second
chapter is about understanding the in-situ methods involved in the research and existing
relationships between their data. The third chapter is about the laboratory method that was chosen
as the benchmark for comparing uncertainties, the oedometer test, particularly determination of
soil modulus through it. The fourth chapter describes the types of geotechnical uncertainties
studied under this research and the methods of determination. The fifth chapter describes briefly
about what shall be done to fulfil the third objective which is basically the PhD phase. In chapter
six, a brief explanation of what is found in the appended papers is provided. Finally, conclusion
and recommendations are presented in chapter seven.
3
Chapter 2 – In-situ tests and correlations between data
2.1 Advantages of in-situ tests over sampling and lab testing
In-situ test provide efficient and economical means for determining the subsurface profile
information and specific property data required for the design of foundations. Several benefits can
be realized by employing in-situ techniques as compared to sampling and laboratory testing.
Orchant et al. (1988) highlighted the benefits of using in-situ method as:
i They can be used in soils which are difficult to sample such as saturated sands without
causing significant sample disturbance.
ii They allow materials to be tested in their existing state of stress and natural environment
avoiding the influence of sampling, transportation, and storage which sometimes make it
difficult to create this conditions in the laboratory. Obtaining soil property data in its natural
stress state and environment is important to best predict foundation response to the
applied loads.
iii Some in-situ methods such as the CPT provide a continuous record of the soil profile thus
increasing the probability of predicting layer boundaries and the geological details more
accurately.
iv With in-situ tests a larger volume of soil is tested than in most laboratory tests and the
results better reflect the influence of the soil structure on the designed foundation.
v In remote locations, transporting undisturbed samples to a laboratory for testing may pose
a challenge, making in-situ tests an attractive option in such cases.
vi In-situ test results may be interpreted on site allowing for immediate performance of
addition tests where necessary.
The applicability of a given test method depend on several factors. The most important one is
ability of the test to provide the necessary information to enable foundation design. Other factors
include the geological conditions of the tested area, availability of equipment, project
requirements, method of analysis intended for the design, range of soil conditions for which the
test is suited, access requirements and cost of performing the test.
2.2 Cone Penetration Test (CPT)
The static cone penetration test or simply the cone penetration test is carried out by hydraulically
pushing a 60o cone of area 10 cm2, diameter 35.7 mm into the ground at a constant speed of 2
cm/s while measuring the force necessary to push. In addition to measuring the cone resistance
(𝑞𝑐), the shear force on a 150 cm2 friction sleeve with the same outer diameter as the cone and
located immediately above the cone, is also measured as (𝑓𝑠). The penetration rate is an important
factor that affect the results and have been studied for example by Kim et al. (2008). In a normal
operation, the cone is driven from the ground surface with a penetration rig without bore-holing.
CPTs are either of mechanical friction case or electric penetrometers. In the electric cone,
measurements are made using strain gauges or transducers located immediately above the cone.
The modern electronic CPT equipment is considered to be operator independent and is capable
of measuring not only 𝑞𝑐 and 𝑓𝑠 but also other parameters such as pore pressure (in piezocones),
cone inclination and soil sensitivity depending on the manufacturer. According to Robertson
(2011), most commercial CPT cones are capable of penetrating very hard soils and even soft
rocks. In comparison between the two common measurements with CPT, 𝑓𝑠 is generally less
accurate as compared to 𝑞𝑐 (Lunne et al., 1997; Robertson, 2011) due to design differences and
tolerance. This study generally utilized 𝑞𝑐 values. The speed and convenience with which modern
4
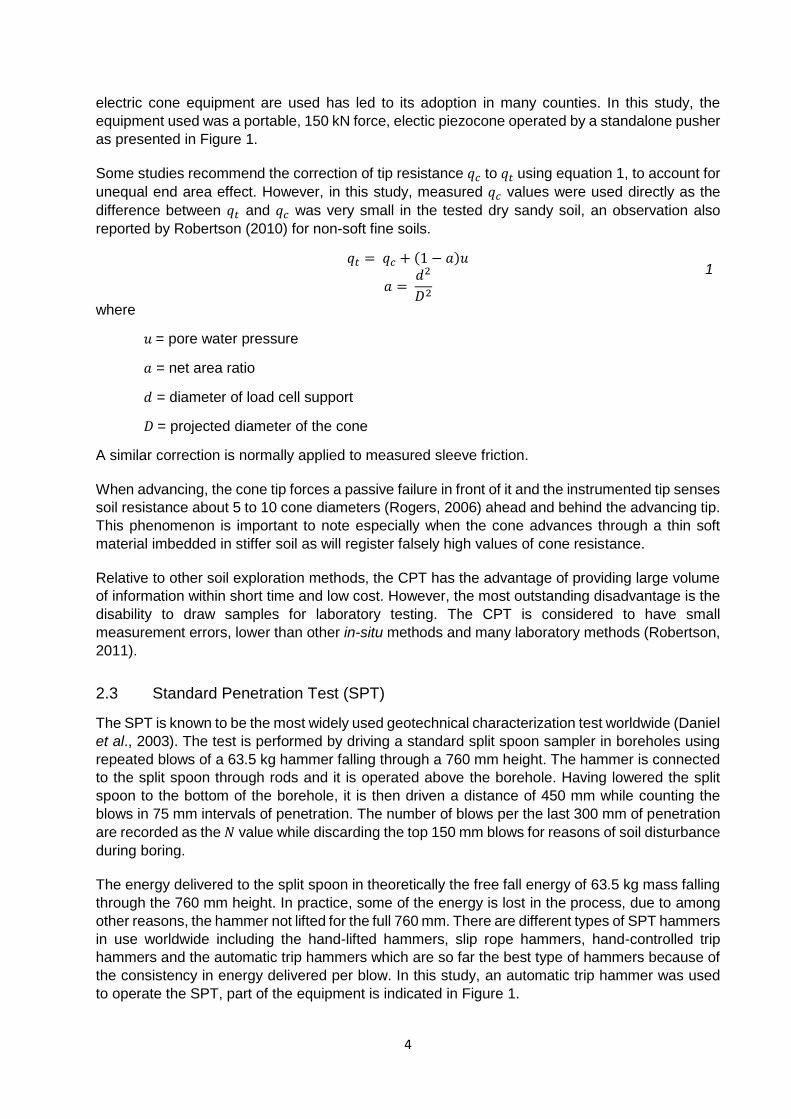
electric cone equipment are used has led to its adoption in many counties. In this study, the
equipment used was a portable, 150 kN force, electic piezocone operated by a standalone pusher
as presented in Figure 1.
Some studies recommend the correction of tip resistance 𝑞𝑐 to 𝑞𝑡 using equation 1, to account for
unequal end area effect. However, in this study, measured 𝑞𝑐 values were used directly as the
difference between 𝑞𝑡 and 𝑞𝑐 was very small in the tested dry sandy soil, an observation also
reported by Robertson (2010) for non-soft fine soils.
𝑞𝑡 = 𝑞𝑐 + (1 − 𝑎)𝑢
𝑎 = 𝑑2
𝐷2
1
where
𝑢 = pore water pressure
𝑎 = net area ratio
𝑑 = diameter of load cell support
𝐷 = projected diameter of the cone
A similar correction is normally applied to measured sleeve friction.
When advancing, the cone tip forces a passive failure in front of it and the instrumented tip senses
soil resistance about 5 to 10 cone diameters (Rogers, 2006) ahead and behind the advancing tip.
This phenomenon is important to note especially when the cone advances through a thin soft
material imbedded in stiffer soil as will register falsely high values of cone resistance.
Relative to other soil exploration methods, the CPT has the advantage of providing large volume
of information within short time and low cost. However, the most outstanding disadvantage is the
disability to draw samples for laboratory testing. The CPT is considered to have small
measurement errors, lower than other in-situ methods and many laboratory methods (Robertson,
2011).
2.3 Standard Penetration Test (SPT)
The SPT is known to be the most widely used geotechnical characterization test worldwide (Daniel
et al., 2003). The test is performed by driving a standard split spoon sampler in boreholes using
repeated blows of a 63.5 kg hammer falling through a 760 mm height. The hammer is connected
to the split spoon through rods and it is operated above the borehole. Having lowered the split
spoon to the bottom of the borehole, it is then driven a distance of 450 mm while counting the
blows in 75 mm intervals of penetration. The number of blows per the last 300 mm of penetration
are recorded as the 𝑁 value while discarding the top 150 mm blows for reasons of soil disturbance
during boring.
The energy delivered to the split spoon in theoretically the free fall energy of 63.5 kg mass falling
through the 760 mm height. In practice, some of the energy is lost in the process, due to among
other reasons, the hammer not lifted for the full 760 mm. There are different types of SPT hammers
in use worldwide including the hand-lifted hammers, slip rope hammers, hand-controlled trip
hammers and the automatic trip hammers which are so far the best type of hammers because of
the consistency in energy delivered per blow. In this study, an automatic trip hammer was used
to operate the SPT, part of the equipment is indicated in Figure 1.
5
The SPT may be regarded as both, an in-situ test (when taking 𝑁 values) or a sampling method
as it allows collection of disturbed samples in the boring process, undisturbed samples through
special tubes named 𝑈4 or 𝑈100 samplers and disturbed samples from the split spoon. The split
spoon has an outside diameter of 51 mm and an inside diameter of 35 mm.
The most important factor that affects SPT 𝑁 values is the energy that actually drives the sampler.
This energy is influenced by such factors as hammer weight, height of fall, type of hammer as well
as type and size of driving rods. The importance of driving energy has long being appreciated and
has triggered many studies on the area such as Schmertmann and Palacios (1979), Bosscher
and Showers (1987), Yokel (1989), Morgano and Liang (1992), Drumright et al. (1996), Abou-
matar and Goble, (1997), Daniel et al. (2005), Youd et al. (2008), Lee et al. (2010). Being the
average historical energy recorded from different operators (Daniel et al., 2003), 60% of the
theoretical hammer energy is considered the standard energy for harmonizing SPT 𝑁 values and
is also recommended by Skempton (1986). The energy corrected 𝑁 value is presented as 𝑁60 .
The device used in this study was the high efficiency (Drumright et al. 1996, Youd et al. 2008)
automatic trip hammer. The specific hammer used for this study has an efficiency 71% as
measured during calibration by the manufacturer. Both CPT and SPT values have been correlated
with many soil design parameters e.g. in Kulhawy and Mayne (1990).
2.4 Light Dynamic Probing test (DPL)
Dynamic probing is the oldest method of ground penetration for exploration purposes of
foundation engineering. Due to simplicity of the test, there are a variety of dynamic probing
equipment used worldwide. When the equipment are classified in terms of hammer weight, the
light dynamic probing is the one with a hammer of 10 kg or less. Others are heavy dynamic probing
(DPH) and medium dynamic probing (DPM). In operating the DPL, the weight is dropped
repeatedly through a 50 cm height and the number of blows to cause a 100 mm penetration is
recorded as 𝑁10. A cone of diameter 25.2 mm or 35.7 mm is attached to roads of 22 mm outer
diameter. The equipment used in this study complies with international standard as elaborated by
Steffanoff et al. (1988) and is hereby presented in Figure 1.
Results of DPL testing are normally presented as a graph of number of blows against the
penetrated depth. Through such graphs, a change in soil layering may be depicted and number
of layers with their approximate thickness may be predicted over the penetrated depth. It has been
reported that DPL results may be influenced by deformation of driving rods, skin friction especially
in cohesive soils, driving rate and the application of driving energy. These effects may be
minimized by ensuring a vertical cone drive all the time, use of cone diameter slightly larger than
the rods diameter, a consistent driving rate normally of 15 to 30 blows/min as well as ensuring a
constant height of fall of the hammer.
2.5 General observations for data collected in-situ
Through practice and research, practitioners have documented important observations related to
application of in-situ tests for geotechnical investigations. This section summarizes information
relevant to the study.
2.5.1 Skin friction effect on DPL
In dynamic penetration testing such as with the DPL, the skin friction effect is greater in soft soils
(Steffanof et al., 1988). The test is considered more suitable for granular soils (Spagnoli, 2007).
However the effects may be reduced by using equipment with cone diameter significantly larger
than thickness of rods or using casings. According to Spagnoli (2007), cementation and relative
6
density of the soil considerably increase the recorded penetration resistance. In this study, the
soil was a dry stiff sandy, therefore the effects of skin friction are expected to be minimal.
Figure 1 Equipment used for in-situ testing (a) SPT (b) DPL (c) CPT
7
2.5.2 Effect of soil type on SPT results
Study by Bosscher and Showers (1987) indicates the effect of soil type on the amount of energy
losses during SPT operations with stiffer soils subject to higher losses which in turn, falsely
increases blow counts. Yokel (1989) studied the mechanism of energy transfer in SPT sampler
and concluded that the amount of energy actually used to penetrate the sampler depends on the
stiffness of soil such that it decreases with increase in number of blows. Lee et al. (2010) analysed
the reaction of SPT sampler as it strikes soils of different stiffness. They came to conclusion that
two different secondary impacts occur depending on soil penetration resistance where in soils
with 𝑁 < 25, additional sampler penetration is to be expected due to rebound impact while for
𝑁 > 50, the secondary impact does not contribute to further driving of the sampler hence larger
𝑁 values.
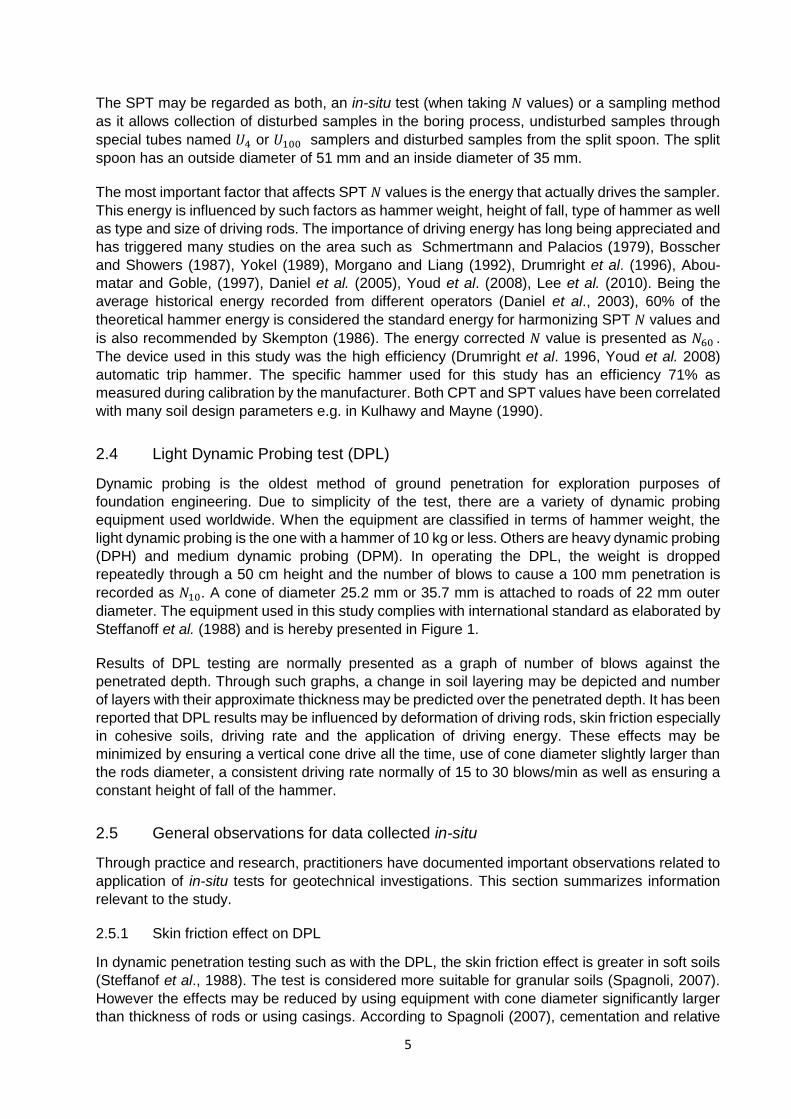
Typical side by side in-situ measurements from the study area are indicated in Figure 2 where the
high magnitudes of penetration resistance indicate a stiff to very stiff soil. Laboratory results
indicate the type of soil as sand with varying amounts of silt and clay. In the figure, it can be
observed that the gap between CPT and SPT profiles increase with depth. This may be explained
by the effect of soil stiffness to SPT values where falsely high 𝑁 values are recorded for stiffer
soils as the depth increases. The impact is an increased data scatter for the relationship between
𝑞𝑐 and 𝑁60. Since DPL resembles SPT in terms of both being dynamic methods, a similar effect
of soil stiffness to measured values is noted for 𝑁10 values as can be seen in Figure 2.
2.5.3 Effect of overburden stress on in-situ test results
In-situ measurements are affected by overburden stress at which they were determined. There
has been studies and suggestions on factors to account for overburden normalization in both SPT
(Liao and Whitman, 1986; Skempton, 1986) and CPT (Moss et al., 2006; Maki et al., 2013) among
others. According to Liao and Whitman (1986), the basis for the overburden correction factors rest
Figure 2 Side by side in-situ measurements at a location on the study area
0
1
2
3
4
5
6
7
8
9
10
0 10 20 30 40 50 60 70 80
Dep
th (
m)
Measured soil Resistance
CPT qc (MPa) DPL N10 SPT N
8
on data for normally consolidated, uncemented, unaged, clean quartz sands. The suggested
corrections may therefore introduce errors if applied to mixed soils such as encountered in this
study site. Furthermore, overburden correction factors are not recommended for CPT
measurements taken at depths shallower than 20 m (Fellenius, 2009) and it was decided in this
study, not to correct the in-situ measurements before developing the relationships. After all, the
correlated pairs were basically recorded at the same depths and therefore are supposed to be
equally affected by stress levels. Some previously developed correlations between in-situ test
data such as those by Chin et al. (1990); Akca (2003); Bozbey and Togrol (2010) did also not
consider the overburden normalization of data pairs.
2.6 In-situ tests influence zones
When the SPT sampler is forced to penetrate through the ground, it influences in addition to the
penetrated 30 cm, a further distance equal to 4 to 7 times the sampler diameter (Rogers, 2006).
Similarly, the tip of an advancing 10 cm2 CPT cone is considered to influence a soil depth of about
38 cm ahead of it. In addition to sampler diameter, the size of the influence zone is also affected
by soil stiffness with deeper zones expected in stiffer soils. Study by Ahmadi and Robertson (2005)
indicated that the zone of influence in dense sand layers is about 10 – 20 times the cone diameter
for CPT. A similar condition is to be expected from an advancing DPL cone. In order to develop
correlations between in-situ test results, CPT and DPL data were averaged over a 560 cm depth
which is about 10 times the size of SPT sampler, being the largest of the three. This depth of
influence was decided taking into consideration the stiff to very stiff nature of the soil encountered
in the study site.
2.7 Previous correlations
The long term experience with the use of SPT and CPT for site characterization has enabled
development of many correlations between the test data and soil design parameters as well as
between data from the two test methods. This is not the case with DPL probably because the test
is only suitable for shallow investigations of about up to 10 m deep (Steffanoff et al., 1988).
Previous relationships between CPT and SPT data, example by Robertson et al. (1983) and
Anagnostopolous et al. (2003), were established on the ground of practitioners being well
experienced with SPT while the CPT was a new method that needed time to expertise. Other
reasons are for cross checking, comparison and evaluation of parameters obtained from the
correlated methods, to permit the use of interpretation methods or charts developed for one test
with the results of the other test and converting a database available for one test to a database
for the other test (Marchetti, 2011). Rogers (2006) recommends joint application of CPT and SPT
for better site investigation results.
2.7.1 CPT – DPL and SPT – DPL correlations
Generally, CPT – DPL and SPT – DPL are not common in literature. This may be a result of DPL
being a not so common method. Another probable factor is the fact that there exist several
dynamic probing equipment in use worldwide (Steffanoff et al., 1988) distinguished mainly by the
weight of the hammer that produces the driving energy, rod diameter and cone size. This means
existing correlations between dynamic probing data and other testing methods will differ
depending on the equipment used for data collection.
According to Figuiredo et al. (2013) research similar to the one presented in this thesis was
executed in Brazil to promote the use of DPL for design purposes. Their review revealed a good
agreement between CPT and DPL data which is attributed to geometrical resemblance of the
penetrometers. This study has also achieved similar findings where DPL data have been found to
9
better correlate to CPT than SPT data. The importance of local correlations is well acknowledged
by among others, Schmertmann (1978), on the basis that correlations may be significantly
different in different geological conditions. This calls for development of correlations suitable for
Dar es Salaam and eventually Tanzanian soils and make them available for local use. The
extensive use of SPT in Tanzania makes it of interest to develop correlations with both CPT and
DPL.
In an attempt to improve the correlation between SPT and CPT data, the components of cone
resistance and skin friction of CPT were added together. This is in line with Schmertmann (1979)
suggestion that SPT sampler is subjected to both tip resistance and sleeve friction during driving.
Unfortunately these two components are inseparable in the ordinary SPT procedure therefore the
alternative approach is to add the separately measured 𝑞𝑐 and 𝑓𝑠 prior to developing the
relationships. This approach resulted to a slightly better correlation between CPT and DPL data,
also CPT and SPT data in this study.
2.7.2 CPT – SPT correlations
Relationships between SPT and CPT data are very common in literature. A compilation can be
found in Akca (2003), who also noted the absence of geological description of the soils with
previously developed relationships. With application of arithmetic average and regression
analysis, he came out with relationships between SPT and CPT in carbonic soils of United Arab
Emirates. As a general observation, the correlations did not compare very well with those
suggested in previous literature. Most recently, Ahmed et al. (2014) produced correlations
applicable for both calcareous and siliceous soils in relation to compressibility characteristics of
the soil expressed in terms of 𝐷50 for SPT and soil behaviour index (𝐼𝑐) for CPT. The index 𝐼𝑐 is
obtained through equation 2.
The study by Chin et al. (1990) indicates two major observations for sandy soils; that the ratio 𝑞𝑐
𝑁⁄ decreases with fine contents and it correlates better with 𝐹% than 𝐷50. An important factor
to be noted from their study is that the tests were performed on hydraulically filled and natural
sand layers. Another factor noted from their study is that the energy correction to SPT was to 55%
and not the commonly suggested value of 60%. Edet et al. (1994) obtained strong correlation
between SPT and CPT data for costal sands which may be attributed to the few number of data
used. Elkateb and Ali (2010) ascertained the inapplicability of existing correlations for application
in fine to medium calcareous sandy soils. They also observed that the ratio 𝑞𝑐
𝑁⁄ for calcareous
sand is higher than for siliceous sands. Their study resulted to a modified relationship between
CPT and SPT that is based on 𝐼𝑐.
Jefferies and Davies (1993) aimed at providing a CPT – SPT relationship that may be applicable
without the need for soil sampling. From theoretical view, they urged that the ratio 𝑞𝑐
𝑁⁄ should
lie between 0.4 and 0.8. They proposed a correlation that is based on soil behaviour index 𝐼𝑐which
is basically a soil classification with CPT data, hence eliminated the necessity to sample the soil
to be able to relate SPT with CPT data.
𝐼𝑐 = √{3 − 𝑙𝑜𝑔[𝑄𝑛 (1 − 𝐵𝑞)]}2
+ {1.5 + 1.3(𝑙𝑜𝑔 𝐹𝑟)}2
𝐹𝑟 = 𝑓𝑠
𝑞𝑡 − 𝜎𝑣𝑜 × 100%
𝑄𝑛 = 𝑞𝑡 − 𝜎𝑣𝑜
𝜎𝑣𝑜´
𝐵𝑞 = 𝑢 − 𝑢𝑜
𝑞𝑡 − 𝜎𝑣𝑜
2
10
Kara and Gündüz (2010) applied arithmetic average and statistical regression analysis to
determine the relationship between CPT and SPT for heterogeneous soils of Turkey. The
arithmetic average method resulted to 𝑞𝑐
𝑁⁄ ratios similar to those previously obtained by other
researchers but the regression analysis method gave low coefficients of correlations which may
be attributed to the variability of the tested soils. Kasim et al. (1986) presented SPT – CPT
correlations in hydraulically placed sand fill underlain by natural sand layer. The results indicates
scatter of 𝑞𝑐
𝑁⁄ related to 𝐷50 especially for the natural sand which has higher fine content. The
approach by Kulhway and Mayne (1990) was to correlate the ratio 𝑞𝑐
𝑁⁄ with both 𝐷50 and 𝐹%
with a rather large database where they found out that the correlation with 𝐷50 was better than
that with 𝐹%, contrary to Chin et al. (1990). They extended the work done by Robertson et al.
(1983) by incorporating more data in their database.
Perhaps the most commonly referred CPT – SPT correlations are those developed by Robertson
et al. (1983) and their modification. The correlations expresses the relationship between 𝑞𝑐
𝑁⁄ and
𝐷50 with consideration of energy correction to measured 𝑁 values. They observed that the ratio
as well as the data scatter increases with increase in 𝐷50 which implies that SPT to CPT
correlations are expected to be poorer for soils with higher amounts of larger particles.
11
Chapter 3 – Soil modulus and its determination
3.1 General
Soil modulus is one of the most difficult soil parameters to estimate due to its dependency on so
many factors (Briaud, 2000). As such, the conditions associated with the soil modulus should be
reported with it whenever one wants to present the parameter. If a triaxial or oedometer test is
considered, a stress – strain curve may be plotted from the result of loading the soil sample. The
slope of the curve is related to the soil moduli in a convenient expression. Because soils do not
exhibit linear stress – strain relationships, many moduli may be defined from a stress – strain
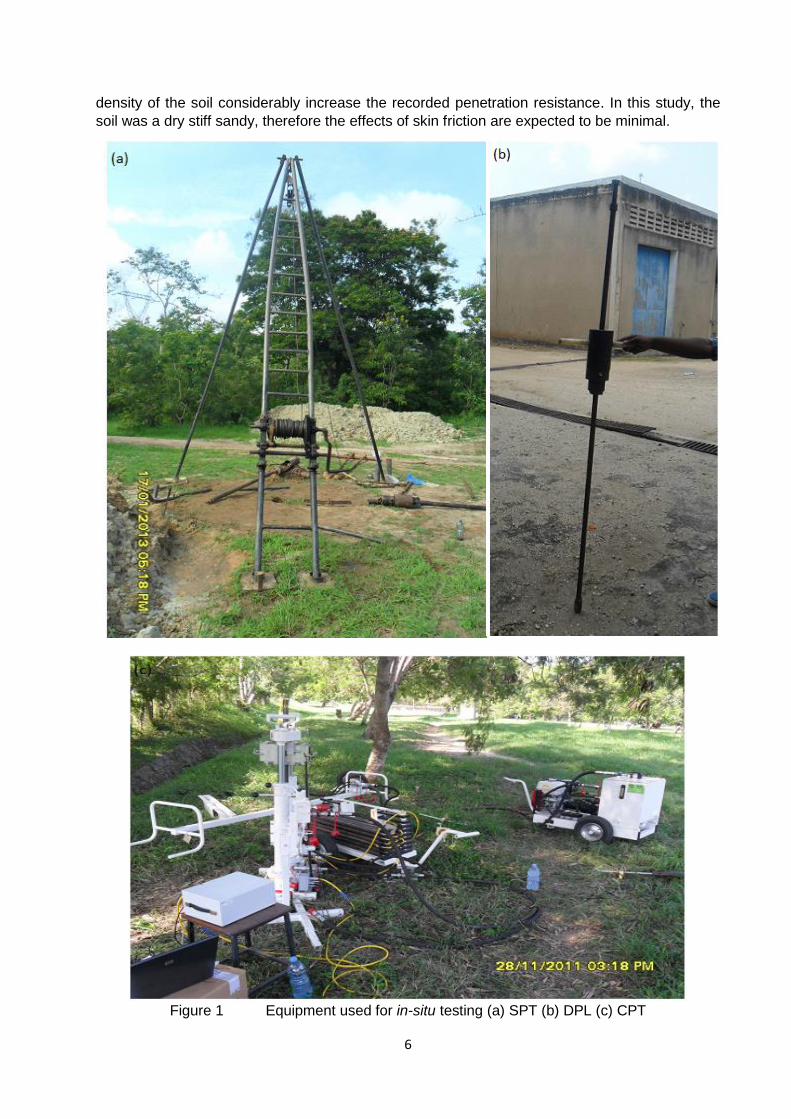
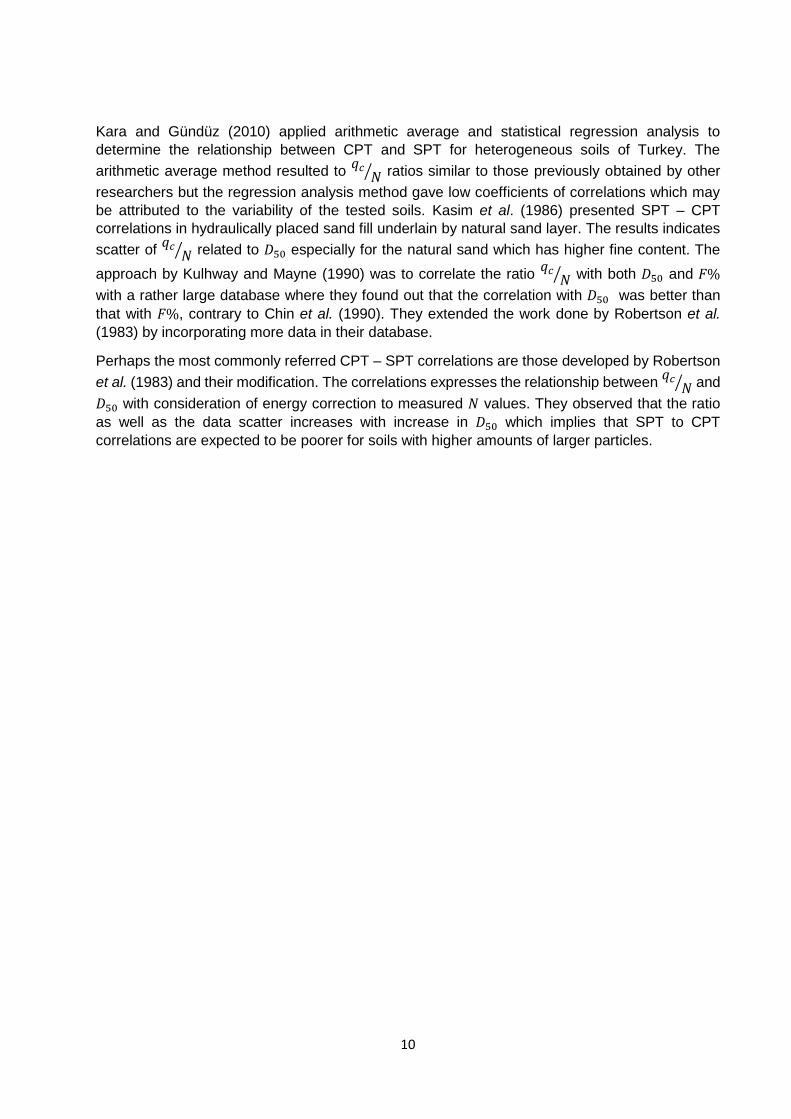
curve such as secant, initial tangent, tangent and cyclic as elaborated in Figure 3. Regardless of
which slope is determined, the state at which the soil is at the time of determination of the modulus
will affect the determined modulus.
Duncan and Bursey (2013) identified the factors that affect determination of soil moduli. Briaud
(2000) discussed the factors under two headings; state factors and loading factors. He described
state factors as:
i Soil dry density – how close the particles are packed in the soil mass. High modulus is
expected for closely spaced soil particles.
ii Soil structure – how the soil particles are organized. Loose or dense for granular soils and
dispersed or flocculated for fine grained soils.
iii Water content of the soil – for fine grained soils, low water content may result to high soil
moduli such as dry clays whereas for coarse grained soils less lubrication is achieved between
particles which results to low density hence low moduli
iv Stress history of the soil – refers to stress at which the soil was subjected in the past.
Overconsolidated soils tend to have higher moduli than the normally consolidated deposits
because the former are in the reloading phase while the later are in the first cycle of loading.
v Cementation – may lead to significantly increased soil moduli. This may be temporal due to
water content or chemical cementation example due to presence of calcium particles between
soil particles.
Figure 3 Different types of soil moduli from a stress – strain curve
12
Loading related factors that influence soil moduli are identified as follows:
i The mean stress level of the soil – the confinement effect; the higher the stresses confining
the soil mass the higher the moduli.
ii Strain level in the soil – secant moduli depend on the mean strain level in the influence zone
where in most cases a decrease in soil moduli is expected for an increase in mean strain level
with few exceptions.
iii Strain rate in the soil – like other viscous materials behaviour, the faster the rate of loading the
stiffer the soil and therefore the higher the moduli appears to be.
iv The number of loading cycles experienced by the soil – if the loading is repeated several times,
the secant modulus tend to decrease with increase in loading cycles
v Drainage conditions – this refers to the time available for the soil to drain during loading. The
two extremes are undrained and drained conditions. The time required to maintain the
undrained condition or to ensure that complete drainage takes place depends on the soil type.
Depending on the condition, drained or undrained moduli may be determined.
3.2 Types of soil moduli
Soil moduli depend on stiffness. While the modulus is a soil property, stiffness is not a soil property
since it depends on the size of the loaded area (Briaud, 2000). This implies that for an elastic
material, the stiffness measured with one test will be different from the stiffness measured with
another test if the loading areas are different. However, the modulus obtained with each test will
be the same provided the state factors are the same.
The various types of soil moduli in relation to loading conditions are discussed by Duncan and
Bursey (2013) as:
i Young´s modulus (𝐸) is that determined by the ratio of change in axial stress to the change in
axial strain. This is defined for uniaxial loading conditions where the stress changes in only
one direction.
ii Shear modulus (𝐺) is the ratio of the change in shear stress to the change in shear strain for
pure shear loading.
iii Bulk modulus (𝐵) is the ratio of the change in the axial stress to the change in volumetric strain.
iv Constrained modulus (𝑀) is the ratio of change in axial stress to the change in axial strain for
condition where the strain in the horizontal direction is restricted
An important step in solving problems involving soil modulus is to clearly identify which modulus
is required for the analysis. This study is focused on constrained modulus obtained through
oedometer test as further discussed in section 3.3.
3.3 Determination of constrained modulus
Soil modulus is obtained by the ratio of change in applied stress to the change in respective strain.
For the loading condition where no strains are induced in the lateral direction, the determined
modulus is termed constrained modulus or one dimensional modulus, usually denoted by 𝑀. when
soil is axially loaded such as in a triaxial cell, the stress – strain curve plotted from the data is
normally non-liner. However, there are several ways of estimation the modulus from the non-linear
curve by considering the slope of a line through a point or a segment of the curve. Such procedure
result to one of the following moduli;
13
i The initial tangent modulus (𝑀𝑖) which is the slope of the stress – strain curve at the origin
ii The secant modulus (𝑀𝑠) which is the slope of a line between two points on stress – strain
curve
iii The tangent modulus (𝑀𝑡) which is the slope of stress – strain curve at some desired point
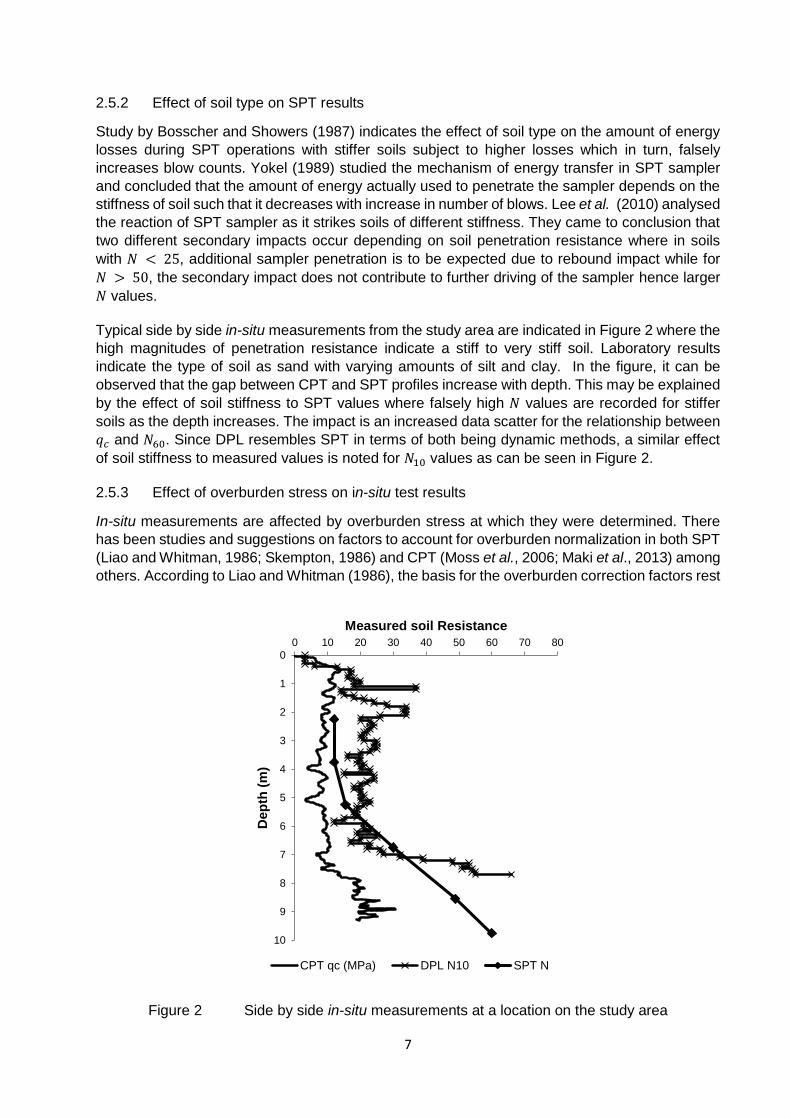
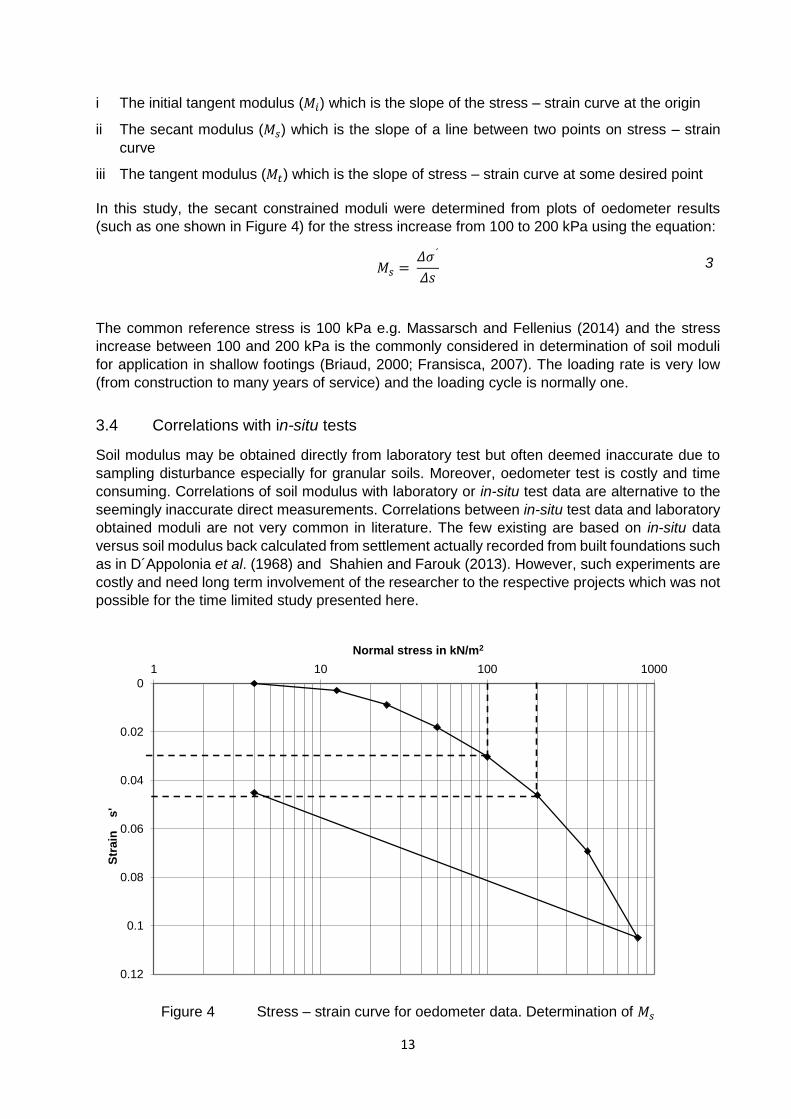
In this study, the secant constrained moduli were determined from plots of oedometer results
(such as one shown in Figure 4) for the stress increase from 100 to 200 kPa using the equation:
𝑀𝑠 = 𝛥𝜎´
𝛥𝑠 3
The common reference stress is 100 kPa e.g. Massarsch and Fellenius (2014) and the stress
increase between 100 and 200 kPa is the commonly considered in determination of soil moduli
for application in shallow footings (Briaud, 2000; Fransisca, 2007). The loading rate is very low
(from construction to many years of service) and the loading cycle is normally one.
3.4 Correlations with in-situ tests
Soil modulus may be obtained directly from laboratory test but often deemed inaccurate due to
sampling disturbance especially for granular soils. Moreover, oedometer test is costly and time
consuming. Correlations of soil modulus with laboratory or in-situ test data are alternative to the
seemingly inaccurate direct measurements. Correlations between in-situ test data and laboratory
obtained moduli are not very common in literature. The few existing are based on in-situ data
versus soil modulus back calculated from settlement actually recorded from built foundations such
as in D´Appolonia et al. (1968) and Shahien and Farouk (2013). However, such experiments are
costly and need long term involvement of the researcher to the respective projects which was not
possible for the time limited study presented here.
Figure 4 Stress – strain curve for oedometer data. Determination of 𝑀𝑠
0
0.02
0.04
0.06
0.08
0.1
0.12
1 10 100 1000
Str
ain
s'
Normal stress in kN/m2
14
The tangent constrained modulus obtained from one dimensional compression test has been
correlated with CPT. Kulhway and Mayne (1990) reports the general form of correlation as:
𝑀 = 𝛼𝑞𝑐 4
With values of 𝛼 related to the relative density of sand in calibration chamber studies and range
from 3 to 8 for normally consolidated sands and between 0.4 and 8 for cohesive soils. The
conditions for sands are drained tangential modulus while for cohesive soil, the reported values
are for drained secant moduli.
The constrained modulus for one dimensional compression test in clays has been correlated with
SPT 𝑁 values. Relationships are of the form presented by equation 5:
𝑀 = 𝑓𝑁 5
With 𝑓 related to 𝑃𝐼 of the soil. However, Kulhway and Mayne (1990) report such correlations to
be weak. A relationship between 𝑁 and 𝑀𝑠 from saturated and unsaturated soil is also found in
Fransisca (2007) where an exponential relationship was proposed between the data.
Probably the best in-situ test for determining constrained modulus is the dilatometer test. Study
by Iwasaki et al. (1991) indicated a good agreement between oedometer and dilatometer
constrained modulus for alluvial soils and this is particularly due to the nature of the in-situ test
itself being different from CPT or SPT (Marchetti, 2011).
15
Chapter 4 – Geotechnical uncertainties and their determination
5.1 Sources of uncertainties
Uncertainties in geotechnical engineering are a contribution from three major sources (Phoon et
al., 1995, Phoon and Kulhawy, 1999; Baker and Calle, 2006, Ching et al., 2010); natural inherent
variability, measurement errors and transformation uncertainties. The natural inherent variability
of a soil parameter is caused by the geological process of soil formation. Studies such as by Zhang
et al. (2008) indicate that even homogeneous soils in centrifuge tests may have significant
variability. Measurement error originate from systematic and random errors arising during testing,
including equipment errors, procedural - operator errors and random testing effects.
Transformation uncertainty are induced in the process of evaluating design parameters from
measured in-situ or laboratory values due to the uncertainty in the theoretical and empirical
transformation models. The importance of separating the components of uncertainties during
evaluation is explained by Phoon et al. (1995) as to allow their application in a wider general
conditions rather than being project specific.
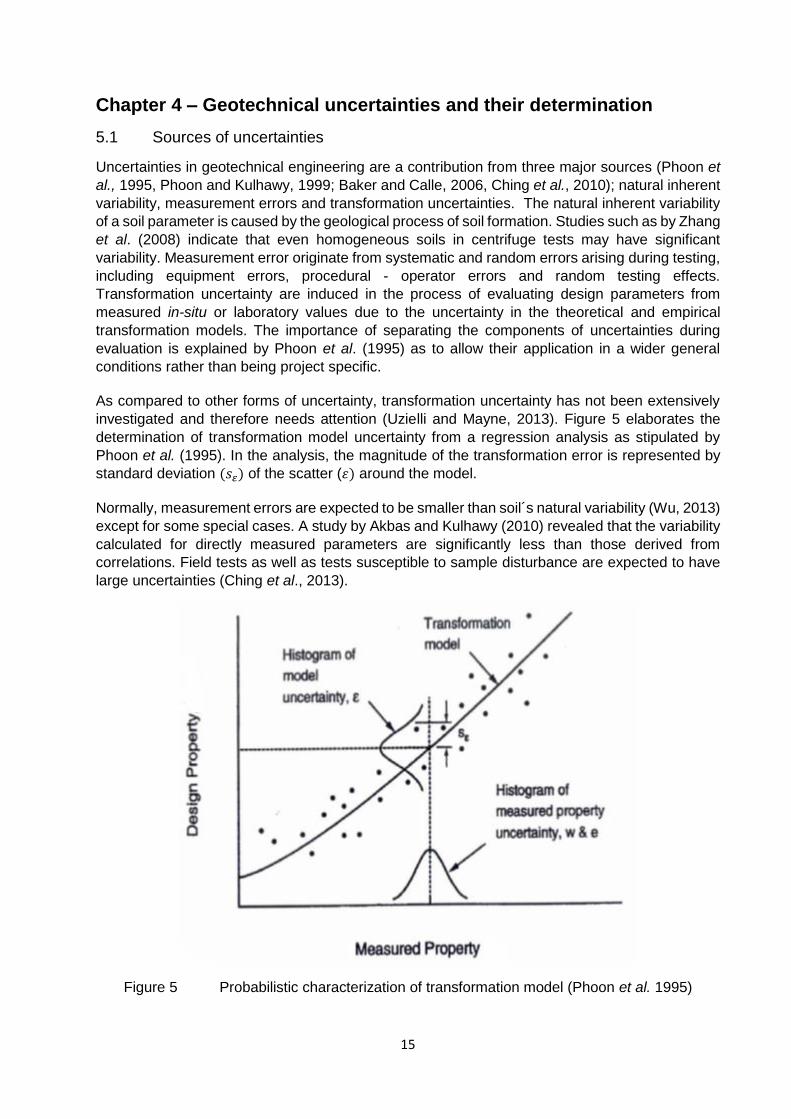
As compared to other forms of uncertainty, transformation uncertainty has not been extensively
investigated and therefore needs attention (Uzielli and Mayne, 2013). Figure 5 elaborates the
determination of transformation model uncertainty from a regression analysis as stipulated by
Phoon et al. (1995). In the analysis, the magnitude of the transformation error is represented by
standard deviation (𝑠𝜀) of the scatter (𝜀) around the model.
Normally, measurement errors are expected to be smaller than soil´s natural variability (Wu, 2013)
except for some special cases. A study by Akbas and Kulhawy (2010) revealed that the variability
calculated for directly measured parameters are significantly less than those derived from
correlations. Field tests as well as tests susceptible to sample disturbance are expected to have
large uncertainties (Ching et al., 2013).
Figure 5 Probabilistic characterization of transformation model (Phoon et al. 1995)
16
5.2 Evaluation of uncertainties
The observed soil property variability in spatial dimension suggests the resemblance to random
fields. Study by Baker (1984) gives an insight to modelling soil variability stochastically as random
fields. In this concept, the actual value of a soil property at each location within the unit is assumed
to be a realisation of a random variable. Nevertheless, it is important to note that the variation of
soil properties from one location to another is not random and properties at every location could
be known through testing. However, it is practically impossible to undertake such a volume of
investigation making it convenient to model spatial variation as random (Baecher, 1982). The two
parameters used to describe a random field are the coefficient of variation (𝐶𝑂𝑉) and the scale of
fluctuation (𝜃).
Application of random field theory require samples to be independent of their location. If this
condition is satisfied, data are said to be stationary. As described by Baker and Calle (2006),
stationarity (or homogeneity) in a strict sense means that the entire joint probability density
function of soil property values at an arbitrary number of locations within the soil unit is invariable.
A more relaxed criterion is that expected mean value and variance of the soil property is constant
throughout the soil unit and that the covariance of the soil property values at two locations is a
function of the separation distance between the locations only. Random fields satisfying only the
relaxed criteria are called stationary in a weak sense.
There are a number of methods available to assess stationarity of a data set, including
examination of histogram plots and Kendall´s Tau test. Removing trends with methods such as
regression analysis from original data modifies non stationary to stationary data (Campanella et
al. 1987). In the process, a line or curve of best fit is estimated with ordinary least squares and
then subtracted from the data. The residuals are then used for further analysis with random fields.
The type of trend removed has been found by Cafaro and Cherubini (2002) to affect the evaluated
uncertainty as they obtained different vertical scale of fluctuation respect to CPT data with
residues after quadratic and linear trend removal. The distinction between trend and stochastic
component is the modeller’s choice (Baecher, 1999) and the trends should be kept simple.
5.3 Variance reduction
The continuity and heterogeneity of soil mass supporting a foundation controls the performance
of the foundation making spatial variability of geotechnical performance of a structure be of
importance to determine. This and the fact that geotechnical parameters vary from site to site as
well as from layer to layer are the two major aspects that differentiate geotechnical reliability
analysis from structural reliability analysis (Honjo and Otake, 2013). Soil properties are rarely
modelled as particle properties. As such, all engineering characteristics of soils are properties of
a local average of a kind. Griffiths and Fenton (2007) identified the two main effects of local
averaging as to reduce the variance and to lessen the effect of contribution from the components
with high frequency. Vanmarcke (1977) proposed a method of reducing the variance of a local
average from the variance of a sampled random field by a pre-determined factor which depends
on the size of the local average and the scale of fluctuation.
The scale of fluctuation (𝜃) is defined as the distance within which soil property shows persistence
from point to point. Small values of 𝜃 implies a rapid variation about the mean. Several methods
are available for determination 𝜃 including use of autocorrelation functions, use of variograms or
the approximate method proposed by Vanmarcke (1977). Some researchers have reported the
dependence of 𝜃 on sampling domain (Fenton, 1999; Cafaro and Cherubini, 2002; Jones et al.,
2002) with larger values related to wider sampling intervals. Apart from the application in
determining variance reduction, 𝜃 values may be interpreted as the optimum sampling interval of
a given test method (Campanella et al. 1987).
17
The variance of an averaged soil property over a surface or volume is likely to be substantially
less than the field variance, which is mainly based on small sample tests or small affected volumes
in in-situ tests. In a known size of the failure domain, the variance of the average value is obtained
by reducing the variance of the measured parameter. Such a reduction can be mathematically
modelled using the random field model of Vanmarcke (1977), and can be expressed as:
𝑉𝑎𝑟(�̅�) = 𝛤2𝑉𝑎𝑟(𝑋) 6
where, 𝑋 is a random variable with the mean �̅�, 𝑉𝑎𝑟(∙) denotes the variance of a random variable,
and Γ2 is referred to as the variance reduction factor. The evaluation of Γ2 is in general
complicated. However, Vanmarcke (1977) proposed approximate solution presented as equation
7 as:
Γ2 =
𝜃
𝐿 for 𝐿 > 𝜃
Γ2 = 1.0 for 𝐿 ≤ 𝜃
7
where 𝐿 is the size of the failure domain.
5.4 Importance of quantifying uncertainties
The field of geotechnical engineering faces more uncertainty than any other field in civil
engineering (Bilgin and Mansour, 2013). In such situations, the application of reliability based
design becomes more beneficial than deterministic methods. In response, numerous studies have
been performed recently in the area of uncertainties and reliability based design. Assessment of
spatial variability of soils requires a very large amount of closely spaced and accurate data (Jaksa,
2013) which makes the CPT ideal for such purposes as it yields a large number of closely spaced
data within a short time and a small effort as compared to other tests such as the SPT. For this
reason, many studies have been performed in relation to CPT. It is high time to involve data from
other types of soil investigation methods in uncertainty studies to allow their application in reliability
based design problems. Phoon and Kulhway (1999) and Jones et al. (2002) reported that the
amount of information on scale of fluctuation of geotechnical parameter is limited in comparison
to the information on coefficient of variation. This observation is still valid today and more studies
should be conducted to fill this gape.
As stipulated by Phoon and Kulhawy (1999), the contribution to total variability of a design
parameter depends on the site conditions, degree of equipment and procedural control during
testing, and quality of the transformation model. In this particular study, the three in-situ methods
considered were able to predict the constrained modulus with similar magnitudes of total
variability. Data applied were from the same site hence same site conditions, a rather high degree
of control was exercised during testing with both methods and the same crew was involved.
Transformation models considered in this study were developed with data from the same site.
This explains the similar magnitude of total variability obtained in association with the methods.
18
Chapter 5 – Consequences of uncertainties
5.1 Importance of evaluating the consequences of uncertainties
Uncertainties in a designed system are directly related to the anticipated risks such that higher
uncertain components imply higher probability of occurrence of adverse effects. With proper
consideration of uncertainties, the safety of structures and hence their economy may be
evaluated. The analysis of safety is crucial to any design because too low safety standards may
result to losses of property and lives while too high safety standards results to overly expensive
systems. In the context of the current research, evaluated consequences of uncertainties are
intended for comparing effectiveness of different soil investigation methods.
Four different soil investigation methods have been applied to gather data for this research where
uncertainties have been quantified in association to each method. For the in-situ methods, the
uncertainties obtained are of similar order of magnitudes and different from those of laboratory
method. No conclusion can be drawn about the effectiveness of each method without determining
the effect that the uncertainties have to a designed system. The approach which will be adopted
in this study is to perform designs which incorporate the uncertainties and compare the reliability
instead of the uncertainties. Probabilistic design methods allow for inclusion of uncertainties and
therefore render themselves as perfect tools for evaluating the consequences.
5.2 Computation of failure probability
A successfully designed system must meet the two requirements of safety and economy. The
two extremes of an improper design are the economically unacceptable design and the failed
design. Taking the case of design of a shallow foundation as an example, an uneconomic design
would be when the provided size of the foundation is unnecessarily too big for the loads intended
to be carried and a failed foundation may be that which has settled in excess of the allowable
settlements. In this context, failure does not necessarily be catastrophic such as the collapse of
the building but is defined as performing below the acceptable standards.
The general definition of foundation failure is when the load (𝑄) that has to be supported, transmit
to the soil stresses higher than what the resistance (𝑅) is capable of offering. In other words,
failure is when 𝑄 > 𝑅 and the probability of failure (𝑝𝑓) is given by
𝑝𝑓 = 𝑒𝑣𝑒𝑛𝑡𝑠 𝑡ℎ𝑎𝑡 𝑄 > 𝑅
𝑡𝑜𝑡𝑎𝑙 𝑒𝑣𝑒𝑛𝑡𝑠 8
A robust and straightforward technique for obtaining the events in equation 8 and eventually
calculating 𝑝𝑓 is the Monte Carlo simulation method based on randomized input.
Through repeated execution of an existing deterministic process, Monte Carlo simulation method
offers the simulation of possible scenarios on an investigated effect, such as settlement values of
a footing according to the probability distributions of the random variables involved, and then infer
the probability of various events from the observed outcomes of all simulation runs. By setting a
desired limit, output variables may be divided into two sets representing success and failure,
hence the probability of failure may be calculated. The accuracy of Monte Carlo simulation results
depends on the number of performed simulations and the expected probability of failure. When
the probability of failure is very small, the number of simulations required to obtain an accurate
result becomes very large. According to Phoon (2008, p 6), the rule of thumb is to have number
of simulations 𝑛 = 10𝑝𝑓
⁄ to estimate 𝑝𝑓 within a 𝐶𝑂𝑉 of 0.30. But 𝑝𝑓 values cannot be known
before hand and therefore may be represented by some typical values, �̂�𝑓. For geotechnical
19
design problems, �̂�𝑓 values are usually smaller than 0.001 which implies that 𝑛 should be in order
of 10,000. A more general method of determining the minimum number of required simulation is
provided by Griffiths and Fenton (2007, p 18) as follows;
𝑛 = �̂�𝑓(1 − �̂�𝑓)
𝑆𝐷𝑝𝑓
2 9
where 𝑆𝐷�̂�𝑓
2 is the variance of the estimated �̂�𝑓
It is common to express reliability in the form of reliability index which is related to 𝑝𝑓. Both 𝑄 and
𝑅 are uncertain quantities, therefore the variables have means and variances. According to
Baecher and Christian (2003, p 304), a reliability index (𝛽) is defined in terms of the safety margin
(𝑆𝑀) according to equation 10 and it expresses the distance of the mean margin from its critical
value in units of standard deviation.
𝛽 = 𝜇𝑆𝑀
𝑆𝐷𝑆𝑀 10
in which 𝜇𝑆𝑀 and 𝑆𝐷𝑆𝑀 are the mean and standard deviation respectively for the margin of safety
which is obtained by the difference between 𝑅 and 𝑄 as expressed in equation 11.
𝑆𝑀 = 𝑅 − 𝑄 11
When 𝑅 and 𝑄 are normally distributed, 𝑆𝑀 is also normally distributed which makes 𝛽 a standard
normal variate (Baecher and Christian, 2003, p 305). In such case, 𝛽 and 𝑝𝑓 are related by
equation 12 as;
𝛽 = −Φ−1(𝑝𝑓) 12
in which Φ−1(∙) is the inverse standard normal cumulative function.
5.3 Input to the performance function
The traditional approach to dealing with uncertainties in geotechnical engineering is to express
the margin of safety in terms of a factor of safety (𝐹𝑠) as follows;
𝐹𝑠 =𝑅
𝑄 13
In foundation design problems for example, a global factor of safety usually between 2 and 3 is
applied to the resistance. Either 𝑆𝑀 in equation 11 or 𝐹𝑠 in equation 13 can describe the
performance of a geotechnical structure and they are called performance functions. Both 𝑅 and 𝑄
must be taken in broad definition that includes not only forces and stresses but also other
phenomena that may need to be considered in design such as, in this study, settlement.
For typical structures with isolated spread footings, a total foundation settlement of 25 mm is a
common design value resulting in acceptable differential settlements. The allowable load is then
defined as the load resulting in 25 mm of total settlement and may be considered as 𝑅 in equations
11 and 13. The variable 𝑄 will be the design load of the respective foundation. The problem can
be simplified by considering settlements instead of loads as inputs to equations 11 and 13. In this
case, 𝑅 will be the limit settlement of 25 mm and 𝑄 the calculated foundation settlement.
In the current study, the major input to the performance function is the settlements which may be
predicted by a number of existing methods in literature. Three methods have been chosen to
evaluate elastic settlements based on availability of data. The first method is that proposed by
20
D´Appolonia et al. (1968) which allows the use of soils´ constrained modulus. The second method
is that introduced by Schmertmann (1970) and later modified by Schmertmann et al. (1978). This
semi empirical method is intended for application of in-situ data, especially the CPT. The third
method that shall be considered is that developed by Burland and Burbidge (1985). The method
is one of the most comprehensive efforts in the area of in-situ methods application which basically
uses SPT data. Details and procedures of conducting the methods are not considered at this
stage.
5.4 Comparing probabilities of failure
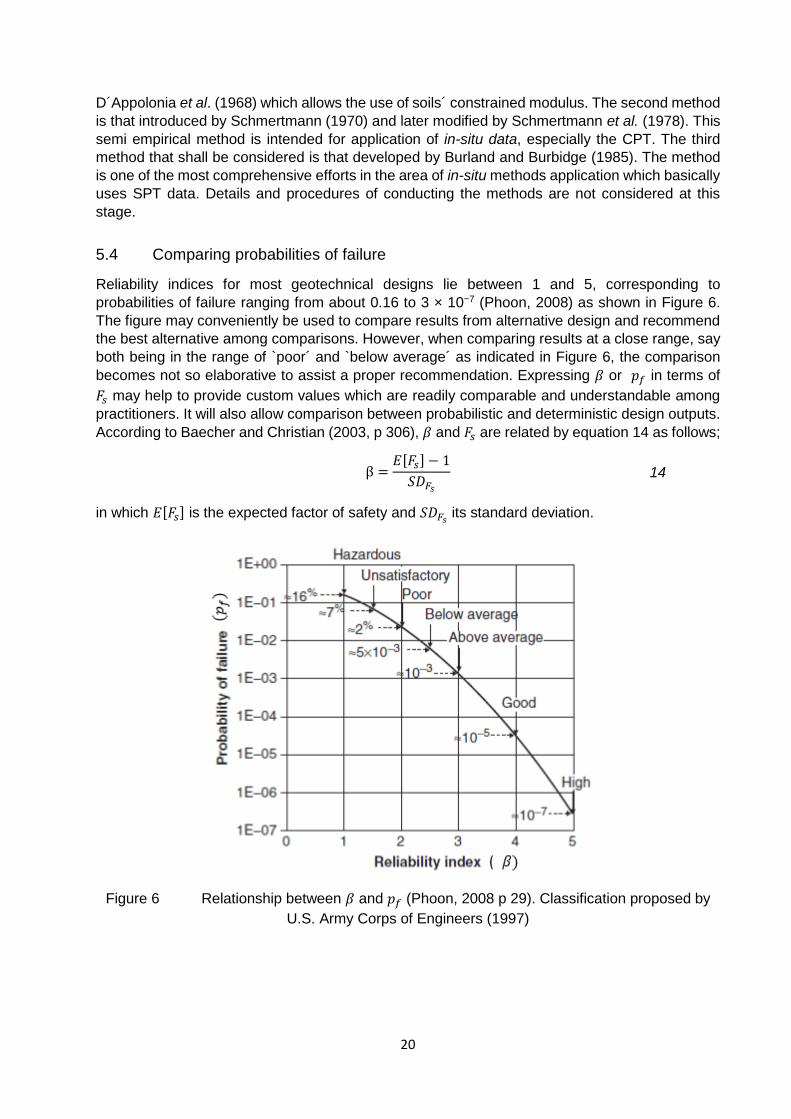
Reliability indices for most geotechnical designs lie between 1 and 5, corresponding to
probabilities of failure ranging from about 0.16 to 3 × 10⁻⁷ (Phoon, 2008) as shown in Figure 6.
The figure may conveniently be used to compare results from alternative design and recommend
the best alternative among comparisons. However, when comparing results at a close range, say
both being in the range of `poor´ and `below average´ as indicated in Figure 6, the comparison
becomes not so elaborative to assist a proper recommendation. Expressing 𝛽 or 𝑝𝑓 in terms of
𝐹𝑠 may help to provide custom values which are readily comparable and understandable among
practitioners. It will also allow comparison between probabilistic and deterministic design outputs.
According to Baecher and Christian (2003, p 306), 𝛽 and 𝐹𝑠 are related by equation 14 as follows;
β =𝐸[𝐹𝑠] − 1
𝑆𝐷𝐹𝑠
14
in which 𝐸[𝐹𝑠] is the expected factor of safety and 𝑆𝐷𝐹𝑠 its standard deviation.
Figure 6 Relationship between 𝛽 and 𝑝𝑓 (Phoon, 2008 p 29). Classification proposed by
U.S. Army Corps of Engineers (1997)
21
Chapter 6 – Summary of appended papers
This chapter provides a summary of papers that form the licentiate thesis.
6.1 Paper I
Correlations of SPT, CPT and DPL data for sandy soil in Tanzania
Mwajuma Ibrahim Lingwanda, Stefan Larsson and Dalmas L. Nyaoro
Submitted to Geotechnical and Geological Engineering in April 2014
This paper aims at extending the use of DPL data to analysis and design rather than just for site
stratification in Tanzania. Both being common in-situ methods around the world, there exist many
studies that empirically relate CPT and SPT data to soil design values. Unfortunately, the same
cannot be said to DPL hence limiting its application to mainly soil stratification. Correlations were
established between SPT, CPT and DPL data obtained from a research oriented site investigation
in a sandy soil. The type of geology where the data were collected dominates a significant portion
of Dar es Salaam city in Tanzania. The study is based on side by side data from 8 SPT boreholes,
8 CPT soundings and 8 DPL soundings conducted on a 30 m2 area. The distance between side
by side measurements is kept at a small radius of 0.5 m to minimize the effects of soil variability
to the correlations. Two methods were implemented in the process of establishing relationship
between the in-situ methods; the arithmetic average method and the linear regression method.
To improve the relationships between data, outliers were detected using the Tukey mean –
difference plots and filtered from the data sets. There is also a slight improvement of the
relationships when the cone resistance and sleeve friction components of soil resistance are
added together for establishing correlations between CPT and data from the other two in-situ
methods used in this study. The arithmetic mean method gave the following expressions;
𝑞𝑐𝑁60
⁄ = 0.37, (𝑞𝑐 + 𝑓𝑠)
𝑁60⁄ = 0.46 and
𝑁60𝑁10
⁄ ≈ 1. Through the linear regression method, the
following relationships have been obtained; 𝑞𝑐 = 0.15𝑁60 + 7.49, 𝑞𝑐 = 0.38𝑁10 + 1.57 and 𝑁60 =
1.01𝑁10 + 0.44. By examining the coefficients of correlation and the transformation uncertainties,
it was revealed that DPL data correlate with CPT data better than with SPT data which leads to
the suggestion that DPL data should be transformed to equivalent CPT rather than SPT when
such information is to be used for geotechnical analysis and design. Although CPT – SPT
correlations are common in literature, local correlations were established in this study and
compared to those existing in literature where they seem to be fairly comparable.
6.2 Paper II
Inherent soil variability linked to different characterization methods
Mwajuma Ibrahim Lingwanda, Stefan Larsson and Dalmas L. Nyaoro
Presented to Sida Annual Regional Conference, RegConf 2014(050) in July 2014
Evaluation of geotechnical uncertainties has been a subject of interest to the geotechnical
community where several studies have been performed recently under different conditions. This
study is limited to evaluation of inherent soil variability of a stiff sandy soil where three in-situ and
one laboratory method are involved in measuring soil response to loading. Actual field and lab
data were employed from a site investigation program where 8 CPT soundings, 8 DPL soundings,
8 SPT profiles and oedometer test of samples from 8 boreholes were involved in the analysis.
22
From the data, coefficient of variation of inherent soil variability was evaluated from each test
method. Trends were first removed from the original data to achieve weak stationarity condition
and the residue was further analysed to determine the standard deviation which was used to
determine coefficients of variation. In average the results indicate minimum variability from
laboratory oedometer test at average 𝐶𝑂𝑉 = 0.24, DPL and CPT are close at average 𝐶𝑂𝑉 = 0.32
and 𝐶𝑂𝑉 = 0.33 respectivelly. The SPT resulted to the highest variability of 𝐶𝑂𝑉 = 0.41 in
average. An important note is that in this study, due to the difficulty involved, measurement errors
were not separated from the inherent soil variability thus limiting the application of study findings.
However, the study indicates that DPL data can be trusted for design use just as the common
CPT and SPT due to similar magnitudes of total variability associated with the methods.
6.3 Paper III
Comparison of geotechnical uncertainties linked to different soil characterization
methods
Mwajuma Ibrahim Lingwanda, Anders Prästings, Stefan Larsson and Dalmas L. Nyaoro
Submitted to Geomechanics and Geoengineering: An International Journal in September 2014
In this paper, total uncertainties in determining soil constrained modulus in relation to CPT, DPL,
SPT and oedometer tests was evaluated and compared. Separate determination of inherent soil
variability and transformation uncertainties were conducted and summed. Measurement errors
were not separated from data used. The two random field parameters, the coefficient of variation
and scale of fluctuation were evaluated in horizontal and vertical directions. Results from different
methods of evaluating scale of fluctuation were also compared. Study data includes 29 CPT
soundings, 8 DPL soundings, 8 SPT profiles and 36 laboratory oedometer tests of samples from
8 boreholes. In order to demonstrate magnitudes of transformation errors, empirical correlations
were first established between the in-situ test data and the secant constrained moduli from
oedometer test as 𝑀𝑠 = 0.25𝑞𝑐 + 2.26 where 𝐶𝑂𝑉𝑡𝑟𝑎𝑛𝑠 = 0.28, 𝑀𝑠 = 0.14𝑁10 + 1.07 with
𝐶𝑂𝑉𝑡𝑟𝑎𝑛𝑠 = 0.26 and 𝑀𝑠 = 0.06𝑁60 + 3.04 with 𝐶𝑂𝑉𝑡𝑟𝑎𝑛𝑠 = 0.28. The total uncertainties for
determination of constrained modulus were found to be minimum for the direct measured values
with oedometer at 𝐶𝑂𝑉 = 0.24, CPT and DPL data resulted to similar magnitudes of total
uncertainties at 𝐶𝑂𝑉 = 0.46 and 0.42 respectively. SPT data resulted to the highest total
uncertainties at 𝐶𝑂𝑉 = 0.51. Using the simple approximate method for determination of scale of
fluctuation, 𝜃𝑣 = 3.3 𝑚 and 2.7 𝑚 in average for SPT and oedometer data respectively. For CPT
and DPL data, 𝜃𝑣 = 1.1 𝑚 and 1.0 𝑚 respectively by using the method of Bartlett’s limits. The
horizontal scale of fluctuation was also determined respect to each method. The general
observation with regard to vertical and horizontal scales of fluctuation is that the magnitudes
depend on interval of data measurement and that similar magnitudes of 𝜃𝑣 and 𝜃ℎ are to be
expected from the simple and sophisticated methods of calculations. This suggests that in case
of data limitations, reliable scale of fluctuation may be inferred from limited samples using the
simple approximate method.
23
Chapter 7 – Conclusions and recommendations
In many geotechnical studies, soils are grouped into two broad categories of clay and sands. The
study of intermediate soils also termed as non- text book soils (Mayne, 2006) is demanded. This
study was performed on clayey sand to silty sand soil in Tanzania. The studied soil dominates a
significant portion of the west part of Dar es Salaam city therefore the results may benefit much
of the area. Through the study presented in this thesis, the following have been achieved:
i Correlations between in-situ test data
Correlations have been established between SPT and DPL, SPT and CPT as well as between
CPT and DPL data where it was established that DPL – CPT correlation is better than DPL – SPT
hence the former is recommended for intermediate transformation of DPL data to design values.
Application of such transformation will extend the use of DPL data from soil stratification to
analysis and design of geotechnical structures especially shallow foundations. SPT – CPT
correlations are common in literature. However, this study has established correlations specific
for stiff, dry, clayey to silty sands. The correlations appear to agree with those proposed in
literature with slight differences. Researchers, e.g. Akbas and Kulhawy (2010) agree on
preference of local correlations over globalized ones. Ching and Phoon (2012) observed that site-
specific models are generally more precise than global models, although they can be significantly
biased when applied to another site. To avoid this bias, the developed correlations should be
applied with caution. In a wider picture, the correlations developed in this study are a framework
for future refinement.
ii Correlations between oedometer data an in-situ data
Within this limited data base, correlations have been established between in-situ tests (SPT, CPT
and DPL) and constrained modulus from oedometer test. These relationships have been found to
have similar data scatter and therefore similar transformation errors. This may mean that the tests
can predict the modulus with similar uncertainties. Considering that in-situ tests are far less
expensive as compared to laboratory methods, for example Nilsson (2013) reports a cost
comparison of one triaxial test equivalent to ten DPL tests, the correlations developed in this study,
if practically implemented may result to a significant reduction of the cost of geotechnical
investigation works in the Dar es Salaam and areas of similar geology.
iii Evaluation of geotechnical uncertainties
Natural inherent soil variability and transformation uncertainties were evaluated in relation to SPT,
CPT, DPL and oedometer tests. The total uncertainty was determined relative to each method
where it was revealed that SPT had the highest uncertainties although not far from CPT and DPL.
The oedometer test was associated to the least uncertainties in comparison to the in-situ tests.
The similar total uncertainty gives hope that even less developed methods such as the DPL are
capable of producing a good repeatability if they are carefully performed. Just how significant is
the difference in uncertainties evaluated with each method remains a question for further research.
A comparison of results from simple methods and sophisticated methods for determination of
scale of fluctuation revealed a consistence in the methods. This observation is also reported by
Vessia and Cherubini (2007) who obtained close results for scale of fluctuation determined by
Vanmarcke (1977) method and from autocorrelation method in a sandy deposit. This is important
for promoting the use of RBD in geotechnical problems because simplified methods are more
attractive to users.
The information obtained through this study may be applicable for projects under similar geologic
conditions or as prior information on a Bayesian updating type of analysis. The overall
achievement is that this study may lead to a more cost effective design of foundations.
24
References
Abou-matar, H. and Goble, G. G. 1997. SPT dynamic analysis and measurements. Journal of
geotechnical and geoenvironmental engineering, 123(10), 921-928.
Ahmadi, M. M. and Robertson, P. K. 2005. Thin layer effects on the CPT qc measurements.
Canadian Geotechnical Journal, 42, 1302 – 1317.
Ahmed, S. M., Agaiby, S. W. and Abdel-Rahman, A. H. 2014. A unified CPT–SPT correlation for
non-crushable and crushable cohesionless soils. Ain Shams Engineering Journal, 5(1), 63-73.
Akbas, S. O. and Kulhawy, F. H. 2010. Characterization and estimation of geotechnical variability
in Ankara Clay: a case history. Geotechnical and Geological Engineering, 28(5), 619-631.
Akca, N. 2003. Correlation of SPT–CPT data from the United Arab Emirates. Engineering geology,
67(3), 219-231.
Anagnostopolous, A., Koukis, G., Sabatakakis, N. and Tsiambaos, G. 2003. Empirical
Correlations of soil Parameters based on Cone Penetration Test (CPT) for Greek Soils.
Geotechnical and Geological Engineering, 21, (pp. 377 – 387).
Baecher, G. B. 1982. Simplified geotechnical data analysis. Proc., NATO Advanced Study Inst.
on Reliability Theory and Its Application in Struct. And Soil Mech., Martinus Nijhoff Publishers,
Bornholm, Denmark, 257-277
Baecher, G. B. 1999. Discussion of Inaccuracies associated with estimation of random
measurement errors by Mark B. Jaksa, Peter I. Brooker, and William S. Kaggwa. Geotechnical
and Geoenvironmental Engineering, 125(1), 79–81.
Baecher, G. B. and Christian, J. T. 2003. Reliability and Statistics in Geotechnical Engineering.
John Wiley and Sons, West Sussex.
Baker, J. and Calle, E. 2006. Joint Committee on Structural Safety (JCSS) Probabilistic Model
Code, Section 3.7: Soil Properties. Updated Version, August.
Baker, R. 1984. Modeling soil variability as a random field. Journal of the International Association
for Mathematical Geology, 16(5), 435-448.
Bilgin, Ö. and Mansour, E. 2013. Variability of Soil Properties and Reliability of Empirical
Equations on Soil Settlement Predictions. In Foundation Engineering in the Face of Uncertainty@
sHonoring Fred H. Kulhawy (pp. 298-307). ASCE.
Bosscher, P. J. and Showers, D. R. 1987. Effect of soil type on Standard Penetration Test input
energy. Journal of Geotechnical engineering, 113(4), 385-389.
Bozbey, I. and Togrol, E. 2010. Correlation of standard penetration test and pressuremeter data:
a case study from Istanbul, Turkey. Bulletin of engineering geology and the environment, 69(4),
505-515.
Briaud, J. L. 2000. Introduction to soil moduli. Spencer J. Buchanan Professor. Texas A and M
University.
Burland, J. B. and Burbidge, M. C., 1985. Settlement of Foundations on Sand and Gravel.
Proceedings of Institution of Civil Engineers, 7(Part 1), pp. 1325 - 1381.
Cafaro, F., & Cherubini, C. 2002. Large sample spacing in evaluation of vertical strength variability
of clayey soil. Journal of geotechnical and geoenvironmental engineering, 128(7), 558-568.
25
Campanella, R. G., Wickremesinghe, D. S. and Robertson, P. K. 1987. Statistical treatment of
cone penetrometer test data. In Proceedings of the 5th International Conference on Application
of Statistics and Probability, AA Balkema, Rotterdam, 1011-1019.
Chin, C. T., Duann, S. W. and Kao, T. C. 1990. SPT-CPT correlations for granular soils: Proc 1st
International Symposium on Penetration Testing, ISOPT-1, Orlando, 20–24 March 1988 V1,
P335–339. Rotterdam: AA Balkema, 1988. In International Journal of Rock Mechanics and Mining
Sciences & Geomechanics Abstracts (Vol. 27, No. 2, p. A91). Pergamon.
Ching, J. and Phoon, K. K. 2012. Establishment of generic transformations for geotechnical design
parameters. Structural Safety, 35, 52-62.
Ching, J. and Phoon, K.K. 2014. Transformation and correlations among some clay parameters –
The global database. Canadian Geotechnical Journal, 51(6), 663-685.
Ching, J., Phoon, K. K. and Chen, Y. C. 2010. Reducing shear strength uncertainties in clays by
multivariate correlations. Canadian Geotechnical Journal, 47(1), 16-33.
Ching, J., Phoon, K. K. and Lee, W. T. (2013). Second-moment characterization of undrained
shear strengths from different test procedures. In Foundation Engineering in the Face of
Uncertainty@ Honoring Fred H. Kulhawy, 308-320. ASCE.
D´Appolonia, D. J., D`Appolonia, E. E. and Brissette, R. F. 1968. Settlement of spread footings
on sand. Journal of Soil Mechanics & Foundations Div.
Daniel, C. R., Howie, J. A., and Sy, A. 2003. A method for correlating large penetration test (LPT)
to standard penetration test (SPT) blow counts. Canadian geotechnical journal, 40(1), 66-77.
Daniel, C. R., Howie, J. A., Jackson, R. S. and Walker, B. 2005. Review of standard penetration
test short rod corrections. Journal of geotechnical and geoenvironmental engineering, 131(4),
489-497.
Drumright, E. E., Pfingsten, C. W. and Lukas, R. G. 1996. Influence of hammer type on SPT
results. Journal of geotechnical engineering, 122(7), 598-599.
Duncan, J. M. and Bursey, A. 2013. Soil Modulus Correlations. In Foundation Engineering in the
Face of Uncertainty@ Honoring Fred H. Kulhawy (pp. 321-336). ASCE.
Edet, A. E., Oden, M. I., & Efretuei, O. E. 1994. Correlation between cone penetration resistance
and standard penetration in parts of the coastal plain sands, Southeastern Nigeria. Bulletin of the
International Association of Engineering Geology-Bulletin de l'Association Internationale de
Géologie de l'Ingénieur, 49(1), 41-45.
Elkateb, T. M. and Ali, H. E. 2010. CPT-SPT correlations for calcareous sand in the Persian Gulf
area. In 2nd International symposium on cone penetration testing, 9-11.
Fellenius, B. H. 2009. Basics of foundation design (electronic edition). [www.fellenius.net]
Fenton, G. A. 1999. Random field modeling of CPT data. Journal of Geotechnical and
Geoenvironmental Engineering, 125(6), 486-498.
Figueiredo, L. C., Cunha, R. P. and Conciani, W. 2013. An overview on existing dynamic cone
penetration test research related to the Central Area of Brazil. In Geotechnical and Geophysical
Site Characterization 4.
Francisca, F. M. 2007. Evaluating the constrained modulus and collapsibility of loess from
standard penetration test. International Journal of Geomechanics, 7(4), 307-310.
26
Griffiths, D. V. and Fenton, G. A. eds., 2007. Probabilistic Methods in Geotechnical Engineering.
New York: Springer Wien.
Honjo, Y. and Otake, Y. 2013. A Simple Method to Assess the Effects of Soil Spatial Variability
on the Performance of a Shallow Foundation. In Foundation Engineering in the Face of
Uncertainty@ sHonoring Fred H. Kulhawy (pp. 385-404). ASCE.
Iwasaki, K., Tsuchiya, H., Sakai, Y. and Yamamoto, Y. 1991. Applicability of the marchetti
dilatometer test to soft ground in Japan. Proc. GEOCOAST, 91.
Jaksa, M. B. 2013. Assessing Soil Correlation Distances and Fractal Behavior. In Foundation
Engineering in the Face of Uncertainty@ Honoring Fred H. Kulhawy (pp. 405-420). ASCE.
Jaksa, M.B., Kaggwa, W.S., Fenton, G.A., and Poulos, H.G. (2003), A framework for quantifying
the reliability of geotechnical investigations, 9th International Conference on the Application of
Statistics and Probability in Civil Engineering, pp1285-129
Jefferies, M. G. and Davies, M. P. 1993. Use of CPTu to estimate equivalent SPT N60. ASTM
geotechnical testing journal, 16(4), 458-468.
Jones, A. L., Kramer, S. L. and Arduino, P. 2002. Estimation of uncertainty in geotechnical
properties for performance-based earthquake engineering. Pacific Earthquake Engineering
Research Center, College of Engineering, University of California.
Kara, O. and Gündüz, Z. 2010. Correlation between CPT and SPT in Adapazari, Turkey. In Proc.,
Second International Symposium on Cone Penetration Testing, Huntington Beach, USA (pp. 9-
11).
Kasim, A. G., Chu, M. Y. and Jensen, C. N. 1986. Field correlation of cone and standard
penetration tests. Journal of geotechnical engineering, 112(3), 368-372.
Kim, K., Prezzi, M., Salgado, R. and Lee, W. 2008. Effect of penetration rate on cone penetration
resistance in saturated clayey soils. Journal of geotechnical and geoenvironmental engineering,
134(8), 1142-1153.
Kulhawy F. and Mayne, P. 1990. Manual on estimating soil properties for foundation design. EPRI,
Hillview, California
Lee, C., Lee, J. S., An, S. and Lee, W. 2010. Effect of secondary impacts on SPT rod energy and
sampler penetration. Journal of geotechnical and geoenvironmental engineering, 136(3), 522-
526.
Liao, S. S., and Whitman, R. V. 1986. Overburden correction factors for SPT in sand. Journal of
Geotechnical Engineering, 112(3), 373-377.
Lunne, T., Robertson, P. K. and Powell, J. J. M. 1997. Cone penetration testing in geotechnical
practice. New York
Maki, P. I., Boulanger, R. W., DeJong, J. T. and Jaeger, R. A. 2013. State – Based Overburden
Normalization of Cone Penetration resistance in clean sand. Journal of geotechnical and
geoenvironmental engineering, 140 (2).
Marchetti, S. 2011. Discussion of “CPT-DMT Correlations” by PK Robertson. Journal of
Geotechnical and Geoenvironmental Engineering, 137(4), 441-442.
Massarsch, K. R. 2014. Cone penetration testing- A historic perspective. Proceedings of 3rd
International Symposium of Cone Penetration Testing, CPT14. Edited by P.K Robertson and K.
L. Cabal, May 13 – 14, 2014, Las Vegas, Nevada, USA, 1187 – 1200.
27
Massarsch, K. R. and Fellenius, B. H. 2014. Use of CPT for design, monitoring, and performance
verification of compaction projects. Proceedings of 3rd International Symposium of Cone
Penetration Testing, CPT14. Edited by P.K Robertson and K. L. Cabal, May 13 – 14, 2014, Las
Vegas, Nevada, USA, 97 – 134.
Mayne, P. W. 2006. In-situ test calibrations for evaluating soil parameters. In Characterization and
Engineering Properties of Natural Soils II (Proc. Singapore Workshop).
Morgano, C. M. and Liang, R. 1992. Energy transfer in SPT-Rod length effect. In Proceedings of
the fourth International Conference on the Application of Stress-Wave Theory to Piles (Vol. 1, pp.
121-127).
Moss, R. I. S., Seed, R. B. and Olsen, R. S. 2006. Normalizing the CPT for Overburden Stress.
Journal of geotechnical and geoenvironmental engineering
Nilsson, T. U. 2013. Shear resistance by the DPL Nilsson test. Geotechnical and Geophysical Site
Characterization 4, Porto de Galinhas.
Orchant, C.J., Kulhawy, F.H., Trautman, C.H., 1988. Critical evaluation of in-situ test methods and
their variability. Electric Power Research Institute, Palo Alto, CA, USA, Report EL-5507 2:3-1 – 4-
70.
Parsons, R. L. and Frost, J. D. 2002. Evaluating site investigation quality using GIS and
geostatistics. Journal of geotechnical and geoenvironmental engineering, 128(6), 451-461.
Phoon, K. K. and Kulhawy, H., 1999. Characterization of geotechnical variability, Canadian
geotechnical Journal, 36, 612 – 624
Phoon, K. K. ed., 2008. Reliability - Based Design in Geotechnical Engineering: Computations
and Applications. New York: Taylor & Francis.
Phoon, K. K., Kulhawy, F. H. and Grigoriu, M. D. 1995. Reliability based design of foundations for
transmission line structures. Electric Power Research Institute, Palo Alto, Report TR-105000.
Robertson, P. K. 2010. Soil behaviour type from the CPT: an update. In 2nd International
Symposium on Cone Penetration Testing.
Robertson, P. K., 2011. Remark: How accurate is the CPT? www.cpt-robertson.com [1st January
2014].
Robertson, P. K., 2012. Interpretation of in-situ tests – some insights. Mitchell Lecture- ISC 4,
Brazil
Robertson, P. K., Campanella, R. G. and Wightman, A. 1983. Spt-Cpt Correlations. Journal of
Geotechnical Engineering, 109(11), 1449-1459.
Rogers, J. D. 2006. Subsurface exploration using the standard penetration test and the cone
penetrometer test. Environmental & Engineering Geoscience, 12(2), 161-179.
Schmertmann, J. H. 1978. Guidelines for cone penetration test. (performance and design) (No.
FHWA-TS-78-209 Final Rpt.).
Schmertmann, J. H. 1979. Statics of SPT. Journal of the Geotechnical Engineering Division,
105(5), 655-670.
Schmertmann, J. H. and Palacios, A. 1979. Energy dynamics of SPT. Journal of the Geotechnical
Engineering Division, 105(8), 909-926.
28
Schmertmann, J. H., 1970. Static Cone to compute Static Settlement over Sand. Journal of the
Soil Mechanics and Foundation Division, 96(SM3), pp. 1011-1043.
Schmertmann, J. H., Hartman, J. P. and Brown, P. R., 1978. Improved Strain Influence Factor
Diagrams. Journal of the Geotechnical Engineering Division, 104(GT8), pp. 1131-1135.
Shahien, M. M. and Farouk, A. 2013. Estimation of deformation modulus of gravelly soils using
dynamic cone penetration tests. Ain Shams Engineering Journal, 4(4), 633-640.
Skempton, A. W. 1986. Standard penetration test procedures and the effects in sands of
overburden pressure, relative density, particle size, ageing and overconsolidation. Geotechnique,
36(3), 425-447.
Spagnoli, G. (2007). An empirical correlation between different dynamic penetrometers. Electronic
Journal of Geotechnical Engineering (EJGE), 13(C).
Steffanoff, G., Sanglerat, G., Bergdahl, U. and Melzer, K .J. 1988. Dynamic Probing: International
reference test procedure. Proceedings of the 1st International symposium on penetration testing,
Vol. 1 pp 53 – 70, Orlando
Temple, M. W. B and Stukhart, G. 1987. Cost effectiveness of Geotechnical Investigations,
Journal of Management in Engineering, Vol.3, No1
U.S. Army Corps of Engineers, 1997. Engineering and design: introduction to probability and
reliability methods for use in geotechnical engineering. Technical Letter No. 1110-2-547,
Department of the Army, Washington, D. C.
Uzielli, M., and Mayne, P. W. 2013. Bayesian Characterization of Transformation Uncertainty for
Strength and Stiffness of Sands. In Foundation Engineering in the Face of Uncertainty@ Honoring
Fred H. Kulhawy (pp. 368-384). ASCE.
Vanmarcke, E. H., 1977, Probabilistic modeling of soil profiles, Journal of the Geotechnical
engineering Division, ASCE, 103(GT11), pp 1227 – 1246.
Vessia, G. and Cherubini, C. 2007. Penetration test measures for mechanical characterization of
sandy deposits at Scanzano Jonico: geostatistical methods for variability interpretation. In
Proceedings of the First International Symposium on Geotechnical Safety & Risk. Shanghai:
Tongji University, 227-238.
Wu, T. H. 2013. Geotechnical Uncertainties and Reliability Based Design. In Foundation
Engineering in the Face of Uncertainty@ Honoring Fred H. Kulhawy (pp. 271-282). ASCE.
Yokel, F. Y. 1989. Energy transfer mechanism in SPT. Journal of Geotechnical Engineering,
115(9), 1331-1336.
Youd, T. L., Bartholomew, H. W. and Steidl, J. H. 2008. SPT hammer energy ratio versus drop
height. Journal of geotechnical and geoenvironmental engineering, 134(3), 397-400.
Zhang, L. L., Zhang, L. M. and Tang, W. H. 2008. Similarity of soil variability in centrifuge models.
Canadian Geotechnical Journal, 45(8), 1118-1129.

29
Appended Papers