Embed Size (px)
Citation preview
In-situ MnO2 Electrodeposition and its Negative Impact
to Rechargeable Zinc Manganese Dioxide Batteries
by
Rui Lin Liang
A thesis
presented to the University Of Waterloo
in fulfilment of the
thesis requirements for the degree of
Master of Applied Science
in
Chemical Engineering (Nanotechnology)
Waterloo, Ontario, Canada 2018
© Rui Lin Liang 2018

ii
Author’s Declaration
I hereby declare that I am the sole author of this thesis. This is a true copy of the thesis,
including any required final revisions, as accepted by my examiners.
I understand that my thesis may be made electronically available to the public.
iii
Abstract
Achieving high rechargeability with the economically feasible and
environmentally friendly Zn-MnO2 batteries has been the goal of many scientists in the
past half century. Recently, the stability of the system saw a significant improvement
through adaptation of mildly acidic electrolyte with Mn2+
additives that prevent
dissolution of the active cathode materials, MnO2. With the new design strategy,
breakthroughs were made with the battery life span, as the lab scale batteries operated
with minimal degradation for over a thousand cycles of charge and discharge at high C-
rate ( >5C ) cycling. However, low C-rate operation of these batteries is still limited to
100 cycles, but has not been a focal point of the research efforts. Furthermore, the
electrochemical reactions within the battery system are still under debate and many
questions remain to be answered.
An interesting phenomenon investigated in this thesis about the mildly acidic Zn-
MnO2 battery systems is their tendency to experience capacity growth caused by
formation of new active material through Mn2+
electrodeposition. The deposition reaction
is thermodynamic favored within the battery operating voltage window and is considered
by some as beneficial for battery performance. This general belief is challenged by the
investigations and experimentations in this thesis, as results indicate the MnO2
polymorph generated are not ideal for long term cycling and would eventually lead to
formation of electrochemically inactive Mn species. Uncontrolled, continuous occurrence
of the reaction would also leads to Mn2+
ion depletion and uplifting of the protection they
provide. The electrodeposition is therefore relabelled as a gateway that allows undesired
reaction to occurred within Zn-MnO2 batteries; a long term crystal transaction
mechanism of the active cathode material was also formulated based on the post cycling
characterizations of the electrodes.
With the newly developed recognition of the battery stability issues, a design
strategy focused on suppressing MnO2 electrodeposition through manipulating the
reaction kinetic is proposed. The effectiveness of the strategy was showcased by cathode
electrodes incorporated with expanded graphite, a hydrophobic substrate material
discovered to be non-ideal for MnO2 electrodeposition. The resulting polymer-free

iv
electrode exhibit much improved low C-rate cycling stability of over 300 cycles with
minimal capacity decay and rate performances that are comparable to state-of-the-art Zn-
MnO2 battery cathode electrodes. These significant electrochemical performance
improvements validate the effectiveness of the strategy, and it is intended to be a key
concept that would serve as an important stepping stone for further optimization of the
Zn-MnO2 battery system.

v
Acknowledgement
I would like to take the opportunity to send my most sincere appreciation to
Professor Zhongwei Chen for providing me with the chances and resources to conduct
my experiments. I would also like to sincerely thank Dr. Jing Fu, Dr. Gregory Lui, Post-
Doctoral Fellow Dr. Yuanli Ding and Dr. Gaopeng Jiang for their generous guidance on
my research project and safety management work. Furthermore, I would like to send my
gratitude and best wishes to my groupmates Maiwen Zhang, Yaping Deng, Dan Luo, Dr.
Wen Lei, Dr. Yi Jiang, Dr. Jie Ying, Dr. Yang Wang, Justin Raimbault, Abel Sy, Jing
Zhang and Pan Xu. Last but not least, I would like to thank my parents, family members
and friends for their continuous support to my pursue in the field of scientific and
engineering research.
vi
Table of Content
Author’s Declaration ........................................................................................................... ii
Abstract .............................................................................................................................. iii
Acknowledgement .............................................................................................................. v
Table of Content ................................................................................................................ vi
List of Figure...................................................................................................................... ix
List of Tables .................................................................................................................... xii
List of Abbreviations ....................................................................................................... xiii
1 Introduction ................................................................................................................. 1
1.1 Batteries and Renewable Energy.......................................................................... 1
1.2 Rechargeable Batteries and Zinc Batteries........................................................... 2
1.3 Manganese Dioxide Cathode ............................................................................... 5
1.4 Alkaline Zn-MnO2 Batteries ................................................................................ 8
1.4.1 Primary Alkaline Zn-MnO2 Batteries ........................................................... 8
1.4.2 Rechargeable Alkaline Zn-MnO2 Batteries ................................................ 11
1.5 Rechargeable Mildly Acidic Zn-MnO2 Batteries ............................................... 13
1.6 Research Objective ............................................................................................. 16
1.7 Organization of Thesis ....................................................................................... 16
2 Chemicals and Characterization Techniques ............................................................ 18
2.1 Materials ............................................................................................................. 18
2.2 Physical Characterization ................................................................................... 19
2.2.1 Scanning Electron Microscopy ................................................................... 19
2.2.2 Transmission Electron Microscopy ............................................................ 20
2.2.3 Energy-Dispersive X-ray Spectroscopy ...................................................... 20
2.2.4 X-Ray Diffraction Analysis ........................................................................ 21
vii
2.2.5 X-Ray Photoelectron Spectroscopy ............................................................ 22
2.2.6 Raman Spectroscopy ................................................................................... 22
2.2.7 Inductively Coupled Plasma Atomic Emission Spectroscopy .................... 23
2.3 Electrochemical Characterization ...................................................................... 24
2.3.1 Galvanostatic Discharge/Cycling................................................................ 24
2.3.2 Cyclic Voltammetry .................................................................................... 25
3 Investigation of Manganese Dioxide Electrodeposition in Rechargeable Mildly
Acidic Zn-MnO2 Batteries ................................................................................................ 26
3.1 Introduction ........................................................................................................ 26
3.2 Experimental Methods ....................................................................................... 27
3.2.1 Synthesis of α-Manganese Dioxide ............................................................ 27
3.2.2 Preparation of Manganese Dioxide Electrode ............................................ 27
3.2.3 Preparation of Polymer-free/Self-standing Manganese Dioxide electrode 28
3.3 Results and Discussions ..................................................................................... 28
3.3.1 Characterization and Electrochemical Analysis of α-MnO2 ....................... 28
3.3.2 Investigation of In-situ Manganese Oxide Electrodeposition ..................... 35
3.3.3 Transformation Mechanism of Pristine and Electrodeposited MnO2 ......... 42
4 Suppressing Manganese Dioxide Deposition with Expanded Graphite for High
Performance Zn-MnO2 Batteries ...................................................................................... 52
4.1 Introduction ........................................................................................................ 52
4.2 Experiment Procedures ...................................................................................... 53
4.2.1 Preparation of Expanded Graphite .............................................................. 53
4.2.2 Preparation of Polymer-free Manganese Dioxide/Expanded Graphite/
Carbon Nanotube Electrode ...................................................................................... 54
4.3 Results and Discussions ..................................................................................... 54

viii
4.3.1 Adaptation of Expanded Graphite and Optimization of Cathode Electrode
for High Performance Zn-MnO2 Batteries ................................................................ 54
5 Conclusions and Suggestions .................................................................................... 63
6 Reference .................................................................................................................. 64
7 Appendix ................................................................................................................... 70
7.1 Appendix A: Calculation of Manganese Ion Oxidation Potential ...................... 70
ix
List of Figure
Figure 1.1 World energy contribution of different energy sources in 2005, 2010 and 2015
............................................................................................................................................. 1
Figure 1.2 Market prices of a) cobalt, b) lithium carbonate and c) lithium hydroxide ....... 3
Figure 1.3 Ball and stick representation of MnO2 octahedron unit cell .............................. 5
Figure 1.4 Diagram representations of different MnO2 crystal structures .......................... 6
Figure 1.5 Compositional diagrams of a) cylindrical and b) button alkaline Zn-MnO2
batteries ............................................................................................................................. 10
Figure 1.6 The Pourbaix diagram of a) manganese and b) zinc at 25 ºC.......................... 13
Figure 2.1 Sample illustration of the general coin cell assembly ..................................... 24
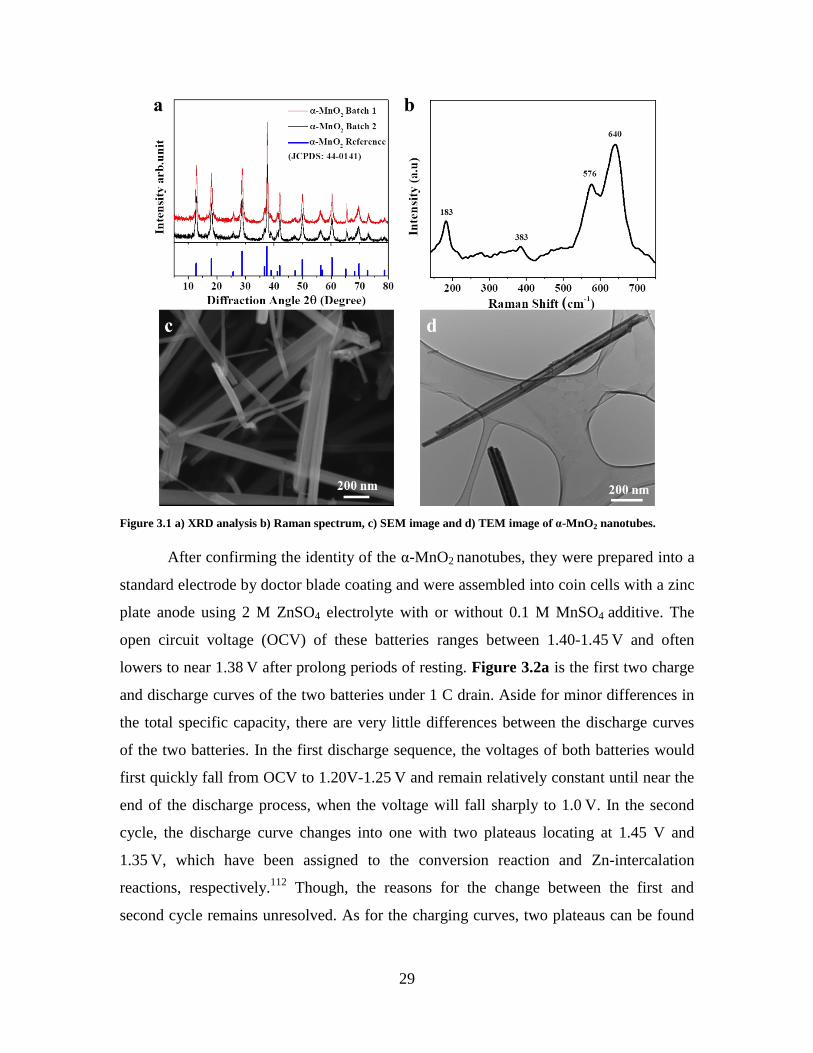
Figure 3.1 a) XRD analysis b) Raman spectrum, c) SEM image and d) TEM image of α-
MnO2 nanotubes................................................................................................................ 29
Figure 3.2 a) Galvanostatic charge and discharge curves in the first two cycles and b)
specific capacity profile at 1C of the Zn/α-MnO2 batteries with and without 0.1 M
MnSO4............................................................................................................................... 30
Figure 3.3 a) SEM images of standard α-MnO2 electrode before and b) after cycling. ... 31
Figure 3.4 a) SEM cross section image of the cycled α-MnO2 electrode and b, c)
corresponding SEM and EDX analysis of an area in the cross section of the cycled α-
MnO2 electrode. ................................................................................................................ 31
Figure 3.5 a) Specific capacity profiles of the RMAZM batteries with different cycling
protocols, b) different amount of electrolyte and c) different MnSO4 concentration. d)
Galvanostatic discharge curves of RMAZM batteries using 0.5M MnSO4 additives at
different cycles. ................................................................................................................. 32
Figure 3.6 a) Diagram illustration of the graphite/Zn wet cell b) capacity and Mn
concentration vs. cycle number graph of the graphite/Zn wet cell ................................... 34
Figure 3.7 a) Photo of the CNT and b) MC thin film seperator-assembilitie. c) d) Photos
of the self-standing MC electrode. .................................................................................... 35
Figure 3.8 a) Discharge capacity profiles and b) Galvanostatic charge/discharge curves at
1st, 2
nd and 50
th cycles of MC and CNT electrodes. .......................................................... 36
x
Figure 3.9 a) SEM image of the surface of the MC electrode before and b) after cycling, c)
SEM image of the surface of the MC electrode before and d) after cycling, e) TEM
images of MnOx nanosheets from MC and f) CNT electrodes. ........................................ 37
Figure 3.10 a) XRD spectra of CNT electrode and b) MC electrode at their initial, peak
capacity and degraded states. ............................................................................................ 38
Figure 3.11 a) XPS scan survey of the cycled CNT electrode b) Mn 2p c) Mn 3s and d)
O1s spectra of the cycled CNT and pristine MC electrode. ............................................. 40
Figure 3.12 a) SEM image and b) XRD spectrum of MnO2 electrodeposited onto the
CNT electrode surface by 48 hrs of 1.8V constant voltage hold ...................................... 42
Figure 3.13 a) Galvanostatic charge/discharge voltage vs time curves and b, c)
corresponding XRD patterns of the CNT electrode with electrodeposited ε-MnO2 at
different state of charge and discharge. ............................................................................ 43
Figure 3.14 a) Galvanostatic charge/discharge voltage vs time curves and b, c)
corresponding XRD patterns of the α-MnO2 MC electrode at different state of charge and
discharge. .......................................................................................................................... 45
Figure 3.15 The HRTEM images of a) α-MnO2 nanorod, b) electrodeposited MnO2
nanosheets and c) intersection of a nanorod and nearby nanosheets. The insect images are
the FFT and Inverse FFT of the selected areas. ................................................................ 48
Figure 3.16 a) 1st, 2
nd and 3
rd Galnostatic discharge curves of RMAZM batteries using
2M MnSO4 or 2M ZnSO4 + 0.1M MnSO4 electrolyte. b) XRD diffraction patterns of MC
electrode in RMAZM batteries discharged to 1.0V with 2M MnSO4 .............................. 49
Figure 3.17 Schematic illustration of the long term crystal transformation of α-MnO2
within RMAZM batteries that adapted Mn ion additives. ................................................ 50
Figure 4.1 SEM images of the a) as-prepared and b) sonicated thermal shock expanded
graphite ............................................................................................................................. 55
Figure 4.2 a) Standard Galvanostatic charge and discharge curves and b) specific capacity
profile of ME electrode. c) Discharge capacity profiles of pure CNT and EG electrodes 57
Figure 4.3 a) Surface and b) cross section SEM images of the MEC electrode ............... 57
Figure 4.4 a) CV scans, b) 1C Galvanostatic cycling performance, c & d) rate
performance, and e) 5C Galvanostatic cycling performance of RMAZM batteries
prepared with MEC electrode. .......................................................................................... 59
xi
Figure 4.5 a, b) SEM surface image of the MEC electrode after Galvanostatic cycling, c,
d) SEM surface image of the MEC electrode after 48hrs of 1.8V constant voltage hold. 61
Figure 4.6 a) XRD spectra of the MEC electrodes and b) HRTEM image of the MEC
electrode after 500 cycles of Galvanonstaic charge and dishcarge. .................................. 61

xii
List of Tables
Table 1 Performance of zinc batteries in recent publications ............................................. 4
Table 2 Low current cycling of RMAZM batteries in recent publications....................... 15
Table 3 List of Chemicals ................................................................................................. 18
xiii
List of Abbreviations
Abbreviations Intended Word/Phrases
CNT Carbon Nanotube
CV Cyclic Voltammetry
DOD Depth of Discharge
DDI Distilled Deionized
EDX Energy Dispersive X-ray Spectroscopy
EG Expanded Graphite
EIS Electrochemical Impedance Spectroscopy
EMD Electrolytic Manganese Dioxide
EtOH Ethanol
ICP-OES Inductively Coupled Plasma Optical Emission Spectrometry
H2O Water
KMnO4 Potassium Permanganate
KOH Potassium Hydroxide
MC MnO2 + CNT
MEC MnO2 + EG + CNT
MnO2 Manganese Dioxide
MnSO4 Manganese Sulfate
NiMH Nickel Metal Hydride
OCV Open Circuit Voltage
RAM Rechargeable Alkaline Manganese
SEM Scanning Electron Microscopy
TEM Transmission Electron Microscopy
XPS X-Ray Photoelectron Spectroscopy
XRD X-Ray Diffraction
Zn Zinc
ZnSO4 Zinc Sulfate
1
1 Introduction
1.1 Batteries and Renewable Energy
Batteries are a type of electrochemical energy storage system that convert
chemical energy to electrical energy.1 They are portable, reliable and convenient to use;
they are also essential to many electronic devices that many rely upon in their daily life.
In recent years, the demands for batteries with higher energy density and longer cycle life
have been rising.1 Some of these pressures are from the increasing performance
requirement of newly developed technologies, and others are from the urgency of
accelerating the adaptation of renewable energies into the current energy system to
combat climate change and reduce fossil fuel reliance.
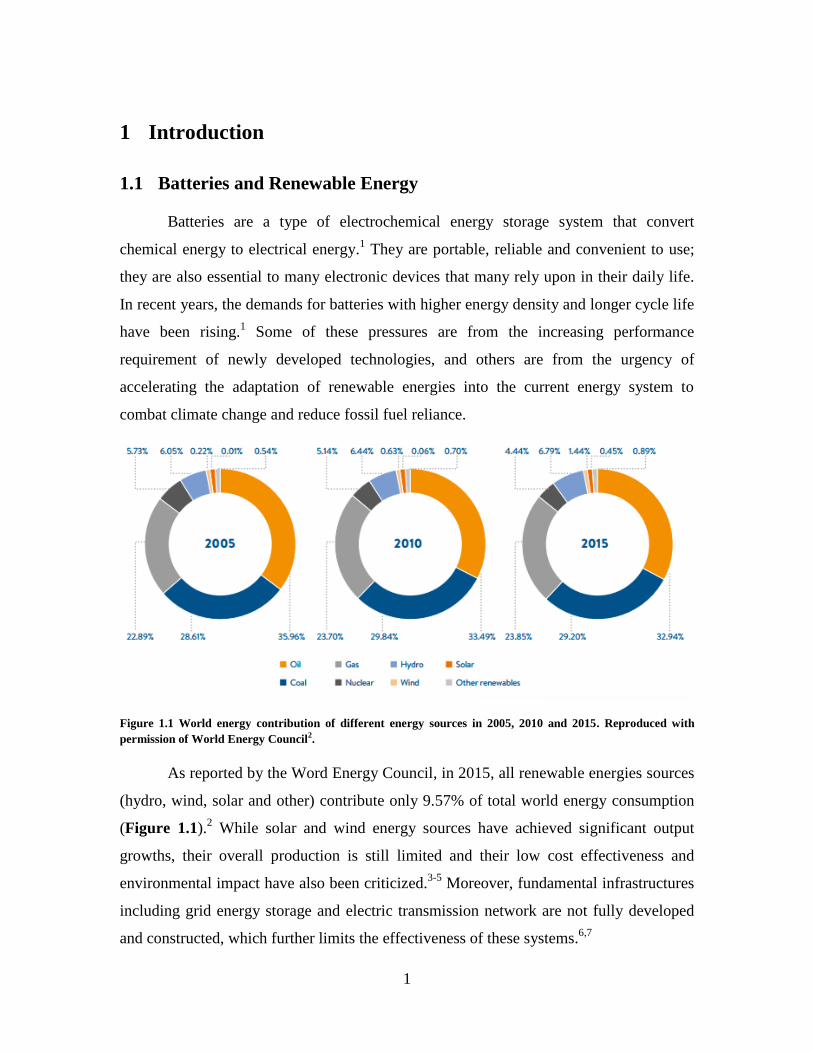
Figure 1.1 World energy contribution of different energy sources in 2005, 2010 and 2015. Reproduced with
permission of World Energy Council2.
As reported by the Word Energy Council, in 2015, all renewable energies sources
(hydro, wind, solar and other) contribute only 9.57% of total world energy consumption
(Figure 1.1).2 While solar and wind energy sources have achieved significant output
growths, their overall production is still limited and their low cost effectiveness and
environmental impact have also been criticized.3-5
Moreover, fundamental infrastructures
including grid energy storage and electric transmission network are not fully developed
and constructed, which further limits the effectiveness of these systems.6,7
2
Rechargeable batteries play an important role in continuing the advancement and
electric grid integration of renewable energies. A well-known disadvantage of renewable
energies is their output fluctuation, which brings difficulties in balancing the supply and
demand of electricity, and often leads to wasted energy.4 Their tendency of generating
large portion of their overall production during low demand hours also adds complexity
to the process. Currently, these issues are addressed by large, centralized energy storage
systems such as hydroelectric pump and compressed air storage.8 However, these systems
would struggle to support the infiltration of renewable energy sectors, and the flexibility
and compactness offered by rechargeable batteries will become more and more valuable.8
Hence, the development of long lasting, cheap, safe, and environmentally benign
rechargeable batteries are necessary for maintaining the prosperity of the human society.
1.2 Rechargeable Batteries and Zinc Batteries
Lithium-ion batteries are one of if not the most successful rechargeable batteries
in the twentieth century. Their high energy density and decent life cycles are ideal for
energy storage system.1 However, lithium-ion batteries are prone to thermal runaway and
have caused numerous fire/explosion incidents.9 Accidental releases of volatile, toxic or
corrosive chemicals within the batteries, such as 1,2-dimethoxyethane (DME), diethyl
carbonate (DEC), lithium hexafluorophosphate (LiPF6) salt, cobalt and nickel containing
oxides are also possible health hazards that can cause great harm.10,11
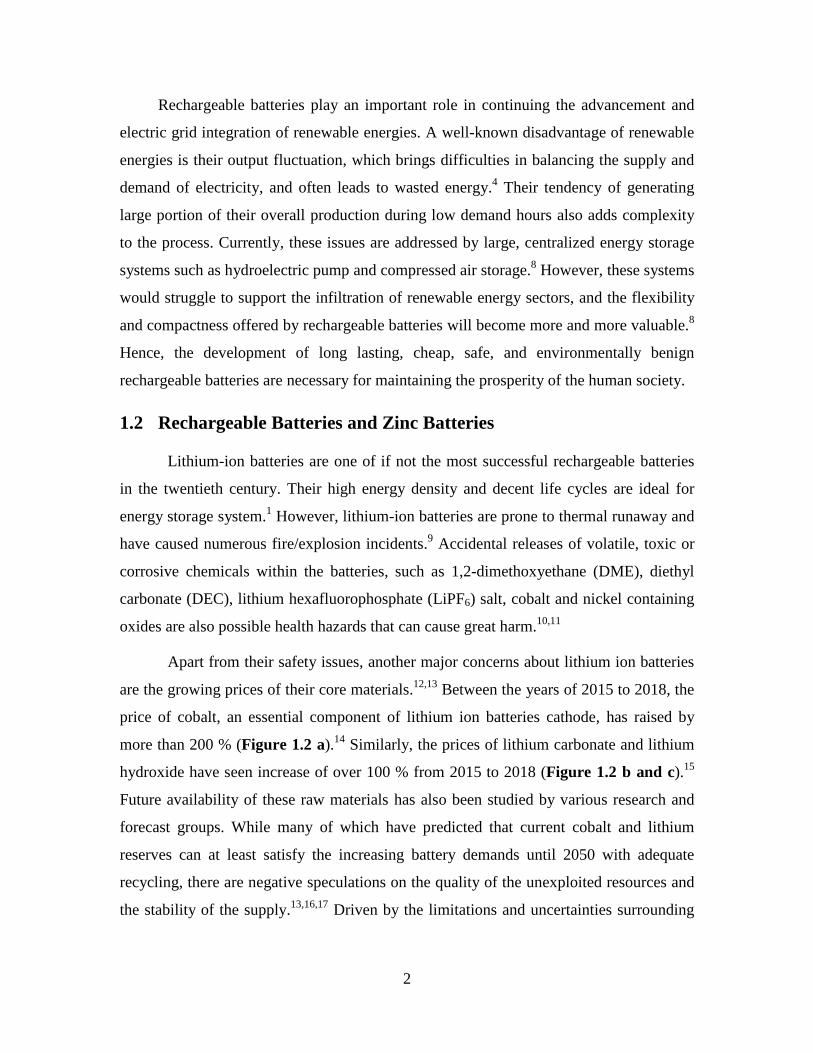
Apart from their safety issues, another major concerns about lithium ion batteries
are the growing prices of their core materials.12,13
Between the years of 2015 to 2018, the
price of cobalt, an essential component of lithium ion batteries cathode, has raised by
more than 200 % (Figure 1.2 a).14
Similarly, the prices of lithium carbonate and lithium
hydroxide have seen increase of over 100 % from 2015 to 2018 (Figure 1.2 b and c).15
Future availability of these raw materials has also been studied by various research and
forecast groups. While many of which have predicted that current cobalt and lithium
reserves can at least satisfy the increasing battery demands until 2050 with adequate
recycling, there are negative speculations on the quality of the unexploited resources and
the stability of the supply.13,16,17
Driven by the limitations and uncertainties surrounding
3
lithium based batteries, there has been an increasing interest in exploring possible
alternate battery systems that is based on other chemistries.
Figure 1.2 Market prices of a) cobalt, b) lithium carbonate and c) lithium hydroxide. Figure a was obtained
from Infomine,14 and diagram b and c were obtained from Global X Funds.15
Numerous non-lithium based batteries are actively being investigated and some
have already demonstrated promising properties that would be of great use in the future.
For example, sodium ion batteries are considered by many as a promising alternative of
lithium ion batteries that have slightly weaker performance but much better material
availability;18
metal air batteries such as zinc air batteries that have higher energy density
ceilings and lower cost;19,20
and aqueous zinc batteries which recently regained
considerable amount of research attentions due to breakthroughs that significantly
improve their rechargeability.21,22
Historically, zinc is one of the most common battery anode materials Over the
years, it has been used in the Leclanché cell, zinc-carbon batteries, alkaline batteries, zinc
mercury oxide batteries, zinc silver batteries, zinc air batteries and rechargeable zinc
nickel batteries.23
While some of these batteries are manufacture-discontinued due to cost
or health issues, others such as alkaline, zinc air and zinc nickel batteries still own
4
significant shares of the current battery market.23
As an anode material, zinc has a
relatively low standard potential of -0.76 V and a medium-high theoretical specific
capacity of 818 mAh g-1
. It offers advantages such as low toxicity, high abundancy, low
cost, compatibility with aqueous system and ease of handling.24
Worldwide, the estimated
land based resources and reserves of zinc are 1.9 billion tonnes and 220 million tonnes,25
respectively, which are at least 10 times more than that of lithium.13
Global annual
productions of refined zinc are around 13 million tonnes, with near 25% contributed by
the recycling industries.25
The zinc recycling process is well-developed and there are still
consistent effort to further improve the process by reducing their energy consumption and
environmental impact.26-28
Given the maturity of the industrial processes and the natural
abundancy of the metal, zinc would make a sustainable and affordable battery core
material that can meet high demand with ease.
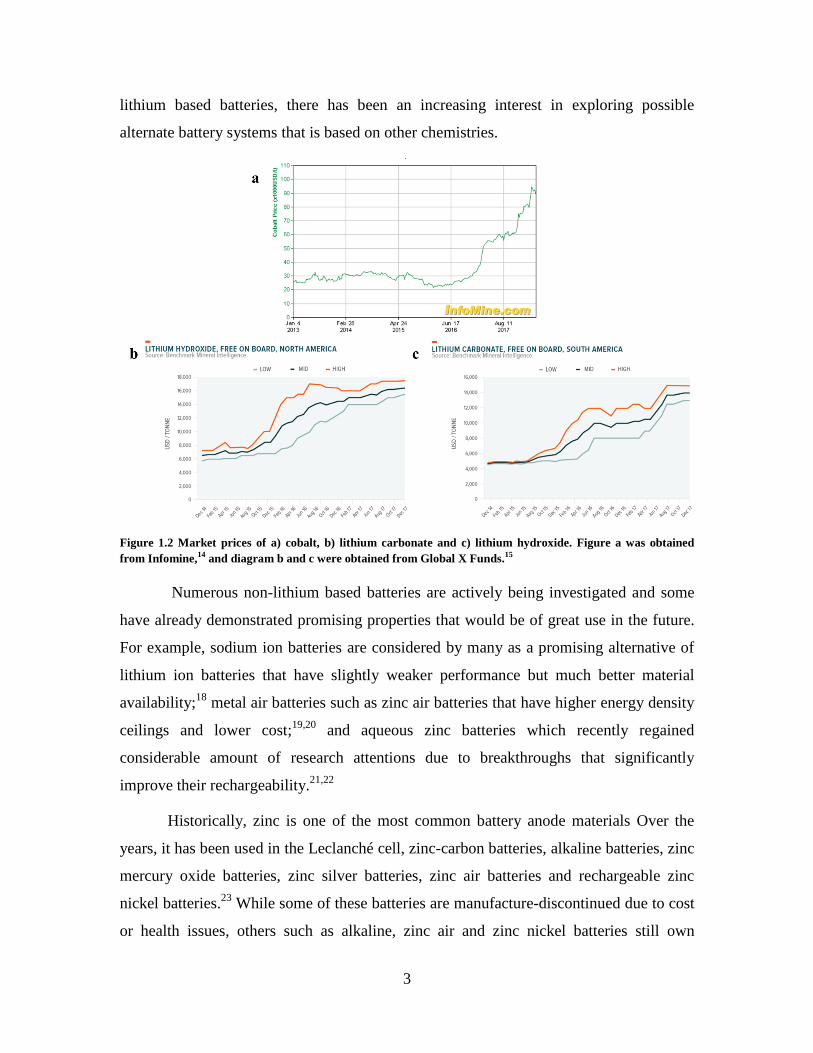
Table 1 Performance of zinc batteries in recent publications
Types of Batteries Voltage Energy Density
(Active Materials) Cyclability
3DZn–NiO2[22]
1.4 – 1.9 V 135.0 Whkg-1
80 % ( > 80 cycles)
Zn–Zn0.25V2O5 nH2O [29]
0.5 – 1.4 V 175.0 Whkg-1
80 % (1000 cycles)
Zn–Quinone [30]
0.4 – 1.0 V 220.0 Whkg-1
87 % (1000 cycles)
Zn–α-MnO2 [21]
1.0 – 1.8 V ~170 Whkg-1
92 % (5000 cycles)
Zn–β-MnO2 [31] 1.0 – 1.8 V 158.5 Whkg
-1 94 % (2000 cycles)
Traditionally, the oxidation and reduction reaction of zinc in batteries are not
known to have high reversibility and often suffer from issue like dendrite formation.
However, recent studies have demonstrated that with adequate electrode design (3D
porous zinc electrode)22
and proper electrolyte selection (mildly acidic/neutral
electrolyte21,29,31
)21,29,31
, the impact of these issue can be reduced. There are also a large
number of studies about cathode materials for Zn batteries, which mainly focuses on
improving the reversibility, rate capability and energy density. Some families of materials
which have been considered and investigated include transition metal oxide,32-35
sulfide,34,36,37
and hexacyanoferrate.38-40
Among them, the best performing ones are the
layered structured V2O5 nH2O demonstrated by Kundu et al.,29
the organic and
sustainable quinone-based cathodes showcased by Zhao et al.,30
and manganese dioxide
5
(MnO2) of different crystal structures(Table 1).21,31
In this project, the focus will be on
the latter of the three; the history, properties, reaction mechanism and recent progress of
the corresponding Zn-MnO2 batteries will be discussed in the following section.
1.3 Manganese Dioxide Cathode
Manganese is a relatively abundant, non-toxic and environmentally friendly
transition metal. It is commonly found in ores as oxide compounds with other elements
such as iron, sodium, and barium.41
The current global reserve of manganese ore is
around 690 million tonnes,42
and their recent price point have been fluctuating between
1500-2500 $US/tonne,43
which are less than one twentieth to the price of cobalt.
Manganese exhibits a rich variety of oxidation states and participates in various
electrochemical reactions, of which, the oxidation and reduction of oxides with
manganese at the state of 2+, 3+ and 4+ are core reactions to many batteries. As an
example, manganese containing oxides such as LiMn2O4, LiNi0.33Mn0.33Co0.33O2 (NMC),
and MnO2 are all well-known cathode materials which play significant roles in the
current battery industry.
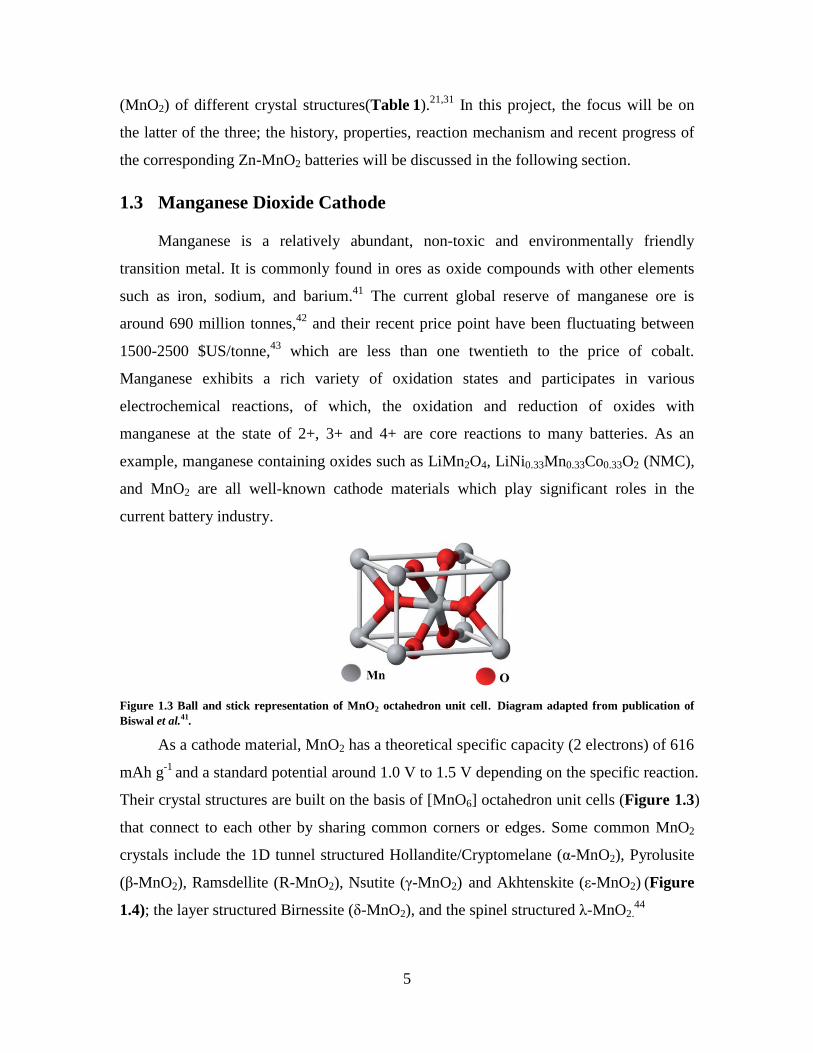
Figure 1.3 Ball and stick representation of MnO2 octahedron unit cell. Diagram adapted from publication of
Biswal et al.41.
As a cathode material, MnO2 has a theoretical specific capacity (2 electrons) of 616
mAh g-1
and a standard potential around 1.0 V to 1.5 V depending on the specific reaction.
Their crystal structures are built on the basis of [MnO6] octahedron unit cells (Figure 1.3)
that connect to each other by sharing common corners or edges. Some common MnO2
crystals include the 1D tunnel structured Hollandite/Cryptomelane (α-MnO2), Pyrolusite
(β-MnO2), Ramsdellite (R-MnO2), Nsutite (γ-MnO2) and Akhtenskite (ε-MnO2) (Figure
1.4); the layer structured Birnessite (δ-MnO2), and the spinel structured λ-MnO2.44
6
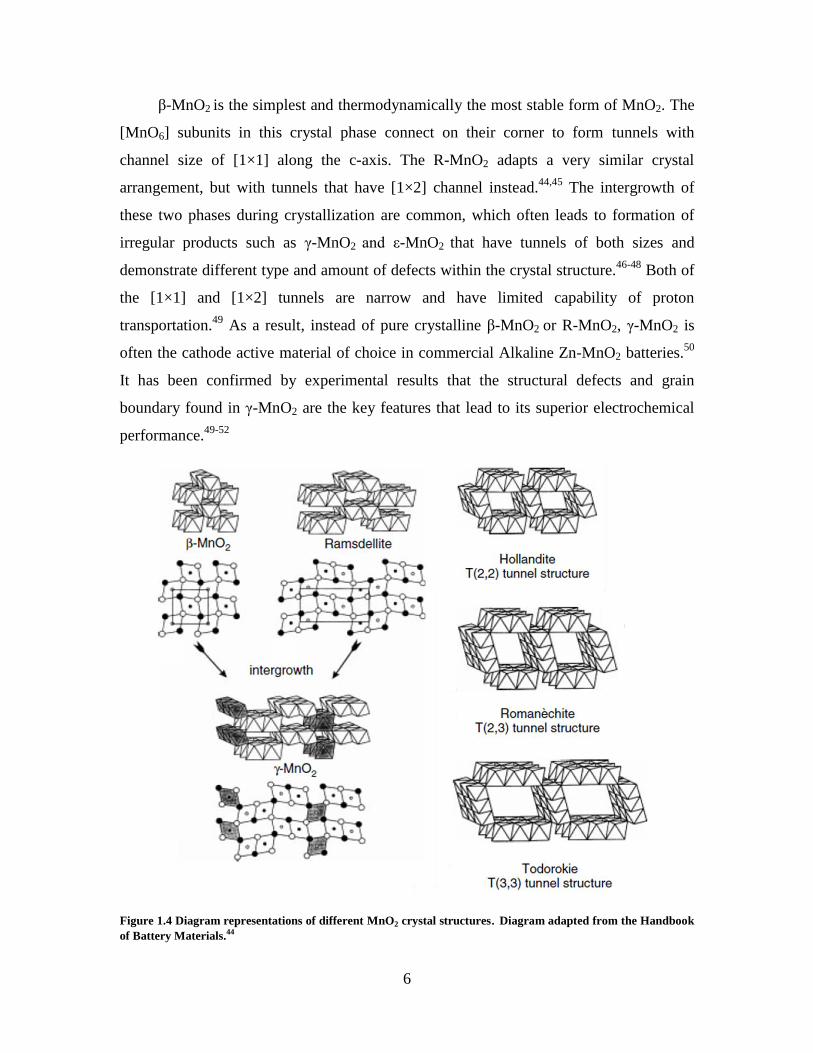
β-MnO2 is the simplest and thermodynamically the most stable form of MnO2. The
[MnO6] subunits in this crystal phase connect on their corner to form tunnels with
channel size of [1×1] along the c-axis. The R-MnO2 adapts a very similar crystal
arrangement, but with tunnels that have [1×2] channel instead.44,45
The intergrowth of
these two phases during crystallization are common, which often leads to formation of
irregular products such as γ-MnO2 and ε-MnO2 that have tunnels of both sizes and
demonstrate different type and amount of defects within the crystal structure.46-48
Both of
the [1×1] and [1×2] tunnels are narrow and have limited capability of proton
transportation.49
As a result, instead of pure crystalline β-MnO2 or R-MnO2, γ-MnO2 is
often the cathode active material of choice in commercial Alkaline Zn-MnO2 batteries.50
It has been confirmed by experimental results that the structural defects and grain
boundary found in γ-MnO2 are the key features that lead to its superior electrochemical
performance.49-52
Figure 1.4 Diagram representations of different MnO2 crystal structures. Diagram adapted from the Handbook
of Battery Materials.44
7
In contrast to the family of β-MnO2 and R-MnO2, α-phase MnO2 contains both
[1×1] and [2×2] tunnels, with the latter being large enough to incorporate large cations
such as barium, silver and potassium.51
These cations in the [2×2] tunnels have mix effect
on the properties and electrochemical performance of the material. In one end, they
contribute to stabilizing the large tunnels and are beneficial for charge transfer,53,54
in the
other, their large sizes hinder transportation of the intercalation ions.51
Due to the
capability of the [2×2] tunnel to host insertion and desertion of various cations, α-MnO2
had been investigated as active cathode material in lithium, sodium, magnesium and zinc
batteries.32,55-61
Furthermore, it is also a candidate material for applications in
supercapacitor and catalysis.62-66
MnO2 with larger tunnel sizes such as Romanèchite
([2×3]) and Todorokie ([3×3]) have also been reported(Figure 1.4).44
These types of
MnO2 generally have better structural stability, but lacks capacity and energy density due
to their less portion of active components.67
Layer structured MnO2, whose crystal structure consist of stacking layers of edge-
sharing MnO6 subunit, has also been studied extensively for possible electrochemical
applications. Similar to α-MnO2, the void space between the stacking layers can
accommodate different types of cation, which in return serves to stabilize the crystal
structures. δ-MnO2 is a subgroup of the layer structured MnO2 family which contains
varying amount of H2O molecule and foreign cations in the interlayer spacing with H2O
being the predominate species.44
The structural framework of δ-MnO2 is relatively
flexible and the H2O molecules can easily move around to accommodate different types
of intercalation ions.68
Consequently, X-Ray Diffraction (XRD) analysis of these
materials has proven to be very difficult as results vary significantly due to the
distribution of the interlayer species.44
Despite so, their flexibility and large interlayer
distance have attracted attention for applications as intercalation cathode materials.69-71
Manganese ores found naturally often need to be processed to achieve battery grade
purity and desired crystal phases. Depending on the method of processing, MnO2 is
divided into two categories, the electrolytic manganese dioxide (EMD) and the chemical
manganese dioxide (CMD).23
EMD is generally prepared by first dissolving manganese
ores in sulphuric acid solution, followed by multiple steps of purification processes
(Ca(OH)2 and NaS treatment) to remove undesired heavy metal impurities.41
Then, the
8
battery grade EMD would be collected from the manganese solution through
electroplating.23
As-prepared EMD generally have crystal structure that resembles to β-
MnO2, ε- MnO2 or γ- MnO2, and very often is a polymorph of the three phases.41
As for
CMD, they are MnO2 prepared by methods such as thermal decomposition, direct
oxidation and reduction of high-valence manganese salts. They can be prepared into
different crystal structure easily and precisely with different reaction methods and
conditions.72-74
Historically, CMD is considered to be less pure and have lower
volumetric density, thus are not use in the commercial Alkaline Zn-MnO2 batteries, but
with new inspiration of its application potential and improvement of the synthesis
procedures, it is becoming more appreciated by the research and industrial community.44
More details regarding CMD will be provided in the later section as it will be a main
focus of this thesis project.
1.4 Alkaline Zn-MnO2 Batteries
1.4.1 Primary Alkaline Zn-MnO2 Batteries
Primary Zn–MnO2 alkaline batteries are one of the iconic primary batteries
developed in the twentieth century. They were first discovered in 1960 by Lewis Urry
who modified the previously existing zinc-carbon dry cell batteries by changing the
ammonium chloride/zinc chloride gel electrolyte to one that is based on potassium
hydroxide (KOH).75
In comparison to zinc-carbon batteries, the modification
significantly improved their energy density, service performances, shelf life and
stability.23
These properties along with the environmental factors were further optimized
in years following their commercialization by company such as Duracell and Energizer,
which consolidated their status as the primary battery market leader. It was estimated that,
in the year of 2003, alkaline Zn–MnO2 batteries account for near 80% of the total primary
battery sales in the United State.1 This dominance may have been weakened in recent
years as availability of higher performing batteries such as primary lithium ion batteries
are growing, but the affordable, safe and reliable alkaline Zn–MnO2 batteries are still
competitive for low drain applications.
Zn + 4OH− → Zn(OH)4
2- + 2e
− (1.1)
9
Zn + 2OH− → Zn(OH)2 + 2e
−
Zn(OH)2 → ZnO + H2O
(1.2)
(1.3)
The electrochemistry of primary Zn–MnO2 alkaline batteries is complex and has
been studied for years. The batteries have MnO2 as cathode, Zn as anode and KOH in the
form of gel electrolyte. During discharge, the three consecutive steps of the anodic
reactions are described in Equations (1.1),(1.2) and (1.3).23,76
In the very beginning, zinc
metal would oxidize into zincate ion (Zn(OH)42-
) and dissolve into the water inside the
system, where it will exist in the form of potassium zincate (K2Zn(OH)4).76
As the limited
water becomes saturated with zinc ions, the water-starved environment changes the
reaction. In this stage, the zinc would oxidize into zinc hydroxide (Zn(OH)2) instead,
which would further dehydrate to form zinc oxide (ZnO) that precipitate as white solid
onto the zinc electrode.23
MnO2 + H2O + e− → MnOOH + OH
−
3MnOOH + e− → Mn3O4 + OH
− + H2O
MnOOH + H2O + e− → Mn(OH)2 + OH
−
(1.4)
(1.5a)
(1.5b)
On the cathode side, the MnO2 reduction process in alkaline Zn-MnO2 batteries
are often represented by the reactions described in Equations (1.4), (1.5a) and (1.5b).23
In this cathodic reduction reaction, the MnO2 will first reduce to MnOOH, then to Mn3O4
or Mn(OH)2 depending on the depth of discharge (DOD) or the cut-off voltage. If only
1.33 electrons per MnO2 were drawn out, the end product would be Mn3O4,23
and if all
capacity (2 electrons) are completely drawn out from the MnO2, the final product would
be Mn(OH)2.1 Combining the anodic and cathodic reactions, the overall reaction in
alkaline Zn-MnO2 batteries under intermediate or complete drain is then either
Equations (1.6a) or (1.6b).
2Zn + 3MnO2 → ZnO+ Mn3O4 (1.6a)
Zn + MnO2 + 2H2O → ZnO + Mn(OH)2 + 2OH− (1.6b)
The above discussions are a very simplified description of the events which occur
within alkaline Zn-MnO2 batteries. The actual reaction mechanism involves various
10
manganese oxide polymorphs and their corresponding stages of transition; these
reduction reactions can be homogeneous or heterogeneous, which are reflected by a
decreasing or a relatively constant potential, respectively.77
Formation and participation
of manganese oxide/hydroxide with different oxidation states such as Mn4O7, MnOOH,
Mn2O3, Mn3O4, Mn(OH)2, MnO have all been reported in previous publications, but their
result do not fully agree.77-80
The tendency of the mechanism being influenced by factors
such as crystal phases, synthesis condition and purity of MnO2, KOH concentration, and
rate of discharge also adds onto the complexity and unpredictability of the system.77,78
As
such, the MnO2 reduction mechanisms remain to be a topic that is still controversial.
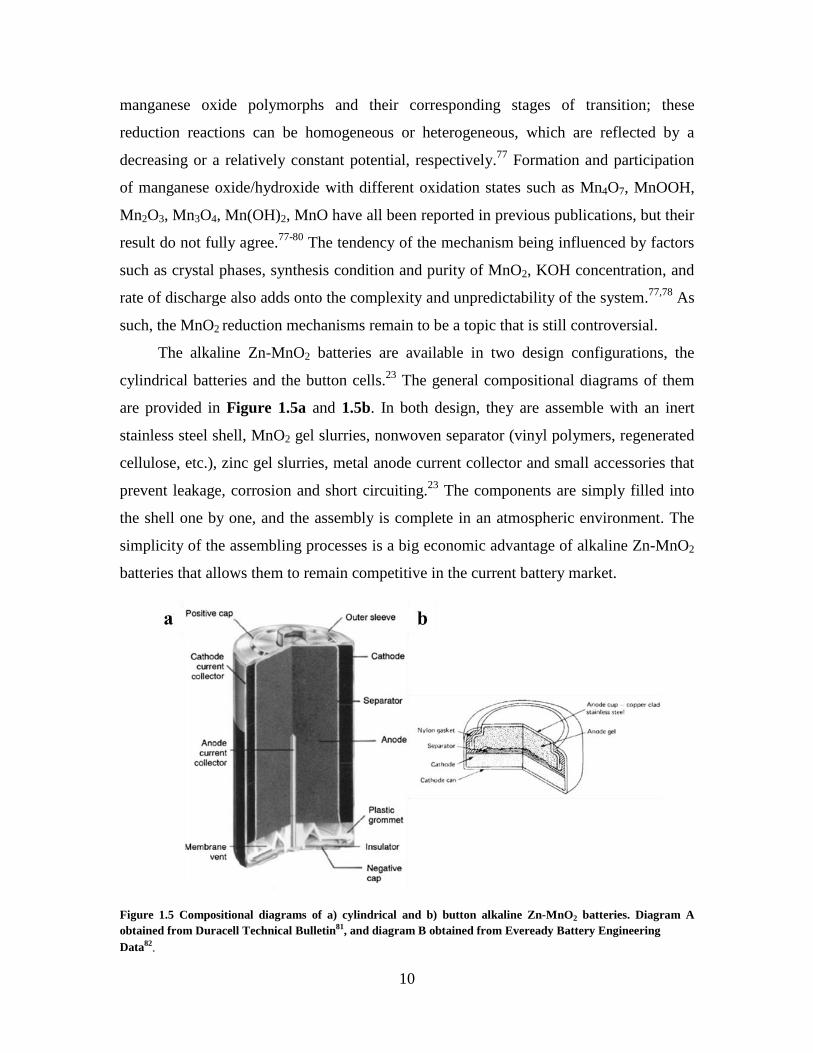
The alkaline Zn-MnO2 batteries are available in two design configurations, the
cylindrical batteries and the button cells.23
The general compositional diagrams of them
are provided in Figure 1.5a and 1.5b. In both design, they are assemble with an inert
stainless steel shell, MnO2 gel slurries, nonwoven separator (vinyl polymers, regenerated
cellulose, etc.), zinc gel slurries, metal anode current collector and small accessories that
prevent leakage, corrosion and short circuiting.23
The components are simply filled into
the shell one by one, and the assembly is complete in an atmospheric environment. The
simplicity of the assembling processes is a big economic advantage of alkaline Zn-MnO2
batteries that allows them to remain competitive in the current battery market.
Figure 1.5 Compositional diagrams of a) cylindrical and b) button alkaline Zn-MnO2 batteries. Diagram A
obtained from Duracell Technical Bulletin81, and diagram B obtained from Eveready Battery Engineering
Data82。
11
The slurries are of great importance to the battery performance, thus, its
composition is worth to be further discussed. First, the MnO2 gel slurries are a mixture of
MnO2, graphite, KOH electrolyte and small amount of binding agent. The MnO2 are
often EMD due to their high purities and compatibility. The graphite is added to
compensate for the low electric conductivity (10-5
-10-7
S cm-1
) of the manganese oxides.83
As for the anode slurries, they are prepared by mixing zinc powder, KOH gel electrolyte
and small amount of inhibitor. Industrially, the purity of the zinc powder was ensured by
refinement through thermal distillation or electroplating. The addition of the inhibitor is
to prevent the highly active zinc metal from reducing water to hydrogen gas, which
would cause battery leakage and exhaust the limited amount of water in the dry cell; it
was initially resolved with the addition of mercury as the inhibitor,23,84
but it is no longer
the case because the usage of mercury in batteries was officially prohibited by the U.S.
government in 1996 due to its toxicity and possible threats to environmental.85
Since then
the inhabitation task is achieved by alloying zinc with metal such as indium or lead,86
or
by addition of inhibitors like anionic surfactant and quaternary ammonium salt.87
1.4.2 Rechargeable Alkaline Zn-MnO2 Batteries
With the success of Zn–MnO2 batteries in the primary battery market, attempts
were made to develop and commercialize rechargeable alkaline Zn–MnO2 batteries. The
first attempt was made by Union Carbide Corp. (Eveready) and Mallory Corp. in 1977,
but the product was withdrawn shortly after due to leakage issue.44
The second generation
of the rechargeable alkaline manganese (RAM) batteries returned a decade later when
Battery Technology Inc. modified and improved the design of the batteries.88
Following
which, the RAM batteries were promoted and commercialized in the United State,
Germany, South Korea, etc.44,89
In comparison to other rechargeable batteries in the
1990s such as nickel cadmium (NiCd) and nickel metal hydride(NiMH) batteries, RAM
batteries have higher operating voltage, lower self-discharge, lower initial cost and are
more environmental friendly.23
However, the RAM batteries suffer greatly from low
rechargebility and often lose near half of its initial capacity after only 20 cycles of deep
discharge (1 electron capacity).23
This disadvantage has limited their widespread
12
applications and the products have been slowly fading out of the market as the better
performing lithium-ion and NiMH batteries became cheaper and more accessible.
The rechargeability of RAM batteries is very dependent on the depth of discharge
(DOD). It has been reported that when cycled with a shallow DOD of 10%, the RAM
batteries can maintain more than 80% of its capacity after 3000 cycles of operation.90
In
this specific circumstance, the MnO2 are only partially reduced to MnOOH, and the
reversibility of this process is high. However such cycling protocols would greatly reduce
the practical energy density of the batteries and render its usefulness in actual
applications. In the case when the battery is fully discharged, various issues will arise in
both ends of the batteries.
In the cathode side, destruction of crystal structure, active material dissolution and
most importantly, the formation of electrochemically inactive species such as Mn3O4 and
ZnMn2O4 are the leading causes of capacity lost in RAM batteries.90-92
Previous studies
have identified that α-MnOOH, a reaction intermediate in the recharging process, is a
necessary precursor for the inactive MnOx species.93,94
Therefore, a common theme in
resolving the issue is to promote specific oxidation reaction paths by modifying the
crystal structure of MnO2 with foreign cations. In one example, Kannan et al.
demonstrated that the addition of 10 wt% Bi2O3 to the MnO2 can lead to formation of Bi-
doped birnessite type MnO2 instead of the inactive products and drastically improved the
cyclability of the cathode material.92
The effects of barium, titanium, or nickel doping, as
well as electrolyte modification (LiOH + KOH) have also been investigated.94-97
More
recently, Yadav et al. demonstrated a copper and bismuth co-doped birnessite type MnO2
cathode which maintained over 80% of the MnO2 two electron capacity (617 mAh g-1
)
after 1,000 cycles of 1C cycling versus a standard reference.98
Though, when paired with
a zinc anode, the rechargeability of the system would drastically reduce to one that loses
25% of its energy density in 100 cycles.
In the anode side, formation of ZnO, zinc dendrite and undesired hydrogen
evolution are the predominant reasons for failures or low rechargebility. Common
strategies of suppressing zinc dendrite formation include adding small amount of organic
surfactants such as sodium dodecyl sulfate (SDS), polyethylene glycol (PEG) or thiourea
13
to the electrolyte.99
Preparation of Zn electrode with 3D porous structure to direct the
location of zinc deposition is also proven to be an extremely effective strategy.22
Lastly,
recent studies have demonstrated that hydrogen evolution by zinc in alkaline condition
can be suppressed with application of metal oxide or polymer composite additive.100,101
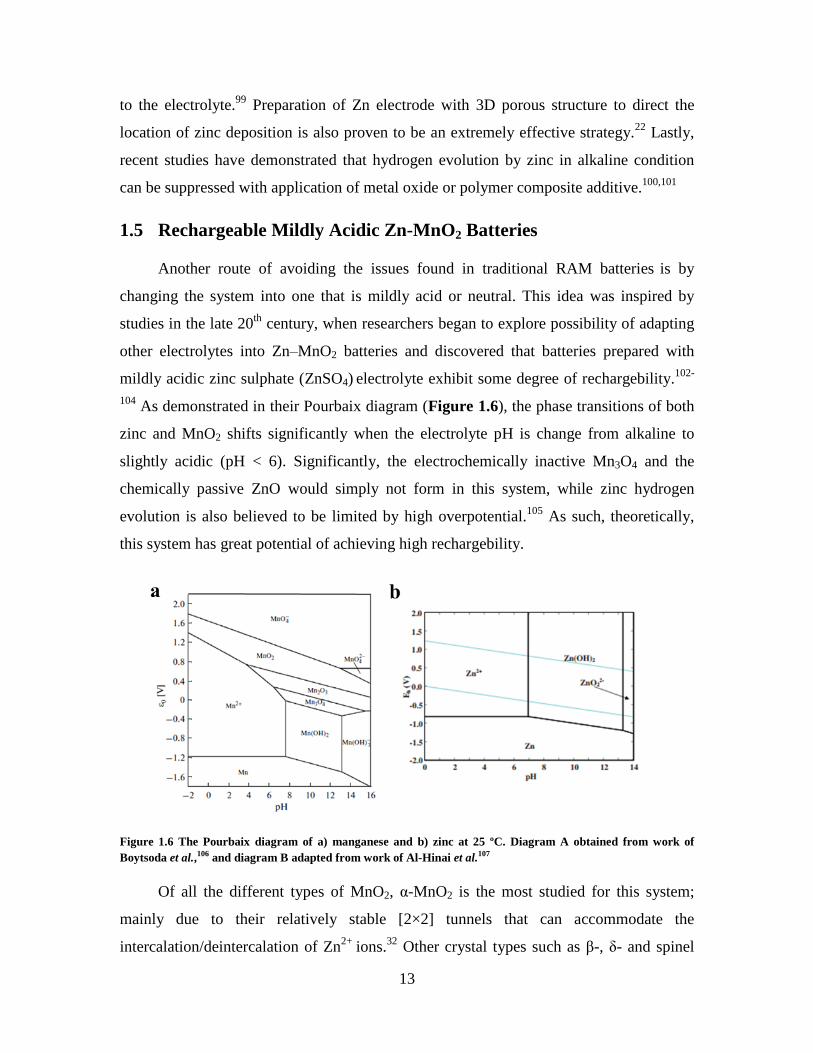
1.5 Rechargeable Mildly Acidic Zn-MnO2 Batteries
Another route of avoiding the issues found in traditional RAM batteries is by
changing the system into one that is mildly acid or neutral. This idea was inspired by
studies in the late 20th
century, when researchers began to explore possibility of adapting
other electrolytes into Zn–MnO2 batteries and discovered that batteries prepared with
mildly acidic zinc sulphate (ZnSO4) electrolyte exhibit some degree of rechargebility.102-
104 As demonstrated in their Pourbaix diagram (Figure 1.6), the phase transitions of both
zinc and MnO2 shifts significantly when the electrolyte pH is change from alkaline to
slightly acidic (pH < 6). Significantly, the electrochemically inactive Mn3O4 and the
chemically passive ZnO would simply not form in this system, while zinc hydrogen
evolution is also believed to be limited by high overpotential.105
As such, theoretically,
this system has great potential of achieving high rechargebility.
Figure 1.6 The Pourbaix diagram of a) manganese and b) zinc at 25 ºC. Diagram A obtained from work of
Boytsoda et al.,106 and diagram B adapted from work of Al-Hinai et al.107
Of all the different types of MnO2, α-MnO2 is the most studied for this system;
mainly due to their relatively stable [2×2] tunnels that can accommodate the
intercalation/deintercalation of Zn2+
ions.32
Other crystal types such as β-, δ- and spinel
14
MnO2 have also been investigated.31,108-110
Various reaction mechanisms of these
rechargeable mildly acidic Zn-MnO2 (RMAZM) batteries have been proposed as well,
but there has yet to be one which is fully agreed upon by the research community. The
discussions have mostly been revolving around two reactions, the MnO2 conversion
reaction and zinc intercalation reaction.21,31,109-112
Though, they are not completely
incompatible and it is possible for both reactions to occur during the discharge.112
The
different results are likely due to the variation in the initial MnO2 crystal structure of each
study, which can influence the reaction paths. The likelihood of MnO2 polymorph being
present in the system also adds onto the difficulties of the investigation.
Despite some contracting results in the mechanism investigations, a common
consensus in previous studies is the occurrence of Mn2+
/Mn3+
dissolution, which leads to
capacity fade through loss of active materials. The undesired dissolution originates from
the crystal lattice mechanism of Jahn-Teller distortion. In which, the Mn3+
ions, in the
discharge products, with an unstable high-spin d
4 electronic configuration experience an
elongation of their 𝑑𝑥2−𝑦2 and 𝑑𝑧2 orbitals; this electron cloud movement facilitates the
Mn3+
species to undergo structural transformation in the form of disproportion reaction
that eventually give Mn4+
and water soluble Mn2+
(Equation 1.7).113,114
The dissolution
phenomenon is not a standalone case for aqueous batteries, but an intrinsic property of
Mn3+
that has also been reported in lithium batteries with organic solvent.114-116
2Mn3+
(s) Mn2+
(aq) + Mn4+
(s) (1.7)
In 1988, an idea to resolve the dissolution issue was first proposed by
Kim et al.117
The strategy aims to reduce the manganese dissolution by pre-addition of
Mn2+
ions (0.1 - 0.5 M MnSO4) into the electrolyte; it significantly raised the life span of
the system to 120 cycles. This strategy was further optimized by Pan et al. recently,21
who demonstrated a Zn–α-MnO2 battery, using 2M ZnSO4 electrolyte and 0.1M MnSO4
additive, that maintained 92 % of its capacity after being cycled at 5C (1C =308mAh g-1
)
for 5000 cycles. Following this study, Zhang et al. also successful prepared a Zn–β-
MnO2 battery using the same strategy but with 3M Zn(CF3SO3)2 and 0.1M Mn(CF3SO3)2
in the electrolyte; the battery maintained 94% of its initial capacity after being cycled at
6.5C for 2000 cycles.31
Later studies built on these foundations and optimize the system
15
even further for future applications. For example, Li et al. fabricated “extremely safe”
and flexible Zn/α-MnO2 batteries using a gelatin and polymer composite separator that
withstand different destructive tests while maintaining majority of its capacity( >
80%).118
In another approach, Wu et al. combined α-MnO2 with graphene to further
improve the rate capability of the system.119
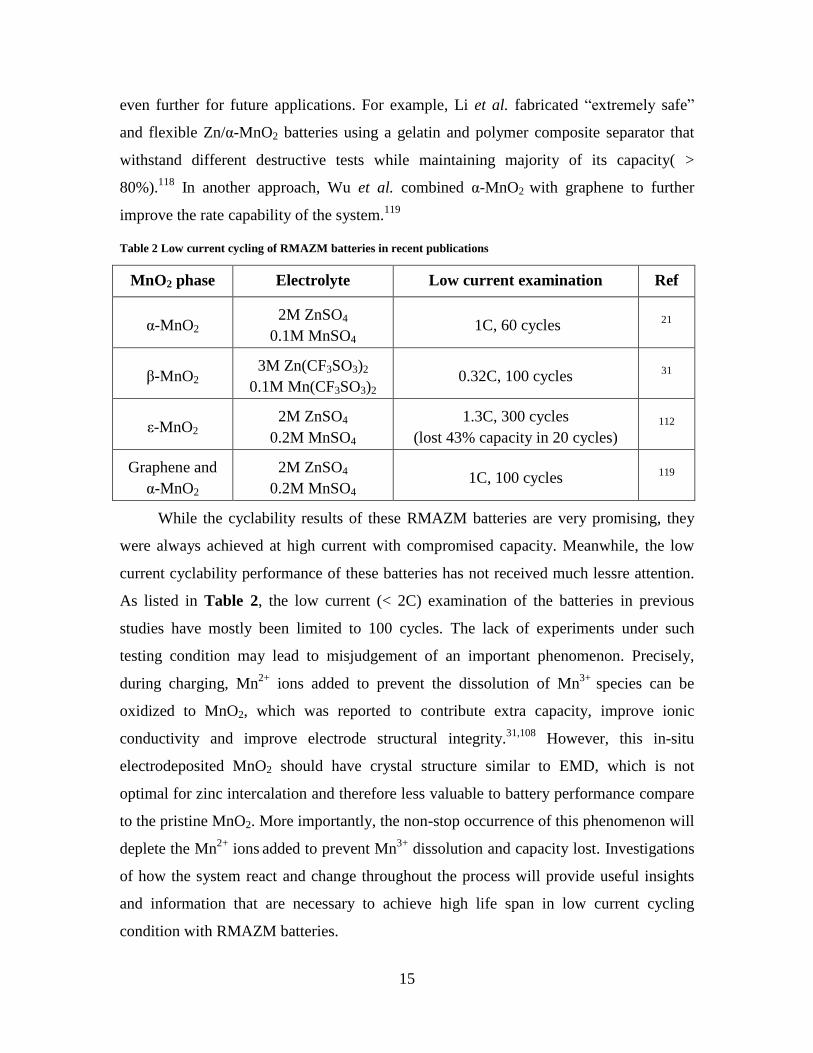
Table 2 Low current cycling of RMAZM batteries in recent publications
MnO2 phase Electrolyte Low current examination Ref
α-MnO2 2M ZnSO4
0.1M MnSO4 1C, 60 cycles
21
β-MnO2 3M Zn(CF3SO3)2
0.1M Mn(CF3SO3)2 0.32C, 100 cycles
31
ε-MnO2 2M ZnSO4
0.2M MnSO4
1.3C, 300 cycles
(lost 43% capacity in 20 cycles) 112
Graphene and
α-MnO2
2M ZnSO4
0.2M MnSO4 1C, 100 cycles
119
While the cyclability results of these RMAZM batteries are very promising, they
were always achieved at high current with compromised capacity. Meanwhile, the low
current cyclability performance of these batteries has not received much lessre attention.
As listed in Table 2, the low current (< 2C) examination of the batteries in previous
studies have mostly been limited to 100 cycles. The lack of experiments under such
testing condition may lead to misjudgement of an important phenomenon. Precisely,
during charging, Mn2+
ions added to prevent the dissolution of Mn3+
species can be
oxidized to MnO2, which was reported to contribute extra capacity, improve ionic
conductivity and improve electrode structural integrity.31,108
However, this in-situ
electrodeposited MnO2 should have crystal structure similar to EMD, which is not
optimal for zinc intercalation and therefore less valuable to battery performance compare
to the pristine MnO2. More importantly, the non-stop occurrence of this phenomenon will
deplete the Mn2+
ions added to prevent Mn
3+ dissolution and capacity lost. Investigations
of how the system react and change throughout the process will provide useful insights
and information that are necessary to achieve high life span in low current cycling
condition with RMAZM batteries.
16
1.6 Research Objective
This thesis can be divided into two main objectives, with both being a part of the
goal to achieve long lasting and high performing RMAZM batteries.
1. The first part of the thesis aims to investigate and develop understanding on the
fundamentals of the RMAZM batteries and the phenomenon of in-situ Mn2+
electrodeposition within the system. The target is to explore the α-MnO2 reaction
mechanism as well as to determine the capacity fading mechanism with the
presence of Mn2+
additive. Various factors and cycling condition will be explored
to gain better insight about the MnO2 electrodeposition process. Also, the identity
and transformation mechanism of the deposited MnOx species will be examined
with various characterization techniques. In the end, every pieces of the puzzle
will be linked together to form a complete description of the system to allow the
identification of key points that can be modified to extend battery life cycle.
2. In the second part of the thesis, the goal is to incorporate the developed
understanding of the system into designing MnO2 electrodes that have improved
cyclability at low current and deep cycling, as well as the already demonstrated
excellent rate performance and good cyclability at high current. Specifically, the
MnO2 electrodeposition reaction is explicitly targeted as an undesired reaction
and is supressed through manipulation of its reaction kinetic. The effectiveness of
the strategy is demonstrated by a MnO2 electrode that hinders the Mn adsorption
and post cycling characterization is also presented to confirm the connection
between the improved stability and the strategy.
1.7 Organization of Thesis
This thesis is organized into five chapters. Chapter 1 introduces general
background, history, recent research progress of Zn-MnO2 batteries, and motivation of
the thesis work. Chapter 2 presents various characterization and performance
measurement techniques adapted throughout the thesis. In Chapter 3, the reaction
mechanism of rechargeable aqueous mildly acidic Zn-MnO2 batteries is discussed. The
mechanism, benefits and issues of Mn electrodeposition within these Zn-MnO2 batteries

17
are also presented in this chapter. Chapter 4 focuses on the strategy proposed to reduce
the frequency of Mn electrodeposition and in such increase the low current cyclability of
the batteries. The strategy has also brought rate performance improvement to the batteries,
which will also be discussed in the chapter. Lastly, in Chapter 5, a summary and
suggestions for future direction of the thesis work are provided.
18
2 Chemicals and Characterization Techniques
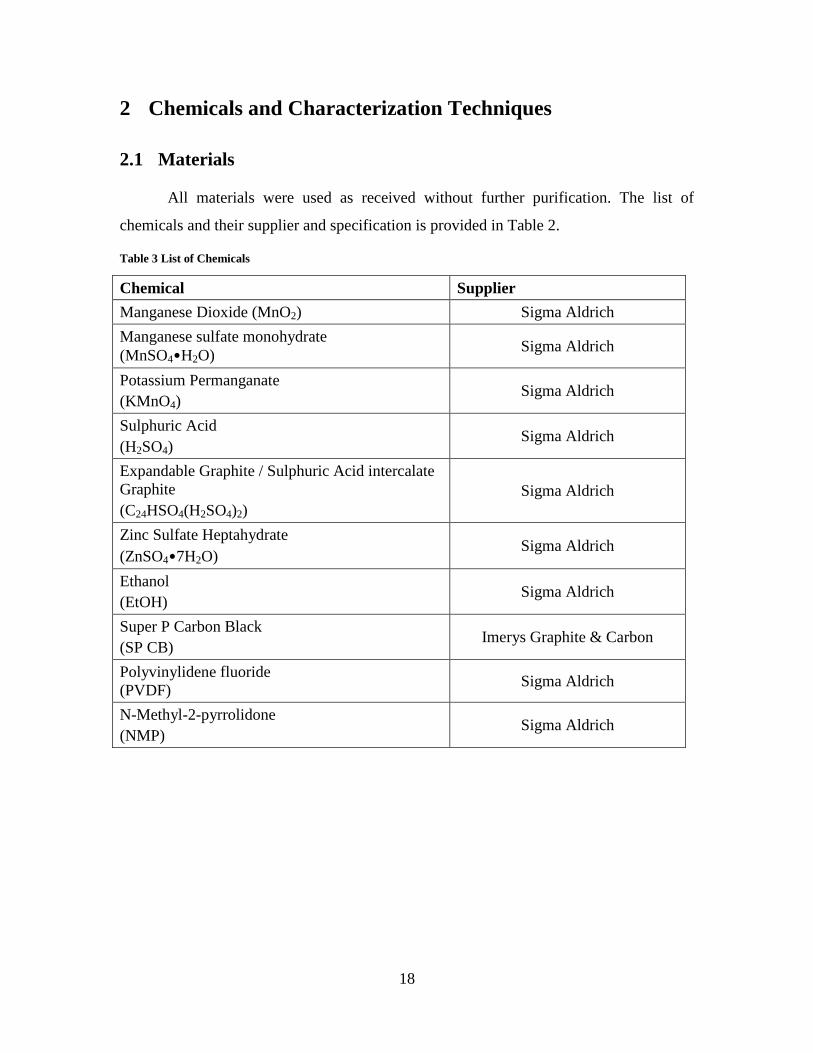
2.1 Materials
All materials were used as received without further purification. The list of
chemicals and their supplier and specification is provided in Table 2.
Table 3 List of Chemicals
Chemical Supplier
Manganese Dioxide (MnO2) Sigma Aldrich
Manganese sulfate monohydrate
(MnSO4•H2O) Sigma Aldrich
Potassium Permanganate
(KMnO4) Sigma Aldrich
Sulphuric Acid
(H2SO4) Sigma Aldrich
Expandable Graphite / Sulphuric Acid intercalate
Graphite
(C24HSO4(H2SO4)2)
Sigma Aldrich
Zinc Sulfate Heptahydrate
(ZnSO4•7H2O) Sigma Aldrich
Ethanol
(EtOH) Sigma Aldrich
Super P Carbon Black
(SP CB) Imerys Graphite & Carbon
Polyvinylidene fluoride
(PVDF) Sigma Aldrich
N-Methyl-2-pyrrolidone
(NMP) Sigma Aldrich
19
2.2 Physical Characterization
2.2.1 Scanning Electron Microscopy
Scanning Electron Microscopy (SEM) is a physical characterisation technique
mainly used to image surface morphology and structure of samples. As suggested by its
name, the technology utilizes electrons as the information carriers instead of photons
used in optical microscopy. The main advantage of adapting electrons in the imaging tool
is their drastically smaller wavelengths in comparison to visible light, which provide
SEM with the high resolution (~10 nm) necessary to obtain details image nanomaterials.
In general, SEMs consist of an electron gun, one or two condenser/objectives lens
and different electron detectors within an ultrahigh vacuum system. The electron gun
contains a filament (tungsten or lanthanum hexaboride) which can be thermally activated
to emit electrons. Once released, the electrons are accelerated by an electric field (5-
20kV), and then directed onto the samples by the condensers and objective lends. The
electrons are highly energetic, and therefore needs the ultrahigh vacuum to avoid any
undesired interaction with gas molecules. Upon striking the samples, the electrons can be
adsorbed or scattered, which generate signals such as secondary electrons, back scattering
electron, characteristic X-ray, cathodoluminescence, etc. In SEM, the signals of interest
are the secondary electrons and the back scattering electrons; these electrons will turn
into current when measured, and the intensity of the current will be reflected on the
brightness of the image.
The SEM images in this thesis were collected with a Zeiss ULTRA plus Field
Emission Scanning Electron Microscope (FESEMs). The samples were glued onto an
aluminum sample holder using a double sided carbon adhesive. The electron beam was
accelerated with a voltage of 20kV. In this thesis, SEM was used to observe the
morphology of the pristine α-MnO2 nanorods and the MnOx species that were grown onto
the cathode electrode after they were charged and discharged. It was also use to examine
the quality of various carbon-based substrate materials as well as their capability of
reducing the rate of MnO2 electrodeposition.
20
2.2.2 Transmission Electron Microscopy
Similar to SEM, Transmission Electron Microscopy (TEM) also uses high energy
electron beam to probe the structure of samples. In contrast to SEM though, TEM provide
information about interior compositions rather than surface of the sample; they generally
have higher resolution as well. In TEM, the electron beams are often much higher in
energy (60-300 keV), and it is the electrons that transmit through the samples which are
being measured. When passing through the samples, the interactions between the
electrons and the matters will change the number of measured electrons, which then lead
to a variation of brightness in the final images. Typically, TEM samples are limited to
have thickness under 1 μm; the exact values vary depending on power of the electron
beam.
The TEM images in this thesis were collected with a Philips CM 10 TEM and the
HRTEM (High resolution Transmission Electron Microscopy) images were obtained
from a FEI TITAN 80-300 LB TEM/STEM. The samples were first sonicated in ethanol
and then drop casted onto an amorphous carbon coated copper mesh. The electrons beam
of the TEM has energy of 60 keV and the HRTEM used one with 200 keV. TEM is used
to investigate the morphology transformation of the α-MnO2 nanorods after cycling. It
also assisted in confirming the morphology of the electrodeposited MnO2. Furthermore, it
was used to investigate the amorphous region found in the cycled MnO2 and to observe
the interlayer spacing directly. The results serve as important components in supporting
the reaction mechanism proposed.
2.2.3 Energy-Dispersive X-ray Spectroscopy
Energy-dispersive X-ray spectroscopy (EDX) is an analytical method used to
characterize and estimate the elemental composition and distribution of a sample. EDX is
often part of an electron microscope, it evaluate the characteristic X-ray given off by the
samples after they are stroked by the electron beam. The X-ray emission occurs when the
electron beams eject some ground/low energy inner shell electrons of the samples and
allows higher energy outer shell electrons to occupy those lower energy states by giving
off some of its energy through photon emission. Since the energy level of each electron
orbital is quantized and each element has its own unique set of orbital energy, each
21
element must also have its own unique set of characteristic X-ray. Hence, by measuring
the number and energy of the emitted X-ray, the identity and composition of the samples
can be identified and approximated.
For this work, EDX and elemental mapping are used to characterize the MnO2
electrode before and after cycling. The amount and distribution of the five elements K,
Zn, Mn, C and O were measured and adapted to explain the transformation of the MnO2
nanorod. The EDX analyses of the electrodeposited MnOx species are also important for
supporting the proposed capacity growth and fading process in the RMAZM batteries.
2.2.4 X-Ray Diffraction Analysis
X-Ray Diffraction (XRD) analysis is a rapid and non-destructive characterization
technique that analyzes the crystal structures of given samples. It is often used to identify
samples by comparison with known JCPDS reference, and it can also provide useful
information such as grain sizes, strain and thermal expansion. The working principle of
XRD is based on the phenomenon of light interference, in which, the crystal lattice of the
samples act as diffraction grating for the incident light. In a typical scan, a
monochromatic light beam is directed to the sample in varying incident angles, and the
diffracted beam is measured. The Bragg’s Law (Equation 2.1) is the principle which
describes this process. In this equation, λ is the wavelength of the incident beam, θ is the
beam incident angle and d is the distance of the interplanar spacing. When θ takes a value
such that n becomes a positive whole integer, the diffracted rays will interfere
constructively, leading to resonance of the light wave and hence generate a peak in the
XRD spectrum. On a side note, the values of λ and d need to be in similar order of
magnitude for optimal diffraction, hence X-ray is often chosen as the beam source to
measure the interlayer spacing in the angstrom range.
𝑛𝜆 = 2𝑑𝑠𝑖𝑛𝜃 (2.1)
XRD measurements in this thesis were collected with Rigaku Miniflex 600 X-ray
Diffractometer equipped with a graphite monochromator and a Cu Kα radiation source
(λ=1.5406Å). The XRD scans were collected from 5º to 80 º with a scan rate of 1º min-`1
.
XRD was performed to investigate the crystal structure transformation of the α-MnO2 and
undesired electrodeposited MnOx species. The observation of the (001) diffraction peak
22
of layered manganese oxides from cycled cathode electrode was the starting point in
formulating the newly proposed capacity fading mechanism. Furthermore, the shifting of
the α-MnO2 intrinsic peaks discovered by the XRD analysis was also important for
explaining the activation process of the α-MnO2 in the early cycles.
2.2.5 X-Ray Photoelectron Spectroscopy
X-Ray Photoelectron Spectroscopy (XPS), also known as Electron Spectroscopy
for Chemical Analysis (ESCA), is a quantitative technique which analyzes the surface
chemistry of samples. Its functionalities include identification of elements, measurement
of elemental composition, as well as determination of chemical and electronic states of
the elements. XPS is built on the principle of photoelectric effect which describes the
phenomenon of electron emission from a solid medium by light radiation and introduces
the idea of Wave–particle duality. Using the principle, the measured kinetic energy of the
ejected electrons can be correlated to their binding energy in the atomic orbitals. Since
each element have a characteristic set of binding energies, the elements in a material can
be identified by simply comparing the measured spectrum to the known reference.
Furthermore, since binding energies may vary due to formation of chemical bonds or
change in oxidation states, shifting of the characteristic peaks can also provide useful
information of chemical and electronic states of the elements.
In this thesis, XPS analyses were conducted with a K-Alpha X-ray Photoelectron
Spectrometer System. The result was used to confirm the presence of Zn in the cathode
electrode, which is meaningful to explain the Zn-intercalation mechanism. Ex-situ 2p1/2,
2p3/2 and 3s adsorption peaks of manganese during different stages of cycling were also
studies for better understanding of the charge/discharge mechanism and the disproportion
reaction previously reported.
2.2.6 Raman Spectroscopy
Raman spectroscopy is one of the many spectroscopic techniques that use matter
and light interaction to probe structural and bonding information of molecules.
Specifically, it measures inelastic scattering of light by molecules, in which the
interaction between the light wave and the molecules changes the energy of the scatter
23
light. Raman and infrared (IR) spectroscopies are often collected as complementary to
each other, they both use IR radiation that excite molecules to higher vibrational or
rotational states. IR and Raman adsorption are mutually exclusive in molecules that have
center of inversion. For a vibration to be Raman active, the vibration must cause a change
in polarizability of the molecules when it occurs; to be IR active, the vibration must
changes the dipole of the molecules.
In this thesis, Raman spectra of the samples were collected with a Bruker
Sentterra System using an excitation line with wavelength of 532 nm. Since α-MnO2 has
multiple Raman adsorptions near 640cm-1
, 572cm-1
, 385cm-1
and 183cm-1
, each
representation a specific vibration of the MnO2 crystal ladder, Raman spectrum of α-
MnO2 can provide additional informational about the bonding state of the active material.
Furthermore, the ID and IG peaks of the expanded graphite were measured using Raman
spectroscopy to confirm their graphitization during the thermal shock treatment.
2.2.7 Inductively Coupled Plasma Atomic Emission Spectroscopy
Inductively coupled plasma atomic emission spectroscopy (ICP-AES) is an analytic
technique that is capable of detecting and precisely measuring trace level of elements.
ICP-AES generally utilizes argon plasma generated by induction heating to thermally
excite electrons in an atom at a temperature around 7000 to 10000 K. The intensity
measurement of the characteristic radiation emitted by the excited atoms during their
relaxation process would then be used to determine the identity and concentration of
elements presence in the samples.
In this work, ICP-AES is performed with a Perkin Elmer Ltd. It was specifically
used to measure changes of manganese ion concentration in the electrolyte of a
carbon|ZnSO4+MnSO4|zinc wet cell. This experimental result was used to demonstrate
the correlation between the consumption of manganese ion and capacity growth of
RMAZM batteries.
24
2.3 Electrochemical Characterization
2.3.1 Galvanostatic Discharge/Cycling
Galvanostatic discharge test is an electrochemical performance examination
method that provides key information of batteries. In this test, the Galvanostat applies a
constant current through the electrolytic cells until a cut-off voltage is reached while
measuring the cell potential. It identifies the voltages of the discharge plateaus as well as
the practical capacity of the batteries. Upon completion of the discharge process, the
direction of the current can be reverse to charge the batteries. For battery analysis, the
values of the current are usually set based on the theoretical capacity of the targeted
material. They are often represented in C-rate, which is inversely proportional to the time
in hours the current takes to completely drain the theoretical capacity of the material. For
example, MnO2 has a theoretical capacity of 308 mAh g-1
, so currents of 308 mA and
1640 mA would be 1C and 5C for 1g of MnO2, respectively.
The life cycles and durability of batteries can be determined by prolong cycling of
Galvanostatic charge and discharge. Other important battery properties such as columbic
efficiency, specific capacity, energy efficiency, operating voltage can also be monitor in
these tests. Furthermore, testing criterions such as C-rates, number of cycles,
charge/discharge/resting periods, and cut-off voltage can also be varied to stimulate and
evaluate the performance of the batteries in specific conditions.
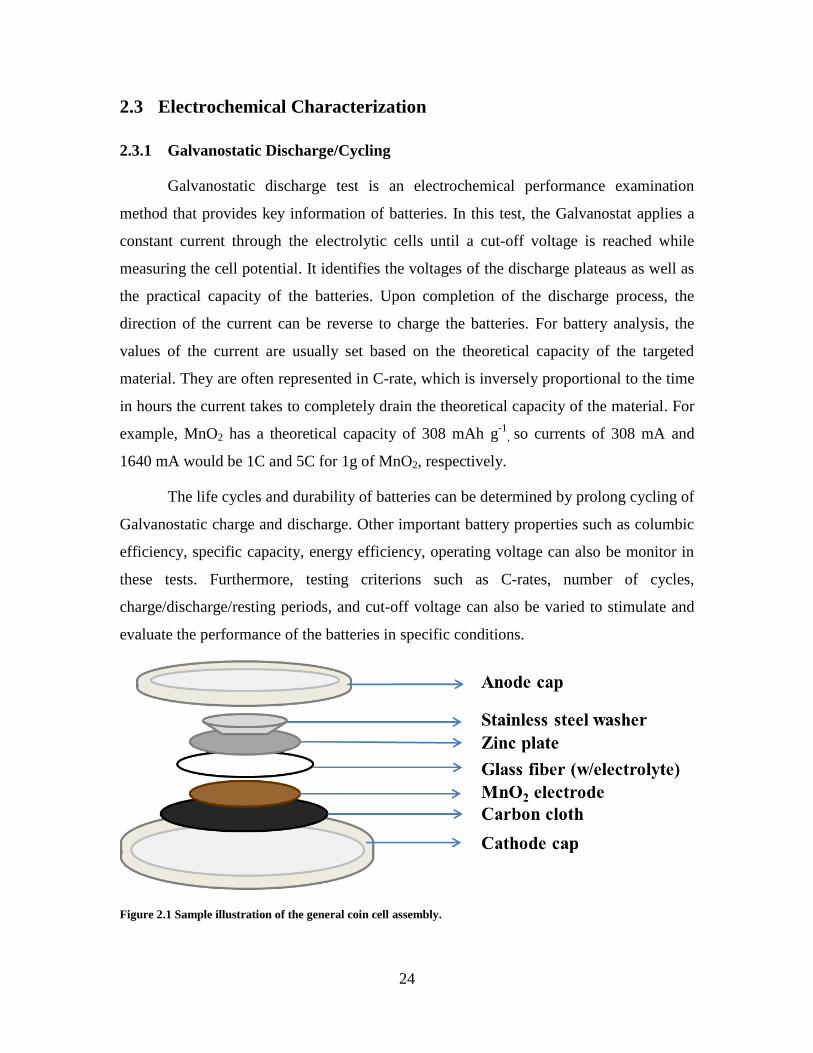
Figure 2.1 Sample illustration of the general coin cell assembly.
25
In this thesis, the Galvanostatic discharge and cycling were conducted on a
LAND-CT2001A battery tester. The electrode materials were assembled into batteries
using CR-2032 stainless steel coin cells in ambient condition and an example of the coin
cell assembly is demonstrated in Figure 2.1. The MnO2 electrodes are prepared by either
the standard doctor blade method or a filtration method, more details of process will be
provided in later chapters. The 2M ZnSO4 and 0.1M MnSO4 electrolyte was precisely
controlled to be 50μL and the zinc plate has thickness of approximately 0.1 cm. The
circular carbon cloth has a radius of 0.9 cm, and it was added to reduce contacts and side
reactions between the electrolytes and the caps. Upon complete construction of the coin
cells, they were sealed with a coin cell punch machine. The electrochemical performance
of the MnO2 electrode were evaluate in the voltage range of 1.0 to 1.8V vs Zn/Zn2+
. The
cycling durability of the MnO2 electrodes was evaluated at cycling rates of 1C and 5C.
The rate capability of the MnO2 electrodes was tested at 1C, 2C, 4C, 6C, 8C, and
10Cconsecutively; 5 cycles of charge and discharge are performed at each C-rate.
2.3.2 Cyclic Voltammetry
Cyclic voltammetry (CV) is an electrochemical analysis technique which can be
used to study the characteristics of electrolytic cells. In a general CV experiments, the
potential between the working and reference electrode is sweep linearly within a
predetermine voltage window, and the current produce at the working electrode is
measured during the process. A cyclic voltammogram can be generated by plotting the
current versus the potential, which allows direct investigation on the redox reactions of
the system. Continuous sweeping of the potential can also be used to inspect the change
of the system as well as the durability of the materials.
The CV scans in this thesis were collected using a Gamry Interface 5000E
potentiostat. The MnO2 was assembled into coin cells as previously describe and the CV
scans were collected in a two electrode system at a CV scan rate of 0.1 mV s-1
. The CV
results mainly serve as complementary information to the data obtained from Galvanostat
discharge and cycling, providing extra information about changes of the reaction
mechanism during the activation process.
26
3 Investigation of Manganese Dioxide Electrodeposition in
Rechargeable Mildly Acidic Zn-MnO2 Batteries
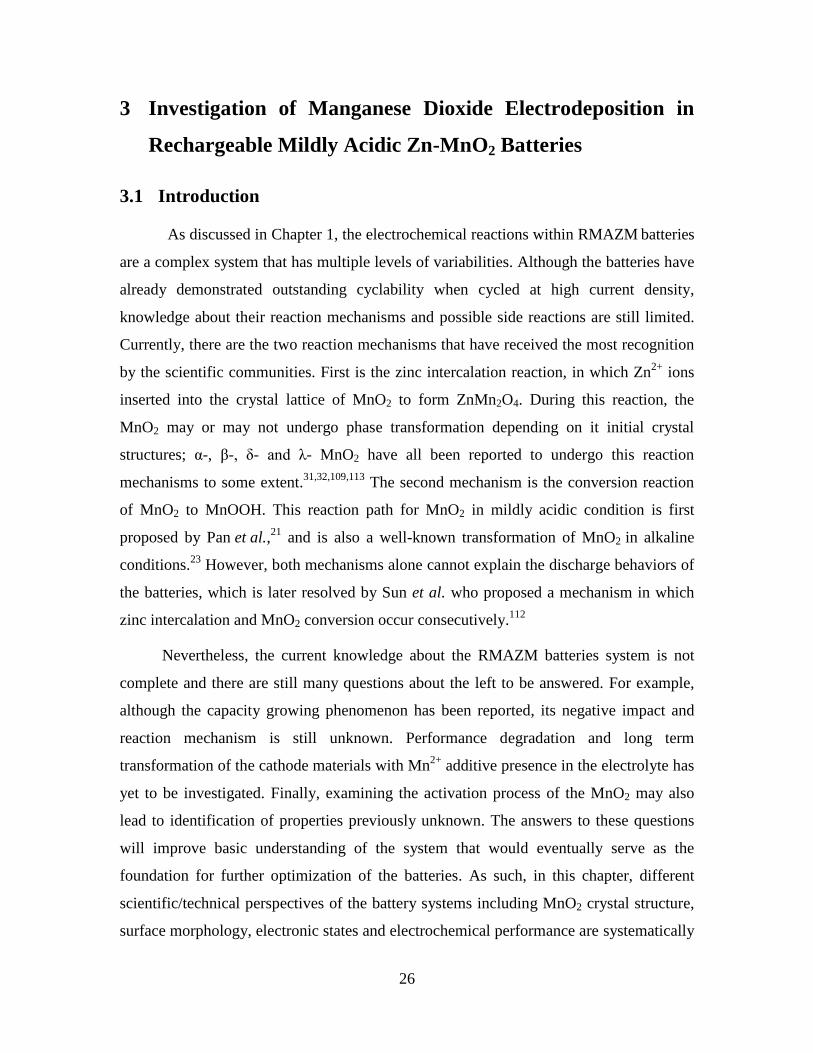
3.1 Introduction
As discussed in Chapter 1, the electrochemical reactions within RMAZM batteries
are a complex system that has multiple levels of variabilities. Although the batteries have
already demonstrated outstanding cyclability when cycled at high current density,
knowledge about their reaction mechanisms and possible side reactions are still limited.
Currently, there are the two reaction mechanisms that have received the most recognition
by the scientific communities. First is the zinc intercalation reaction, in which Zn2+
ions
inserted into the crystal lattice of MnO2 to form ZnMn2O4. During this reaction, the
MnO2 may or may not undergo phase transformation depending on it initial crystal
structures; α-, β-, δ- and λ- MnO2 have all been reported to undergo this reaction
mechanisms to some extent.31,32,109,113
The second mechanism is the conversion reaction
of MnO2 to MnOOH. This reaction path for MnO2 in mildly acidic condition is first
proposed by Pan et al.,21
and is also a well-known transformation of MnO2 in alkaline
conditions.23
However, both mechanisms alone cannot explain the discharge behaviors of
the batteries, which is later resolved by Sun et al. who proposed a mechanism in which
zinc intercalation and MnO2 conversion occur consecutively.112
Nevertheless, the current knowledge about the RMAZM batteries system is not
complete and there are still many questions about the left to be answered. For example,
although the capacity growing phenomenon has been reported, its negative impact and
reaction mechanism is still unknown. Performance degradation and long term
transformation of the cathode materials with Mn2+
additive presence in the electrolyte has
yet to be investigated. Finally, examining the activation process of the MnO2 may also
lead to identification of properties previously unknown. The answers to these questions
will improve basic understanding of the system that would eventually serve as the
foundation for further optimization of the batteries. As such, in this chapter, different
scientific/technical perspectives of the battery systems including MnO2 crystal structure,
surface morphology, electronic states and electrochemical performance are systematically
27
studied. At the end, the results of these investigations are correlated and incorporated
with findings in previous publications to form a more refined and mature description of
the system.
3.2 Experimental Methods
3.2.1 Synthesis of α-Manganese Dioxide
The α–MnO2 nanorods were synthesized using a procedure demonstrated by
Pan et al. with minor modifications21
. First, 0.003 M MnSO4•H2O and 120 μL of H2SO4
were added to 40 mL of deionized distilled water (DDI) and magnetic stirred at 500 rpm
for 10 mins. Then 0.2218 g of KMnO4 was dissolved in another 30 mL of DDI to form a
dark purple solution. The KMnO4 solution was then slowly added to the MnSO4 solution
under stirring at 500 rpm. Upon addition of the KMnO4 solution, minimal amount of
brown precipitate will appear and the mixture was stirred in room temperature for another
2 hrs. The solution was then sealed within a Teflon lined hydrothermal synthesis
autoclave reactor and heated at 120 ºC for 12 hrs. The solvent would turn colorless and
transparent when the reaction is completed. The brown powder product was collected by
filtration and was washed by DDI and ethanol (EtOH). Lastly, they were dried in a
vacuum oven at 80 ºC for another 12 hrs before characterization and electrochemical
testing.
3.2.2 Preparation of Manganese Dioxide Electrode
First, α–MnO2 nanorods, Super P carbon and Polyvinylidene fluoride (PVDF)
were added to a glass vial in a weight ratio of 70:20:10 with N-Methyl-2-pyrrolidone
(NMP) as solvent. The weight ratio of the solvent and the solid material is 10:1. The
mixture is magnetically stirred at 500 rpm for 5 mins, and then at 300rpm overnight
(>12hrs) to obtain a homogeneous slurry. The slurry was then doctor blade coated onto a
carbon fiber paper to form the MnO2 electrode. The electrode was left to dry in ambient
air for over 2 hrs and then dried in a vacuum oven at 80 ºC overnight (>12hrs).
28
3.2.3 Preparation of Polymer-free/Self-standing Manganese Dioxide electrode
15 mg α–MnO2 nanorods and 5 mg carboxylate activated carbon nanotubes (CNT)
were first mixed in 40mL of EtOH. The dispersion is then sonicated for over 3 hrs in a
seal beaker. After sonication, the dispersion was filter onto a glass fiber (VWR, Glass
Microfibre Filter 691, 4.5cm diameter) to form the polymer-free electrode. The thin film
electrode was dried in ambient condition overnight (>12hrs) and weighted before use.
The active material loading is approximately 1.5mg cm-2
. To prepare the self-standing
electrode, the dispersion was filter onto polyethersulfone filter papers (Pall Corporations,
Supor® membrane), and then peeled off after the electrode was dried. Pure CNT films of
similar mass were prepared as reference using the exact same procedure, but without any
of the MnO2.
3.3 Results and Discussions
3.3.1 Characterization and Electrochemical Analysis of α-MnO2
The as-prepared MnO2 brown powders were first characterized by XRD, Raman
spectroscopy, SEM and TEM. As shown in the XRD result (Figure 3.1a), the MnO2
powder exhibit major diffraction peaks at 12.8º, 18.1º, 28.8º, 37.5º, 42.0º, 49.9º, 56.4º,
60.3º, 69.7º and 78.6º, corresponding to the (110), (200), (310), (211), (301), (411), (600),
(521), (541) and (332) diffraction, respectively. The result aligns entirely with the peaks
of α-MnO2 reference (JCPDS: 44-0141), confirming the crystal phase of the sample. The
adsorption peaks at 183, 383, 576 and 640 cm-1
measured in the Raman spectroscopy
(Figure 3.1b) resemble the ones that have been previously reported. They were assigned
to the external vibration of the MnO6 translation motion, Mn-O bending mode and the
latter two peaks are proposed to be originated from the lattice breathing vibration120,121
.
SEM image of the α-MnO2 (Figure 3.1c) shows that they have a nanotube-like
morphology, with widths ranging between 20 to 100 nm and lengths between of 1 to
5 μm. TEM image of the α-MnO2 nanorods (Figure 3.1d) also displays similar findings
on the material dimensionality. Additionally, it shows that some of the nanorods may
have a hollow interior. The observed morphology of the α-MnO2 also matches well with
previously reported results.21
29
Figure 3.1 a) XRD analysis b) Raman spectrum, c) SEM image and d) TEM image of α-MnO2 nanotubes.
After confirming the identity of the α-MnO2 nanotubes, they were prepared into a
standard electrode by doctor blade coating and were assembled into coin cells with a zinc
plate anode using 2 M ZnSO4 electrolyte with or without 0.1 M MnSO4 additive. The
open circuit voltage (OCV) of these batteries ranges between 1.40-1.45 V and often
lowers to near 1.38 V after prolong periods of resting. Figure 3.2a is the first two charge
and discharge curves of the two batteries under 1 C drain. Aside for minor differences in
the total specific capacity, there are very little differences between the discharge curves
of the two batteries. In the first discharge sequence, the voltages of both batteries would
first quickly fall from OCV to 1.20V-1.25 V and remain relatively constant until near the
end of the discharge process, when the voltage will fall sharply to 1.0 V. In the second
cycle, the discharge curve changes into one with two plateaus locating at 1.45 V and
1.35 V, which have been assigned to the conversion reaction and Zn-intercalation
reactions, respectively.112
Though, the reasons for the change between the first and
second cycle remains unresolved. As for the charging curves, two plateaus can be found
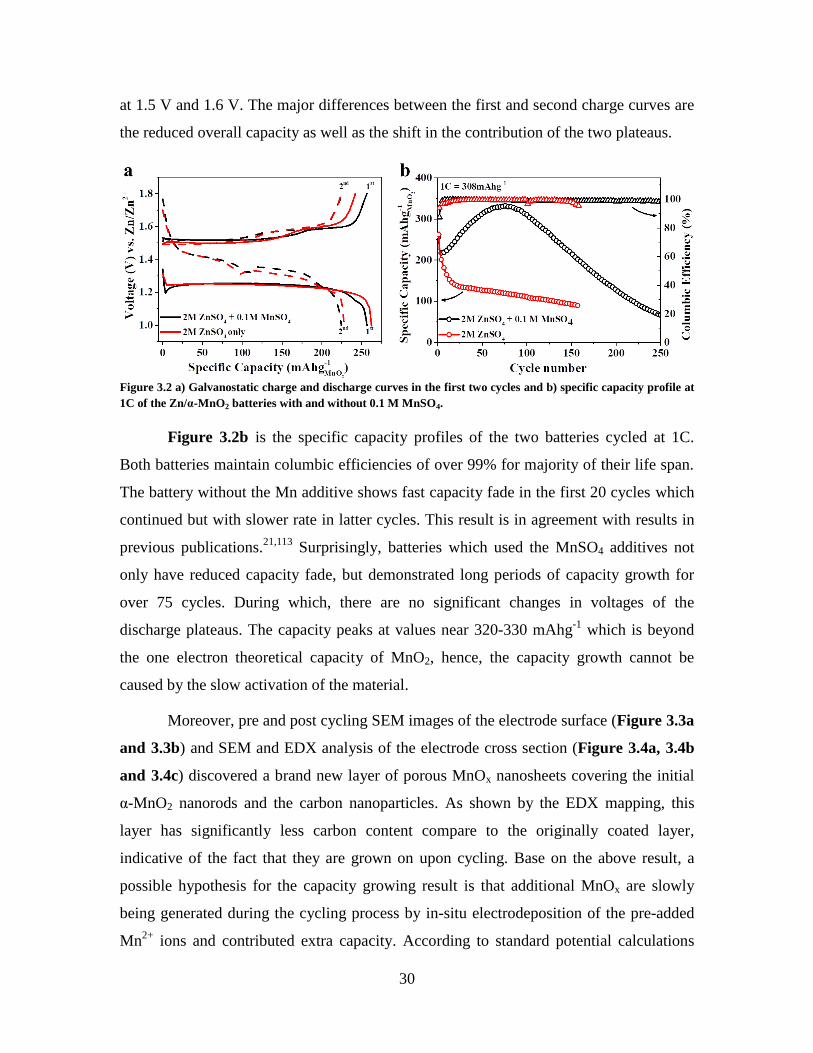
30
at 1.5 V and 1.6 V. The major differences between the first and second charge curves are
the reduced overall capacity as well as the shift in the contribution of the two plateaus.
Figure 3.2 a) Galvanostatic charge and discharge curves in the first two cycles and b) specific capacity profile at
1C of the Zn/α-MnO2 batteries with and without 0.1 M MnSO4.
Figure 3.2b is the specific capacity profiles of the two batteries cycled at 1C.
Both batteries maintain columbic efficiencies of over 99% for majority of their life span.
The battery without the Mn additive shows fast capacity fade in the first 20 cycles which
continued but with slower rate in latter cycles. This result is in agreement with results in
previous publications.21,113
Surprisingly, batteries which used the MnSO4 additives not
only have reduced capacity fade, but demonstrated long periods of capacity growth for
over 75 cycles. During which, there are no significant changes in voltages of the
discharge plateaus. The capacity peaks at values near 320-330 mAhg-1
which is beyond
the one electron theoretical capacity of MnO2, hence, the capacity growth cannot be
caused by the slow activation of the material.
Moreover, pre and post cycling SEM images of the electrode surface (Figure 3.3a
and 3.3b) and SEM and EDX analysis of the electrode cross section (Figure 3.4a, 3.4b
and 3.4c) discovered a brand new layer of porous MnOx nanosheets covering the initial
α-MnO2 nanorods and the carbon nanoparticles. As shown by the EDX mapping, this
layer has significantly less carbon content compare to the originally coated layer,
indicative of the fact that they are grown on upon cycling. Base on the above result, a
possible hypothesis for the capacity growing result is that additional MnOx are slowly
being generated during the cycling process by in-situ electrodeposition of the pre-added
Mn2+
ions and contributed extra capacity. According to standard potential calculations
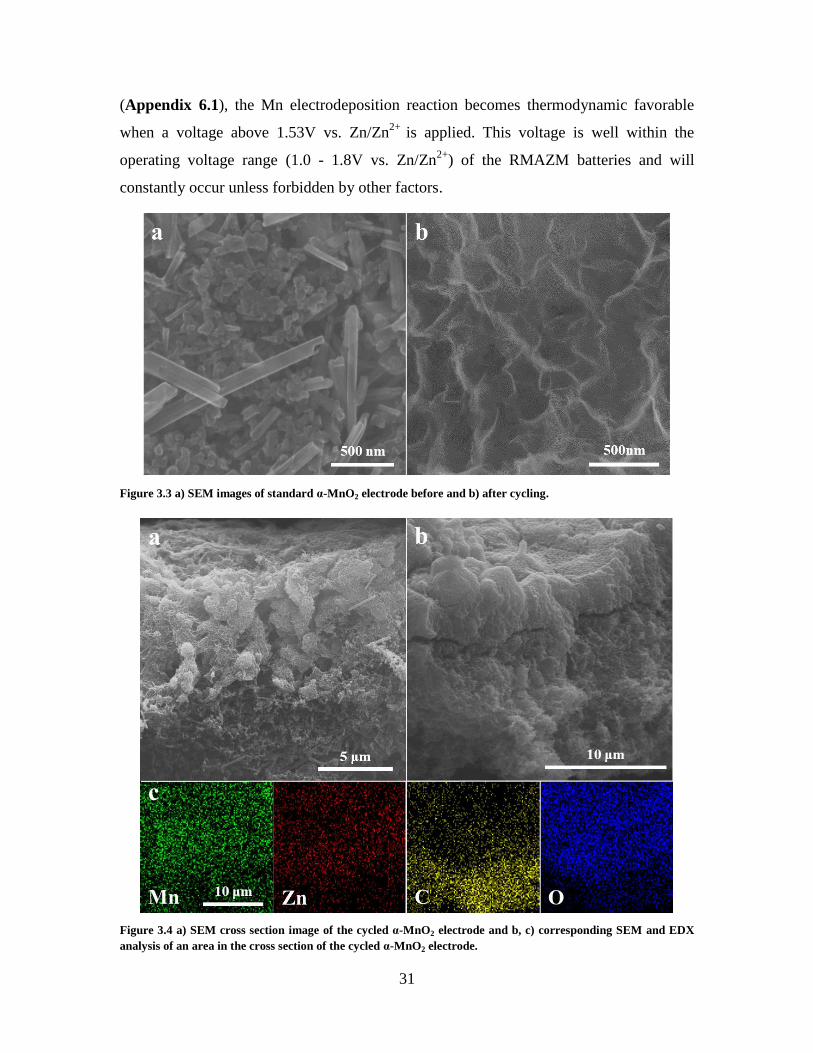
31
(Appendix 6.1), the Mn electrodeposition reaction becomes thermodynamic favorable
when a voltage above 1.53V vs. Zn/Zn2+
is applied. This voltage is well within the
operating voltage range (1.0 - 1.8V vs. Zn/Zn2+
) of the RMAZM batteries and will
constantly occur unless forbidden by other factors.
Figure 3.3 a) SEM images of standard α-MnO2 electrode before and b) after cycling.
Figure 3.4 a) SEM cross section image of the cycled α-MnO2 electrode and b, c) corresponding SEM and EDX
analysis of an area in the cross section of the cycled α-MnO2 electrode.
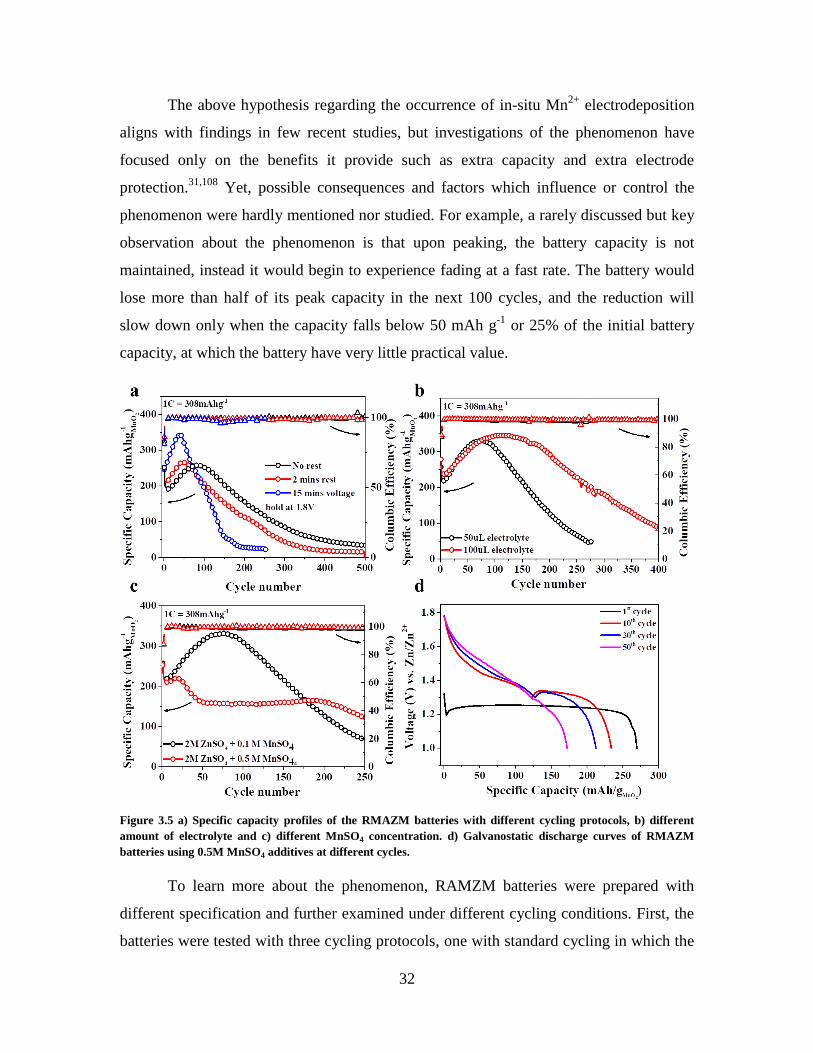
32
The above hypothesis regarding the occurrence of in-situ Mn2+
electrodeposition
aligns with findings in few recent studies, but investigations of the phenomenon have
focused only on the benefits it provide such as extra capacity and extra electrode
protection.31,108
Yet, possible consequences and factors which influence or control the
phenomenon were hardly mentioned nor studied. For example, a rarely discussed but key
observation about the phenomenon is that upon peaking, the battery capacity is not
maintained, instead it would begin to experience fading at a fast rate. The battery would
lose more than half of its peak capacity in the next 100 cycles, and the reduction will
slow down only when the capacity falls below 50 mAh g-1
or 25% of the initial battery
capacity, at which the battery have very little practical value.
Figure 3.5 a) Specific capacity profiles of the RMAZM batteries with different cycling protocols, b) different
amount of electrolyte and c) different MnSO4 concentration. d) Galvanostatic discharge curves of RMAZM
batteries using 0.5M MnSO4 additives at different cycles.
To learn more about the phenomenon, RAMZM batteries were prepared with
different specification and further examined under different cycling conditions. First, the
batteries were tested with three cycling protocols, one with standard cycling in which the
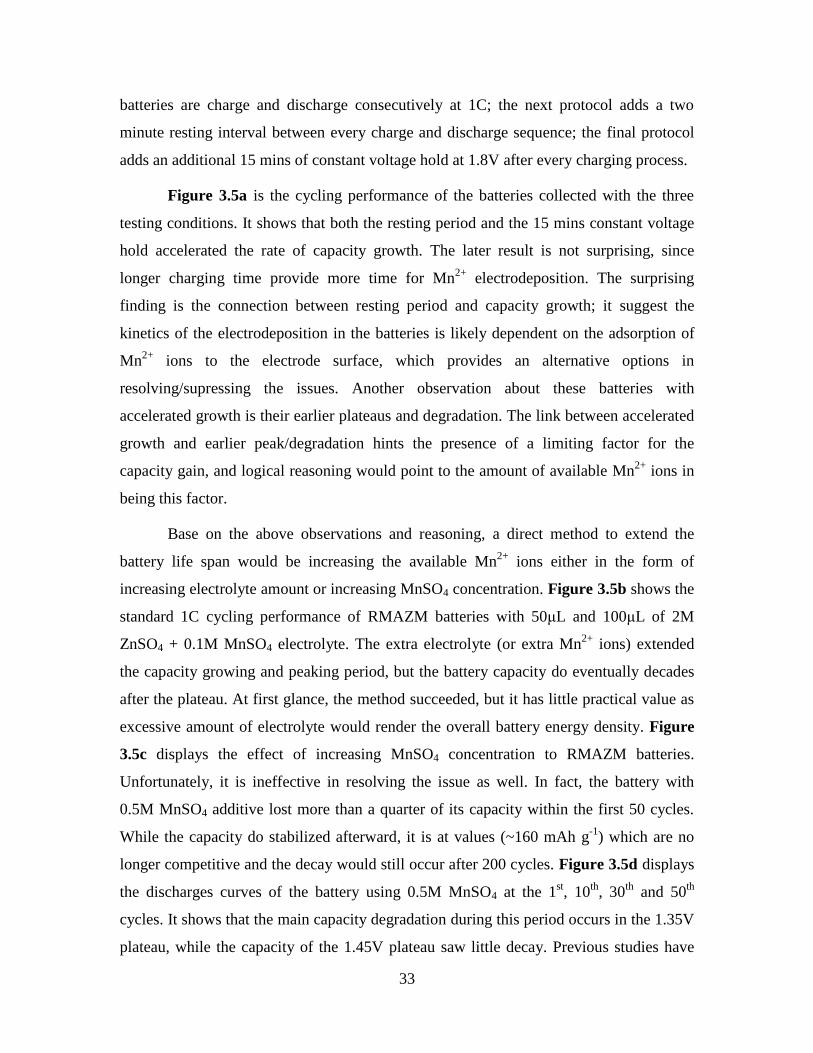
33
batteries are charge and discharge consecutively at 1C; the next protocol adds a two
minute resting interval between every charge and discharge sequence; the final protocol
adds an additional 15 mins of constant voltage hold at 1.8V after every charging process.
Figure 3.5a is the cycling performance of the batteries collected with the three
testing conditions. It shows that both the resting period and the 15 mins constant voltage
hold accelerated the rate of capacity growth. The later result is not surprising, since
longer charging time provide more time for Mn2+
electrodeposition. The surprising
finding is the connection between resting period and capacity growth; it suggest the
kinetics of the electrodeposition in the batteries is likely dependent on the adsorption of
Mn2+
ions to the electrode surface, which provides an alternative options in
resolving/supressing the issues. Another observation about these batteries with
accelerated growth is their earlier plateaus and degradation. The link between accelerated
growth and earlier peak/degradation hints the presence of a limiting factor for the
capacity gain, and logical reasoning would point to the amount of available Mn2+
ions in
being this factor.
Base on the above observations and reasoning, a direct method to extend the
battery life span would be increasing the available Mn2+
ions either in the form of
increasing electrolyte amount or increasing MnSO4 concentration. Figure 3.5b shows the
standard 1C cycling performance of RMAZM batteries with 50μL and 100μL of 2M
ZnSO4 + 0.1M MnSO4 electrolyte. The extra electrolyte (or extra Mn2+
ions) extended
the capacity growing and peaking period, but the battery capacity do eventually decades
after the plateau. At first glance, the method succeeded, but it has little practical value as
excessive amount of electrolyte would render the overall battery energy density. Figure
3.5c displays the effect of increasing MnSO4 concentration to RMAZM batteries.
Unfortunately, it is ineffective in resolving the issue as well. In fact, the battery with
0.5M MnSO4 additive lost more than a quarter of its capacity within the first 50 cycles.
While the capacity do stabilized afterward, it is at values (~160 mAh g-1
) which are no
longer competitive and the decay would still occur after 200 cycles. Figure 3.5d displays
the discharges curves of the battery using 0.5M MnSO4 at the 1st, 10
th, 30
th and 50
th
cycles. It shows that the main capacity degradation during this period occurs in the 1.35V
plateau, while the capacity of the 1.45V plateau saw little decay. Previous studies have
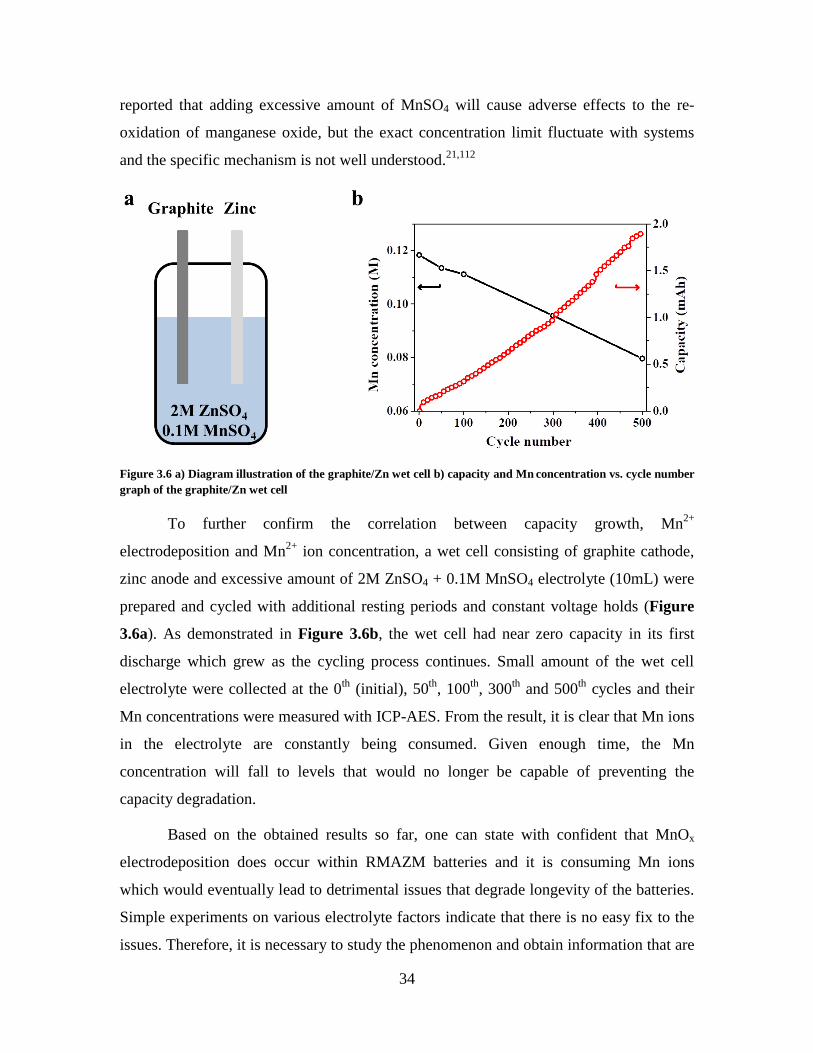
34
reported that adding excessive amount of MnSO4 will cause adverse effects to the re-
oxidation of manganese oxide, but the exact concentration limit fluctuate with systems
and the specific mechanism is not well understood.21,112
Figure 3.6 a) Diagram illustration of the graphite/Zn wet cell b) capacity and Mn concentration vs. cycle number
graph of the graphite/Zn wet cell
To further confirm the correlation between capacity growth, Mn2+
electrodeposition and Mn2+
ion concentration, a wet cell consisting of graphite cathode,
zinc anode and excessive amount of 2M ZnSO4 + 0.1M MnSO4 electrolyte (10mL) were
prepared and cycled with additional resting periods and constant voltage holds (Figure
3.6a). As demonstrated in Figure 3.6b, the wet cell had near zero capacity in its first
discharge which grew as the cycling process continues. Small amount of the wet cell
electrolyte were collected at the 0th
(initial), 50th
, 100th
, 300th
and 500th
cycles and their
Mn concentrations were measured with ICP-AES. From the result, it is clear that Mn ions
in the electrolyte are constantly being consumed. Given enough time, the Mn
concentration will fall to levels that would no longer be capable of preventing the
capacity degradation.
Based on the obtained results so far, one can state with confident that MnOx
electrodeposition does occur within RMAZM batteries and it is consuming Mn ions
which would eventually lead to detrimental issues that degrade longevity of the batteries.
Simple experiments on various electrolyte factors indicate that there is no easy fix to the
issues. Therefore, it is necessary to study the phenomenon and obtain information that are
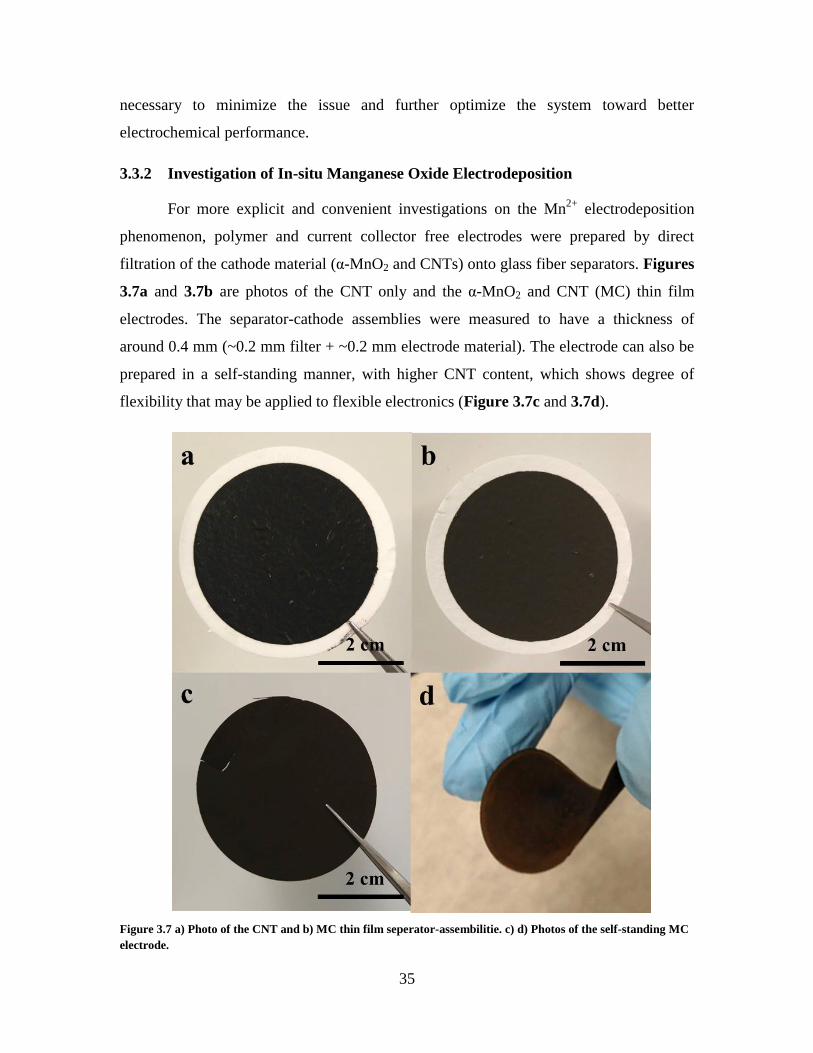
35
necessary to minimize the issue and further optimize the system toward better
electrochemical performance.
3.3.2 Investigation of In-situ Manganese Oxide Electrodeposition
For more explicit and convenient investigations on the Mn2+
electrodeposition
phenomenon, polymer and current collector free electrodes were prepared by direct
filtration of the cathode material (α-MnO2 and CNTs) onto glass fiber separators. Figures
3.7a and 3.7b are photos of the CNT only and the α-MnO2 and CNT (MC) thin film
electrodes. The separator-cathode assemblies were measured to have a thickness of
around 0.4 mm (~0.2 mm filter + ~0.2 mm electrode material). The electrode can also be
prepared in a self-standing manner, with higher CNT content, which shows degree of
flexibility that may be applied to flexible electronics (Figure 3.7c and 3.7d).
Figure 3.7 a) Photo of the CNT and b) MC thin film seperator-assembilitie. c) d) Photos of the self-standing MC
electrode.
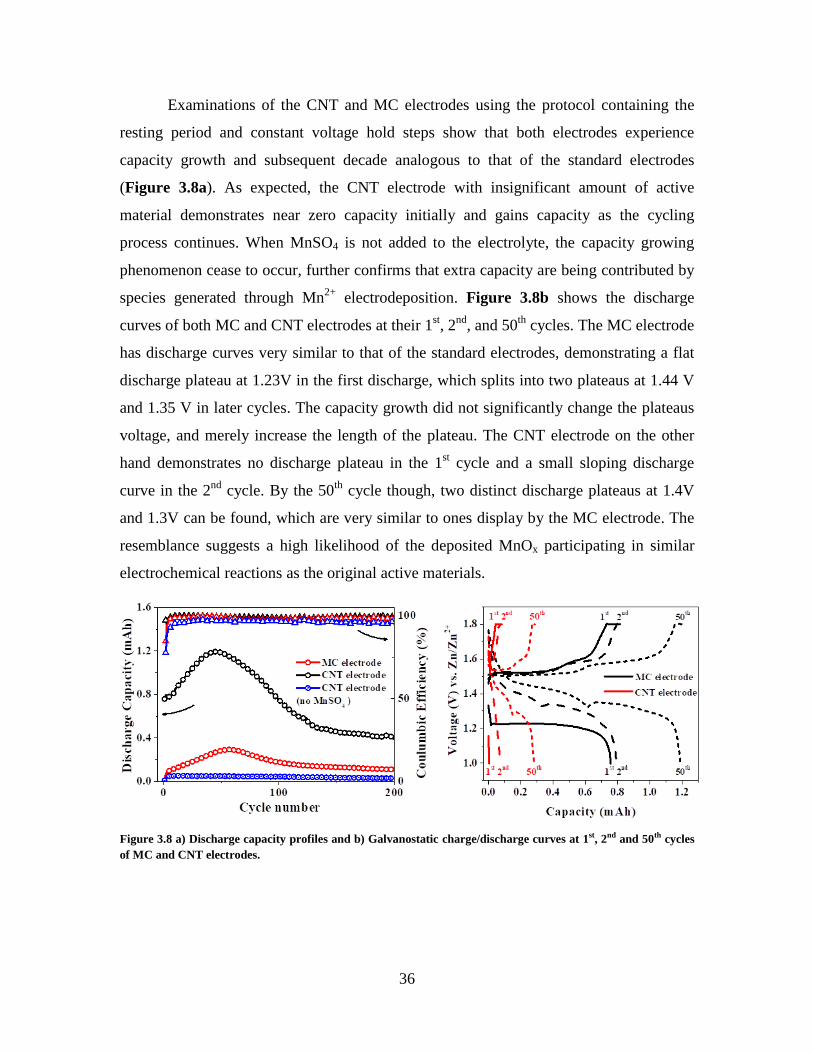
36
Examinations of the CNT and MC electrodes using the protocol containing the
resting period and constant voltage hold steps show that both electrodes experience
capacity growth and subsequent decade analogous to that of the standard electrodes
(Figure 3.8a). As expected, the CNT electrode with insignificant amount of active
material demonstrates near zero capacity initially and gains capacity as the cycling
process continues. When MnSO4 is not added to the electrolyte, the capacity growing
phenomenon cease to occur, further confirms that extra capacity are being contributed by
species generated through Mn2+
electrodeposition. Figure 3.8b shows the discharge
curves of both MC and CNT electrodes at their 1st, 2
nd, and 50
th cycles. The MC electrode
has discharge curves very similar to that of the standard electrodes, demonstrating a flat
discharge plateau at 1.23V in the first discharge, which splits into two plateaus at 1.44 V
and 1.35 V in later cycles. The capacity growth did not significantly change the plateaus
voltage, and merely increase the length of the plateau. The CNT electrode on the other
hand demonstrates no discharge plateau in the 1st cycle and a small sloping discharge
curve in the 2nd
cycle. By the 50th
cycle though, two distinct discharge plateaus at 1.4V
and 1.3V can be found, which are very similar to ones display by the MC electrode. The
resemblance suggests a high likelihood of the deposited MnOx participating in similar
electrochemical reactions as the original active materials.
Figure 3.8 a) Discharge capacity profiles and b) Galvanostatic charge/discharge curves at 1st, 2nd and 50th cycles
of MC and CNT electrodes.
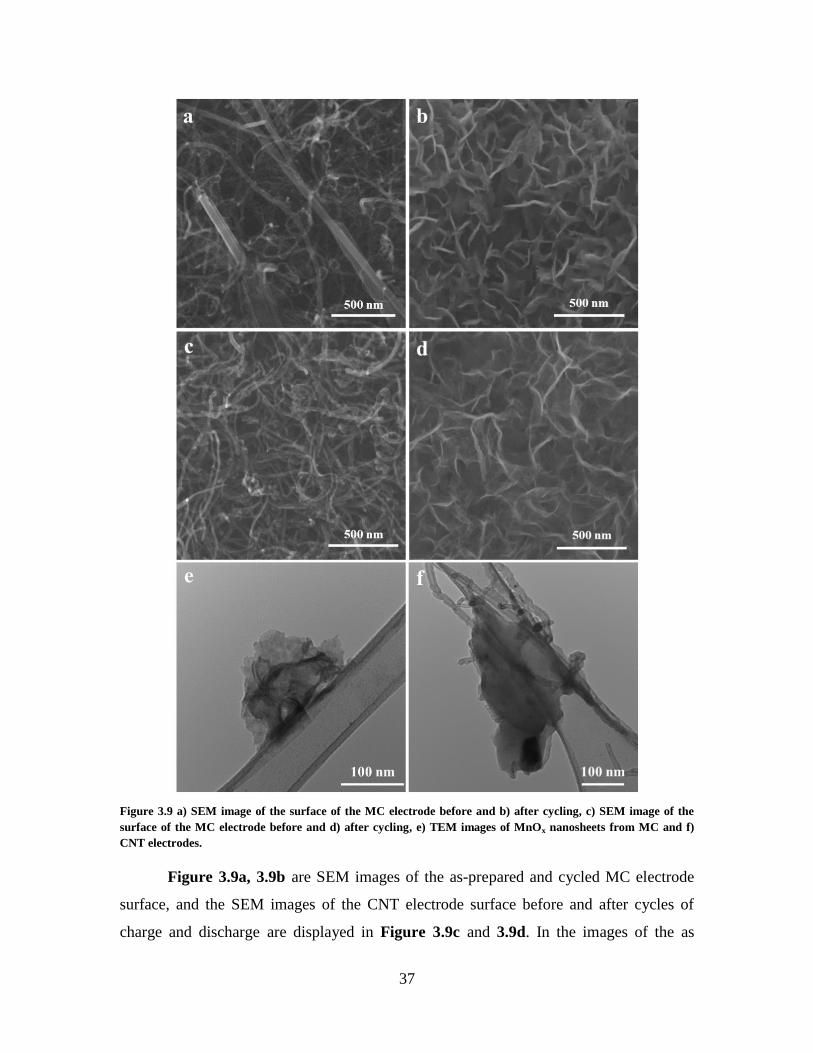
37
Figure 3.9 a) SEM image of the surface of the MC electrode before and b) after cycling, c) SEM image of the
surface of the MC electrode before and d) after cycling, e) TEM images of MnOx nanosheets from MC and f)
CNT electrodes.
Figure 3.9a, 3.9b are SEM images of the as-prepared and cycled MC electrode
surface, and the SEM images of the CNT electrode surface before and after cycles of
charge and discharge are displayed in Figure 3.9c and 3.9d. In the images of the as
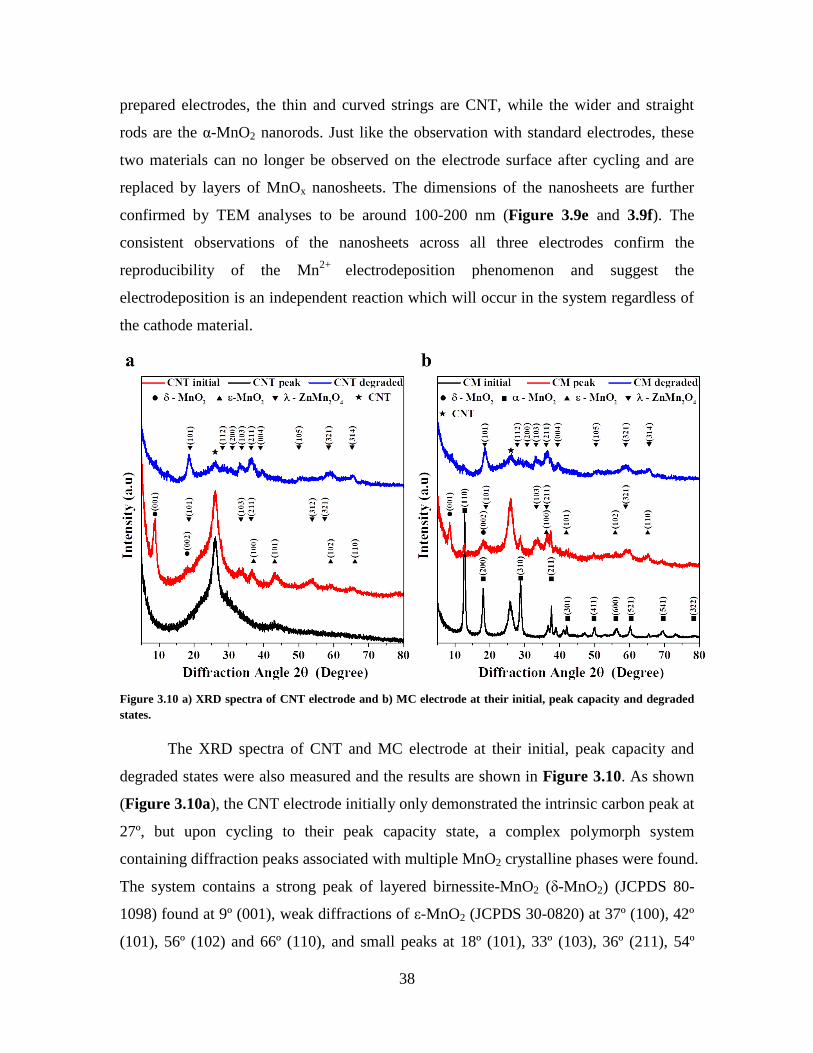
38
prepared electrodes, the thin and curved strings are CNT, while the wider and straight
rods are the α-MnO2 nanorods. Just like the observation with standard electrodes, these
two materials can no longer be observed on the electrode surface after cycling and are
replaced by layers of MnOx nanosheets. The dimensions of the nanosheets are further
confirmed by TEM analyses to be around 100-200 nm (Figure 3.9e and 3.9f). The
consistent observations of the nanosheets across all three electrodes confirm the
reproducibility of the Mn2+
electrodeposition phenomenon and suggest the
electrodeposition is an independent reaction which will occur in the system regardless of
the cathode material.
Figure 3.10 a) XRD spectra of CNT electrode and b) MC electrode at their initial, peak capacity and degraded
states.
The XRD spectra of CNT and MC electrode at their initial, peak capacity and
degraded states were also measured and the results are shown in Figure 3.10. As shown
(Figure 3.10a), the CNT electrode initially only demonstrated the intrinsic carbon peak at
27º, but upon cycling to their peak capacity state, a complex polymorph system
containing diffraction peaks associated with multiple MnO2 crystalline phases were found.
The system contains a strong peak of layered birnessite-MnO2 (δ-MnO2) (JCPDS 80-
1098) found at 9º (001), weak diffractions of ε-MnO2 (JCPDS 30-0820) at 37º (100), 42º
(101), 56º (102) and 66º (110), and small peaks at 18º (101), 33º (103), 36º (211), 54º
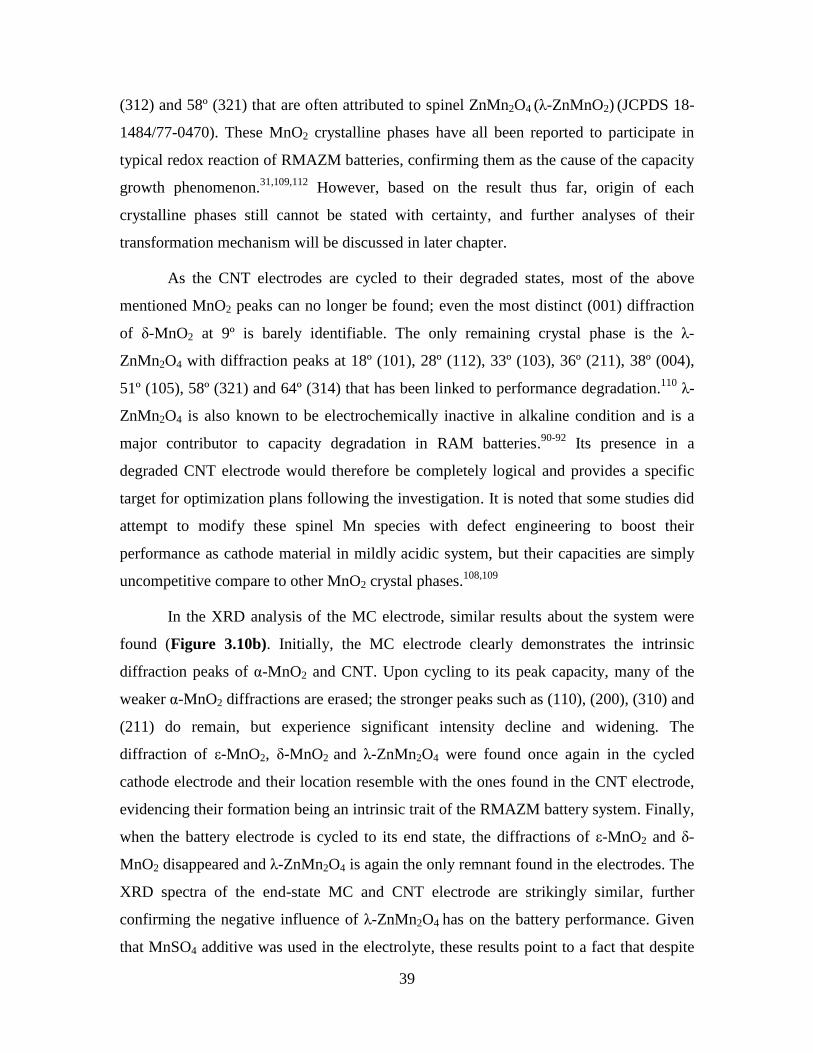
39
(312) and 58º (321) that are often attributed to spinel ZnMn2O4 (λ-ZnMnO2) (JCPDS 18-
1484/77-0470). These MnO2 crystalline phases have all been reported to participate in
typical redox reaction of RMAZM batteries, confirming them as the cause of the capacity
growth phenomenon.31,109,112
However, based on the result thus far, origin of each
crystalline phases still cannot be stated with certainty, and further analyses of their
transformation mechanism will be discussed in later chapter.
As the CNT electrodes are cycled to their degraded states, most of the above
mentioned MnO2 peaks can no longer be found; even the most distinct (001) diffraction
of δ-MnO2 at 9º is barely identifiable. The only remaining crystal phase is the λ-
ZnMn2O4 with diffraction peaks at 18º (101), 28º (112), 33º (103), 36º (211), 38º (004),
51º (105), 58º (321) and 64º (314) that has been linked to performance degradation.110
λ-
ZnMn2O4 is also known to be electrochemically inactive in alkaline condition and is a
major contributor to capacity degradation in RAM batteries.90-92
Its presence in a
degraded CNT electrode would therefore be completely logical and provides a specific
target for optimization plans following the investigation. It is noted that some studies did
attempt to modify these spinel Mn species with defect engineering to boost their
performance as cathode material in mildly acidic system, but their capacities are simply
uncompetitive compare to other MnO2 crystal phases.108,109
In the XRD analysis of the MC electrode, similar results about the system were
found (Figure 3.10b). Initially, the MC electrode clearly demonstrates the intrinsic
diffraction peaks of α-MnO2 and CNT. Upon cycling to its peak capacity, many of the
weaker α-MnO2 diffractions are erased; the stronger peaks such as (110), (200), (310) and
(211) do remain, but experience significant intensity decline and widening. The
diffraction of ε-MnO2, δ-MnO2 and λ-ZnMn2O4 were found once again in the cycled
cathode electrode and their location resemble with the ones found in the CNT electrode,
evidencing their formation being an intrinsic trait of the RMAZM battery system. Finally,
when the battery electrode is cycled to its end state, the diffractions of ε-MnO2 and δ-
MnO2 disappeared and λ-ZnMn2O4 is again the only remnant found in the electrodes. The
XRD spectra of the end-state MC and CNT electrode are strikingly similar, further
confirming the negative influence of λ-ZnMn2O4 has on the battery performance. Given
that MnSO4 additive was used in the electrolyte, these results point to a fact that despite
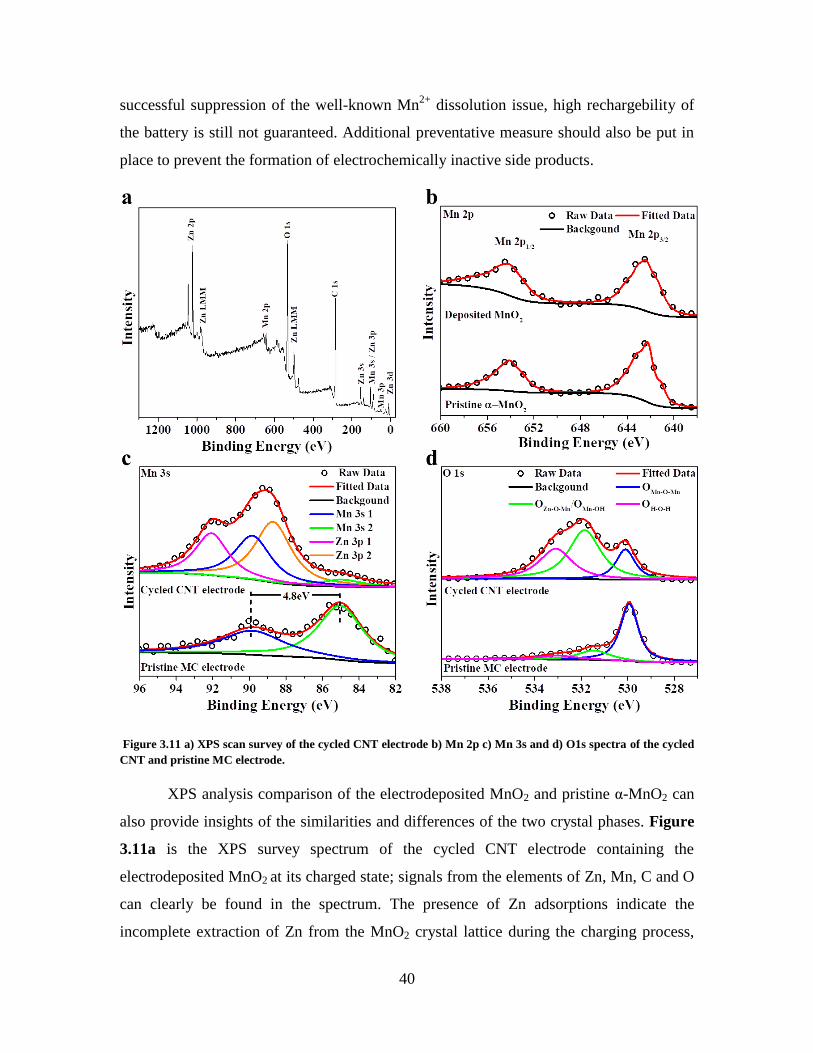
40
successful suppression of the well-known Mn2+
dissolution issue, high rechargebility of
the battery is still not guaranteed. Additional preventative measure should also be put in
place to prevent the formation of electrochemically inactive side products.
Figure 3.11 a) XPS scan survey of the cycled CNT electrode b) Mn 2p c) Mn 3s and d) O1s spectra of the cycled
CNT and pristine MC electrode.
XPS analysis comparison of the electrodeposited MnO2 and pristine α-MnO2 can
also provide insights of the similarities and differences of the two crystal phases. Figure
3.11a is the XPS survey spectrum of the cycled CNT electrode containing the
electrodeposited MnO2 at its charged state; signals from the elements of Zn, Mn, C and O
can clearly be found in the spectrum. The presence of Zn adsorptions indicate the
incomplete extraction of Zn from the MnO2 crystal lattice during the charging process,
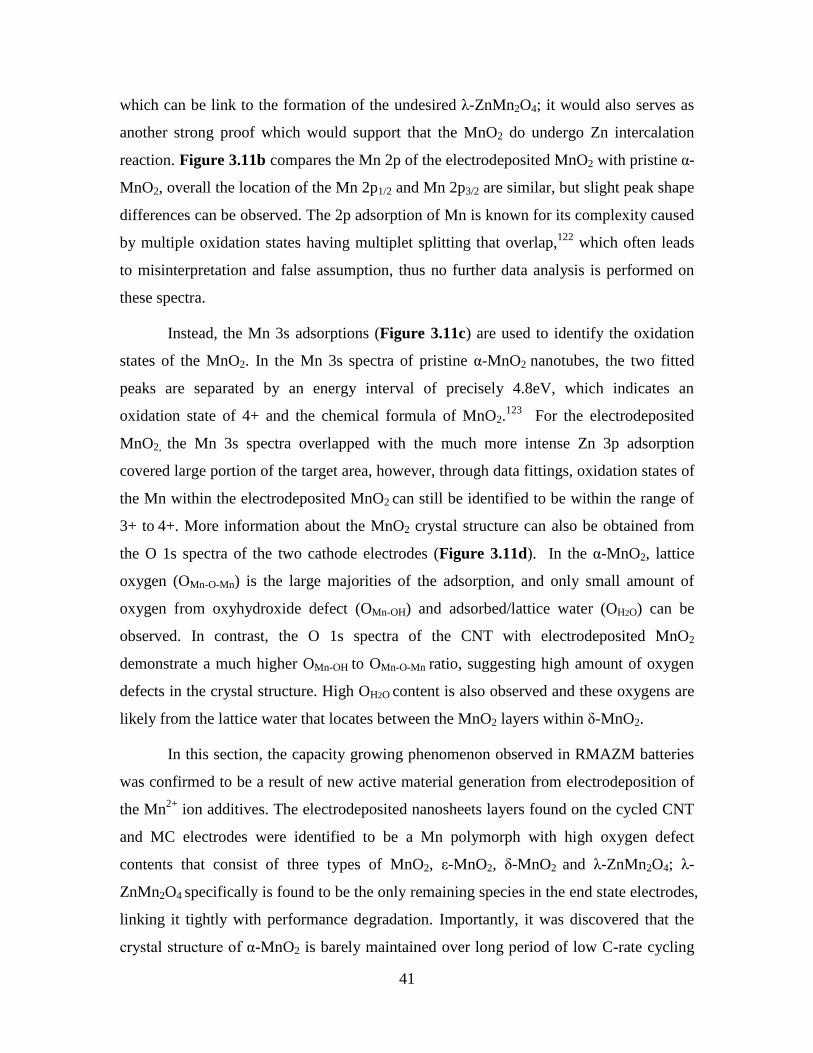
41
which can be link to the formation of the undesired λ-ZnMn2O4; it would also serves as
another strong proof which would support that the MnO2 do undergo Zn intercalation
reaction. Figure 3.11b compares the Mn 2p of the electrodeposited MnO2 with pristine α-
MnO2, overall the location of the Mn 2p1/2 and Mn 2p3/2 are similar, but slight peak shape
differences can be observed. The 2p adsorption of Mn is known for its complexity caused
by multiple oxidation states having multiplet splitting that overlap,122
which often leads
to misinterpretation and false assumption, thus no further data analysis is performed on
these spectra.
Instead, the Mn 3s adsorptions (Figure 3.11c) are used to identify the oxidation
states of the MnO2. In the Mn 3s spectra of pristine α-MnO2 nanotubes, the two fitted
peaks are separated by an energy interval of precisely 4.8eV, which indicates an
oxidation state of 4+ and the chemical formula of MnO2.123
For the electrodeposited
MnO2, the Mn 3s spectra overlapped with the much more intense Zn 3p adsorption
covered large portion of the target area, however, through data fittings, oxidation states of
the Mn within the electrodeposited MnO2 can still be identified to be within the range of
3+ to 4+. More information about the MnO2 crystal structure can also be obtained from
the O 1s spectra of the two cathode electrodes (Figure 3.11d). In the α-MnO2, lattice
oxygen (OMn-O-Mn) is the large majorities of the adsorption, and only small amount of
oxygen from oxyhydroxide defect (OMn-OH) and adsorbed/lattice water (OH2O) can be
observed. In contrast, the O 1s spectra of the CNT with electrodeposited MnO2
demonstrate a much higher OMn-OH to OMn-O-Mn ratio, suggesting high amount of oxygen
defects in the crystal structure. High OH2O content is also observed and these oxygens are
likely from the lattice water that locates between the MnO2 layers within δ-MnO2.
In this section, the capacity growing phenomenon observed in RMAZM batteries
was confirmed to be a result of new active material generation from electrodeposition of
the Mn2+
ion additives. The electrodeposited nanosheets layers found on the cycled CNT
and MC electrodes were identified to be a Mn polymorph with high oxygen defect
contents that consist of three types of MnO2, ε-MnO2, δ-MnO2 and λ-ZnMn2O4; λ-
ZnMn2O4 specifically is found to be the only remaining species in the end state electrodes,
linking it tightly with performance degradation. Importantly, it was discovered that the
crystal structure of α-MnO2 is barely maintained over long period of low C-rate cycling
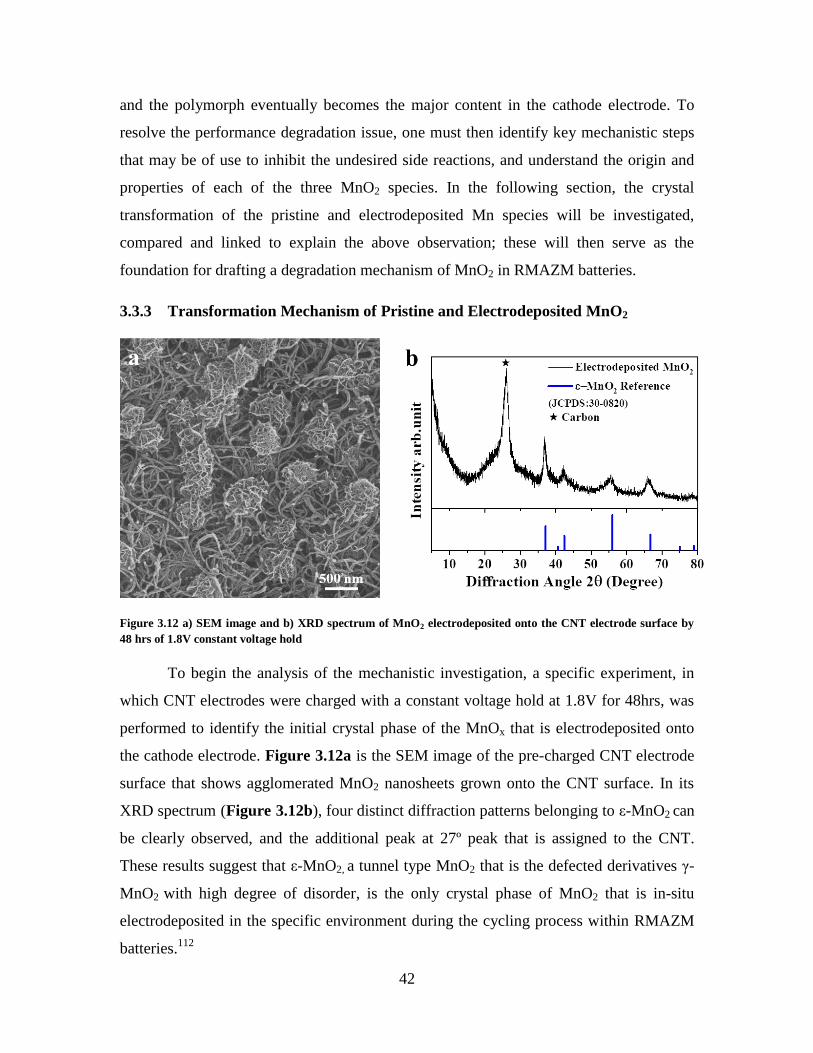
42
and the polymorph eventually becomes the major content in the cathode electrode. To
resolve the performance degradation issue, one must then identify key mechanistic steps
that may be of use to inhibit the undesired side reactions, and understand the origin and
properties of each of the three MnO2 species. In the following section, the crystal
transformation of the pristine and electrodeposited Mn species will be investigated,
compared and linked to explain the above observation; these will then serve as the
foundation for drafting a degradation mechanism of MnO2 in RMAZM batteries.
3.3.3 Transformation Mechanism of Pristine and Electrodeposited MnO2
Figure 3.12 a) SEM image and b) XRD spectrum of MnO2 electrodeposited onto the CNT electrode surface by
48 hrs of 1.8V constant voltage hold
To begin the analysis of the mechanistic investigation, a specific experiment, in
which CNT electrodes were charged with a constant voltage hold at 1.8V for 48hrs, was
performed to identify the initial crystal phase of the MnOx that is electrodeposited onto
the cathode electrode. Figure 3.12a is the SEM image of the pre-charged CNT electrode
surface that shows agglomerated MnO2 nanosheets grown onto the CNT surface. In its
XRD spectrum (Figure 3.12b), four distinct diffraction patterns belonging to ε-MnO2 can
be clearly observed, and the additional peak at 27º peak that is assigned to the CNT.
These results suggest that ε-MnO2, a tunnel type MnO2 that is the defected derivatives γ-
MnO2 with high degree of disorder, is the only crystal phase of MnO2 that is in-situ
electrodeposited in the specific environment during the cycling process within RMAZM
batteries.112
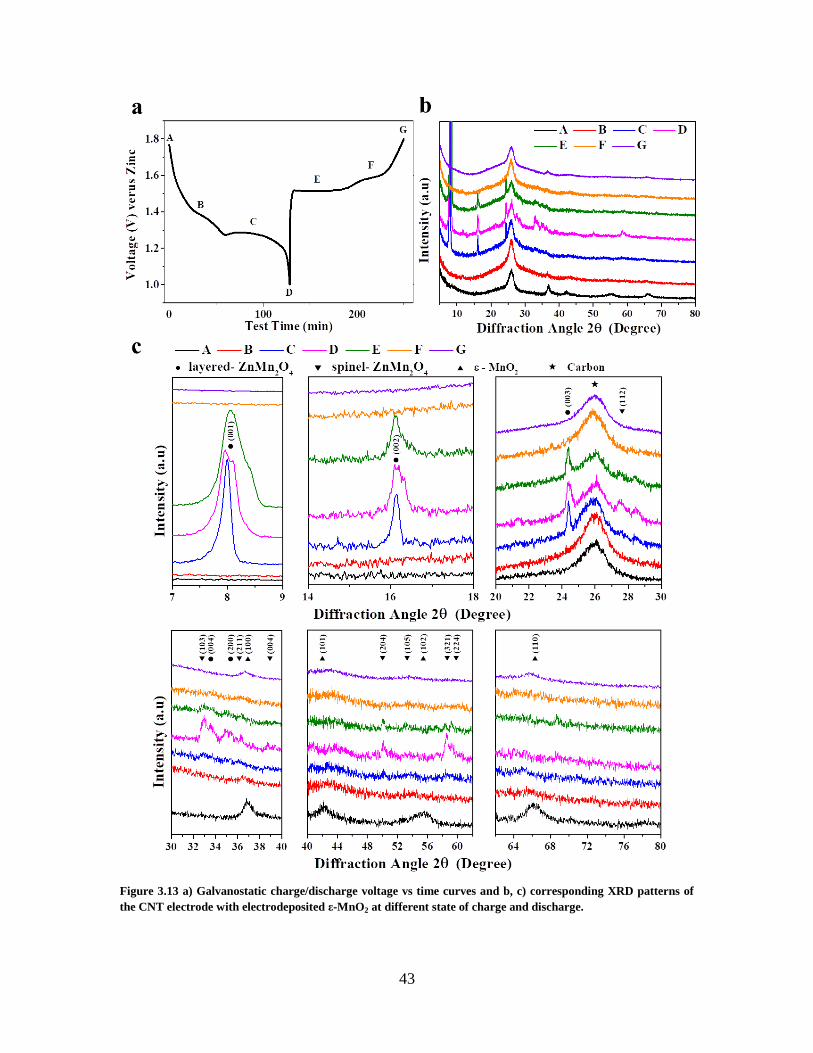
43
Figure 3.13 a) Galvanostatic charge/discharge voltage vs time curves and b, c) corresponding XRD patterns of
the CNT electrode with electrodeposited ε-MnO2 at different state of charge and discharge.
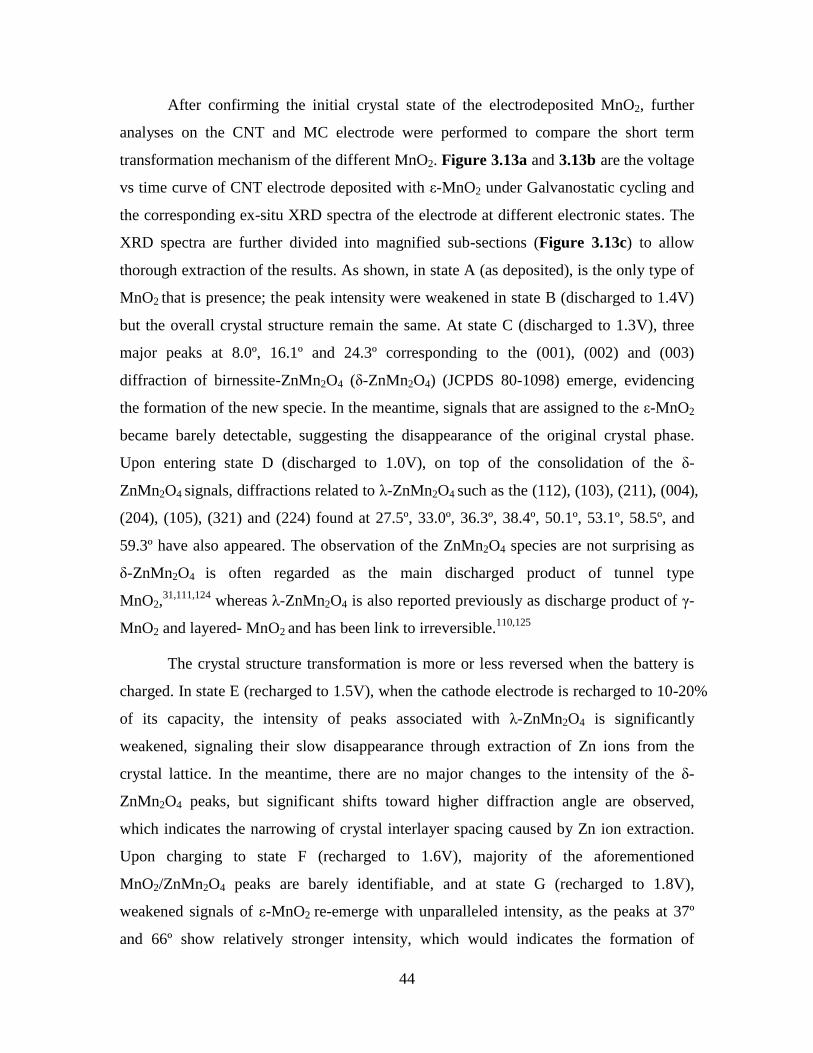
44
After confirming the initial crystal state of the electrodeposited MnO2, further
analyses on the CNT and MC electrode were performed to compare the short term
transformation mechanism of the different MnO2. Figure 3.13a and 3.13b are the voltage
vs time curve of CNT electrode deposited with ε-MnO2 under Galvanostatic cycling and
the corresponding ex-situ XRD spectra of the electrode at different electronic states. The
XRD spectra are further divided into magnified sub-sections (Figure 3.13c) to allow
thorough extraction of the results. As shown, in state A (as deposited), is the only type of
MnO2 that is presence; the peak intensity were weakened in state B (discharged to 1.4V)
but the overall crystal structure remain the same. At state C (discharged to 1.3V), three
major peaks at 8.0º, 16.1º and 24.3º corresponding to the (001), (002) and (003)
diffraction of birnessite-ZnMn2O4 (δ-ZnMn2O4) (JCPDS 80-1098) emerge, evidencing
the formation of the new specie. In the meantime, signals that are assigned to the ε-MnO2
became barely detectable, suggesting the disappearance of the original crystal phase.
Upon entering state D (discharged to 1.0V), on top of the consolidation of the δ-
ZnMn2O4 signals, diffractions related to λ-ZnMn2O4 such as the (112), (103), (211), (004),
(204), (105), (321) and (224) found at 27.5º, 33.0º, 36.3º, 38.4º, 50.1º, 53.1º, 58.5º, and
59.3º have also appeared. The observation of the ZnMn2O4 species are not surprising as
δ-ZnMn2O4 is often regarded as the main discharged product of tunnel type
MnO2,31,111,124
whereas λ-ZnMn2O4 is also reported previously as discharge product of γ-
MnO2 and layered- MnO2 and has been link to irreversible.110,125
The crystal structure transformation is more or less reversed when the battery is
charged. In state E (recharged to 1.5V), when the cathode electrode is recharged to 10-20%
of its capacity, the intensity of peaks associated with λ-ZnMn2O4 is significantly
weakened, signaling their slow disappearance through extraction of Zn ions from the
crystal lattice. In the meantime, there are no major changes to the intensity of the δ-
ZnMn2O4 peaks, but significant shifts toward higher diffraction angle are observed,
which indicates the narrowing of crystal interlayer spacing caused by Zn ion extraction.
Upon charging to state F (recharged to 1.6V), majority of the aforementioned
MnO2/ZnMn2O4 peaks are barely identifiable, and at state G (recharged to 1.8V),
weakened signals of ε-MnO2 re-emerge with unparalleled intensity, as the peaks at 37º
and 66º show relatively stronger intensity, which would indicates the formation of
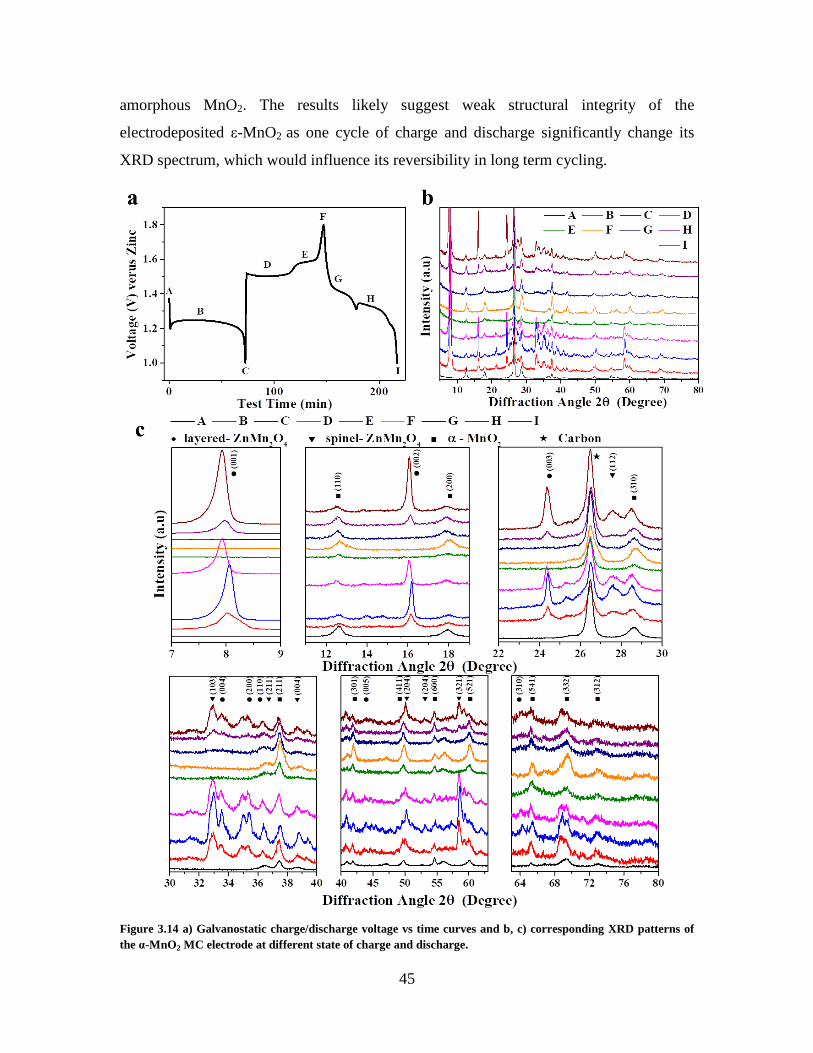
45
amorphous MnO2. The results likely suggest weak structural integrity of the
electrodeposited ε-MnO2 as one cycle of charge and discharge significantly change its
XRD spectrum, which would influence its reversibility in long term cycling.
Figure 3.14 a) Galvanostatic charge/discharge voltage vs time curves and b, c) corresponding XRD patterns of
the α-MnO2 MC electrode at different state of charge and discharge.
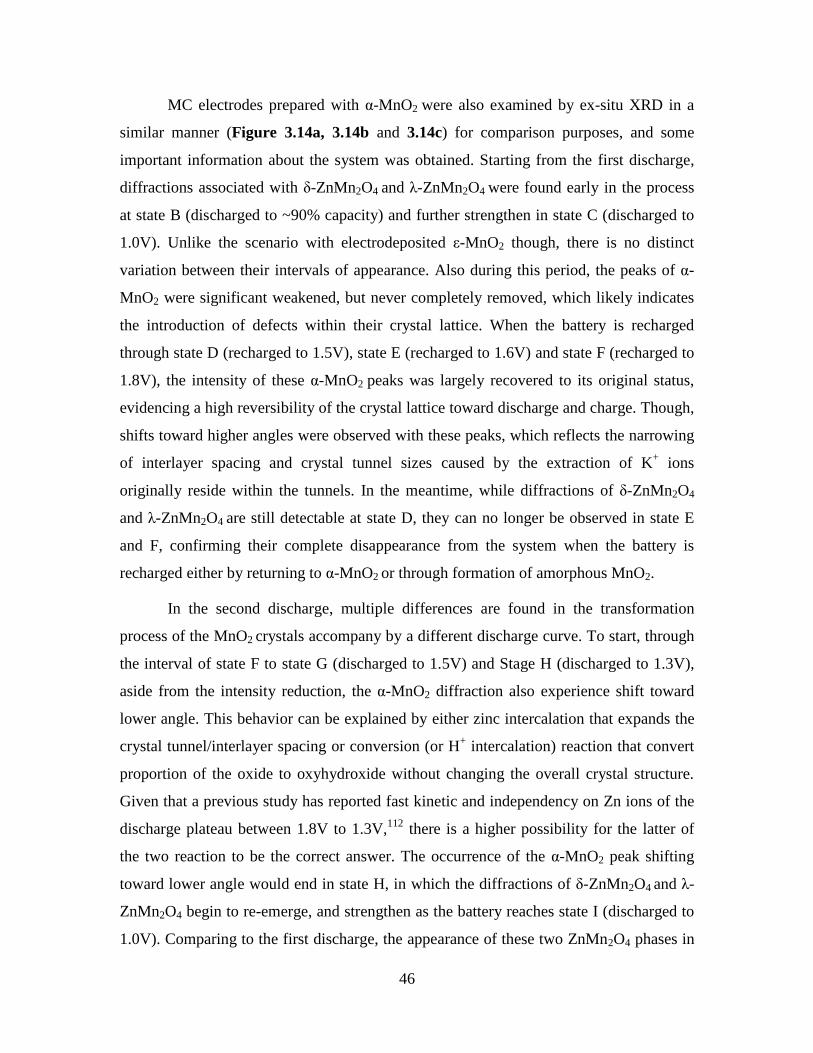
46
MC electrodes prepared with α-MnO2 were also examined by ex-situ XRD in a
similar manner (Figure 3.14a, 3.14b and 3.14c) for comparison purposes, and some
important information about the system was obtained. Starting from the first discharge,
diffractions associated with δ-ZnMn2O4 and λ-ZnMn2O4 were found early in the process
at state B (discharged to ~90% capacity) and further strengthen in state C (discharged to
1.0V). Unlike the scenario with electrodeposited ε-MnO2 though, there is no distinct
variation between their intervals of appearance. Also during this period, the peaks of α-
MnO2 were significant weakened, but never completely removed, which likely indicates
the introduction of defects within their crystal lattice. When the battery is recharged
through state D (recharged to 1.5V), state E (recharged to 1.6V) and state F (recharged to
1.8V), the intensity of these α-MnO2 peaks was largely recovered to its original status,
evidencing a high reversibility of the crystal lattice toward discharge and charge. Though,
shifts toward higher angles were observed with these peaks, which reflects the narrowing
of interlayer spacing and crystal tunnel sizes caused by the extraction of K+ ions
originally reside within the tunnels. In the meantime, while diffractions of δ-ZnMn2O4
and λ-ZnMn2O4 are still detectable at state D, they can no longer be observed in state E
and F, confirming their complete disappearance from the system when the battery is
recharged either by returning to α-MnO2 or through formation of amorphous MnO2.
In the second discharge, multiple differences are found in the transformation
process of the MnO2 crystals accompany by a different discharge curve. To start, through
the interval of state F to state G (discharged to 1.5V) and Stage H (discharged to 1.3V),
aside from the intensity reduction, the α-MnO2 diffraction also experience shift toward
lower angle. This behavior can be explained by either zinc intercalation that expands the
crystal tunnel/interlayer spacing or conversion (or H+ intercalation) reaction that convert
proportion of the oxide to oxyhydroxide without changing the overall crystal structure.
Given that a previous study has reported fast kinetic and independency on Zn ions of the
discharge plateau between 1.8V to 1.3V,112
there is a higher possibility for the latter of
the two reaction to be the correct answer. The occurrence of the α-MnO2 peak shifting
toward lower angle would end in state H, in which the diffractions of δ-ZnMn2O4 and λ-
ZnMn2O4 begin to re-emerge, and strengthen as the battery reaches state I (discharged to
1.0V). Comparing to the first discharge, the appearance of these two ZnMn2O4 phases in
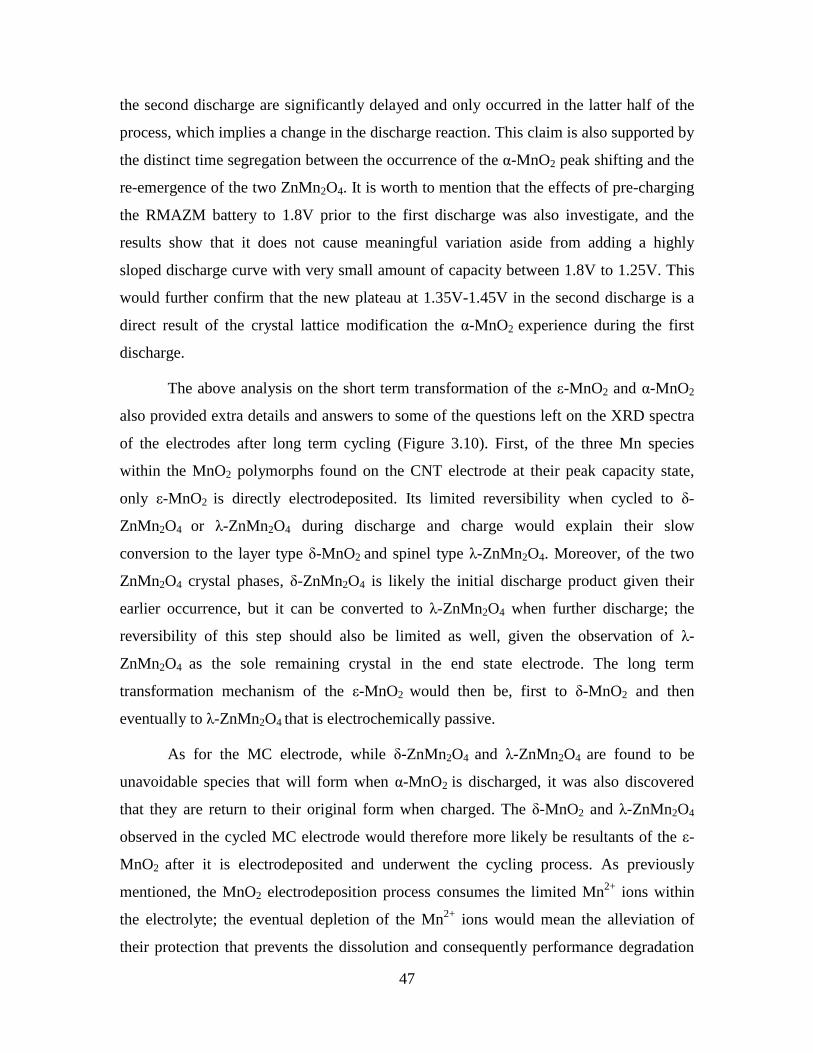
47
the second discharge are significantly delayed and only occurred in the latter half of the
process, which implies a change in the discharge reaction. This claim is also supported by
the distinct time segregation between the occurrence of the α-MnO2 peak shifting and the
re-emergence of the two ZnMn2O4. It is worth to mention that the effects of pre-charging
the RMAZM battery to 1.8V prior to the first discharge was also investigate, and the
results show that it does not cause meaningful variation aside from adding a highly
sloped discharge curve with very small amount of capacity between 1.8V to 1.25V. This
would further confirm that the new plateau at 1.35V-1.45V in the second discharge is a
direct result of the crystal lattice modification the α-MnO2 experience during the first
discharge.
The above analysis on the short term transformation of the ε-MnO2 and α-MnO2
also provided extra details and answers to some of the questions left on the XRD spectra
of the electrodes after long term cycling (Figure 3.10). First, of the three Mn species
within the MnO2 polymorphs found on the CNT electrode at their peak capacity state,
only ε-MnO2 is directly electrodeposited. Its limited reversibility when cycled to δ-
ZnMn2O4 or λ-ZnMn2O4 during discharge and charge would explain their slow
conversion to the layer type δ-MnO2 and spinel type λ-ZnMn2O4. Moreover, of the two
ZnMn2O4 crystal phases, δ-ZnMn2O4 is likely the initial discharge product given their
earlier occurrence, but it can be converted to λ-ZnMn2O4 when further discharge; the
reversibility of this step should also be limited as well, given the observation of λ-
ZnMn2O4 as the sole remaining crystal in the end state electrode. The long term
transformation mechanism of the ε-MnO2 would then be, first to δ-MnO2 and then
eventually to λ-ZnMn2O4 that is electrochemically passive.
As for the MC electrode, while δ-ZnMn2O4 and λ-ZnMn2O4 are found to be
unavoidable species that will form when α-MnO2 is discharged, it was also discovered
that they are return to their original form when charged. The δ-MnO2 and λ-ZnMn2O4
observed in the cycled MC electrode would therefore more likely be resultants of the ε-
MnO2 after it is electrodeposited and underwent the cycling process. As previously
mentioned, the MnO2 electrodeposition process consumes the limited Mn2+
ions within
the electrolyte; the eventual depletion of the Mn2+
ions would mean the alleviation of
their protection that prevents the dissolution and consequently performance degradation
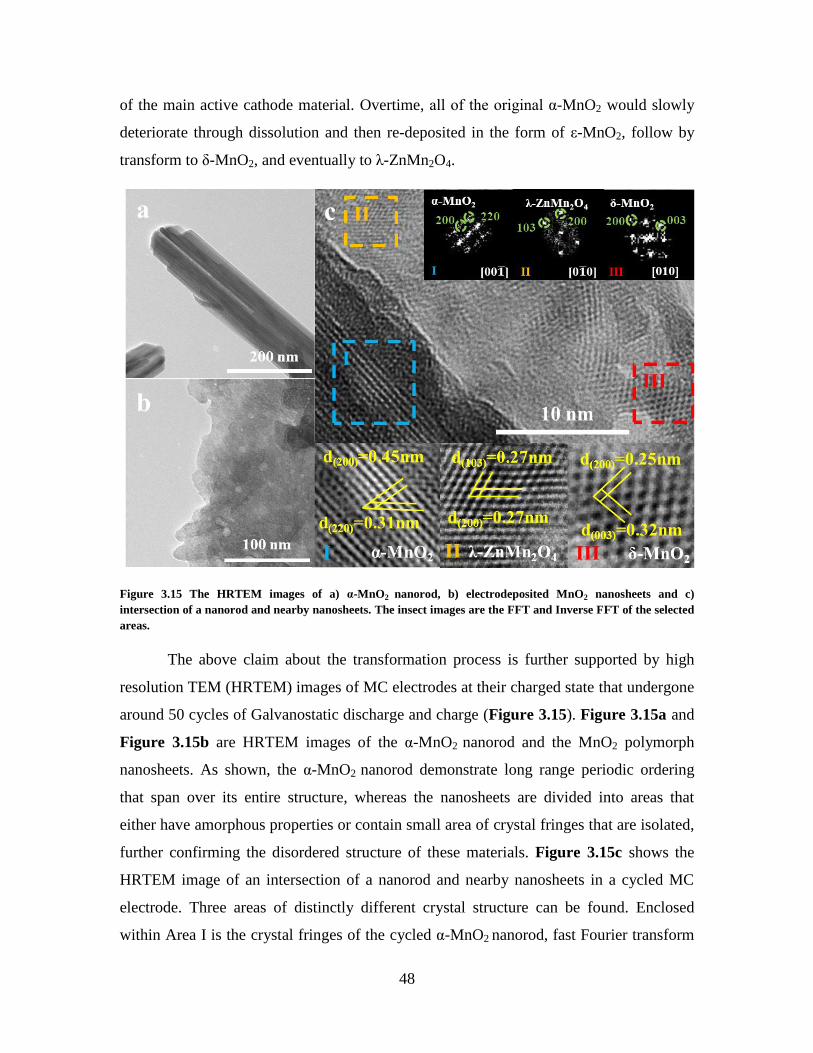
48
of the main active cathode material. Overtime, all of the original α-MnO2 would slowly
deteriorate through dissolution and then re-deposited in the form of ε-MnO2, follow by
transform to δ-MnO2, and eventually to λ-ZnMn2O4.
Figure 3.15 The HRTEM images of a) α-MnO2 nanorod, b) electrodeposited MnO2 nanosheets and c)
intersection of a nanorod and nearby nanosheets. The insect images are the FFT and Inverse FFT of the selected
areas.
The above claim about the transformation process is further supported by high
resolution TEM (HRTEM) images of MC electrodes at their charged state that undergone
around 50 cycles of Galvanostatic discharge and charge (Figure 3.15). Figure 3.15a and
Figure 3.15b are HRTEM images of the α-MnO2 nanorod and the MnO2 polymorph
nanosheets. As shown, the α-MnO2 nanorod demonstrate long range periodic ordering
that span over its entire structure, whereas the nanosheets are divided into areas that
either have amorphous properties or contain small area of crystal fringes that are isolated,
further confirming the disordered structure of these materials. Figure 3.15c shows the
HRTEM image of an intersection of a nanorod and nearby nanosheets in a cycled MC
electrode. Three areas of distinctly different crystal structure can be found. Enclosed
within Area I is the crystal fringes of the cycled α-MnO2 nanorod, fast Fourier transform
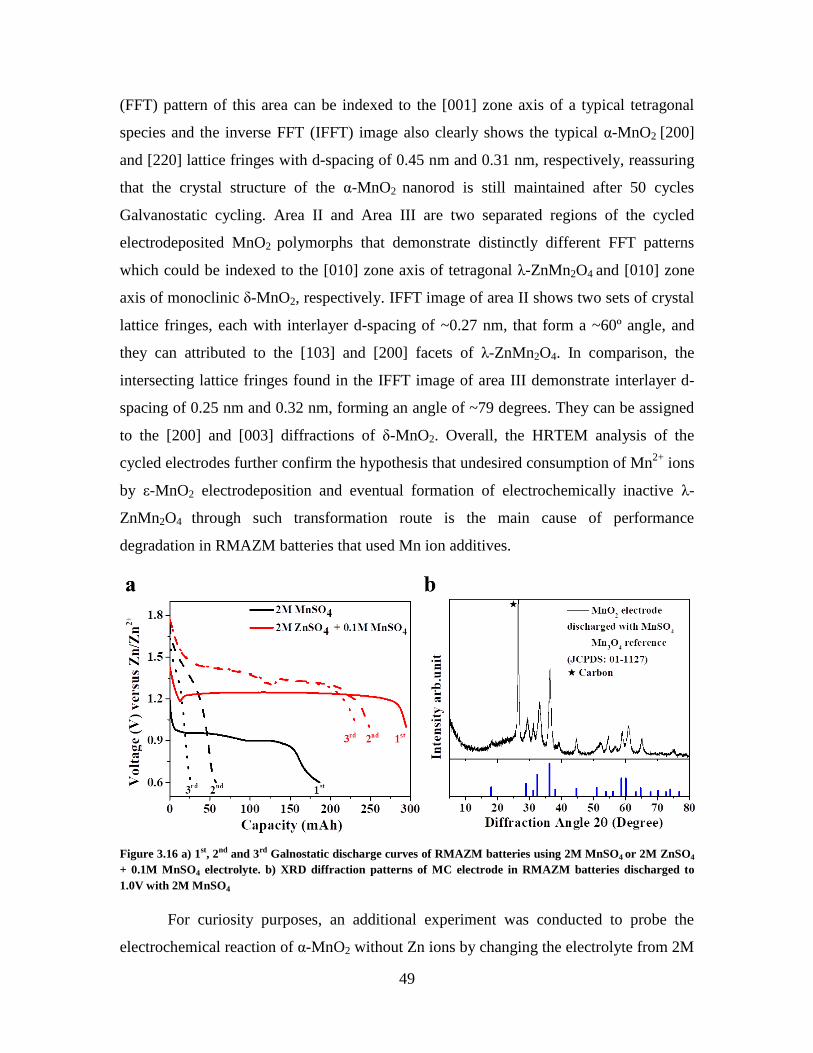
49
(FFT) pattern of this area can be indexed to the [001] zone axis of a typical tetragonal
species and the inverse FFT (IFFT) image also clearly shows the typical α-MnO2 [200]
and [220] lattice fringes with d-spacing of 0.45 nm and 0.31 nm, respectively, reassuring
that the crystal structure of the α-MnO2 nanorod is still maintained after 50 cycles
Galvanostatic cycling. Area II and Area III are two separated regions of the cycled
electrodeposited MnO2 polymorphs that demonstrate distinctly different FFT patterns
which could be indexed to the [010] zone axis of tetragonal λ-ZnMn2O4 and [010] zone
axis of monoclinic δ-MnO2, respectively. IFFT image of area II shows two sets of crystal
lattice fringes, each with interlayer d-spacing of ~0.27 nm, that form a ~60º angle, and
they can attributed to the [103] and [200] facets of λ-ZnMn2O4. In comparison, the
intersecting lattice fringes found in the IFFT image of area III demonstrate interlayer d-
spacing of 0.25 nm and 0.32 nm, forming an angle of ~79 degrees. They can be assigned
to the [200] and [003] diffractions of δ-MnO2. Overall, the HRTEM analysis of the
cycled electrodes further confirm the hypothesis that undesired consumption of Mn2+
ions
by ε-MnO2 electrodeposition and eventual formation of electrochemically inactive λ-
ZnMn2O4 through such transformation route is the main cause of performance
degradation in RMAZM batteries that used Mn ion additives.
Figure 3.16 a) 1st, 2nd and 3rd Galnostatic discharge curves of RMAZM batteries using 2M MnSO4 or 2M ZnSO4
+ 0.1M MnSO4 electrolyte. b) XRD diffraction patterns of MC electrode in RMAZM batteries discharged to
1.0V with 2M MnSO4
For curiosity purposes, an additional experiment was conducted to probe the
electrochemical reaction of α-MnO2 without Zn ions by changing the electrolyte from 2M
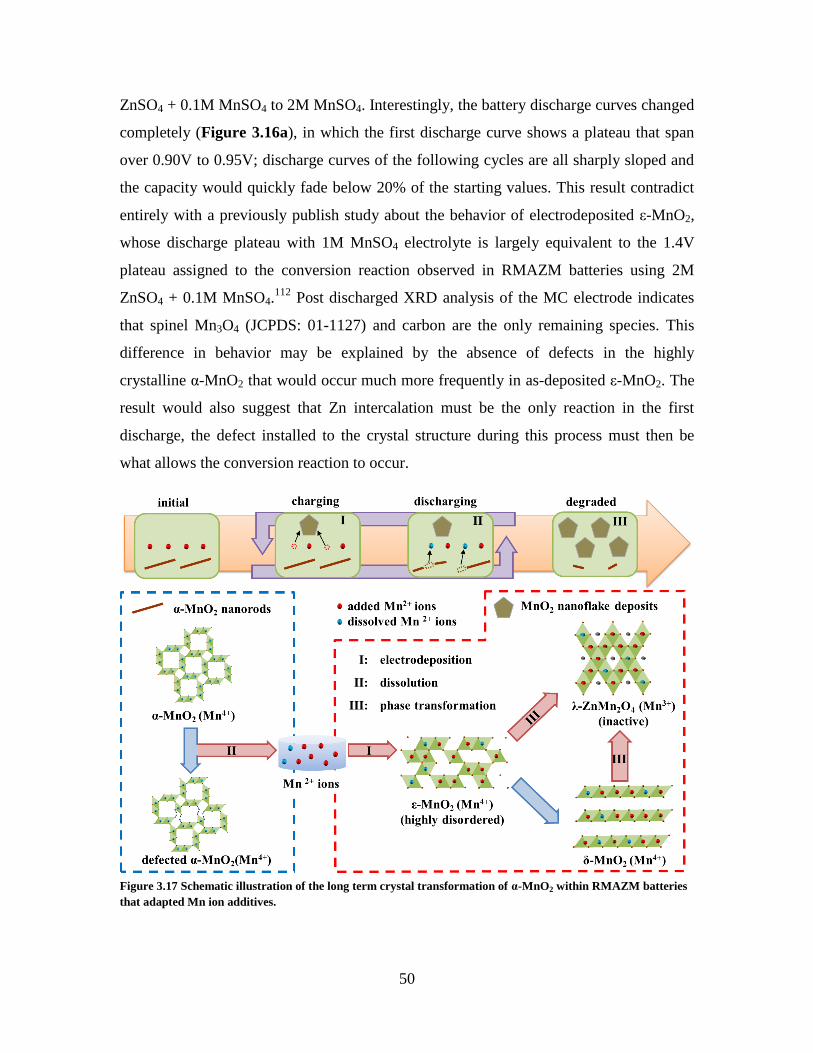
50
ZnSO4 + 0.1M MnSO4 to 2M MnSO4. Interestingly, the battery discharge curves changed
completely (Figure 3.16a), in which the first discharge curve shows a plateau that span
over 0.90V to 0.95V; discharge curves of the following cycles are all sharply sloped and
the capacity would quickly fade below 20% of the starting values. This result contradict
entirely with a previously publish study about the behavior of electrodeposited ε-MnO2,
whose discharge plateau with 1M MnSO4 electrolyte is largely equivalent to the 1.4V
plateau assigned to the conversion reaction observed in RMAZM batteries using 2M
ZnSO4 + 0.1M MnSO4.112
Post discharged XRD analysis of the MC electrode indicates
that spinel Mn3O4 (JCPDS: 01-1127) and carbon are the only remaining species. This
difference in behavior may be explained by the absence of defects in the highly
crystalline α-MnO2 that would occur much more frequently in as-deposited ε-MnO2. The
result would also suggest that Zn intercalation must be the only reaction in the first
discharge, the defect installed to the crystal structure during this process must then be
what allows the conversion reaction to occur.
Figure 3.17 Schematic illustration of the long term crystal transformation of α-MnO2 within RMAZM batteries
that adapted Mn ion additives.
51
Summing all of the mechanism investigation results, a long term transformation
process of MnO2 species within RMAZM batteries is summarized and demonstrated in
Figure 3.17. As illustrated, the main reason of performance degradation in these batteries
is the eventual conversion of all Mn species (α-MnO2 and Mn2+
additives) to the
electrochemical passive λ-ZnMn2O4. The conversion path consist of three major
individual steps, which include I) uncontrolled MnO2 electrodeposition that slowly
consumes the Mn additives in the electrolyte, II) dissolution/disproportion reaction of the
primary cathode material (α-MnO2) following the depletion of Mn additives and III) the
transformation of the electrodeposited Mn species to λ-ZnMn2O4. It is worth noting that
the formation of δ-MnO2 is not considered a problem due to its moderate capability as an
intercalation-type cathode material.31
However, their transformation to λ-ZnMn2O4
reported by previous study and confirmed by the experimental results would still be
problematic.110
Of the three steps above, the MnO2 electrodeposition (Step I) is the main trigger
of the entire degradation process, it is the main driving force that pushes steps II and III
to occurs and the deterioration to proceed. Although previous studies did associated some
benefits to this phenomenon in lab scale batteries,31,108
these advantages are likely not
feasible in commercial products as standard batteries generally minimize electrolyte
amount to increase battery energy density. More importantly, its effects in causing
imbalance in the electrolyte system and formation of electrochemically inactive species
are far too disruptive for the battery rechargebility. With this in mind, the non-stop
electrodeposition of Mn2+
ion should be re-identified as a major gateway that opens up a
path for performance degradation, and its inhibition or partial suppression should be
relabelled as a priority when optimizing different components of RMAZM batteries.
52
4 Suppressing Manganese Dioxide Deposition with Expanded
Graphite for High Performance Zn-MnO2 Batteries
4.1 Introduction
In the last chapter, the reaction transformation mechanism of MnO2 and the issues
arising from the in-situ MnO2 deposition phenomenon are systematically investigated and
discussed. It was discovered that although the electrodeposited MnO2 do provide
temporary extra capacity, it also adds a reaction path for generation of undesired species
that are threats to the RMAZM batteries long term stability. Previous studies have
focused heavily on the effect of Mn additive in ensuring the integrity of the active
cathode material, but rarely considered the longevity of the Mn additives themselves. As
a result, the low C-rate stability of RMAZM batteries is often inferior comparing to their
high C-rate performance, in which MnO2 electrodeposition is hindered kinetically.
In this chapter, the focus would be to adapt the obtained findings into designing a
MnO2 cathode electrode that is capable of suppressing by-product formation while
maintaining the excellent high C-rate performance. Specifically, kinetics of the MnO2
electrodeposition reaction is explored and manipulated to achieve the desired result.
Expanded graphite (EG) prepared from thermal shock expansion of sulfuric acid
intercalated graphite (expandable graphite) is discovered as a substrate material that is
capable of suppressing the MnO2 electrodeposition rate without negatively impacting the
electrochemical performance. The resulting optimized cathode electrode demonstrate a
much improved cycle life in low C-rate cycling, maintaining a capacity of over 250 mAh
g-1
after 300 cycles of Galvanostatic charge and discharge at 1C. At the same time, the
electrodes also demonstrated good stability when cycled at 5C, achieving 1500 cycles of
discharge with capacity near 200 mAh g-1
. Finally, due to the absence of polymer binder
from the electrode, the design strategy also improved the rate performance of the MnO2
electrode, allowing it to be among the best performing MnO2 based electrodes reported in
research publications.
53
4.2 Experiment Procedures
4.2.1 Preparation of Expanded Graphite
Two approaches have been attempted to prepared expanded graphite, the first
method is the microwave irradiation in a conventional microwave oven and the other is
through thermal shock in a furnace tube oven. In the microwave irradiation method, 0.1 g
of expandable graphite purchased from Sigma Aldrich was microwaved in a Danby
microwave at 800 mW for three separate periods of 10 seconds. During this process, the
expandable graphite would slowly heat up until a threshold is reach when it rapidly
increases in volume. The rapid expansion generally occurs within a period of 2 to 3
seconds and it is accompanied by generation of sparks. Upon the rapid volume expansion,
the expanded graphite would continue to spark until the microwaving process is
completed. The final EG has a worm-like structure and a black color. The length of the
expanded graphite may vary from 0.3 cm to 0.7 cm. The microwave apparatus was
located within a fume hood to ensure no undesired gas is release into the laboratory. After
each microwave period, the beaker was rested for 30 s to 1 min to dissipate accumulated
heat.
For the thermal shock expansion method, 0.1 g of expandable graphite was first
placed within a quartz glass tube that has one end sealed. Then they were transfer into a
long furnace tube, which was then fill with argon gas and preheated to 900 ºC within 45
minutes. During this process the quartz tube holding the expandable graphite was kept
outside of the furnace at room temperature. When the programmed temperature of 900 ºC
is reached, the quart tube was slide into the center of the furnace to experience the
thermal shock. The expandable graphite was kept in the furnace for 1, 10, 30 or 60 mins,
and was moved back out to cool in room temperature when the time is reached. Within
the first minute of the treatment, the graphite would be expanded and the small amount of
white smoke is observed. The thermal shock expanded graphite does not exhibit any
noticeable appearance difference in comparison to the samples prepared by microwave.
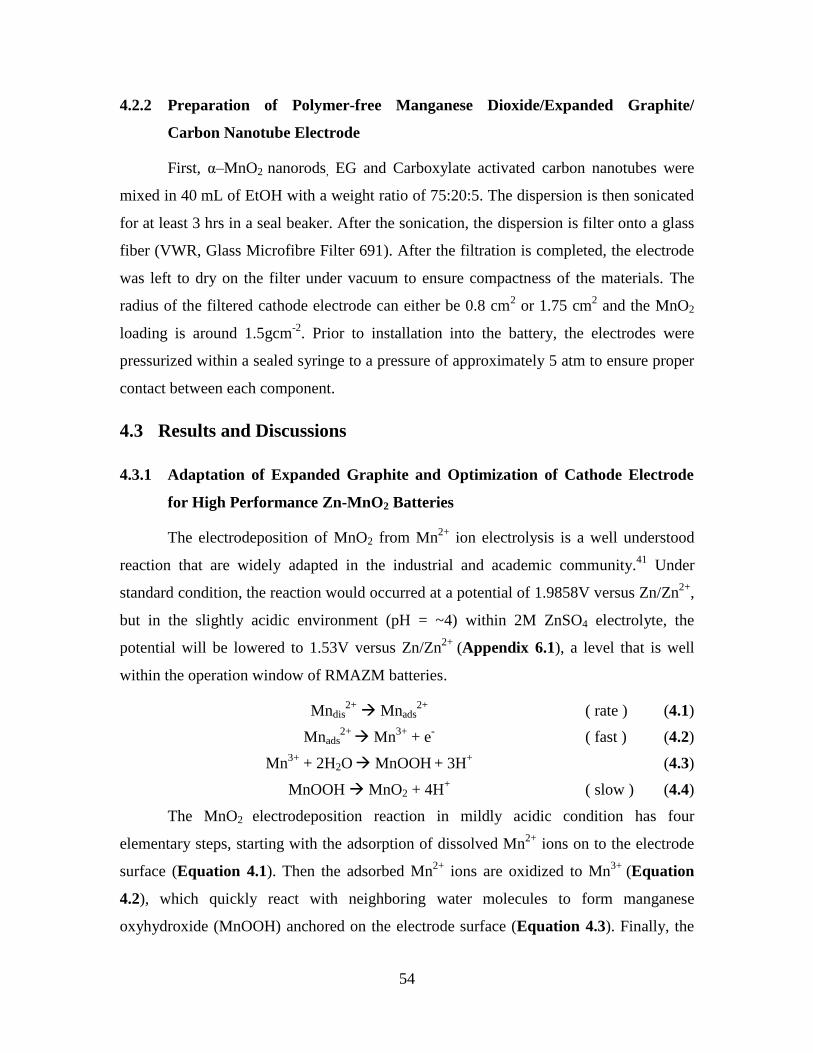
54
4.2.2 Preparation of Polymer-free Manganese Dioxide/Expanded Graphite/
Carbon Nanotube Electrode
First, α–MnO2 nanorods, EG and Carboxylate activated carbon nanotubes were
mixed in 40 mL of EtOH with a weight ratio of 75:20:5. The dispersion is then sonicated
for at least 3 hrs in a seal beaker. After the sonication, the dispersion is filter onto a glass
fiber (VWR, Glass Microfibre Filter 691). After the filtration is completed, the electrode
was left to dry on the filter under vacuum to ensure compactness of the materials. The
radius of the filtered cathode electrode can either be 0.8 cm2 or 1.75 cm
2 and the MnO2
loading is around 1.5gcm-2
. Prior to installation into the battery, the electrodes were
pressurized within a sealed syringe to a pressure of approximately 5 atm to ensure proper
contact between each component.
4.3 Results and Discussions
4.3.1 Adaptation of Expanded Graphite and Optimization of Cathode Electrode
for High Performance Zn-MnO2 Batteries
The electrodeposition of MnO2 from Mn2+
ion electrolysis is a well understood
reaction that are widely adapted in the industrial and academic community.41
Under
standard condition, the reaction would occurred at a potential of 1.9858V versus Zn/Zn2+
,
but in the slightly acidic environment (pH = ~4) within 2M ZnSO4 electrolyte, the
potential will be lowered to 1.53V versus Zn/Zn2+
(Appendix 6.1), a level that is well
within the operation window of RMAZM batteries.
Mndis2+
Mnads2+
( rate ) (4.1)
Mnads2+ Mn
3+ + e
- ( fast ) (4.2)
Mn3+
+ 2H2O MnOOH + 3H
+ (4.3)
MnOOH MnO2 + 4H+ ( slow ) (4.4)
The MnO2 electrodeposition reaction in mildly acidic condition has four
elementary steps, starting with the adsorption of dissolved Mn2+
ions on to the electrode
surface (Equation 4.1). Then the adsorbed Mn2+
ions are oxidized to Mn3+
(Equation
4.2), which quickly react with neighboring water molecules to form manganese
oxyhydroxide (MnOOH) anchored on the electrode surface (Equation 4.3). Finally, the
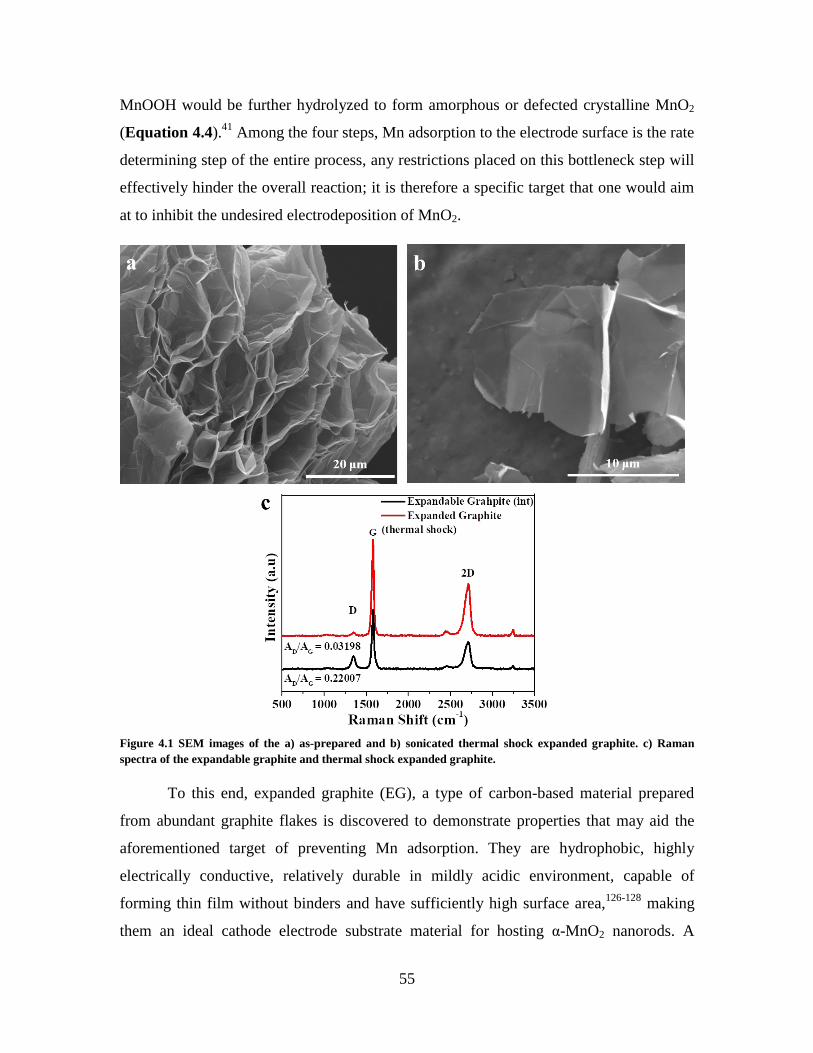
55
MnOOH would be further hydrolyzed to form amorphous or defected crystalline MnO2
(Equation 4.4).41
Among the four steps, Mn adsorption to the electrode surface is the rate
determining step of the entire process, any restrictions placed on this bottleneck step will
effectively hinder the overall reaction; it is therefore a specific target that one would aim
at to inhibit the undesired electrodeposition of MnO2.
Figure 4.1 SEM images of the a) as-prepared and b) sonicated thermal shock expanded graphite. c) Raman
spectra of the expandable graphite and thermal shock expanded graphite.
To this end, expanded graphite (EG), a type of carbon-based material prepared
from abundant graphite flakes is discovered to demonstrate properties that may aid the
aforementioned target of preventing Mn adsorption. They are hydrophobic, highly
electrically conductive, relatively durable in mildly acidic environment, capable of
forming thin film without binders and have sufficiently high surface area,126-128
making
them an ideal cathode electrode substrate material for hosting α-MnO2 nanorods. A
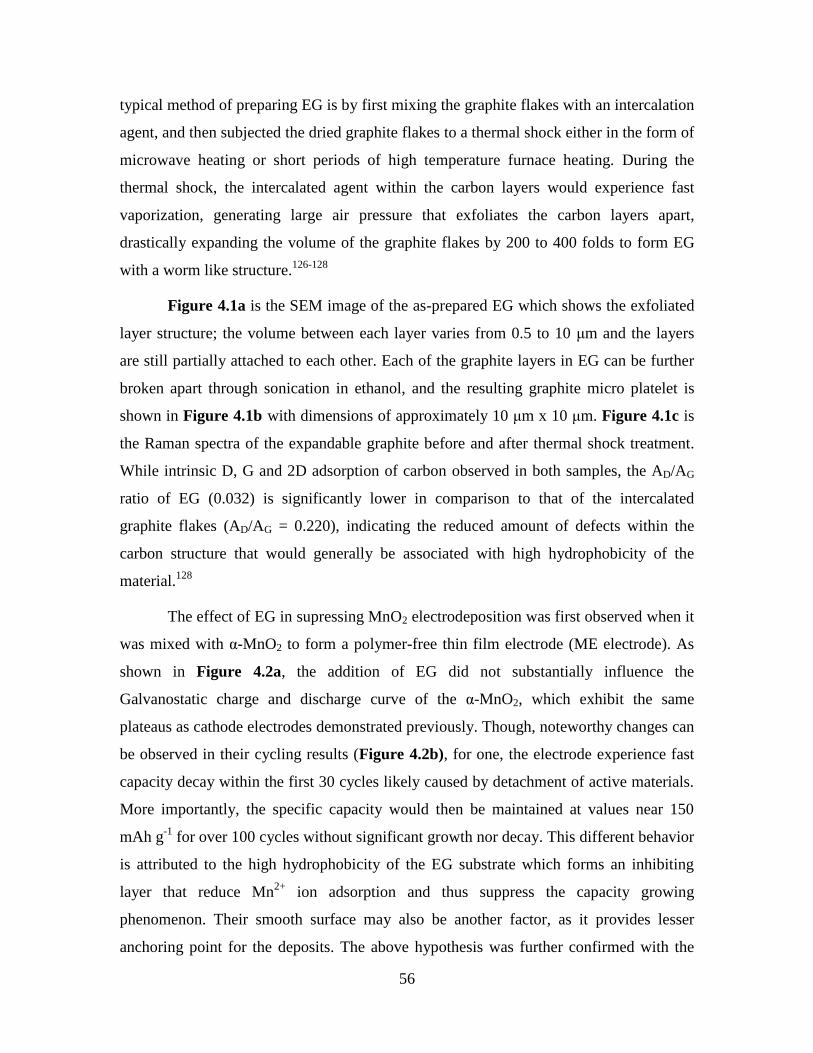
56
typical method of preparing EG is by first mixing the graphite flakes with an intercalation
agent, and then subjected the dried graphite flakes to a thermal shock either in the form of
microwave heating or short periods of high temperature furnace heating. During the
thermal shock, the intercalated agent within the carbon layers would experience fast
vaporization, generating large air pressure that exfoliates the carbon layers apart,
drastically expanding the volume of the graphite flakes by 200 to 400 folds to form EG
with a worm like structure.126-128
Figure 4.1a is the SEM image of the as-prepared EG which shows the exfoliated
layer structure; the volume between each layer varies from 0.5 to 10 μm and the layers
are still partially attached to each other. Each of the graphite layers in EG can be further
broken apart through sonication in ethanol, and the resulting graphite micro platelet is
shown in Figure 4.1b with dimensions of approximately 10 μm x 10 μm. Figure 4.1c is
the Raman spectra of the expandable graphite before and after thermal shock treatment.
While intrinsic D, G and 2D adsorption of carbon observed in both samples, the AD/AG
ratio of EG (0.032) is significantly lower in comparison to that of the intercalated
graphite flakes (AD/AG = 0.220), indicating the reduced amount of defects within the
carbon structure that would generally be associated with high hydrophobicity of the
material.128
The effect of EG in supressing MnO2 electrodeposition was first observed when it
was mixed with α-MnO2 to form a polymer-free thin film electrode (ME electrode). As
shown in Figure 4.2a, the addition of EG did not substantially influence the
Galvanostatic charge and discharge curve of the α-MnO2, which exhibit the same
plateaus as cathode electrodes demonstrated previously. Though, noteworthy changes can
be observed in their cycling results (Figure 4.2b), for one, the electrode experience fast
capacity decay within the first 30 cycles likely caused by detachment of active materials.
More importantly, the specific capacity would then be maintained at values near 150
mAh g-1
for over 100 cycles without significant growth nor decay. This different behavior
is attributed to the high hydrophobicity of the EG substrate which forms an inhibiting
layer that reduce Mn2+
ion adsorption and thus suppress the capacity growing
phenomenon. Their smooth surface may also be another factor, as it provides lesser
anchoring point for the deposits. The above hypothesis was further confirmed with the
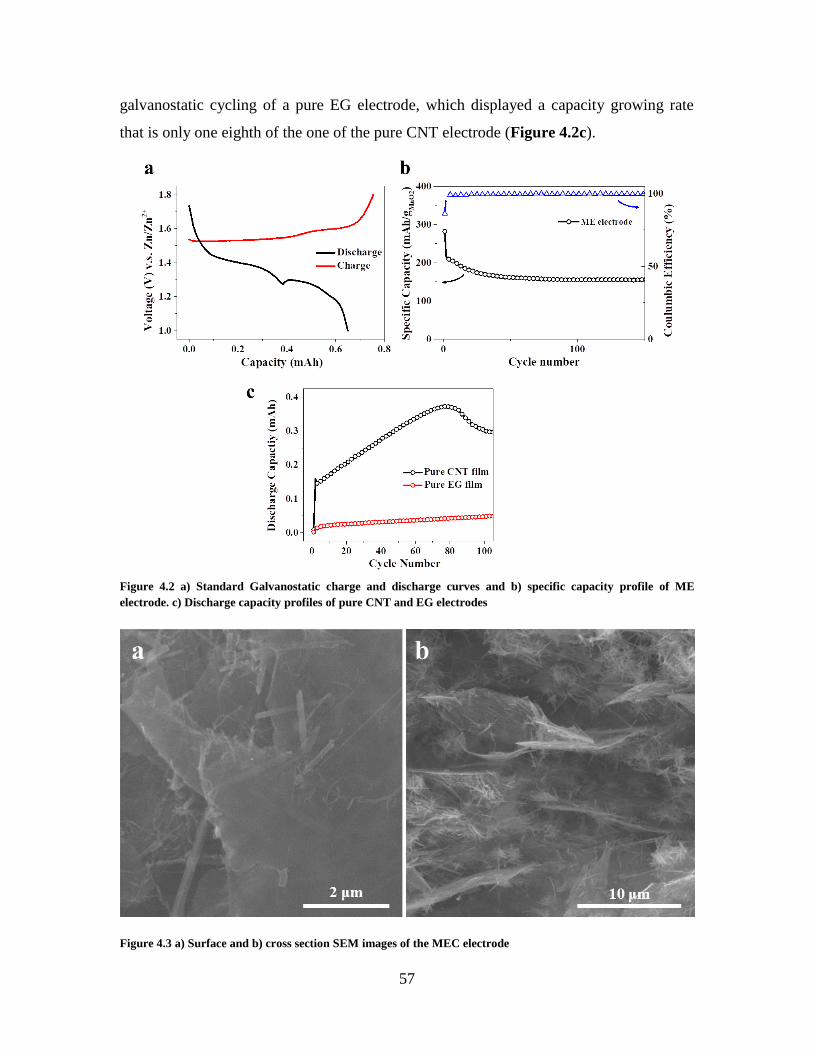
57
galvanostatic cycling of a pure EG electrode, which displayed a capacity growing rate
that is only one eighth of the one of the pure CNT electrode (Figure 4.2c).
Figure 4.2 a) Standard Galvanostatic charge and discharge curves and b) specific capacity profile of ME
electrode. c) Discharge capacity profiles of pure CNT and EG electrodes
Figure 4.3 a) Surface and b) cross section SEM images of the MEC electrode
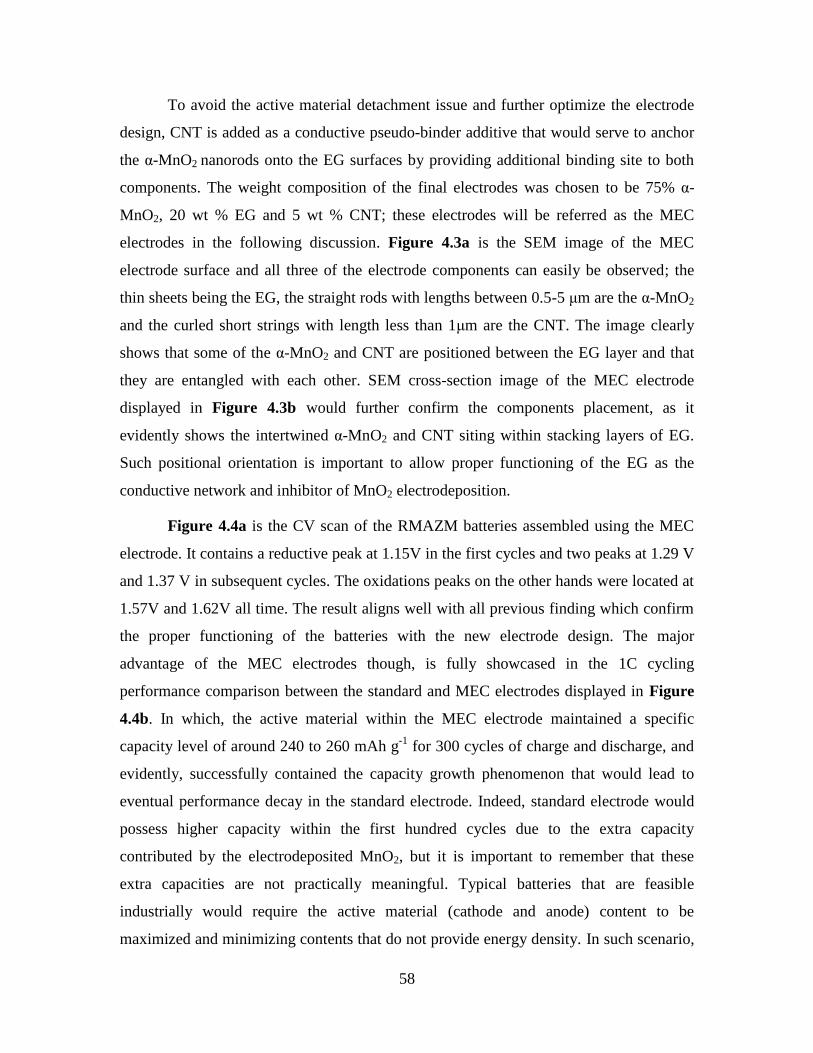
58
To avoid the active material detachment issue and further optimize the electrode
design, CNT is added as a conductive pseudo-binder additive that would serve to anchor
the α-MnO2 nanorods onto the EG surfaces by providing additional binding site to both
components. The weight composition of the final electrodes was chosen to be 75% α-
MnO2, 20 wt % EG and 5 wt % CNT; these electrodes will be referred as the MEC
electrodes in the following discussion. Figure 4.3a is the SEM image of the MEC
electrode surface and all three of the electrode components can easily be observed; the
thin sheets being the EG, the straight rods with lengths between 0.5-5 μm are the α-MnO2
and the curled short strings with length less than 1μm are the CNT. The image clearly
shows that some of the α-MnO2 and CNT are positioned between the EG layer and that
they are entangled with each other. SEM cross-section image of the MEC electrode
displayed in Figure 4.3b would further confirm the components placement, as it
evidently shows the intertwined α-MnO2 and CNT siting within stacking layers of EG.
Such positional orientation is important to allow proper functioning of the EG as the
conductive network and inhibitor of MnO2 electrodeposition.
Figure 4.4a is the CV scan of the RMAZM batteries assembled using the MEC
electrode. It contains a reductive peak at 1.15V in the first cycles and two peaks at 1.29 V
and 1.37 V in subsequent cycles. The oxidations peaks on the other hands were located at
1.57V and 1.62V all time. The result aligns well with all previous finding which confirm
the proper functioning of the batteries with the new electrode design. The major
advantage of the MEC electrodes though, is fully showcased in the 1C cycling
performance comparison between the standard and MEC electrodes displayed in Figure
4.4b. In which, the active material within the MEC electrode maintained a specific
capacity level of around 240 to 260 mAh g-1
for 300 cycles of charge and discharge, and
evidently, successfully contained the capacity growth phenomenon that would lead to
eventual performance decay in the standard electrode. Indeed, standard electrode would
possess higher capacity within the first hundred cycles due to the extra capacity
contributed by the electrodeposited MnO2, but it is important to remember that these
extra capacities are not practically meaningful. Typical batteries that are feasible
industrially would require the active material (cathode and anode) content to be
maximized and minimizing contents that do not provide energy density. In such scenario,
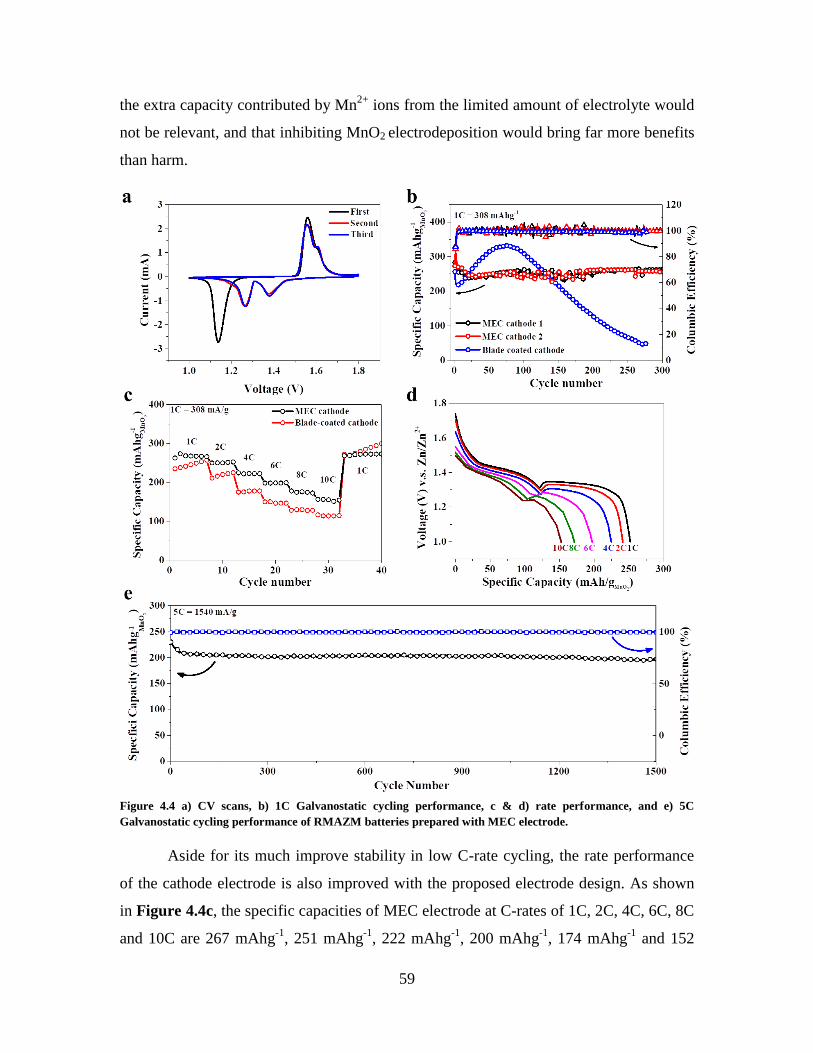
59
the extra capacity contributed by Mn2+
ions from the limited amount of electrolyte would
not be relevant, and that inhibiting MnO2 electrodeposition would bring far more benefits
than harm.
Figure 4.4 a) CV scans, b) 1C Galvanostatic cycling performance, c & d) rate performance, and e) 5C
Galvanostatic cycling performance of RMAZM batteries prepared with MEC electrode.
Aside for its much improve stability in low C-rate cycling, the rate performance
of the cathode electrode is also improved with the proposed electrode design. As shown
in Figure 4.4c, the specific capacities of MEC electrode at C-rates of 1C, 2C, 4C, 6C, 8C
and 10C are 267 mAhg-1
, 251 mAhg-1
, 222 mAhg-1
, 200 mAhg-1
, 174 mAhg-1
and 152
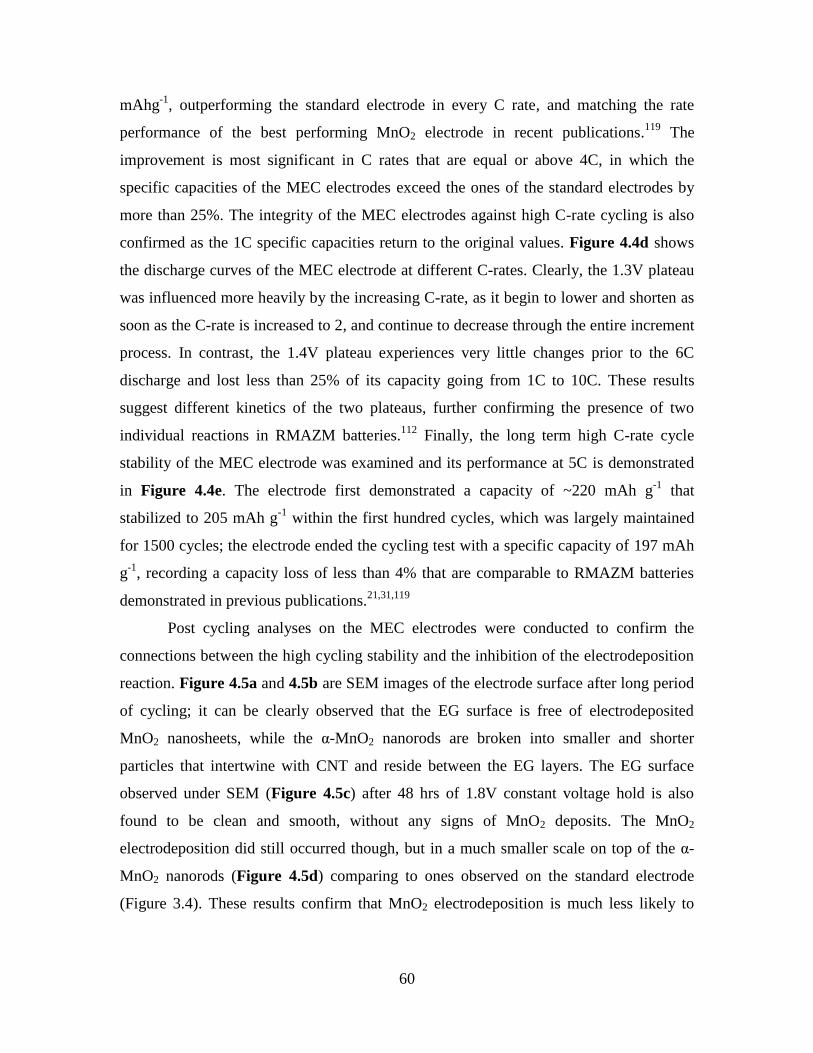
60
mAhg-1
, outperforming the standard electrode in every C rate, and matching the rate
performance of the best performing MnO2 electrode in recent publications.119
The
improvement is most significant in C rates that are equal or above 4C, in which the
specific capacities of the MEC electrodes exceed the ones of the standard electrodes by
more than 25%. The integrity of the MEC electrodes against high C-rate cycling is also
confirmed as the 1C specific capacities return to the original values. Figure 4.4d shows
the discharge curves of the MEC electrode at different C-rates. Clearly, the 1.3V plateau
was influenced more heavily by the increasing C-rate, as it begin to lower and shorten as
soon as the C-rate is increased to 2, and continue to decrease through the entire increment
process. In contrast, the 1.4V plateau experiences very little changes prior to the 6C
discharge and lost less than 25% of its capacity going from 1C to 10C. These results
suggest different kinetics of the two plateaus, further confirming the presence of two
individual reactions in RMAZM batteries.112
Finally, the long term high C-rate cycle
stability of the MEC electrode was examined and its performance at 5C is demonstrated
in Figure 4.4e. The electrode first demonstrated a capacity of ~220 mAh g-1
that
stabilized to 205 mAh g-1
within the first hundred cycles, which was largely maintained
for 1500 cycles; the electrode ended the cycling test with a specific capacity of 197 mAh
g-1
, recording a capacity loss of less than 4% that are comparable to RMAZM batteries
demonstrated in previous publications.21,31,119
Post cycling analyses on the MEC electrodes were conducted to confirm the
connections between the high cycling stability and the inhibition of the electrodeposition
reaction. Figure 4.5a and 4.5b are SEM images of the electrode surface after long period
of cycling; it can be clearly observed that the EG surface is free of electrodeposited
MnO2 nanosheets, while the α-MnO2 nanorods are broken into smaller and shorter
particles that intertwine with CNT and reside between the EG layers. The EG surface
observed under SEM (Figure 4.5c) after 48 hrs of 1.8V constant voltage hold is also
found to be clean and smooth, without any signs of MnO2 deposits. The MnO2
electrodeposition did still occurred though, but in a much smaller scale on top of the α-
MnO2 nanorods (Figure 4.5d) comparing to ones observed on the standard electrode
(Figure 3.4). These results confirm that MnO2 electrodeposition is much less likely to
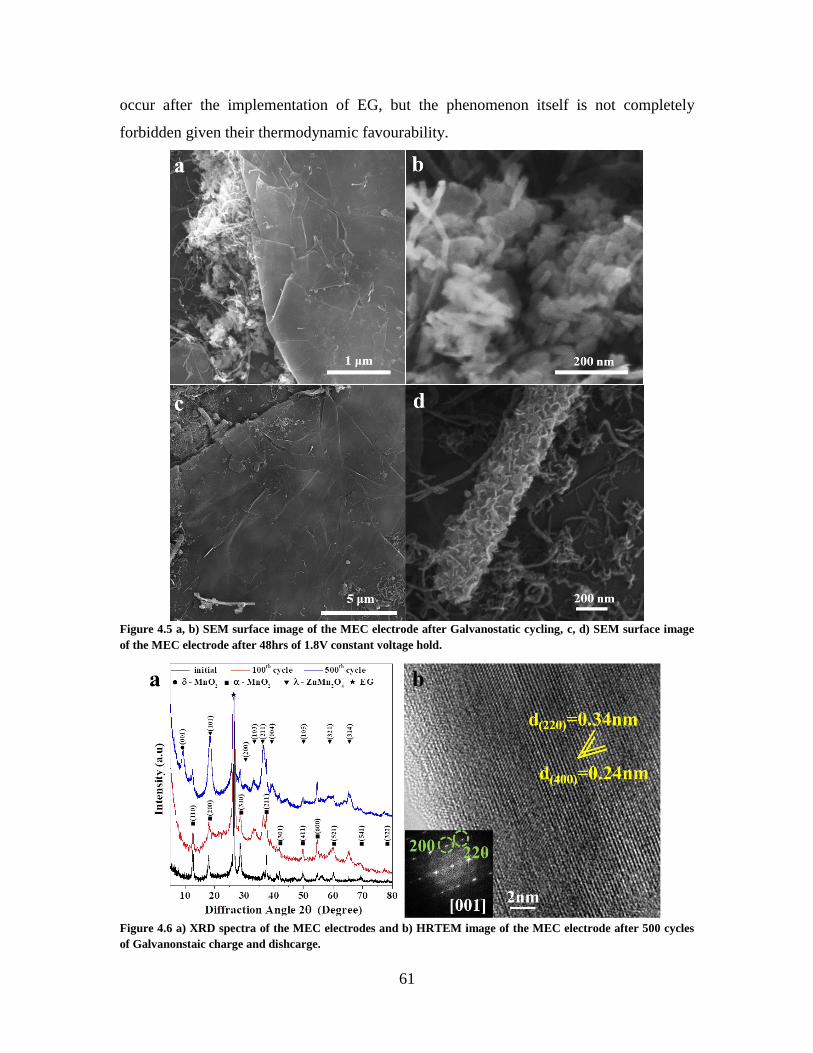
61
occur after the implementation of EG, but the phenomenon itself is not completely
forbidden given their thermodynamic favourability.
Figure 4.5 a, b) SEM surface image of the MEC electrode after Galvanostatic cycling, c, d) SEM surface image
of the MEC electrode after 48hrs of 1.8V constant voltage hold.
Figure 4.6 a) XRD spectra of the MEC electrodes and b) HRTEM image of the MEC electrode after 500 cycles
of Galvanonstaic charge and dishcarge.
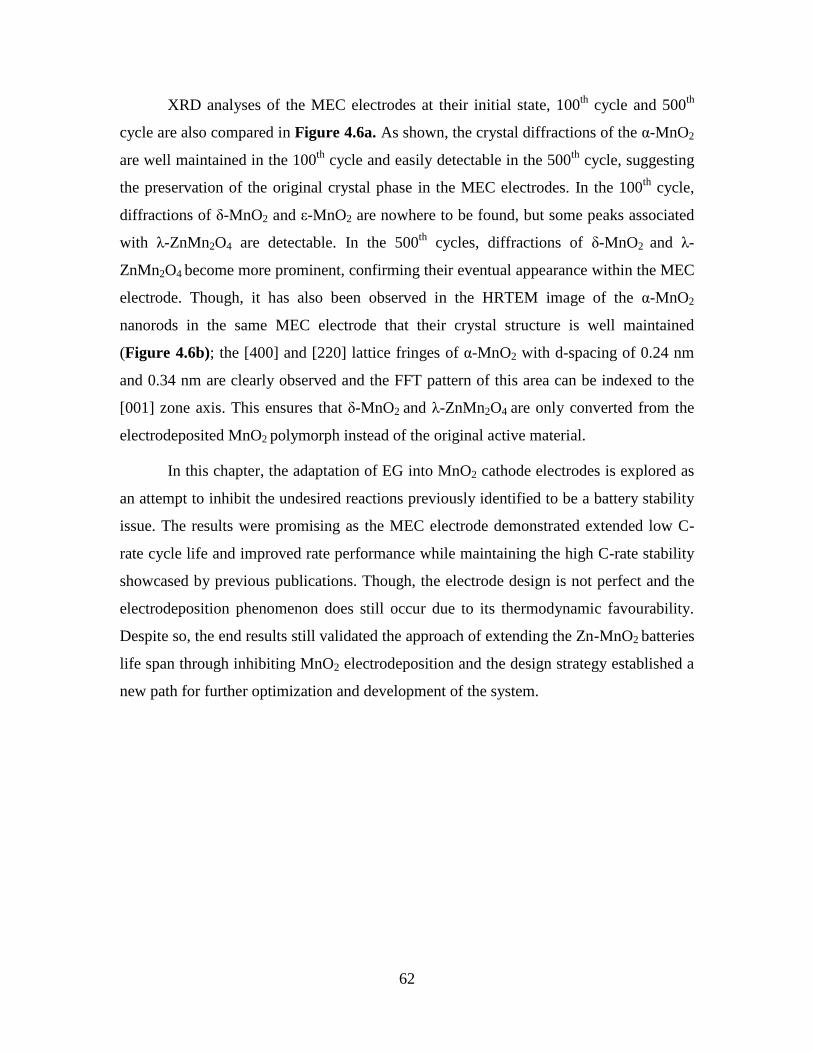
62
XRD analyses of the MEC electrodes at their initial state, 100th
cycle and 500th
cycle are also compared in Figure 4.6a. As shown, the crystal diffractions of the α-MnO2
are well maintained in the 100th
cycle and easily detectable in the 500th
cycle, suggesting
the preservation of the original crystal phase in the MEC electrodes. In the 100th
cycle,
diffractions of δ-MnO2 and ε-MnO2 are nowhere to be found, but some peaks associated
with λ-ZnMn2O4 are detectable. In the 500th
cycles, diffractions of δ-MnO2 and λ-
ZnMn2O4 become more prominent, confirming their eventual appearance within the MEC
electrode. Though, it has also been observed in the HRTEM image of the α-MnO2
nanorods in the same MEC electrode that their crystal structure is well maintained
(Figure 4.6b); the [400] and [220] lattice fringes of α-MnO2 with d-spacing of 0.24 nm
and 0.34 nm are clearly observed and the FFT pattern of this area can be indexed to the
[001] zone axis. This ensures that δ-MnO2 and λ-ZnMn2O4 are only converted from the
electrodeposited MnO2 polymorph instead of the original active material.
In this chapter, the adaptation of EG into MnO2 cathode electrodes is explored as
an attempt to inhibit the undesired reactions previously identified to be a battery stability
issue. The results were promising as the MEC electrode demonstrated extended low C-
rate cycle life and improved rate performance while maintaining the high C-rate stability
showcased by previous publications. Though, the electrode design is not perfect and the
electrodeposition phenomenon does still occur due to its thermodynamic favourability.
Despite so, the end results still validated the approach of extending the Zn-MnO2 batteries
life span through inhibiting MnO2 electrodeposition and the design strategy established a
new path for further optimization and development of the system.
63
5 Conclusions and Suggestions
In this thesis, the MnO2 cathode electrodes in the recently emerging mildly acidic
Zn-MnO2 batteries system are thoroughly investigated and new knowledge about the
system is developed. Precisely, the in-situ Mn2+
electrodeposition phenomenon, short and
long term crystal phase transformation mechanism of manganese species were studied
and linked to the battery performances. In contrast to previous studies, the investigation
results identified MnO2 electrodeposition as an undesired reaction that opens up a path
toward performance degradation, and the new found recognitions were adapted in the
formulation of a novel cathode electrode design approach. The resulting EG incorporated
polymer-free MnO2 electrode demonstrated much improved low C-rate stability and rate
performance without sacrificing its high C-rate longevity, which therefore further raised
the overall performance RMAZM batteries. It is recognized though that the proposed
electrode design is not perfect and there are still rooms for growth to further expand the
commercial feasibility of the system.
There are still many questions about RMAZM batteries left to be answer that
could possibility served as the catalysts to further improve the system performance. For
one, understanding the Mn, O and Zn bonding condition within the defected α-MnO2
crystal phases would be of great interest for targeted element substitution. Amorphous
MnO2, an important part of the system that was not investigated in this thesis due to
instrument limitation could be studied with characterization techniques such as X-ray
absorption spectroscopy to identify hidden keys for modification. The results obtained
from such investigations may lead to strategies that completely forbid the undesirable
MnO2 electrodeposition phenomenon or new Mn based material that undergoes reaction
processes that are fundamentally more reversible. Lastly, the electrode design could be
further optimized toward higher active material loading or revitalized for incorporation to
the cylindrical Zn-MnO2 batteries.
64
6 Reference
(1) Winter, M.; Brodd, R. J. Chemical Reviews 2004, 104, 4245.
(2) World Energy Resources 2016 Executive Summary World Energy Council
2016.
(3) Ball, J. Germany's High-Priced Energy Revolution.
http://fortune.com/2017/03/14/germany-renewable-clean-energy-solar/ (accessed April
18 2018).
(4) Nordensvärd, J.; Urban, F. Energy Policy 2015, 82, 156.
(5) Reed, S. Germany's Shift to Green Power Stalls, Depiste Huge Investment.
https://www.nytimes.com/2017/10/07/business/energy-environment/german-renewable-
energy.html (accessed April 18 2018).
(6) Quitzow, L.; Canzler, W.; Grundmann, P.; Leibenath, M.; Moss, T.; Rave,
T. Utilities Policy 2016, 41, 163.
(7) Paul, F. C. Geoforum 2018, 91, 1.
(8) Dunn, B.; Kamath, H.; Tarascon, J.-M. Science 2011, 334, 928.
(9) Mauger, A.; Julien, C. Ionics 2017, 23, 1933.
(10) Lebedeva, N. P.; Boon-Brett, L. Journal of The Electrochemical Society
2016, 163, A821.
(11) Nitta, N.; Wu, F.; Lee, J. T.; Yushin, G. Materials today 2015, 18, 252.
(12) Hodge, A.; Crowley, B.; Bairstrow, H.; Ljubisavljevic, S.; Hamilton, C.;
Morton, P.; Kejriwal, D.; May, C.; Diyachikina, P.; South, F.; Thong, D.; Katayama, T.;
Park, A.; Shin, S.; Lewis, J.; Lin, Z. Global Lithium Report.
https://newagemetals.com/wp-
content/uploads/MacquarieGlobalLithiumReport310516e245188.pdf (accessed July
2018).
(13) Kesler, S. E.; Gruber, P. W.; Medina, P. A.; Keoleian, G. A.; Everson, M.
P.; Wallington, T. J. Ore Geology Reviews 2012, 48, 55.
(14) 5 Year Cobalt Prices and Price Charts.
http://www.infomine.com/investment/metal-prices/cobalt/5-year/ (accessed May 01
2018).
(15) Jacobs, J. Benchmark: What Drove Lithium Prices in December?
https://www.globalxfunds.com/benchmark-what-drove-lithium-prices-in-december/
(accessed May 1 2018).
(16) Tisserant, A.; Pauliuk, S. Journal of Economic Structures 2016, 5, 4.
(17) Gruber, P. W.; Medina, P. A.; Keoleian, G. A.; Kesler, S. E.; Everson, M.
P.; Wallington, T. J. Journal of Industrial Ecology 2011, 15, 760.
(18) Hwang, J.-Y.; Myung, S.-T.; Sun, Y.-K. Chemical Society Reviews 2017,
46, 3529.
(19) Fu, J.; Cano, Z. P.; Park, M. G.; Yu, A.; Fowler, M.; Chen, Z. Advanced
Materials 2017, 29.
(20) Cano, Z. P.; Banham, D.; Ye, S.; Hintennach, A.; Lu, J.; Fowler, M.; Chen,
Z. Nature Energy 2018, 3, 279.
(21) Pan, H.; Shao, Y.; Yan, P.; Cheng, Y.; Han, K. S.; Nie, Z.; Wang, C.;
Yang, J.; Li, X.; Bhattacharya, P. Nature Energy 2016, 1, 16039.
65
(22) Parker, J. F.; Chervin, C. N.; Pala, I. R.; Machler, M.; Burz, M. F.; Long, J.
W.; Rolison, D. R. Science 2017, 356, 415.
(23) Reddy, T. Linden's Handbook of Batteries, 4th Edition; McGraw-Hill
Education, 2010.
(24) McLarnon, F. R.; Cairns, E. J. Journal of the Electrochemical Society
1991, 138, 645.
(25) Zinc facts. http://www.nrcan.gc.ca/mining-materials/facts/zinc/20534
(accessed April 26 2018 ).
(26) Ebin, B.; Petranikova, M.; Steenari, B.-M.; Ekberg, C. Waste Management
2016, 51, 157.
(27) Chen, W.-S.; Liao, C.-T.; Lin, K.-Y.
(28) Biswas, R. K.; Karmakar, A. K.; Kumar, S. L. Waste Management 2016,
51, 174.
(29) Kundu, D.; Adams, B. D.; Duffort, V.; Vajargah, S. H.; Nazar, L. F. Nat.
Energy 2016, 1, 16119.
(30) Zhao, Q.; Huang, W.; Luo, Z.; Liu, L.; Lu, Y.; Li, Y.; Li, L.; Hu, J.; Ma,
H.; Chen, J. Science Advances 2018, 4.
(31) Zhang, N.; Cheng, F.; Liu, J.; Wang, L.; Long, X.; Liu, X.; Li, F.; Chen, J.
Nature communications 2017, 8, 405.
(32) Xu, C.; Li, B.; Du, H.; Kang, F. Angewandte Chemie International Edition
2012, 51, 933.
(33) Xiaowei, W.; Faxing, W.; Liying, W.; Minxia, L.; Yanfang, W.; Bingwei,
C.; Yusong, Z.; Lijun, F.; Liusheng, Z.; Lixin, Z.; Yuping, W.; Wei, H. Advanced
Materials 2016, 28, 4904.
(34) Liu, W.; Hao, J.; Xu, C.; Mou, J.; Dong, L.; Jiang, F.; Kang, Z.; Wu, J.;
Jiang, B.; Kang, F. Chemical Communications 2017, 53, 6872.
(35) Kaveevivitchai, W.; Manthiram, A. Journal of Materials Chemistry A
2016, 4, 18737.
(36) Pan, H.; Mengyu, Y.; Guobin, Z.; Ruimin, S.; Lineng, C.; Qinyou, A.;
Liqiang, M. Advanced Energy Materials 2017, 7, 1601920.
(37) Cheng, Y.; Luo, L.; Zhong, L.; Chen, J.; Li, B.; Wang, W.; Mao, S. X.;
Wang, C.; Sprenkle, V. L.; Li, G.; Liu, J. ACS Applied Materials & Interfaces 2016, 8,
13673.
(38) Leyuan, Z.; Liang, C.; Xufeng, Z.; Zhaoping, L. Advanced Energy
Materials 2015, 5, 1400930.
(39) Rafael, T.; Fabio, L. M. ChemSusChem 2015, 8, 481.
(40) Gupta, T.; Kim, A.; Phadke, S.; Biswas, S.; Luong, T.; Hertzberg, B. J.;
Chamoun, M.; Evans-Lutterodt, K.; Steingart, D. A. Journal of Power Sources 2016, 305,
22.
(41) Biswal, A.; Tripathy, B. C.; Sanjay, K.; Subbaiah, T.; Minakshi, M. RSC
Advances 2015, 5, 58255.
(42) Manganese Statistics and Information.
https://minerals.usgs.gov/minerals/pubs/commodity/manganese/#pubs (accessed May 20
2018).
66
(43) 5 Year Manganese Prices and Price Charts.
http://www.infomine.com/investment/metal-prices/manganese/5-year/ (accessed May 20
2018).
(44) Besenhard, J. O. Handbook of battery materials; John Wiley & Sons, 2008.
(45) Bystrom, A. Acta Chemica Scandinavica 1949, 3, 163.
(46) DeWolff, P.; Visser, J.; Giovanoli, R.; Brutsch, R. Chimia 1978, 32, 257.
(47) De Wolff, P. Acta Crystallographica 1959, 12, 341.
(48) Charenton, J. C.; Strobel, P. Journal of Solid State Chemistry 1988, 77, 33.
(49) Jouanneau, S.; Sarciaux, S.; La Salle, A. L. G.; Guyomard, D. Solid State
Ionics 2001, 140, 223.
(50) Jouanneau, S.; La Salle, A. L. G.; Guyomard, D. Electrochimica acta
2002, 48, 11.
(51) Thackeray, M. M. Progress in Solid State Chemistry 1997, 25, 1.
(52) Chabre, Y.; Pannetier, J. Progress in Solid State Chemistry 1995, 23, 1.
(53) Poyraz, A. S.; Huang, J.; Cheng, S.; Wu, L.; Tong, X.; Zhu, Y.;
Marschilok, A. C.; Takeuchi, K. J.; Takeuchi, E. S. Journal of The Electrochemical
Society 2017, 164, A1983.
(54) Poyraz, A. S.; Huang, J.; Pelliccione, C. J.; Tong, X.; Cheng, S.; Wu, L.;
Zhu, Y.; Marschilok, A. C.; Takeuchi, K. J.; Takeuchi, E. S. Journal of Materials
Chemistry A 2017, 5, 16914.
(55) Huang, J.; Poyraz, A. S.; Takeuchi, K. J.; Takeuchi, E. S.; Marschilok, A.
C. Chemical communications 2016, 52, 4088.
(56) Tompsett, D. A.; Islam, M. S. Chemistry of Materials 2013, 25, 2515.
(57) Johnson, C. S. Journal of Power Sources 2007, 165, 559.
(58) Zhang, C.; Feng, C.; Zhang, P.; Guo, Z.; Chen, Z.; Li, S.; Liu, H. RSC
Advances 2012, 2, 1643.
(59) Huang, J.; Poyraz, A. S.; Lee, S.-Y.; Wu, L.; Zhu, Y.; Marschilok, A. C.;
Takeuchi, K. J.; Takeuchi, E. S. ACS applied materials & interfaces 2016, 9, 4333.
(60) Xu, F.; Wu, L.; Meng, Q.; Kaltak, M.; Huang, J.; Durham, J. L.;
Fernandez-Serra, M.; Sun, L.; Marschilok, A. C.; Takeuchi, E. S. Nature
Communications 2017, 8, 15400.
(61) Zhang, R.; Yu, X.; Nam, K.-W.; Ling, C.; Arthur, T. S.; Song, W.; Knapp,
A. M.; Ehrlich, S. N.; Yang, X.-Q.; Matsui, M. Electrochemistry Communications 2012,
23, 110.
(62) Brousse, T.; Toupin, M.; Dugas, R.; Athouël, L.; Crosnier, O.; Bélanger,
D. Journal of the Electrochemical Society 2006, 153, A2171.
(63) Chen, K.; Sun, C.; Xue, D. Physical Chemistry Chemical Physics 2015, 17,
732.
(64) Ma, Z.; Shao, G.; Fan, Y.; Wang, G.; Song, J.; Shen, D. ACS applied
materials & interfaces 2016, 8, 9050.
(65) Wei, W.; Cui, X.; Chen, W.; Ivey, D. G. Chemical society reviews 2011,
40, 1697.
(66) Lehtimäki, M.; Hoffmannová, H.; Boytsova, O.; Bastl, Z.; Busch, M.;
Halck, N. B.; Rossmeisl, J.; Krtil, P. Electrochimica Acta 2016, 191, 452.
(67) Lee, J.; Ju, J. B.; Cho, W. I.; Cho, B. W.; Oh, S. H. Electrochimica Acta
2013, 112, 138.
67
(68) Post, J. E.; Veblen, D. R. American Mineralogist 1990, 75, 477.
(69) Alfaruqi, M. H.; Gim, J.; Kim, S.; Song, J.; Pham, D. T.; Jo, J.; Xiu, Z.;
Mathew, V.; Kim, J. Electrochemistry Communications 2015, 60, 121.
(70) Kim, S. H.; Kim, S. J.; Oh, S. M. Chemistry of Materials 1999, 11, 557.
(71) Thapa, A. K.; Pandit, B.; Thapa, R.; Luitel, T.; Paudel, H. S.;
Sumanasekera, G.; Sunkara, M. K.; Gunawardhana, N.; Ishihara, T.; Yoshio, M.
Electrochimica Acta 2014, 116, 188.
(72) Zhao, J.; Xu, L.; Xie, C. Chinese Journal of Geochemistry 2013, 32, 380.
(73) Jiangang, F.; Zhangxing, H.; Hui, W.; LIANG, W.; Chao, G. Mining
Science and Technology (China) 2010, 20, 877.
(74) Musil, M.; Choi, B.; Tsutsumi, A. Journal of The Electrochemical Society
2015, 162, A2058.
(75) Marsal, P. A.; Karl, K.; Urry, L. F.; Google Patents: 1960.
(76) Dirkse, T.; Vander Lugt, L.; Hampson, N. Journal of The Electrochemical
Society 1971, 118, 1606.
(77) Johansen, J. F., Queensland University of Technology, 2007.
(78) Cahoon, N.; Korver, M. Journal of The Electrochemical Society 1959, 106,
745.
(79) Bell, G.; Huber, R. Journal of The Electrochemical Society 1964, 111, 1.
(80) Kozawa, A.; Powers, R. Journal of The Electrochemical Society 1966, 113,
870.
(81) Technical Bulletins - Alkaline-Manganese Dioxide Batteries.
https://www.duracell.com/en-ca/techlibrary/technical-bulletins (accessed May 05 2018).
(82) Division, U. C. C. C. P. "Eveready" battery applications and engineering
data; Unitech Division, Associated Educational Services Corp., 1968.
(83) Xia, X.; Li, H.; Chen, Z. H. Journal of The Electrochemical Society 1989,
136, 266.
(84) Baugh, L.; Cook, J.; Lee, J. Journal of Applied Electrochemistry 1978, 8,
253.
(85) Agency, U. S. E. P., Ed.; 104th U.S. Congress: 1996.
(86) Yoshizawa, H.; Miura, A.; Nitta, Y.; Sugihara, S.; Google Patents: 1992.
(87) Kato, F.; Nunome, J.; Shimamura, H.; Google Patents: 2010.
(88) Kordesch, K.; Gsellmann, J.; Tomantschger, K.; Google Patents: 1991.
(89) Josef Daniel-Ivad; Karl Kordesch. Rechargeable Alkaline Manganese
Technology: Past-Present-Future https://www.electrochem.org/dl/ma/201/pdfs/0257.pdf
(accessed May 17 2018).
(90) Ingale, N. D.; Gallaway, J. W.; Nyce, M.; Couzis, A.; Banerjee, S. Journal
of Power Sources 2015, 276, 7.
(91) Mondoloni, C.; Laborde, M.; Rioux, J.; Andoni, E.; Lévy‐Clément, C.
Journal of The Electrochemical Society 1992, 139, 954.
(92) Kannan, A.; Bhavaraju, S.; Prado, F.; Raja, M. M.; Manthiram, A. Journal
of The Electrochemical Society 2002, 149, A483.
(93) Gallaway, J. W.; Hertzberg, B. J.; Zhong, Z.; Croft, M.; Turney, D. E.;
Yadav, G. G.; Steingart, D. A.; Erdonmez, C. K.; Banerjee, S. Journal of Power Sources
2016, 321, 135.
68
(94) Hertzberg, B. J.; Huang, A.; Hsieh, A.; Chamoun, M.; Davies, G.; Seo, J.
K.; Zhong, Z.; Croft, M.; Erdonmez, C.; Meng, Y. S. Chemistry of Materials 2016, 28,
4536.
(95) Nartey, V. K.; Binder, L.; Huber, A. Journal of Power Sources 2000, 87,
205.
(96) Li, X.; Li, Z.; Xia, T.; Dong, H.; Song, Y.; Wang, L. Journal of Physics
and Chemistry of Solids 2012, 73, 1229.
(97) Im, D.; Manthiram, A.; Coffey, B. Journal of The Electrochemical Society
2003, 150, A1651.
(98) Yadav, G. G.; Gallaway, J. W.; Turney, D. E.; Nyce, M.; Huang, J.; Wei,
X.; Banerjee, S. Nature Communications 2017, 8, 14424.
(99) Sun, K. E.; Hoang, T. K.; Doan, T. N. L.; Yu, Y.; Zhu, X.; Tian, Y.; Chen,
P. ACS applied materials & interfaces 2017, 9, 9681.
(100) Turney, D. E.; Gallaway, J. W.; Yadav, G. G.; Ramirez, R.; Nyce, M.;
Banerjee, S.; Chen-Wiegart, Y.-c. K.; Wang, J.; D’Ambrose, M. J.; Kolhekar, S.
Chemistry of Materials 2017, 29, 4819.
(101) Zhou, H.; Huang, Q.; Liang, M.; Lv, D.; Xu, M.; Li, H.; Li, W. Materials
chemistry and Physics 2011, 128, 214.
(102) Shoji, T.; Hishinuma, M.; Yamamoto, T. Journal of applied
electrochemistry 1988, 18, 521.
(103) Shoji, T.; Yamamoto, T. Journal of Electroanalytical Chemistry 1993, 362,
153.
(104) Askar, M.; Abbas, H.; Afifi, S. Journal of power sources 1994, 48, 303.
(105) Hoang, T. K.; Sun, K. E. K.; Chen, P. RSC Advances 2015, 5, 41677.
(106) Boytsova, O.; Shekunova, T.; Baranchikov, A. Nanocrystalline
Manganese Dioxide Synthesis by Microwave-Hydrothermal Treatment, 2015; Vol. 60.
(107) Al-Hinai, A. T.; Al-Hinai, M. H.; Dutta, J. Materials Research Bulletin
2014, 49, 645.
(108) Wu, X.; Xiang, Y.; Peng, Q.; Wu, X.; Li, Y.; Tang, F.; Song, R.; Liu, Z.;
He, Z.; Wu, X. Journal of Materials Chemistry A 2017, 5, 17990.
(109) Zhang, N.; Cheng, F.; Liu, Y.; Zhao, Q.; Lei, K.; Chen, C.; Liu, X.; Chen,
J. Journal of the American Chemical Society 2016, 138, 12894.
(110) Alfaruqi, M. H.; Islam, S.; Putro, D. Y.; Mathew, V.; Kim, S.; Jo, J.; Kim,
S.; Sun, Y.-K.; Kim, K.; Kim, J. Electrochimica Acta 2018, 276, 1.
(111) Lee, B.; Lee, H. R.; Kim, H.; Chung, K. Y.; Cho, B. W.; Oh, S. H.
Chemical communications 2015, 51, 9265.
(112) Sun, W.; Wang, F.; Hou, S.; Yang, C.; Fan, X.; Ma, Z.; Gao, T.; Han, F.;
Hu, R.; Zhu, M. Journal of the American Chemical Society 2017, 139, 9775.
(113) Lee, B.; Yoon, C. S.; Lee, H. R.; Chung, K. Y.; Cho, B. W.; Oh, S. H.
Scientific reports 2014, 4, 6066.
(114) Kobayashi, S.; Kottegoda, I. R.; Uchimoto, Y.; Wakihara, M. Journal of
Materials Chemistry 2004, 14, 1843.
(115) Thackeray, M. M.; Shao‐Horn, Y.; Kahaian, A. J.; Kepler, K. D.;
Skinner, E.; Vaughey, J. T.; Hackney, S. A. Electrochemical and Solid-State Letters 1998,
1, 7.
(116) Benedek, R. The Journal of Physical Chemistry C 2017, 121, 22049.

69
(117) Kim, S. H.; Oh, S. M. Journal of power sources 1998, 72, 150.
(118) Li, H.; Han, C.; Huang, Y.; Huang, Y.; Zhu, M.; Pei, Z.; Xue, Q.; Wang,
Z.; Liu, Z.; Tang, Z. Energy & Environmental Science 2018.
(119) Wu, B.; Zhang, G.; Yan, M.; Xiong, T.; He, P.; He, L.; Xu, X.; Mai, L.
Small 2018, 14, 1703850.
(120) Gao, T.; Glerup, M.; Krumeich, F.; Nesper, R.; Fjellvåg, H.; Norby, P. The
Journal of Physical Chemistry C 2008, 112, 13134.
(121) Gao, T.; Fjellvåg, H.; Norby, P. Analytica chimica acta 2009, 648, 235.
(122) Ilton, E. S.; Post, J. E.; Heaney, P. J.; Ling, F. T.; Kerisit, S. N. Applied
Surface Science 2016, 366, 475.
(123) Manganese-Transition Metal.
https://xpssimplified.com/elements/manganese.php (accessed Sept 09 2018).
(124) Lee, B.; Yoon, C. S.; Lee, H. R.; Chung, K. Y.; Cho, B. W.; Oh, S. H.
Scientific reports 2014, 4.
(125) Alfaruqi, M. H.; Mathew, V.; Gim, J.; Kim, S.; Song, J.; Baboo, J. P.;
Choi, S. H.; Kim, J. Chemistry of Materials 2015, 27, 3609.
(126) Cai, M.; Thorpe, D.; Adamson, D. H.; Schniepp, H. C. Journal of
Materials Chemistry 2012, 22, 24992.
(127) Chung, D. Journal of materials science 2016, 51, 554.
(128) SIGRAFLEX® Expanded Natural Graphite.
http://www.sglgroup.com/cms/international/company/business-units/graphite-materials-
and-systems/expanded-graphite/index.html?__locale=en (accessed Sept 18 2018).
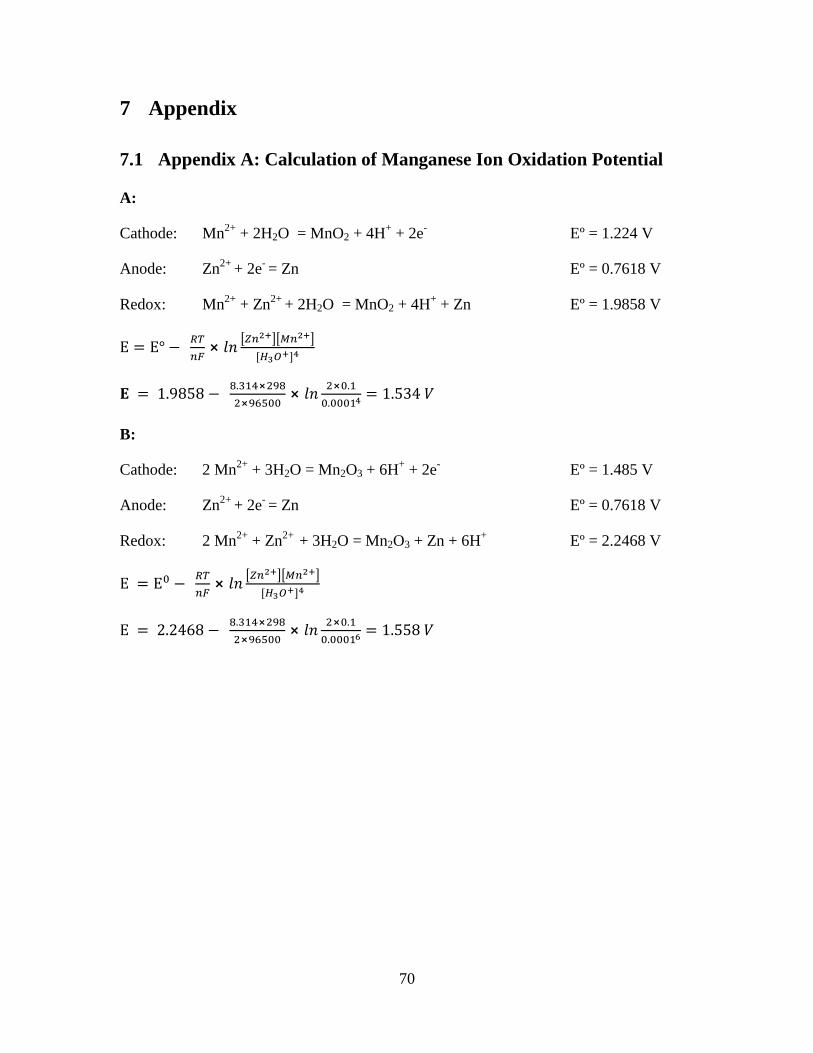
70
7 Appendix
7.1 Appendix A: Calculation of Manganese Ion Oxidation Potential
A:
Cathode: Mn2+
+ 2H2O = MnO2 + 4H+ + 2e
- Eº = 1.224 V
Anode: Zn2+
+ 2e- = Zn Eº = 0.7618 V
Redox: Mn2+
+ Zn2+
+ 2H2O = MnO2 + 4H+ + Zn Eº = 1.9858 V
E = E° − 𝑅𝑇
𝑛𝐹⨯ 𝑙𝑛
[𝑍𝑛2+][𝑀𝑛2+]
[𝐻3𝑂+]4
𝐄 = 1.9858 − 8.314⨯298
2⨯96500⨯ 𝑙𝑛
2⨯0.1
0.00014 = 1.534 𝑉
B:
Cathode: 2 Mn2+
+ 3H2O = Mn2O3 + 6H+ + 2e
- Eº = 1.485 V
Anode: Zn2+
+ 2e- = Zn
Eº = 0.7618 V
Redox: 2 Mn2+
+ Zn2+
+ 3H2O = Mn2O3 + Zn + 6H+ Eº = 2.2468 V
E = E0 − 𝑅𝑇
𝑛𝐹⨯ 𝑙𝑛
[𝑍𝑛2+][𝑀𝑛2+]
[𝐻3𝑂+]4
E = 2.2468 − 8.314⨯298
2⨯96500⨯ 𝑙𝑛
2⨯0.1
0.00016 = 1.558 𝑉