Embed Size (px)
Citation preview

ALEA, Lat. Am. J. Probab. Math. Stat. 15, 875–895 (2018)
DOI: 10.30757/ALEA.v15-33
Invited paper
In-sample forecasting:A brief review and new algorithms
Y. K. Lee, E. Mammen, J. P. Nielsen and B. U. Park
Department of Statistics, Kangwon National University,Chuncheon 200-701, Republic of KoreaE-mail address: [email protected]
Institute for Applied Mathematics, Heidelberg University,Im Neuenheimer Feld 205, 69120 Heidelberg, GermanyE-mail address: [email protected]
Cass Business School, City, University of London,106 Bunhill Row, London EC1Y8TZ, United KingdomE-mail address: [email protected]
Department of Statistics, Seoul National University,1 Gwanak-ro, Gwanak-gu, Seoul 08826, Republic of KoreaE-mail address: [email protected], [email protected]
Abstract. Statistical methods often distinguish between in-sample and out-of-sample approaches. In particular this is the case when time is involved. Thenoften time series methods are proposed that extrapolate past patterns into the fu-ture via complicated recursion formulas. Standard statistical inference is on theother hand concerned with estimating parameters within the given sample. Thisreview paper is about a statistical methodology, where all parameters are estimatedin-sample while producing a forecast out-of-sample without recursion or extrapo-lation. A new super-simulation algorithm ensures a faster implementation of thesimplest and perhaps most important version of in-sample forecasting.
Received by the editors January 10th, 2018; accepted July 18th, 2018.2010 Mathematics Subject Classification. 62G07, 62G20.Key words and phrases. Structured nonparametric models; age-cohort models; density estima-
tion; kernel smoothing; backfitting; Chain Ladder; UK mesothelioma mortality.Research of Young K. Lee was supported by the National Research Foundation of Korea (NRF)
grant funded by the Korea government (MSIP) (NRF-2018R1A2B6001068) and by 2016 ResearchGrant from Kangwon National University (520160394). Research of Jens P. Nielsen was supported
by the Institute and Faculty of Actuaries, London, UK. Research of B. U. Park was supportedby the National Research Foundation of Korea (NRF) grant funded by the Korea government(MSIP) (NRF-2015R1A2A1A05001753).
875
876 Y. K. Lee et al.
1. Introduction
Mammen et al. (2015) and Lee et al. (2015) defined the term “in-sample fore-casting” to mean forecasting a structured function in regions where the function isnot observed but where it is determined by its values in the observed region. Therehave been many modeling approaches that connect the underlying distributions inthe observed and un-observed areas via some common structure. One of the bestknown models of this class are perhaps age-cohort models often applied in epidemi-ology, biometrical and industrial forecasting. Here functions of interest dependon age effects and cohort effects that can be estimated using past observations.Outcomes for the future values of the function can be achieved by plugging in thefitted effects. Thus the age-cohort model is an in-sample forecaster because futureage-cohort driven mean values are determined by age effects and cohort effects thatcan be estimated using available data.
There are several specifications of age-cohort models. In longevity studies, mor-tality rates have been modeled as products of age-effects and age-specific periodtrends, see e.g. Lee and Carter (1992) and Lee and Miller (2001), and see Renshawand Haberman (2006) for an extension that also includes age-specific cohort effects.In medicine the cohort-effect can be onset of disease and the age-effect can be du-ration. In insurance the former can be the time of registering an insurance claimand the latter can be the duration until the claim is fully paid, see Kuang et al.(2009) among many others. It turns out that continuous age-cohort models can beformulated via something as simple as a combination of two independent stochasticvariables. Let us for example assume that we have one variable X representing thestart of something. It could be onset of some infection, underwriting of an insurancecontract, reporting of an insurance claim, birth of a new member of a cohort or anemployee losing his job in the labour market. Let then Y be a stochastic variableindependent of X representing the development or delay to some event from thisstarting point. It could be incubation period of some disease, development of aninsurance claim, age of a cohort member or time spent looking for a new job. Then,X+Y is the calendar time of the relevant event. This event is observed if and onlyif it has already happened until a calendar time, say t0. The forecasting exercise isabout predicting the density of future events in calendar times after t0.
In the continuous age-cohort model the forecasting density is specified in termsof the densities of X and Y . The most typical example of a structured density age-cohort model has a simple multiplicative form and has been studied by Martınez-Miranda et al. (2013) and Mammen et al. (2015). The first group of authors calledit “continuous chain-ladder”, because of its relation to the chain-ladder methodthat is omnipresent in applied non-life insurance. The chain-ladder method is anactuarial loss reserving technique that is based on the estimation of age-to-age fac-tors using past data to predict future loss development patterns. In a continuouschain-ladder model it is assumed that X and Y have smooth densities f1 and f2 andare independent, leading to a multiplicative density model. When f1 and f2 are es-timated by histograms, our in-sample forecasting approach could be formulated viaa parametric model. This version of in-sample density forecasting is omnipresentin academic studies as well as in business forecasting, see Martınez-Miranda et al.(2013) for more details and references in insurance and in statistics. Extensions ofsuch parametric histogram type of models can often be understood as structureddensity models modeled via histograms. However, in-sample forecasting is more

In-sample forecasting 877
general in scope than methods based on the simple multiplicative model. Anygeneralised structured density or regression function that can be estimated fromthe past and that covers outcomes of the function in the future can be used. Ageneralised structured function is defined as a known function of lower-dimensionalunknown underlying functions, see Mammen and Nielsen (2003) for a formal defi-nition of generalised structured models.
Under the assumption that the model is true, our forecasts make use of the esti-mated lower-dimensional functions. The forecast is achieved by plugging the fits ofthese functions into the structured equation that is valid for the considered futuredate. The forecasting technique does not make use of an approximative extrapola-tion method that is based on Taylor expansions, for example, to get approximationsfor near future outcomes. And it does not use methods from time series analysisto model the further development of some random parameters. This is why themethodology is called “in-sample forecasting”: a structured nonparametric estima-tor forecasting the future without using approximate extrapolations or time seriesforecasts. For letting the method work the structural assumptions are essential.The validity of these assumptions for the past can be checked by goodness-of-fittests. For the above mentioned multiplicative density model, for example, tests canbe constructed that question the multiplicative form. This can be done by omnibustests or by tests that compare the fit with estimates in extended models. We willmention some model extensions for this model below. A more rigorous work ontesting for in-sample forecasting models is still missing.
More formal description of in-sample forecasting can be found in Mammen et al.(2015) and Lee et al. (2015). We call the problem of estimating a nonparametricfunction f “in-sample forecasting” if it is to estimate the values of the function f(z)
for z ∈ I only with noisy observations of f(z) for z in a set I that is disjoint to I.This makes sense under structural assumptions that identify the values of f(z) for
z ∈ I by the values of f(z) for z ∈ I. This is the case with the continuous chain-ladder model, f(x, y) = f1(x)f2(y) with I being equal to the triangle {(x, y) : x, y ∈[0, t0], x+y ≤ t0} and I = [0, t0]2\I. The name “chain-ladder” probably came fromthe shape of the run-off triangle I in the discrete case. The component functionsf1 and f2 can be estimated by observing truncated observations (Xi, Yi) ∈ I.
This identifies f(x, y) for (x, y) ∈ I. We come back to this model in Section 4with a general support set I. There are some extensions of this model. In Leeet al. (2015) a seasonal effect is added to the model. The seasonal effect canbe estimated from the past because of its recurring character. Here the densityhas the form f(x, y) = f1(x)f2(x)f3(φ(x + y)), where φ represents the unknownrecurrent seasonal effect. On the other hand, Lee et al. (2017) assume f(x, y) =f1(x)f2(yφ(x)), where φ represents an unknown effect called “operational time”.This accounts for data where the speed of aging measured by Y develops in time.Other examples of structured models for in-sample forecasting include additiveregression models Y = m1(X1) + · · · + md(Xd) + ε, where observations for thefunction m(x) = m1(x1) + · · · + md(xd) are available for x in the support of X =(X1, . . . , Xd)
> but the function m is identified in the larger set S1 × · · · × Sd withSj equal to the support of Xj . For further examples related to additive models,see also Mammen and Nielsen (2003) and Mammen et al. (2014). It is of coursenot necessary that all entering functions are nonparametric. Lee (2016) pointedout that parametrising one component could stabilise estimation and forecast at

878 Y. K. Lee et al.
the cost of introducing a model bias in case the semiparametric model assumptionis violated.
Several algorithms have been used for the calculation of in-sample forecasters. Ina number of papers the calculation has been done by solving empirical integral equa-tions. For additive models an alternative is to use backfitting algorithms. Recently,for the continuous chain-ladder model it has been proposed to consider the problemas survival density estimation, see Hiabu et al. (2016a). They use a reversing timeargument to reduce the original two-dimensional projection problem to that of esti-mating two one-dimensional survival densities. The present paper introduces a newalgorithm for the multiplicative density in-sample forecaster, which also reduces thecomplexity of the problem. The new so-called super-simulation-algorithm of thispaper works with any density estimator based on independent and identically dis-tributed data. The algorithm enables a wider range of density estimation optionsfor applied statisticians, actuaries and econometricians who use the methodology.The super-simulation-algorithm first ignores that data are not available on the en-tire support of the population model. Data are only available in the past, not inthe future. In the first step, each component function in a structured model is esti-mated as if full information was available. In the second step, the super-simulation-algorithm simulates data in the no-data-region using the estimated components. Inthe third step, the component functions are re-estimated using both the originaland simulated data, and this iteration continues until convergence. A theorem issupplied proving that this computationally tractable super-algorithm does work asintended.
There are similarities and differences between the approach based on operationaltime and the one that adds the period effect to the age-cohort model. Both ap-proaches allow for some calendar time dependency. However, the operational timemodel is clearly an in-sample forecaster, while the period effect might be somethingdifferent. For a review of age-period-cohort models in the discrete universe, seeO’Brien (2014) and the many reference therein. There is an identifiability issuein age-period-cohort models, see Antonczyk et al. (2017) among many others, andone is often left with second order differences in the discrete case and second orderderivatives in our continuous case when working with canonical and well-definedparametrisation, see Riebler et al. (2012), Smith and Wakefield (2016) and Beutneret al. (2017) for some further understanding on this. There is therefore a practicalreason to consider operational time in-sample forecasting as an alternative to age-period-cohort models: the estimation, the identification and the forecasting withoperational time are all simpler than with age-period-cohort models.
This paper is structured as follows. Section 2 is a brief overview of some ofthe historical reasons leading to the development of in-sample forecasting. We alsodiscuss some of the mathematical statistics literature on complicated censoring andtruncation patterns and on redistributing mass to truncated or censored areas.Section 3 discusses a data set example where the model with operational time iscompared with the simple multiplicative model and it points out the double trun-cated nature of this data set as well as the lack of exposure data. Section 4 presentsthe new super-simulation-algorithm for in-sample forecasting. This is worked outfor a general type of support sets including the continuous chain-ladder model. Weargue that this simulation algorithm is approximately equivalent to an iterativedeterministic algorithm. Section 5 contains the theoretical properties of the new

In-sample forecasting 879
approach. Section 6 is devoted to concluding remarks, and all technical proofs aredeferred to the Appendix.
2. Redistribution of un-observed mass
This review paper introduces a new interpretation of in-sample forecasting algo-rithms as a method of redistributing un-observed mass, which we detail in Section 4.Redistributing mass to the right is not a new idea. Efron (1967) and Dinse (1985)pointed out that an alternative interpretation of the estimator of Kaplan and Meier(1958) was to consider it as an iterative procedure redistributing mass to the rightat each step. The Kaplan-Meier estimator is able to adjust for right censoring whenestimating a cumulative distribution function. When adjusting for right censoring,the Efron’s algorithm starts with estimating a distribution function, ignoring thecensoring. It distributes the mass at the first censored time to the right of thecensored point, moves to the next censored time to distribute again to the right theaccumulated mass at the censored time, and continues the redistribution procedureuntil the last censored time. Efron proved that the final estimator of this procudureis self-consistent meaning that this estimator does not change anymore from furtheriterations. This type of iterative procedures have later been generalised to morecomplicated truncation and censoring patterns. It has been shown that redistribu-tion procedures (now not only to the right) are closely related to the EM-algorithmand imputation methodologies, see for example Turnbull (1976). A brief review ofsome of the original ideas in the invention of in-sample forecasting may illustratebetter why this paper analyzes the redistribution-of-mass algorithm in detail.
The early development of the in-sample forecasting idea was an example of whatone today would call robotification, automatisation, machine learning or somethingelse indicating that expensive manual procedures are being overtaken by computerintensive methodology. A particular case considered was the estimation of out-standing liabilities in non-life insurance, which is considered the most labour inten-sive actuarial methodology. Various statistical problems in estimating reserves innon-life insurance have been dealt in the actuarial science literature. Some notableexamples include Kuang et al. (2009), Verrall et al. (2010), Martınez-Miranda et al.(2011, 2012, 2013). The first of these works established the maximum-likelihoodversion of the forecasting problem that turned out to be the estimation of canonicalparameters in a nice smooth exponential family. Verrall et al. (2010) considered amodel that takes into account the delay from when an insurance claim is incurredto when it is reported, as well as the delay from when a claim is reported to whenit is fully paid. Martınez-Miranda et al. (2011) discussed the distributional prop-erties of the method proposed in Verrall et al. (2010), and Martınez-Miranda et al.(2012) presented an extension to the model formulated by Verrall et al. (2010)and developed a new method of estimating outstanding claims. Finally, Martınez-Miranda et al. (2013) introduced how prior knowledge could be incorporated intothe framework of Martınez-Miranda et al. (2012). Later, Hiabu et al. (2016b,c)showed how prior knowledge could be used most efficiently via a redistribution-to-the-right approach. The prior knowledge in non-life insurance most often comesas historical payments of already settled claims and the predicted severities of re-ported but un-settled claims that are based on expert opinion, see Hiabu et al.

880 Y. K. Lee et al.
(2016b,c). Redistributing this information to the right turned out to improve fore-casts considerably. At the same time, Martınez-Miranda et al. (2013) introducedthe multiplicative model f(x, y) = f1(x)f2(y) as a continuous version of the dis-crete model where the classical chain-ladder method is based, which is more alignedwith modern statistical analyses. This naturally led to the theoretical works, Mam-men et al. (2015) and Lee et al. (2015, 2017), which developed sound theoreticalbackgrounds for in-sample forecasting mentioned in the introduction.
From the above brief historical outline of the development of in-sample fore-casting, it is clear why redistribution-of-mass algorithms are interesting for thefuture. While redistribution-of-mass is equivalent to the maximum likelihood prin-ciple when the latter is relevant and the maximum likelihood is a purely statisticalconcept requiring observations analysed via statistical distributions, redistribution-of-mass lends to an analysis beyond mathematical statistics that incorporates priorknowledge. Malani (1995) briefly indicated how disease markers could be added tothe redistribution-to-the right algorithm. Many applications of this type of method-ology have been introduced later, see e.g. Chen and Zhao (2013a,b) that also addthe element of estimating various health costs when complicated missing data prob-lems are present. The latter problem seems related to the insurance cost problemmentioned above. Future research might lead to a framework incorporating bothinsurance costs and health care costs in the same kind of in-sample forecastingmodel. Redistribution-of-mass algorithms might be a key element in such develop-ments. In the next section a data set is considered that is relevant from both thepoints of view of health care costs and insurance costs.
3. An illustrative forecasting example
To illustrate an in-sample forecasting exercise we present an illustrative applica-tion where we analyse an asbestos data set that is double-truncated and has year ofbirth as a potential covariate. The data set we consider here is on UK mesotheliomamortality. In this application a death case is only observed if it happened after thestudy began and before the study ended. This is a case of double truncation. Yearof birth is driving the timing of the two truncations and could potentially playthe role as a covariate. One study is considered where year of birth is indeed acovariate defining operational time and another study is presented where year ofbirth is not used as a covariate. Double truncation is related to double censor-ing. The latter is perhaps easier to analyze. For studies of double censoring, seeGehan (1965), Turnbull (1974), Chang and Yang (1987), Gu and Zhang (1993),Efron and Petrosian (1999) and the elegant self-consistency algorithm of Myklandand Ren (1996). Redistribution of mass to the censored areas is one elegant ap-proach to tackling censoring and double censoring and it is closely related to allthe above algorithms solving the double censoring challenges. Double truncationmight be more tricky, see Moreira and de Una Alvarez (2012), Moreira et al. (2016)and Moreira and Van Keilegom (2013) for studies of double truncation includingsmoothing. Our case allows for double truncation while at the same time lackingexposure data. Our problem is therefore a really complicated missing data prob-lem. It is treated below in the estimation part of our in-sample forecasting problem.We consider forecasting of asbestos related deaths, following the earlier works ofMartınez-Miranda et al. (2015); Martınez-Miranda et al. (2016) based on discrete

In-sample forecasting 881
data. Compared to these earlier studies we consider continuous rather than a dis-crete modelling approach while implementing the generalised structured densitiesf(x, y) = f1(x)f2(xφ(y)), where φ represents an unknown operational effect, seeLee et al. (2017).
The UK mesothelioma mortality data set consists of the counts of deaths causedby exposure to asbestos, given by year (1968–2012) and age (25–94) at the time ofdeath. The total number of deaths during the period and in the range of age is49,447. Basically, for this data set one may take the variable X to be the cohortand Y the age at death. Thus X = (year of death)− Y . To put the support of thedata as a subset of the unit rectangle, we made the following transformation.
Y =(AGE)− 25 + U2
70, X =
(YEAR)− 1968 + U1 + 70− 70Y
70 + 45,
with two independent U1 and U2 that are uniformly distributed on [0, 1]. In theabove transformation, the lowest possible year of birth, 1968− 94 = 1874 for thosewho died in 1968 at the age 94, is transformed to the cohort value X = 0 and thehighest, 2012 − 25 = 1987 for those who died in 2012 at the age 25, to X = 1.The support set I of the transformed (X,Y ) is a parallelogram surrounded by thefour lines represented by the equations y = 0, y = 1, x = (70 − 70 y)/115 andx = (115− 70 y)/115.
The results of the application of our method to the mortality data are shownin Figures 3.1. For the result in Figure 3.1 we used the 10-fold cross-validatedbandwidths described in Section 6 of Lee et al. (2017). The (operational) agecomponent f2 looks like we would expect and reflects an exponentially increasingmortality with age. Here, we note that f2, sitting on the values of {yφ(x) : (x, y) ∈I}, is not fully supported on the unit interval [0, 1] because of the operational timeφ and the shape of I. The estimated density f2 drops to zero near the end point
1.0 since the values of Yiφ(Xi) ranges from 0.2 to 0.97. Thus, it is due to thelow density near the end point rather than due to a boundary bias. The asbestosexposure part, f1, also looks as we would expect from earlier studies using UKimport of asbestos as a surrogate for exposure, see Peto et al. (1995) for example.See also Hodgson et al. (2005), Rake et al. (2009) and Tan et al. (2010, 2011)for other recent inputs to the modeling of asbestos related death in the UK. Theoperational time component is increasing for the most part indicating that time wasgoing slow at the beginning, where exposure first should take place before a longduration period towards dying of asbestos. Later asbestos exposure already tookplace and time to dying of asbestos is shorter. The non-increasing parts aroundclose to the two boundaries do not represent many actual deaths. That operationaltime at first is slowing down might be because this is early days and people have tobecome old enough to be able to die. The slowing down in the later cohort mightbe due to heterogeneity or the advance in medical technologies. If we think of it asall the individuals having an unobserved frailty parameter, then the right boundaryof operational time represents the few with very low frailty leading to a slow downin operational time at the right boundary.
One may use our estimated model to forecast the density on an unobservedarea. In general, let S be a subset of [0, 1]2, outside of the observed area I, where
one wants to forecast the density. With the estimated density model f(x, y) =
f1(x)f2(yφ(x)), the relative mass of the probability on S with respect to that on I

882 Y. K. Lee et al.
is estimated by
A(S) =
∫S
f1(x)f2(yφ(x)) dx dy. (3.1)
The number of future observations that fall in the area S is then forecasted byN(S) = n ·A(S), where n is the sample size, i.e., the total number of observationsin I.
To apply the forecasting method to the mortality data set and evaluate its ac-curacy, we re-estimated the model f(x, y) = f1(x)f2(yφ(x)), now using the dataobserved until the year 2010. In this case, we note that the cohort on the scale[0, 1] is given by
X =(YEAR)− 1968 + U1 + 70− 70Y
70 + 43.
We forecasted the number of deaths for the years 2011 and 2012 according to theformula at (3.1). In this application of the formula,
S = {(x, y) ∈ [0, 1]2 : (112 + α− 70 y)/113 < x ≤ (113 + α− 70 y)/113},
where α = 1 corresponds to the year 2011 and α = 2 to the year 2012. Theactual numbers of deaths in the years 2011 and 2012 were 2,311 and 2,535, respec-tively. Our approach produced fairly accurate forecasting results, 2,316 and 2,465,respectively.
The forecasting based on the simple product model f(x, y) = f1(x)f2(y), withoutconsidering the operational time, gave results that are far off the targets. Thepredicted counts of death were 1,721 for the year 2011 and 1,693 for the year 2012,which shows the great benefit of using the model with the operational time.
0.0 0.2 0.4 0.6 0.8 1.0
0.0
0.5
1.0
1.5
2.0
operational time
0.0 0.2 0.4 0.6 0.8 1.0
01
23
45
first component
0.0 0.2 0.4 0.6 0.8 1.0
05
1015
second component
Figure 3.1. Estimates of the time transformation φ(left), the firstcomponent function f1 (middle) and the second component func-tion f2 (right) obtained by applying the model of Example 2.3 tothe mortality data.

In-sample forecasting 883
4. A super-simulation-algorithm
This section introduces a simpler, faster and more flexible algorithm to calcu-late the basic estimator of the multiplicative density f(x, y) = f1(x)f2(y). Thesuggested estimator of Martınez-Miranda et al. (2013) and Mammen et al. (2015)requires a two-dimensional local linear density estimator as its starting point beforeprojecting it down on the multiplicative density model. The suggested estimatorof this section is more flexible and it only uses one-dimensional density estimators.The underlying idea of the algorithm is to redistribute mass to truncated areas andit is inspired by the interpretation of the Kaplan-Meier estimator discussed in Efron(1967) and Dinse (1985) as were briefly described in Section 2. In the algorithm,at any given step in the iteration the two independent densities are estimated as ifall data would be available, both the past data and the future data. Before eachiteration step simulated data are added to the data representing future values. Thereason this simple algorithm converges is that future data are lifted from first noth-ing at all to contain something and then after a few more steps to finally contain thebest estimate available. Basically, the main idea of the algorithm can be applied tovarious problems when we want to estimate a model with truncated data. In thispaper, we explore the idea for the multiplicative density model.
Let the density f(x, y) = f1(x)f2(y) be supported on the unit rectangle [0, 1]2,where fj are univariate densities supported on [0, 1]. We wish to estimate thissimple model based on truncated observations (Xi, Yi) ∈ I. We assume that the
projections of I onto x- and y-axis equal [0, 1]. Define the sections of I and I asfollows.
I1(y) = {x ∈ [0, 1] : (x, y) ∈ I}, I2(x) = {y ∈ [0, 1] : (x, y) ∈ I},
I1(y) = {x ∈ [0, 1] : (x, y) ∈ I}, I2(x) = {y ∈ [0, 1] : (x, y) ∈ I}.
We note that I1(y) ∪ I1(y) = [0, 1] for all y ∈ [0, 1], and I2(x) ∪ I2(x) = [0, 1] forall x ∈ [0, 1]. The main advantage of the methods we propose is that they arebased only on one-dimensional estimation. Let g1 and g2 be any one-dimensionalestimators of f1 and f2 based on the marginal observations {Xi : 1 ≤ i ≤ n} and{Yi : 1 ≤ i ≤ n}, respectively.
Algorithm S: Let D[0] = {(Xi, Yi) : 1 ≤ i ≤ n}. Set f[0]1 = g1 and f
[0]2 = g2. For
k = 0, 1, 2, . . ., do the following steps until convergence.
(1) Generate nk pseudo observations in the region I according to the density
f[k]1 and f
[k]2 , where
nk = n ·∫I f
[k]1 (x)f
[k]2 (y) dx dy∫
I f[k]1 (x)f
[k]2 (y) dx dy
. (4.1)
(2) Add the pseudo observations in (1) to D[0] and let D[k+1] denote the com-bined data.
(3) Construct f[k+1]1 and f
[k+1]2 using the marginal observations {Xi} and {Yi},
respectively, with (Xi, Yi) ∈ D[k+1].
(4) Repeat steps (1)-(3) L-times and denote the average values of f[k+1]1 and
f[k+1]2 by f
[k+1]1 and f
[k+1]2 .

884 Y. K. Lee et al.
We used this algorithm with L = 1 where it already gave reasonable results. Forlarge values of L, the main idea of Algorithm S leads to the following mathematicalformulation, which gives rise to an alternative algorithm. Put
A = P ((X,Y ) ∈ I) =
∫If1(x)f2(y) dx dy. (4.2)
First, we note that the pseudo observations, say (Xsi , Y
si ), added to D[0], have a
joint density f(· | I) defined as
f(x, y | I) =
[ ∫If[k]1 (x)f
[k]2 (y) dx dy
]−1f[k]1 (x)f
[k]2 (y), (x, y) ∈ I. (4.3)
Their marginal densities are given by
f1(x | I) =
[ ∫If[k]1 (x)f
[k]2 (y) dx dy
]−1 ∫I2(x)
f[k]1 (x)f
[k]2 (y) dy, x ∈ [0, 1],
f2(y | I) =
[ ∫If[k]1 (x)f
[k]2 (y) dx dy
]−1 ∫I1(y)
f[k]1 (x)f
[k]2 (y) dx, y ∈ [0, 1].
On the other hand, the marginal densities fj restricted to the region I, say fj(· | I),
are estimated from the original observations (Xi, Yi) by fj(· | I). This means thatthe marginal density estimators of fj may be updated according to
f[k+1]1 (x) = A[k] · f1(x | I) + (1− A[k]) · f1(x | I),
f[k+1]2 (y) = A[k] · f2(y | I) + (1− A[k]) · f2(y | I),
(4.4)
where A[k] is an estimator of A defined at (4.2) in the kth update. Taking
A[k] =
∫If[k]1 (x)f
[k]2 (y) dx dy =
n
n+ nk
gives
f[k+1]1 (x) =
(∫If[k]1 (x)f
[k]2 (y) dx dy
)· f1(x | I) +
∫I2(x)
f[k]1 (x)f
[k]2 (y) dy,
f[k+1]2 (y) =
(∫If[k]1 (x)f
[k]2 (y) dx dy
)· f2(y | I) +
∫I1(y)
f[k]1 (x)f
[k]2 (y) dx.
(4.5)
It is worthwhile to note that, if fj(· | I) are densities, i.e., fj(· | I) ≥ 0 and∫ 1
0fj(u | I) du = 1, then are all the updates f
[k+1]j for k ≥ 0 as well. This is
clear since ∫If[k]1 (x)f
[k]2 (y) dx dy +
∫If[k]1 (x)f
[k]2 (y) dx dy = 1.
The algorithm (4.5) is basically equivalent to Algorithm S. The only difference
is that Algorithm S actually generates pseudo data from f(· | I) at (4.3), while
(4.5) uses f(· | I) directly, to update the estimators of the marginal densities fj =
Afj(· | I) + (1−A)fj(· | I). Contrary to Algorithm S, the algorithm (4.5) does not
require simulating pseudo data in I. In our theoretical development to be presentedin the next section, we focus on the latter.
Define
fw,1(x) =
∫I2(x)
f1(x)f2(v) dv, fw,2(y) =
∫I1(y)
f1(u)f2(y) du.

In-sample forecasting 885
With these definitions we note that A =∫ 1
0fw,1(x) dx =
∫ 1
0fw,2(y) dy. For nota-
tional convenience we set gj = fj(· | I) and gj = fj(· | I). Thus,
g1(x) = A−1 · fw,1(x), g2(y) = A−1 · fw,2(y), (4.6)
The estimating equation for fj as estimators of fj that corresponds to the iterationscheme (4.5) is given by
f1(x) =
(∫If1(x)f2(y) dx dy
)· g1(x) +
∫I2(x)
f1(x)f2(y) dy,
f2(y) =
(∫If1(x)f2(y) dx dy
)· g2(y) +
∫I1(y)
f1(x)f2(y) dx.
(4.7)
The population version of the estimating equation (4.7) is then
f1(x) =
(∫If1(x)f2(y) dx dy
)· g1(x) +
∫I2(x)
f1(x)f2(y) dy,
f2(y) =
(∫If1(x)f2(y) dx dy
)· g2(y) +
∫I1(y)
f1(x)f2(y) dx,
(4.8)
which is clearly satisfied by the true component functions fj . For a triangularset I = {(x, y) : 0 ≤ x, y ≤ 1, x + y ≤ 1} a version of the estimator defined by(4.7) based on a two-dimensional density estimator has been discussed in Mammenet al. (2015). In this paper the backfitting algorithm (4.5) has been used for thecalculation of the estimators.
We close this section by reporting a brief simulation result for the new estimatorsdefined through the equations (4.7). We took {(x, y) ∈ [0, 1]2 : 0 ≤ x + y ≤ 1} forthe support set I. For the marginal density functions, we set f1(x) = (3/2) − xand f2(y) = (5/4) − (3/4)y2. We generated 100 pseudo samples (Xi, Yi) of sizesn = 400 and 1, 000 from the joint density p(x, y) = A−1f1(x)f2(y)I((x, y) ∈ I).We used the local linear estimators for gj in (4.7) as defined below. For a baselinekernel function K and a bandwidth h > 0, let Kh(v) = K(v/h)/h and define
Aj(u) =
∫ 1
0
(1 (v − u)/hj
(v − u)/hj (v − u)2/h2j
)Khj (v − u) dv. (4.9)
Also, define
bj(u) = n−1n∑i=1
(1
(W(j)i − u)/hj
)Khj
(W(j)i − u), (4.10)
where W(j)i = Xi for j = 1 and Yi for j = 2. Our estimators gj of gj are the
first entries of the vectors A−1j bj . We chose the Epanechnikov kernel K(u) =
(3/4)(1− u2)I[−1,1](u).
new algorithm old algorithmf1 f2 f1 f2
n = 400 0.01279 0.01195 0.01902 0.00579n = 1000 0.00946 0.00746 0.01870 0.00523
Table 4.1. Mean integrated squared error (MISE) of the component func-
tion estimators fj based on 100 MC samples of sizes n = 400 and n = 1, 000.

886 Y. K. Lee et al.
Table 1 shows the mean integrated squared errors of the new estimators fjbased on the algorithm (4.5) and those based on the two-dimensional local lineardensity estimator as in Mammen et al. (2015). The numbers in the table are themean integrated squared errors for the optimal bandwidth choices h = h1 = h2that gave the minimal MISE(f1) + MISE(f2) in a range of preselected bandwidths.The optimal bandwidths for the new algorithm were different from those for theold algorithm. Also, these common optimal bandwidths may be better for onecomponent, but worse for the other. Indeed, the MISE results indicate that thenew algorithm is better for estimating f1, but not for f2. If we compare the sum
when n = 400, the value of MISE(f1) + MISE(f2) equals 0.02474 for the newalgorithm and 0.02481 for the old, so there is not much difference between them.However, when n = 1000, it equals 0.01692 for the new and 0.02393 for the old.
Figure 4.2 depicts the distributions of the computing times in seconds for thetwo methods. These results strongly suggest that the new algorithm outperformsthe old one in terms of computing time. There appears a bimodal structure in thedistribution of computing times for both the new and old methods. This is clearerfor the new algorithm but there is some evidence for the old as well. We note thatthe area around the first mode for the old algorithm is dominating that aroundthe second mode. We found that the mass around the second mode was roughly7%, while it was around 16% in the case of the new algorithm. We also found thatboth algorithms converged in 4-7 iterations. This means that the elapsed time fora single iteration was roughly 0.02 sec for the new algorithm, and roughly 20 secfor the old. Thus, the gap between the first and second modes in the case of thenew algorithm is just a matter of one or two additional iterations, while the gap inthe case of the old algorithm seems mostly due to a small fluctuation in computingthe two-dimensional local linear density estimates.
0.10 0.12 0.14 0.16
(a)
113.5 114.0 114.5
(b)
Figure 4.2. The distributions of the times (in seconds) for com-puting the component estimates per sample, based on 100 MCsamples of size n = 1, 000. Panel (a) is for the new algorithm and(b) for the old one.

In-sample forecasting 887
5. Asymptotic theory
We study the statistical properties of the estimators fj that satisfy the systemof equations at (4.7). The theory developed in this section generalises the resultsof Mammen et al. (2015) to a general class of sets I. In the latter paper onlytriangular sets I = {(x, y)> : 0 ≤ x, y ≤ 1, x+ y ≤ 1} have been discussed. We alsoconsider now estimators of f1 and f2 based on the local linear estimators of g1 andg2, defined after the equations (4.9) and (4.10).
Basically we make the following assumptions.
(A1) The marginal densities fj are continuous and bounded away from zero andinfinity on [0, 1];
(A2) The projections of I onto x- and y-axis equal [0, 1]. Also, there exist se-quences x0 = 0 < x1 < ... < xk = 1 and y0 = 1 > y1 > ... > yk = 0 with(x, yj) ∈ I for xj ≤ x ≤ xj+1, or with (xj , y) ∈ I for yj ≤ y ≤ yj+1, for all0 ≤ j ≤ k − 1.
The condition (A2) means that the support set I contains a ladder that traversesthe entire interval [0, 1] along the x- or y-axis.
We write f = (f1, f2)> and f = (f1, f2)>. Let F denote the class of tuples ofunivariate functions η ≡ (η1, η2)> such that ηj are nonnegative, continuous on [0, 1]
and∫ 1
0ηj = 1. Also, let F0 be the class of tuples of univariate functions such that
ηj are continuous on [0, 1] and∫ 1
0ηj = 0. Define F(η) = (F1(η), F2(η))> as a map
from F to F0 by
F1(η)(x) = η1(x)−(∫Iη1(u)η2(v) du dv
)· g1(x)−
∫I2(x)
η1(x)η2(v) dv,
F2(η)(y) = η2(y)−(∫Iη1(u)η2(v) du dv
)· g2(y)−
∫I1(y)
η1(u)η2(y) du.
Likewise, define F with gj replacing gj , respectively. We note that
F(f) = 0, F(f) = 0. (5.1)
Now, define
G(η) = F(f · (1 + η)), G(η) = F(f · (1 + η)),
where, for vectors a = (a1, a2)> and b = (b1, b2)>, we write a · b for (a1b1, a2b2)>,
a/b for (a1/b1, a2/b2)> and a±b for (a1± b1, a2± b2)>. Both G and G map S toF0, where
S = {η ∈ C[0, 1]× C[0, 1] :
∫ 1
0
ηj fj = 0}.
Then, the two equations at (5.1), respectively, are equivalent to
G(0) = 0, G((f − f)/f) = 0. (5.2)
Both the maps G and G are nonlinear. To analyze δ := (f − f)/f as the solution
of the second equation at (5.2), we consider the linear approximation of G based
on its Frechet derivative. Let G′(0) : S → F0 denote the Frechet derivative of G

888 Y. K. Lee et al.
at 0. It is given by
G′(0)1(δ)(x) = δ1(x)f1(x)− g1(x) ·∫I
[δ1(u) + δ2(v)] f1(u)f2(v) du dv
−∫I2(x)
[δ1(x) + δ2(v)] f1(x)f2(v) dv,
G′(0)2(δ)(y) = δ2(y)f2(y)− g2(y) ·∫I
[δ1(u) + δ2(v)] f1(u)f2(v) du dv
−∫I1(y)
[δ1(u) + δ2(y)] f1(u)f2(y) du.
(5.3)
Similarly, we get G′(0)(δ) by simply replacing gj by gj in the expression for G′(0).
We note that with δ = (f − f)/f
0 = G(δ) ' G(0) + G′(0)(δ)
' G(0) + G′(0)(δ)
= G(0)−G(0) + G′(0)(δ).
(5.4)
Recall the definitions of A at (4.2) and gj at (4.6). We get
−[G(0)−G(0)
]= A · (g − g).
The approximation (5.4) motivates an approximation of f , which is easier to ana-lyze. Define f = (f1, f2)> by
G′(0)(δ) = A · (g − g), (5.5)
where δ = (f − f)/f . Our first theorem demonstrates that G′(0) is invertible, sothat δ and thus f are well-defined. The theorem requires an additional assumption.
(A3) For j = 1 and 2, mes(Ij(u)) > 0 except for a finite number of pointsu ∈ [0, 1].
Before stating the theorem, we introduce some terminologies that are usedthroughout this section. Note that g1 and thus fw,1 equal zero only at pointsu such that mes(I2(u)) = 0 due to assumption (A1), where mes(I) for a set I de-notes its Lebesgue measure. Similarly, g2 and thus fw,2 equal zero only at points usuch that mes(I1(u)) = 0. Define
Io1 = {x ∈ [0, 1] : mes(I2(x)) > 0}, Io2 = {y ∈ [0, 1] : mes(I1(u)) > 0}.
In the case of the run-off triangular support I = {(x, y) ∈ [0, 1]2 : 0 ≤ x+ y ≤ 1},which is typical for insurance claim data, Ioj = [0, 1) for j = 1 and 2. In the case
of the asbestos data example, I is a parallelogram such that I = {(x, y) ∈ [0, 1]2 :−ax+ 1 ≤ y ≤ −ax+ a} for some a > 1. In this case Io1 = (0, 1) but Io2 = [0, 1].
Theorem 5.1. Assume the conditions (A1)–(A3). Then, the linear operatorG′(0) : S → F0 is invertible.
Our next theorem demonstrates that δ = (f − f)/f is well approximated byδ = (f − f)/f defined to be the solution of the equation (5.5).
In-sample forecasting 889
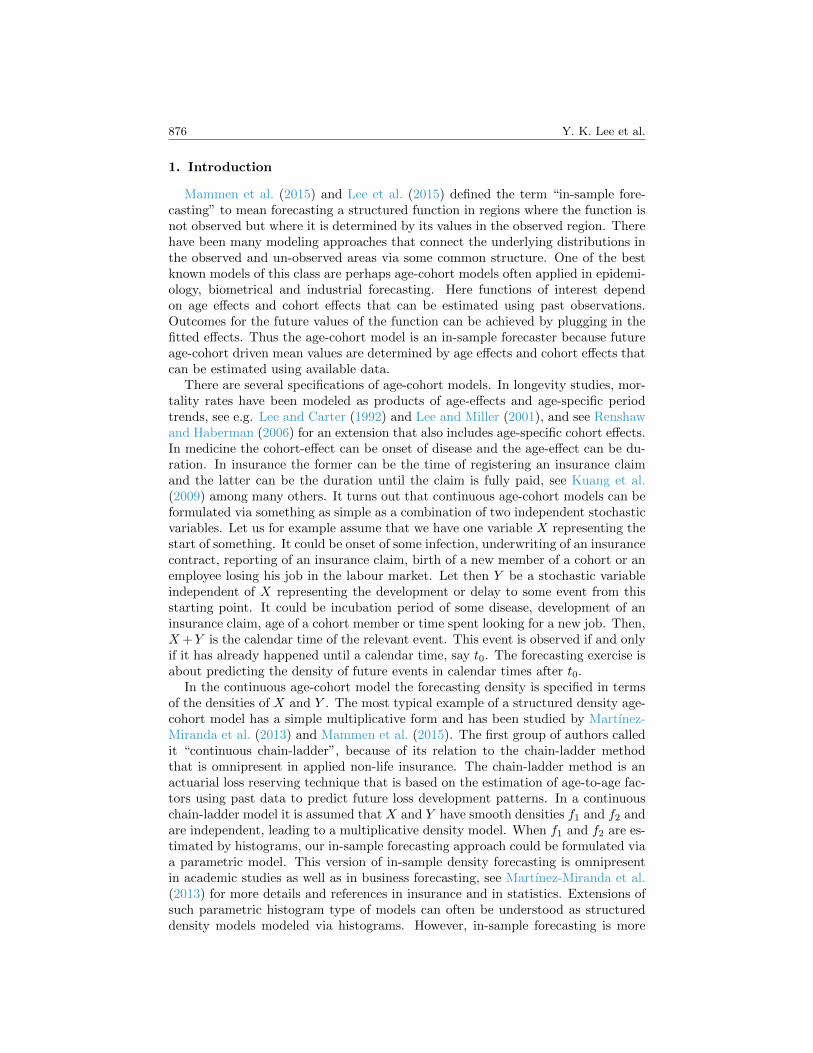
Theorem 5.2. Assume that the conditions of Theorem 5.1 hold. Furthermore,assume that fj are continuously differentiable. Suppose that supu∈[0,1]
∣∣gj(u) −gj(u)
∣∣ = Op(εn), j = 1, 2, for some sequence of real numbers εn → 0. Then,
supx∈[0,1]
∣∣fj(x)− fj(x)∣∣ = Op(ε
2n), j = 1, 2.
Next, we discuss the asymptotic distribution of fj . For gj , we consider the
local linear estimators that are the first entries of the vectors A−1j bj , respectively,
where Aj and bj are defined at (4.9) and (4.10), respectively. From the standardtheory of local linear kernel smoothing, it holds that supu∈[0,1]
∣∣gj(u) − gj(u)∣∣ =
Op(n−2/5√log n) with hj ∼ n−1/5.
To state the theorem, define
gBj (u) =1
2
(∫u2K
)c2j g′′j (u),
where cj � n1/5hj . Also, define β ∈ S to be the solution of G′(0)(β) = A · gB . Let
σ21(x) = c−11
∫K2/g1(x) and σ2
2(y) = c−12
∫K2/g2(y).
Theorem 5.3. Assume that the conditions of Theorem 5.1 hold. Furthermore,assume that fj are twice continuously differentiable, that K is supported on [−1, 1],
symmetric and Lipschitz continuous, and that n1/5hj → cj for some 0 < cj < ∞.
Let x and y be fixed points in Io1 ∩ (0, 1) and Io2 ∩ (0, 1). Then, n2/5(f1(x) −f1(x))/f1(x) and n2/5(f2(y) − f2(y))/f2(y), respectively, converges to
N(β1(x), σ21(x)) and N(β2(y), σ2
2(y)). Furthermore, n2/5(f1(x)− f1(x))/f1(x) and
n2/5(f2(y)− f2(y))/f2(y) are asymptotically independent.
6. Concluding remarks
In-sample forecasting, as reviewed in this paper, is a recent generalisation ofa long list of practitioner methods - often based on discrete histogram type ofmethodology - to a modern structured nonparametric smoothing approach. Theterm in-sample forecasting is new and adds one more method in one single conceptto our toolbox of forecasting procedures. The two other major methods of forecast-ing are time series forecasting and simple deterministic extrapolation. We believethat the stability of in-sample forecasting, that do not extrapolate any parametersused for forecasting, will serve as a useful alternative to the often less stable timeseries methodology. Clearly, however, in-sample forecasting cannot model every-thing, and sometimes there really is a time series to be estimated and forecasted.One can even imagine a latent time series to be present within an in-sample fore-casting study, for example a calendar effect. This time series is best dealt with thetraditional time series methodology. One can therefore imagine a future blend ofin-sample forecasting and time series methodology and using the best from bothworlds of forecasting to provide an output that is stable as well as flexible. Onecan also imagine much more flexible in-sample forecasting methods in the futureinvolving many more structured nonparametric models than those considered inthis paper. This in turn asks for the development of a general statistical testingrules to pick among the available model options.

890 Y. K. Lee et al.
Appendix
A.1. Proof of Theorem 5.1. Let δ ∈ S. Then,∫ 1
0δj fj = 0. From the versions of
the two equations at (5.3) for G′(0), we get that
G′(0)1(δ)(x)
fw,1(x)= δ1(x) +
∫I2(x)
δ2(v)f1(x)f2(v)
fw,1(x)dv
−∫ 1
0
δ1(u)g1(u) du−∫ 1
0
δ2(v)g2(v) dv, x ∈ I01 ,
G′(0)2(δ)(y)
fw,2(y)= δ2(y) +
∫I1(y)
δ1(u)f1(u)f2(y)
fw,2(y)du
−∫ 1
0
δ1(u)g1(u) du−∫ 1
0
δ2(v)g2(v) dv, y ∈ Io2 .
(A.1)
Due to assumption (A3), for each of the two functions G′(0)j(δ)/fw,j there existsa unique function that is continuous on the whole interval [0, 1] and coincides withG′(0)j(δ)/fw,j on Ioj . We continue to denote the extended continuous functions byG′(0)j(δ)/fw,j . Let
S ′ = {η ∈ C[0, 1]× C[0, 1] :
∫ 1
0
ηj gj = 0}.
Then, writing fw = (fw,1, fw,2)>, it holds that G′(0)1(δ)/fw ∈ S ′ for all δ ∈ S.We now consider a linear operator L : S → S ′ such that L(η) = (L1(η1), L2(η2))>
and
Lj(ηj) = ηj −∫ 1
0
ηj gj , j = 1, 2.
Its inverse map L−1 : S ′ → S is given by L−1(η) = (L−11 (η1), L−12 (η2))> with
L−1j (ηj) = ηj −∫ 1
0
ηj fj , j = 1, 2.
We define T : S ′ → S ′ by
T(η) =G′(0)(L−1(η))
fw. (A.2)
Then, it follows from (A.1) that
T1(η)(x) = η1(x) +
∫I2(x)
η2(v)f1(x)f2(v)
fw,1(x)dv,
T2(η)(y) = η2(y) +
∫I1(y)
η1(u)f1(u)f2(y)
fw,2(y)du.
(A.3)
From the definition of the map T at (A.2), the invertibility of G′(0) is equivalentto the invertibility of T. We prove T is invertible. We endow S ′ with an innerproduct 〈·, ·〉 defined by
〈η, δ〉 =
∫[0,1]2
η(x, y)>(fw,1(x) 0
0 fw,2(y)
)δ(x, y) dx dy.
Suppose that T(η) = 0 for some η ∈ S ′. Then, it holds that
0 = 〈η,T(η)〉 =
∫I
[η1(x) + η2(y)]2f1(x)f2(y) dx dy. (A.4)
In-sample forecasting 891
This implies thatη1(x) + η2(y) = 0 for all (x, y) ∈ I. (A.5)
Because of assumption (A2), either η1 or η2 is piecewise constant, so that either
η1 or η2 is a zero function since ηj are continuous and satisfy∫ 1
0ηj gj = 0. This
implies that both are zero functions. This proves that T is one-to-one.Now, we prove T is onto. Similarly as in deriving (A.4), we get that, for any
η, δ ∈ S ′,
〈η,T(δ)〉 =
∫I
[η1(x) + η2(y)] [δ1(x) + δ2(y)] f1(x)f2(y) dx dy
= 〈T(η), δ〉.(A.6)
This implies that T is self-adjoint, so that Image(T)⊥ = Null(T) = {0}. It sufficesto show that Image(T) is closed. Suppose that {δn} ⊂ S ′ and T(δn)→ η for someη ∈ S ′. We prove that η ∈ Image(T). Note that T : S ′ → Image(T) is invertible.Its inverse denoted by T−1 : Image(T) → S ′ is also linear and continuous due toBanach Inverse Theorem. Thus, δn = T−1(T(δn)) is Cauchy in S ′ so that thereexists δ ∈ S ′ such that δn → δ. Now,
T(δ) = T(
limn→n
δ)
= limn→n
T(δn) = η.
This completes the proof of the invertibility of T, and thus of G′(0).
A.2. Proof of Theorem 5.2. Clearly from the expression of G′(0) in (5.3) it followsthat there exists a constant 0 < C1 <∞ such that∥∥G′(0)(δ)−G′(0)(δ)
∥∥∞ ≤ C1 · ‖g − g‖∞ · ‖δ‖∞,
where ‖η‖∞ = supx∈[0,1] |η1(x)|+ supy∈[0,1] |η2(y)|. Thus,
sup‖δ‖∞=1
∥∥G′(0)(δ)−G′(0)(δ)∥∥∞ = Op(εn). (A.7)
We may also prove that there exist constants 0 < r,C2 < ∞ such that, withprobability tending to one,
sup‖δ‖∞=1
∥∥G′(η1)(δ)−G′(η2)(δ)∥∥∞ ≤ C2‖η1−η2‖∞ for all η1,η2 ∈ Br(0), (A.8)
where Br(0) denotes the ball in S with radius r centered at 0. Along the lines ofthe proof of Theorem 3 in Lee et al. (2015) with (A.7) and (A.8), we may provethe theorem.
A.3. Proof of Theorem 5.3. Due to Theorem 5.2, the asymptotic distributions of
fj are determined by fj . For a given ε > 0, put
Iε1 = {x ∈ [0, 1] : mes(I2(x)) ≥ ε, infy∈I2(x)
mes(I1(y)) ≥ ε},
Iε2 = {y ∈ [0, 1] : mes(I1(y)) ≥ ε, infx∈I1(y)
mes(I2(x)) ≥ ε}.
We note that for the triangular support Iε1 = Iε2 = [ε, 1−ε], and for the parallelogramsupport Iε1 = [c · ε, 1− c · ε] and Iε2 = [C · ε, 1− C · ε] for some 0 < c,C <∞.
To analyze fj , we recall that δ is defined by G′(0)(δ) = A · (g − g), see (5.5).We decompose gj − gj as gj − gj = gAj + gBj , where
gAj = gj − E(gj), gBj = E(gj)− gj .

892 Y. K. Lee et al.
Note that gBj are non-stochastic. For s = A and B, define δs to be the solution of
G′(0)(δs) = A · gs. Then, it holds that
δ = δA + δB . (A.9)
We may prove that, for any ε > 0,∫I2(x)
gA2 (v)
(∫I1(v)
f1(u) du
)−1dv = op(n
−2/5),
∫I1(y)
gA1 (u)
(∫I2(u)
f2(v) dv
)−1du = op(n
−2/5)
uniformly for (x, y) ∈ Iε1 × Iε2. The latter may be proved as in the proof of Lemma
2 in Lee et al. (2015). From this and the expression of G′(0), a version of G′(0) at(5.3) with gj being replaced by gj , it holds that, for any ε > 0,
δA = G′(0)−1(A · gA) = gA/g + op(n−2/5) (A.10)
uniformly for (x, y) ∈ Iε1 × Iε2.Now, let x and y be fixed points in Io1 and Io2 , respectively. Then, there exists
ε0 > 0 such that x ∈ Iε01 and y ∈ Iε02 . Because of (A.10) this implies that
δA1 (x) = gA1 (x)/g1(x) + op(n−2/5), δA2 (y) = gA2 (y)/g2(y) + op(n
−2/5). (A.11)
The first-order asymptotic properties of δA1 (x) and δA2 (y) are readily obtained fromthose of gA1 (x) and g2(y), respectively.
Next, we consider δB in the decomposition (A.9). We first note that gBj =
n−2/5gBj + rj for j = 1, 2, where rj are generic terms such that
supu∈[0,1]
|rj(u)| = O(n−2/5), supu∈[h,1−h]
|rj(u)| = o(n−2/5).
Writing r = (r1, r2)>, we get that, for any ε > 0, δB = n−2/5 · β + r uniformlyfor (x, y) ∈ Iε1 × Iε2. Now, let x and y be fixed points in Io1 ∩ (0, 1) and Io2 ∩ (0, 1),respectively. Then, it holds that
δB1 (x) = n−2/5 · β1(x) + o(n−2/5), δB2 (y) = n−2/5 · β2(y) + o(n−2/5). (A.12)
The expansions (A.11) and (A.12) give the theorem.
References
D. Antonczyk, B. Fitzenberger, E. Mammen and K. Yu. A nonparametric approachto identify age, time and cohort effects (2017). Preprint.
E. Beutner, S. Reese and J.-P. Urbain. Identifiability issues of age-period andage-period-cohort models of the Lee-Carter type. Insurance Math. Econom. 75,117–125 (2017). MR3670066.
M. N. Chang and G. L. Yang. Strong consistency of a nonparametric estimator ofthe survival function with doubly censored data. Ann. Statist. 15 (4), 1536–1547(1987). MR913572.
S. Chen and H. Zhao. Estimating incremental cost-effectiveness ratios and theirconfidence intervals with different terminating events for survival time and costs.Biostatistics 14 (3), 422–432 (2013a). DOI: 10.1093/biostatistics/kxt002.

In-sample forecasting 893
S. Chen and H. Zhao. Generalized redistribute-to-the-right algorithm: applicationto the analysis of censored cost data. J. Stat. Theory Pract. 7 (2), 304–323(2013b). MR3196602.
G. E. Dinse. An alternative to efron’s redistribution-of-mass construction of thekaplanmeier estimator. The American Statistician 39 (4), 299–300 (1985). DOI:10.1080/00031305.1985.10479453.
B. Efron. The two sample problem with censored data. In Proceedings of theFifth Berkeley Symposium on Mathematical Statistics and Probability, Volume 4:Biology and Problems of Health, pages 831–853. University of California Press,Berkeley, Calif. (1967).
B. Efron and V. Petrosian. Nonparametric methods for doubly truncated data. J.Amer. Statist. Assoc. 94 (447), 824–834 (1999). MR1723343.
E. A. Gehan. A generalized two-sample wilcoxon test for doubly censored data.Biometrika 52 (3/4), 650–653 (1965). DOI: 10.2307/2333721.
M. G. Gu and C.-H. Zhang. Asymptotic properties of self-consistent estimatorsbased on doubly censored data. Ann. Statist. 21 (2), 611–624 (1993). MR1232508.
M. Hiabu, E. Mammen, M. D. Martınez-Miranda and J. P. Nielsen. In-sampleforecasting with local linear survival densities. Biometrika 103 (4), 843–859(2016a). DOI: 10.1093/biomet/asw038.
M. Hiabu, C. Margraf, M. D. Martınez-Miranda and J. P. Nielsen. Cash flowgeneralisations of non-life insurance expert systems estimating outstanding li-abilities. Expert Systems with Applications 45, 400 – 409 (2016b). DOI:10.1016/j.eswa.2015.09.021.
M. Hiabu, C. Margraf, M. D. Martınez-Miranda and J. P. Nielsen. The link be-tween classical reserving and granular reserving through double chain ladderand its extensions. British Actuarial Journal 21 (1), 97–116 (2016c). DOI:10.1017/S1357321715000288.
J. T. Hodgson, D. M. McElvenny, A. J. Darnton, M. J. Price and J. Peto. Theexpected burden of mesothelioma mortality in Great Britain from 2002 to 2050.British Journal Of Cancer 92, 587 (2005). DOI: 10.1038/sj.bjc.6602307.
D. Kuang, B. Nielsen and J. P. Nielsen. Chain-ladder as maximum likeli-hood revisited. Annals of Actuarial Science 4 (1), 105–121 (2009). DOI:10.1017/S1748499500000610.
R. Lee and T. Miller. Evaluating the performance of the lee-carter methodfor forecasting mortality. Demography 38 (4), 537–549 (2001). DOI:10.1353/dem.2001.0036.
R. D. Lee and L. R. Carter. Modeling and forecasting u. s. mortality. Jour-nal of the American Statistical Association 87 (419), 659–671 (1992). DOI:10.2307/2290201.
Y. K. Lee. Estimation of a semiparametric multiplicative density model. J. KoreanStatist. Soc. 45 (4), 647–653 (2016). MR3566169.
Y. K. Lee, E. Mammen, J. P. Nielsen and B. U. Park. Asymptotics for in-sampledensity forecasting. Ann. Statist. 43 (2), 620–651 (2015). MR3319138.
Y. K. Lee, E. Mammen, J. P. Nielsen and B. U. Park. Operational time and in-sample density forecasting. Ann. Statist. 45 (3), 1312–1341 (2017). MR3662456.
H. M. Malani. A modification of the redistribution to the right algorithm usingdisease markers. Biometrika 82 (3), 515–526 (1995). DOI: 10.2307/2337530.

894 Y. K. Lee et al.
E. Mammen, M. D. Martınez-Miranda and J. P. Nielsen. In-sample forecastingapplied to reserving and mesothelioma mortality. Insurance Math. Econom. 61,76–86 (2015). MR3324046.
E. Mammen and J. P. Nielsen. Generalised structured models. Biometrika 90 (3),551–566 (2003). MR2006834.
E. Mammen, B. U. Park and M. Schienle. Additive models: extensions and relatedmodels. In The Oxford handbook of applied nonparametric and semiparametriceconometrics and statistics, pages 176–211. Oxford Univ. Press, Oxford (2014).MR3306926.
M. D. Martınez-Miranda, B. Nielsen and J. P. Nielsen. Inference and forecastingin the age-period-cohort model with unknown exposure with an application tomesothelioma mortality. J. Roy. Statist. Soc. Ser. A 178 (1), 29–55 (2015).MR3291760.
M. D. Martınez-Miranda, B. Nielsen and J. P. Nielsen. Simple benchmark formesothelioma projection for great britain. Occupational and EnvironmentalMedicine (2016). DOI: 10.1136/oemed-2015-103303.
M. D. Martınez-Miranda, B. Nielsen, J. P. Nielsen and R. J. Verrall. Cash flowsimulation for a model of outstanding liabilities based on claim amounts andclaim numbers. ASTIN Bulletin 41 (1), 107–129 (2011).
M. D. Martınez-Miranda, J. P. Nielsen, S. Sperlich and R. J. Verrall. Contin-uous chain ladder: Reformulating and generalizing a classical insurance prob-lem. Expert Systems with Applications 40 (14), 5588 – 5603 (2013). DOI:10.1016/j.eswa.2013.04.006.
M. D. Martınez-Miranda, J. P. Nielsen and R. Verrall. Double chain ladder. AstinBull. 42 (1), 59–76 (2012). MR2931855.
M. D. Martınez-Miranda, J. P. Nielsen and R. J. Verrall. Double chain ladderand bornhuetter-ferguson. North American Actuarial Journal 17 (2), 101–113(2013). DOI: 10.1080/10920277.2013.793158.
C. Moreira and J. de Una Alvarez. Kernel density estimation with doubly truncateddata. Electron. J. Stat. 6, 501–521 (2012). MR2988417.
C. Moreira, J. de Una Alvarez and L. Meira-Machado. Nonparametric regressionwith doubly truncated data. Comput. Statist. Data Anal. 93, 294–307 (2016).MR3406213.
C. Moreira and I. Van Keilegom. Bandwidth selection for kernel density estimationwith doubly truncated data. Comput. Statist. Data Anal. 61, 107–123 (2013).MR3063004.
P. A. Mykland and J.-J. Ren. Algorithms for computing self-consistent and max-imum likelihood estimators with doubly censored data. Ann. Statist. 24 (4),1740–1764 (1996). MR1416658.
R. O’Brien. Age-Period-Cohort Models: Approaches and Analyses with AggregateData. Chapman & Hall/CRC Press, London, 1st edition (2014).
J. Peto, F. E. Matthews, J.T. Hodgson and J.R. Jones. Continuing increase inmesothelioma mortality in britain. The Lancet 345 (8949), 535–539 (1995).DOI: 10.1016/S0140-6736(95)90462-X.
C. Rake, C. Gilham, A. Hatch, J.and Darnton, J. Hodgson and J. Peto. Occupa-tional, domestic and environmental mesothelioma risks in the british population:a case-control study. British Journal of Cancer 100, 1175–83 (2009). DOI:10.1038/sj.bjc.6604879.

In-sample forecasting 895
A.E. Renshaw and S. Haberman. A cohort-based extension to the leecarter modelfor mortality reduction factors. Insurance: Mathematics and Economics 38 (3),556 – 570 (2006). DOI: 10.1016/j.insmatheco.2005.12.001.
A. Riebler, L. Held and H. Rue. Estimation and extrapolation of time trendsin registry data-borrowing strength from related populations. Ann. Appl. Stat.6 (1), 304–333 (2012). DOI: 10.1214/11-AOAS498.
T. R. Smith and J. Wakefield. A review and comparison of age-period-cohort modelsfor cancer incidence. Statist. Sci. 31 (4), 591–610 (2016). MR3598741.
E. Tan, N. Warren, A. J. Darnton and J. T. Hodgson. Projection of mesotheliomamortality in Britain using Bayesian methods. British Journal Of Cancer 103,430 (2010). DOI: 10.1038/sj.bjc.6605781.
E. Tan, N. Warren, A. J. Darnton and J. T. Hodgson. Modelling mesothelioma mor-tality in great britain using the two-stage clonal expansion model. Occupationaland Environmental Medicine 68 (2011).
B. W. Turnbull. Nonparametric estimation of a survivorship function with doublycensored data. J. Amer. Statist. Assoc. 69, 169–173 (1974). MR0381120.
B. W. Turnbull. The empirical distribution function with arbitrarily grouped, cen-sored and truncated data. J. Roy. Statist. Soc. Ser. B 38 (3), 290–295 (1976).MR0652727.
R. J. Verrall, J. P. Nielsen and A. H. Jessen. Prediction of rbns and ibnr claimsusing claim amounts and claim counts. ASTIN Bulletin 40 (2), 871–887 (2010).DOI: 10.2143/AST.40.2.2061139.


![[R]evolution V15 Preview](https://img.pdfslide.us/doc/110x75/568c4a6e1a28ab4916981e7d/revolution-v15-preview.jpg)