Embed Size (px)
Citation preview
Energy Research and Development Division
FINAL PROJECT REPORT
Natural Gas Distribution in California’s Low-Carbon Future Technology Options, Customer Costs, and Public Health Benefits
DRAFT
DO NOT CITE OR QUOTE
Gavin Newsom, Governor
October 2019 | CEC-500-2019-055-D
PREPARED BY:
Primary Authors:
Dan Aas, Amber Mahone, Zack Subin, Michael Mac Kinnon, Blake Lane, Snuller Price
Additional contributors: Doug Allen, Charles Li, Gabe Mantegna
Energy and Environmental Economics, Inc.
44 Montgomery Street, Suite 1500
415-391-5100
www.ethree.com
University of California, Irvine, Advanced Power and Energy Program
Engineering Laboratory Facility
Irvine, California 92697-3550
949-824-7302
http://www.apep.uci.edu
Contract Number: PIER-16-011
PREPARED FOR:
California Energy Commission
Guido Franco
Project Manager
Jonah Steinbuck, Ph.D.
Office Manager
ENERGY GENERATION RESEARCH OFFICE
Laurie ten Hope
Deputy Director
ENERGY RESEARCH AND DEVELOPMENT DIVISION
Drew Bohan
Executive Director
DISCLAIMER
This report was prepared as the result of work sponsored by the California Energy Commission. It does not necessarily
represent the views of the Energy Commission, its employees or the State of California. The Energy Commission, the
State of California, its employees, contractors and subcontractors make no warranty, express or implied, and assume
no legal liability for the information in this report; nor does any party represent that the uses of this information will
not infringe upon privately owned rights. This report has not been approved or disapproved by the California Energy
Commission nor has the California Energy Commission passed upon the accuracy or adequacy of the information in
this report.

i
ACKNOWLEDGEMENTS
The authors would like to thank the members of the Technical Advisory Committee who
provided valuable input on the draft study results, as well as the California Energy
Commission for making this research possible. Specifically, the authors would like to
thank Guido Franco from the California Energy Commission for his input and help in
guiding the project. All findings, and any errors or omissions, in this study are the
responsibility of the researchers alone.
DRAFT—DO NOT CITE OR QUOTE
ii
PREFACE
The California Energy Commission’s Energy Research and Development Division
manages the Natural Gas Research and Development program, which supports energy-
related research, development, and demonstration not adequately provided by
competitive and regulated markets. These natural gas research investments spur
innovation in energy efficiency, renewable energy and advanced clean generation,
energy-related environmental protection, energy transmission and distribution and
transportation.
The Energy Research and Development Division conducts this public interest natural
gas-related energy research by partnering with RD&D entities, including individuals,
businesses, utilities, and public and private research institutions. This program
promotes greater natural gas reliability, lower costs and increases safety for Californians
and is focused in:
Buildings End-Use Energy Efficiency.
Industrial, Agriculture, and Water Efficiency
Renewable Energy and Advanced Generation
Natural Gas Infrastructure Safety and Integrity.
Energy-Related Environmental Research
Natural Gas-Related Transportation.
Natural Gas Distribution in California’s Low-Carbon Future is the interim report for the
future of natural gas project (PIER-16-011) conducted by Energy and Environmental
Economics and the University of California, Irvine. The information from this project
contributes to the Energy Research and Development Division’s Natural Gas Research
and Development Program.
For more information about the Energy Research and Development Division, please visit
the Energy Commission’s website at www.energy.ca.gov/research/ or contact the
Energy Commission at 916-327-1551.
DRAFT—DO NOT CITE OR QUOTE
iii
ABSTRACT
This study evaluates scenarios that achieve an 80 percent reduction in California’s
greenhouse gas (GHG) emissions by 2050 from 1990 levels, focusing on the
implications of achieving these climate goals for gas customers and the gas distribution
system.
These scenarios suggest that building electrification, which reduces or eliminates the
use of gas in buildings, is likely to be a lower-cost, lower-risk long-term strategy
compared to renewable natural gas (RNG, defined as biomethane, hydrogen and
synthetic natural gas, methane produced by combining hydrogen and carbon).
Furthermore, electrification across all sectors, including in buildings, leads to significant
improvements in outdoor air quality and public health.
In any low-carbon future, gas demand in buildings is likely to fall because of building
electrification and the cost of RNG. In the High Building Electrification scenario, gas
demand in buildings falls 90 percent by 2050 relative to today. In the No Building
Electrification scenario, a higher quantity of RNG is needed to meet the state’s climate
goals, leading to higher gas commodity costs, which, in turn, improve the cost-
effectiveness of building electrification.
The potential for large reductions in gas demand creates a new planning imperative for
the state. The costs of safely operating and maintaining the gas system are likely to
continue to increase and over time will be shared among fewer customers. Without a
gas transition strategy, unsustainable increases in gas rates and customer energy bills
could be seen after 2030, negatively affecting customers who are least able to switch
away from gas, including renters and low-income residents.
Even in the High Building Electrification scenario, millions of gas customers remain on
the gas system through 2050. Thus, this research evaluates potential gas transition
strategies that aim to maintain reasonable gas rates, as well as the financial viability of
gas utilities, through the study period.
Keywords: Natural gas, greenhouse gas emissions, climate change, renewable natural
gas, electrification, equity, air quality and public health
Please use the following citation for this report:
Aas, Dan, Amber Mahone, Zack Subin, Michael Mac Kinnon, Blake Lane, and Snuller
Price. 2019. Natural Gas Distribution in California’s Low-Carbon Future: Technology Options, Customer Costs and Public Health Benefits. California Energy
Commission. Publication Number: CEC-500-2019-055-D.

DRAFT—DO NOT CITE OR QUOTE
iv
DRAFT—DO NOT CITE OR QUOTE
v
TABLE OF CONTENTS
Page
ACKNOWLEDGEMENTS ............................................................................................... i
PREFACE .................................................................................................................. ii
ABSTRACT ............................................................................................................... iii
TABLE OF CONTENTS ............................................................................................... v
LIST OF FIGURES ................................................................................................... vii
LIST OF TABLES ...................................................................................................... ix
EXECUTIVE SUMMARY .............................................................................................. 1
Introduction ........................................................................................................ 1
Project Purpose ................................................................................................... 2
Project Approach ................................................................................................. 3
Project Results .................................................................................................... 4
Knowledge Transfer ............................................................................................. 8
Benefits to California ........................................................................................... 8
CHAPTER 1: Introduction ....................................................................................... 11
Technical Advisory Committee and Public Comments .............................................. 13
Methods .............................................................................................................. 14
Key Findings ........................................................................................................ 16
Building Electrification in California Versus Other Regions .................................... 18
CHAPTER 2: Technology Options to Decarbonize the Natural Gas System .................. 19
Overview ............................................................................................................. 19
Biomethane ......................................................................................................... 20
Biomass Potential .............................................................................................. 20
Conversion Efficiency and Costs ......................................................................... 21
Biomethane Potential ......................................................................................... 21
Biofuel Portfolios ............................................................................................... 22
Electrolytic Fuels: Hydrogen and Synthetic Natural Gas........................................... 23
Overview .......................................................................................................... 23
Projections of Efficiency and Cost for P2G Pathways ............................................ 25
RNG Supply Curve ................................................................................................ 28

DRAFT—DO NOT CITE OR QUOTE
vi
CHAPTER 3: California Economywide Decarbonization Scenarios ............................... 30
Methods .............................................................................................................. 30
PATHWAYS Model ............................................................................................. 30
Scenario Design ................................................................................................ 31
GHG Accounting and Methane Leaks .................................................................. 34
Cost Accounting and Scenario Philosophy............................................................ 35
Scenario Results ................................................................................................... 36
Energy Consumption.......................................................................................... 36
Natural Gas Throughput and Commodity Composition ......................................... 40
Economywide Costs ........................................................................................... 42
Remaining Emissions in 2050 and Implications for Carbon Neutrality .................... 44
Scenario Discussion .............................................................................................. 45
Understanding the Economywide Cost Results ..................................................... 45
Thought Experiment of Decarbonizing Space Heating Using Electricity or RNG ...... 46
Air Quality Results ................................................................................................ 47
CHAPTER 4: Implications for Natural Gas Customers ................................................ 50
California’s Energy Cost Challenge ......................................................................... 50
The Financial Structure of the California Gas System Today .................................... 51
Gas Revenue Requirement—Reference Scenario .................................................... 52
Costs of the Gas System in Mitigation Scenarios ..................................................... 54
Gas Commodity Costs ........................................................................................ 54
Gas System Revenue Requirement and Cost Recovery ......................................... 55
Electric Sector Rates .......................................................................................... 60
Residential Bills ................................................................................................. 61
CHAPTER 5: Envisioning a Natural Gas Transition Strategy ....................................... 65
Gas Transition Mechanisms ................................................................................... 68
Reduce the Costs of the Gas System................................................................... 68
Equitably Allocate the Costs of the Gas System ................................................... 71
Effect of Gas Transition Mechanisms on Rates ..................................................... 73
Example Gas Transition Strategy ........................................................................ 75
Sensitivity of Results to Early Retirements ........................................................... 77
CHAPTER 6: Conclusions ........................................................................................ 79

DRAFT—DO NOT CITE OR QUOTE
vii
GLOSSARY ................................................................. Error! Bookmark not defined.
REFERENCES .......................................................................................................... 85
LIST OF FIGURES
Page
Figure 1. Outside forces driving change in the natural gas delivery sector could lead to
lower gas demand and higher gas rates in future GHG reduction scenarios .................. 5
Figure 2. Illustration of two different gas system futures with and without targeted
electrification ............................................................................................................ 6
Figure 3. Study methods ......................................................................................... 15
Figure 4: Four categories of RNG could be used within existing distribution
infrastructure .......................................................................................................... 20
Figure 5: Schematic of Electrolytic Fuel Pathways ..................................................... 23
Figure 6: Flowchart of analyzed P2G pathways ......................................................... 24
Figure 7: P2G Commodity Costs for Production from a New Plant in 2030 or 2050 ...... 28
Figure 8: California RNG technical potential supply curve in 2050, assuming all biomass
is directed to RNG ................................................................................................... 29
Figure 9: Final Fuel Consumption by Sector in PATHWAYS Scenarios in 2050 .............. 37
Figure 10: Economy-Wide Final Fuel Consumption in PATHWAYS Scenarios ................ 38
Figure 11: Electricity Loads by Sector in PATHWAYS Scenarios .................................. 39
Figure 12: 2050 Curtailment Compared to P2G Loads in the No Building Electrification
Scenario ................................................................................................................. 39
Figure 13: Gas throughput, pipeline gas composition, and pipeline gas blend commodity
cost in PATHWAYS Scenarios ................................................................................... 41
Figure 14: Economy-wide annual net costs, relative to Current Policy Reference scenario
.............................................................................................................................. 43
Figure 15: Energy Emissions by Sector ..................................................................... 44
Figure 16: Illustration of the cost of residential space heating using electricity, natural
gas and 100% renewable natural gas....................................................................... 47
Figure 17: Composition of California’s Gas Revenue Requirement .............................. 52
Figure 18: Reference Gas Revenue Requirement ....................................................... 53
DRAFT—DO NOT CITE OR QUOTE
viii
Figure 19: Reference Gas Rates by Sector ................................................................ 53
Figure 20: Pipeline Gas Demand and Fuel Blend (Million Therms) .............................. 54
Figure 21: Blended Commodity Cost by Scenario ...................................................... 55
Figure 22: Gas Throughput by Sector ....................................................................... 56
Figure 23. Illustration of two different gas system futures with and without targeted
electrification .......................................................................................................... 57
Figure 24: Gas System Revenues in Mitigation Scenarios Assuming Reference Rates ... 57
Figure 25: Percentage Increase Relative to 2019 in Gas Sector Revenue Requirement,
Loads and Average Rates ........................................................................................ 58
Figure 26: Estimated 2019 Gas System Revenues by Customer Type and System
Segment ................................................................................................................. 59
Figure 27: Gas Rates by Sector in the High Building Electrification Scenario ................ 60
Figure 28: Gas Rates by Sector in the No Building Electrification Scenario .................. 60
Figure 29: Percentage Increase in Electric Sector Revenue Requirement, On-Grid Loads
and Average Rates .................................................................................................. 61
Figure 30: Consumer Bills in the No Building Electrification Scenario .......................... 63
Figure 31: Consumer Bills in the High Building Electrification Scenario ........................ 64
Figure 32. Outside forces driving change in the natural gas delivery sector could lead to
lower gas demand and higher gas rates in any number of future scenarios ................ 65
Figure 33: Gas Cost Reduction Scenarios .................................................................. 70
Figure 34: Revenue Requirement with Intensive Reductions and Accelerated
Depreciation ........................................................................................................... 73
Figure 35: Natural Gas Rates with Gas Transition Mechanisms ................................... 74
Figure 36: Revenue Requirement with Gas Transition Strategy .................................. 76
Figure 37: Customer Rates after a Gas Transition Strategy in the HBE Scenario .......... 76
Figure 38: Residential Bills Before and After the Example Gas Transition Scenario ....... 77
DRAFT—DO NOT CITE OR QUOTE
ix
LIST OF TABLES
Page
Table 1: Summary of P2G Assumptions .................................................................... 27
Table 2: PATHWAYS Scenario Summary of Key Metrics for 2050 ................................ 33
Table 3: Mean Health Savings for Air Quality Improvements Estimated for Summer and
Winter Episodes in 2050 .......................................................................................... 49
Table 4: Gas Cost Reduction Scenarios ..................................................................... 70
Table 5: Cost of Early Retirement Sensitivities .......................................................... 78

DRAFT—DO NOT CITE OR QUOTE
x
DRAFT – DO NOT CITE OR QUOTE
1
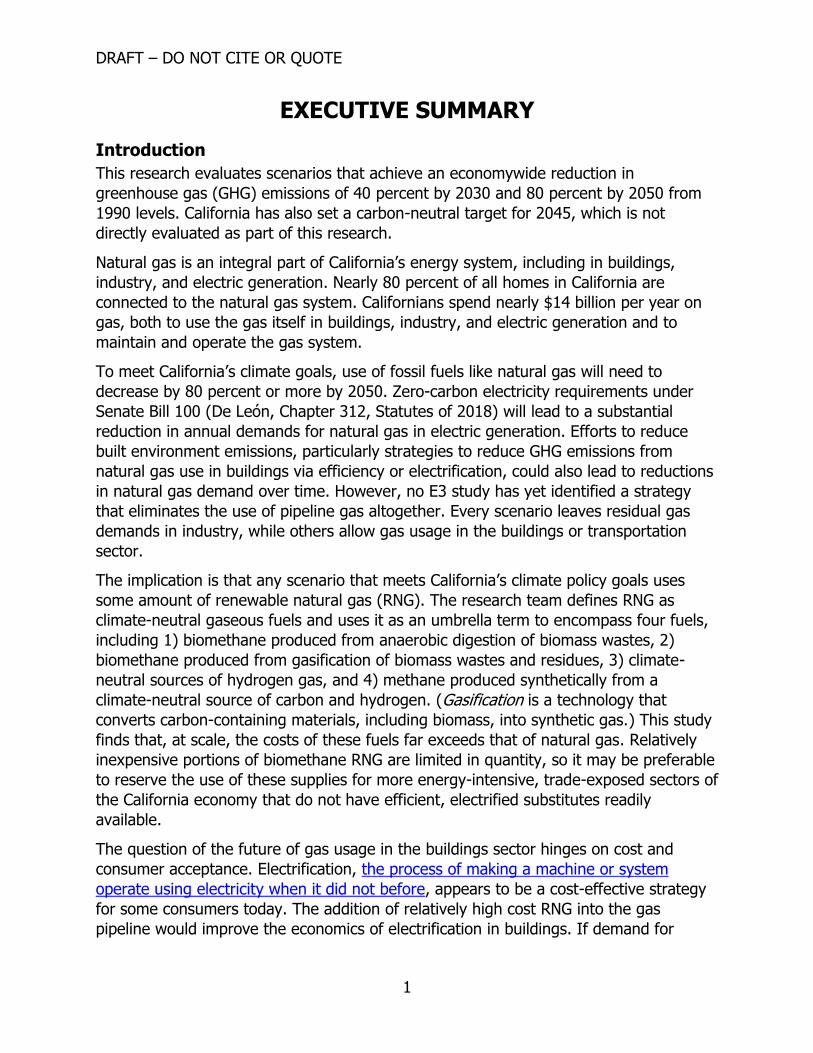
EXECUTIVE SUMMARY
Introduction
This research evaluates scenarios that achieve an economywide reduction in
greenhouse gas (GHG) emissions of 40 percent by 2030 and 80 percent by 2050 from
1990 levels. California has also set a carbon-neutral target for 2045, which is not
directly evaluated as part of this research.
Natural gas is an integral part of California’s energy system, including in buildings,
industry, and electric generation. Nearly 80 percent of all homes in California are
connected to the natural gas system. Californians spend nearly $14 billion per year on
gas, both to use the gas itself in buildings, industry, and electric generation and to
maintain and operate the gas system.
To meet California’s climate goals, use of fossil fuels like natural gas will need to
decrease by 80 percent or more by 2050. Zero-carbon electricity requirements under
Senate Bill 100 (De León, Chapter 312, Statutes of 2018) will lead to a substantial
reduction in annual demands for natural gas in electric generation. Efforts to reduce
built environment emissions, particularly strategies to reduce GHG emissions from
natural gas use in buildings via efficiency or electrification, could also lead to reductions
in natural gas demand over time. However, no E3 study has yet identified a strategy
that eliminates the use of pipeline gas altogether. Every scenario leaves residual gas
demands in industry, while others allow gas usage in the buildings or transportation
sector.
The implication is that any scenario that meets California’s climate policy goals uses
some amount of renewable natural gas (RNG). The research team defines RNG as
climate-neutral gaseous fuels and uses it as an umbrella term to encompass four fuels,
including 1) biomethane produced from anaerobic digestion of biomass wastes, 2)
biomethane produced from gasification of biomass wastes and residues, 3) climate-
neutral sources of hydrogen gas, and 4) methane produced synthetically from a
climate-neutral source of carbon and hydrogen. (Gasification is a technology that
converts carbon-containing materials, including biomass, into synthetic gas.) This study
finds that, at scale, the costs of these fuels far exceeds that of natural gas. Relatively
inexpensive portions of biomethane RNG are limited in quantity, so it may be preferable
to reserve the use of these supplies for more energy-intensive, trade-exposed sectors of
the California economy that do not have efficient, electrified substitutes readily
available.
The question of the future of gas usage in the buildings sector hinges on cost and
consumer acceptance. Electrification, the process of making a machine or system
operate using electricity when it did not before, appears to be a cost-effective strategy
for some consumers today. The addition of relatively high cost RNG into the gas
pipeline would improve the economics of electrification in buildings. If demand for
DRAFT – DO NOT CITE OR QUOTE
2
natural gas in California falls dramatically because of some combination of policy and
economically driven electrification, the fixed costs to maintain and operate the gas
system will be spread over a smaller number of gas sales and, ultimately, will increase
costs for remaining gas customers. This outcome raises the possibility of a feedback
effect where rising gas rates caused by electrification spur additional electrification.
Such a feedback effect would threaten the financial viability of the gas system, as well
as raise substantial equity concerns over the costs that remaining gas system customers
would face. Given these risks, building electrification could serve as a risk-reduction
strategy to protect low-income and vulnerable communities from future gas rate
increases. Conversely, if building electrification is delayed, missing the lower-cost
opportunities for all-electric new construction and replacement of equipment upon
failure, there is a greater risk that expensive early retirement of equipment may be
needed, or that the climate goals could be missed. Furthermore, there are significant
technology and cost risks of commercializing large quantities of renewable natural gas
compared to electrifying buildings, which relies on technologies that are commercialized
today.
Project Purpose
The future of natural gas, in the context of meeting the state’s climate goals, is an
important question for natural gas and electric ratepayers, as well as for policymakers
interested in enabling California’s clean energy transition. The research team plans to
take a forward-looking view of future gas use in California, focusing on implications for,
and strategies to protect, ratepayers.
To do that, this research evaluates the potential cost, energy infrastructure, and air
quality implications of achieving the state’s economywide climate goals. The team’s
research focuses on the state’s gas system, with an emphasis on:
1) Technology options to decarbonize the natural gas system. Specifically,
what are the costs, and resource potential, for renewable natural gas
technologies, including biomethane, hydrogen gas and climate-neutral synthetic
natural gas?
2) Implications for natural gas customers. What are the potential changes in
natural gas demand, rates, and bills associated with meeting California’s climate
goals? What are potential strategies to address the equity implications of
changes in natural gas rates and utility bills while maintaining the safety and
financial viability of the gas system?
3) Outdoor air quality and public health. What are the outdoor air quality and
health benefits of meeting California’s climate goals, and what are the air quality
implications of reducing GHG emissions from natural gas?
The purpose of this research is not to define or recommend policies nor provide a
definitive set of conclusions about California’s energy future. Instead, the research team
strives to use the best information available today to provide insights about how the
DRAFT – DO NOT CITE OR QUOTE
3
decisions made today could affect the state’s future choices. Those insights will inform
researchers and policy makers on potential next steps toward achieving the state’s
clean energy transition.
Project Approach
Energy and Environmental Economics, Inc. (E3), and the Advanced Power and Energy
Program at the University of California, Irvine, (UCI) comprise the research team.
E3 led the development of economywide GHG scenarios using the California PATHWAYS
model, as well as a detailed evaluation of the long-term natural gas rate and bill
impacts of those scenarios. The California PATHWAYS model is a technoeconomic
model of the state’s energy consumption and GHG emissions that has been used and
updated by California energy agencies since 2014.
E3’s natural gas utility revenue requirement tool estimates how changes in natural gas
demand throughput and changes in gas commodity costs could affect natural gas rates,
both over time and by customer class. The revenue requirement tool was developed
specifically for this project and benefited from insights and detailed feedback provided
by the Southern California Gas Company (SoCalGas) and Pacific Gas and Electric
(PG&E) and relied exclusively on publicly available data. Neither SCG nor PG&E was
asked to endorse the revenue requirement tool or the study findings, which remain
entirely the responsibility of the study team.
The UCI Advanced Power and Energy Program team worked with E3 to develop
bottom-up estimates of RNG technology production costs using conservative and
optimistic assumptions about technology learning curves, as well as other key input
parameters.
The UCI team also led the analysis of outdoor air quality and health impacts of
achieving the state’s climate goals. The UCI team used the California PATHWAYS
scenarios as the basis for assumptions about future changes in energy demand by fuel
type and equipment type over time. The UCI team employed a sophisticated set of air
quality modeling tools, including Sparse Matrix Operator Kerner Emissions (SMOKE) to
resolve the emissions spatially by geography, the Community Multiscale Air Quality
Modeling System (CMAQ) to simulate air quality, and the Environmental Benefits
Mapping and Analysis Program (BenMAP) to estimate the health savings effects.
The project team benefited from in-kind labor contributions from the Sacramento
Municipal Utilities District (SMUD) and SCG, who both participated on the Technical
Advisory Committee (TAC) and provided other data and feedback to the research team.
SCG also cofunded a portion of UCI’s research. Other members of the TAC included
representatives from PG&E; the California Air Resources Board; University of California
at Riverside; University of California at Davis; the Natural Resources Defense Council;
the Environmental Defense Council, Mitsui and Co.; and the Greenlining Institute. For a
complete list of TAC members, see Appendix B.
DRAFT – DO NOT CITE OR QUOTE
4
Key areas of discussion and debate among TAC members and the research team
included the following:
1. How to reflect the costs and uncertainties around wildfire risk in California?
2. How to assess the future resource potential for biomass and biofuels available to
California?
3. How to reflect current state programs that encourage through incentives the use
of biofuels, electricity, and hydrogen in the transportation sector, particularly the
Low Carbon Fuel Standard?
4. How to characterize the most likely future trajectory for hydrogen gas and
synthetic natural gas production costs?
Participation on the TAC was voluntary and in no way indicates that TAC members
endorse the study conclusions. In addition to participating in the TAC meetings, the TAC
members, as well as many other organizations and members of the public, submitted
formal comments on the draft study findings following a California Energy Commission
(CEC) staff workshop presentation on June 6, 2019, at the CEC in Sacramento. While all
the comments provided by the TAC members and other stakeholders were considered,
this research remains an independent research project, and the study authors are solely
responsible for the contents of the report.
For a more detailed discussion of some of the “frequently asked questions” and
comments about this report, see Appendix A.
Project Results
In all the long-term GHG reduction scenarios evaluated here, electrification of buildings,
and particularly the use of electric heat pumps for space and water heating, leads to
lower energy bills for customers over the long term than the use of renewable natural
gas. Likewise, building electrification lowers the total societal cost of meeting
California’s long-term climate goals. The High Building Electrification scenario is lower
cost than the No Building Electrification scenario in 2050 by $5 billion to $20 billion per
year (in 2018 dollars). While there are forces acting to increase the cost of maintaining
the electric grid, including the costs of wildfires and upgrades to the electric grid to
prevent future wildfires, these costs will be experienced in all future scenarios, even
those scenarios with low building electrification. This study finds that the addition of
new electric loads, in the form of electric vehicles and building electrification, helps
mute these cost impacts on electric rates. Furthermore, these new electric loads offer
the possibility to provide flexibility to the grid, which could help to reduce the cost of
decarbonized electricity.
In addition, building electrification improves outdoor air quality and public health
outcomes, particularly in the winter, when nitrogen oxide emissions create secondary
fine particulate matter (PM 2.5) pollution in the Central Valley. Electrification in other
DRAFT – DO NOT CITE OR QUOTE
5
sectors, including transportation and industry, also shows dramatic improvements in
outdoor air quality.
Scenarios that rely on high blends of RNG to decarbonize gas supply impose steep costs
on all sectors of the economy that use gas, even in a scenario that incorporates
optimistic RNG cost assumptions. These high RNG scenarios minimize the use of
relatively expensive types of RNG by leaving more fossil gas emissions in buildings,
requiring greater emission reductions in other sectors. This strategy may not be
possible in a scenario that achieves the state’s 2045 carbon-neutrality goal. Achieving
carbon neutrality in buildings would likely increase the relative costs of high RNG
scenarios compared to scenarios relying on building electrification.
As a result, in all of the scenarios evaluated here, some gas consumers will find it in
their economic self-interest to electrify. In any future where California meets its long-
term climate goals, natural gas demand is likely to decline, putting upward pressure on
gas rates and bills. That pressure may cause more customers to exit the gas system, as
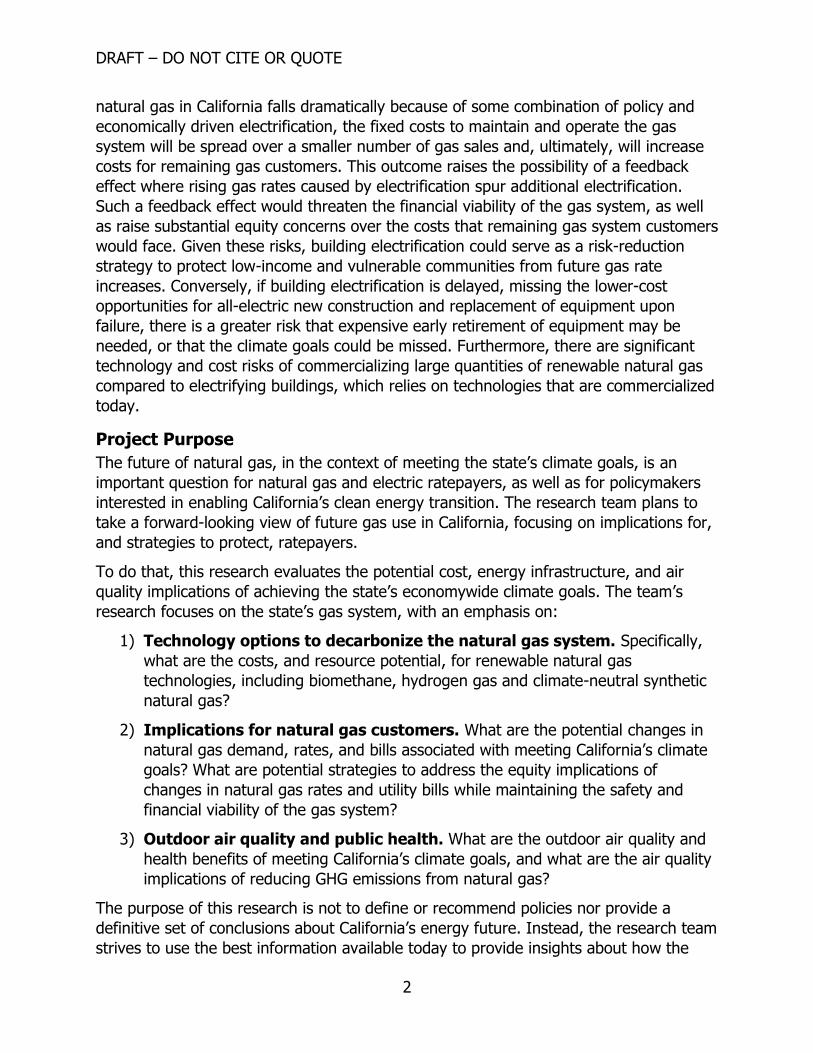
a feedback loop takes effect (Figure 1). The prospect of such a feedback loop makes it
prudent for the state to begin considering strategies for managing the costs of the
natural gas distribution system in California.
Figure 1: Outside Forces in the Natural Gas Delivery Sector Could Lead to Lower Gas Demand and Higher Rates in Future GHG Reduction Scenarios
Source: E3
The primary reasons for the state to consider a gas transition strategy are to ensure
that, even as gas demand falls, the system remains safe and reliable for the remaining
gas customers while helping reduce future customer cost and utility bill impacts. Even in
the High Building Electrification Scenario, which assumes a rapid transition to 100
DRAFT – DO NOT CITE OR QUOTE
6
percent of sales of all new water heaters and HVAC systems to electric heat pump
equipment by 2040, there are still millions of gas customers remaining in California by
2050. Early retirement of gas equipment could speed the pace of this gas transition but
would come with real economic costs that are difficult to estimate at this time. In
addition, early retirement of gas equipment would likely face other challenges, including
customer adoption barriers.
Given the long lifetimes of buildings and building equipment, a complete gas transition
is likely to require decades in any scenario. For these reasons, this research evaluates
potential gas transition strategies that aim to maintain reasonable gas rates, as well as
the financial viability of gas utilities through the study period. Legal and legislative
options, including strategies for a more rapid transition away from gas, are not
evaluated.
A well-managed gas transition could enable cost reductions of gas infrastructure
investments, as well as some reductions in gas system operations and maintenance
costs that would be incurred in the absence of a gas transition strategy. Such a
managed gas transition would likely require some amount of targeted or zonal
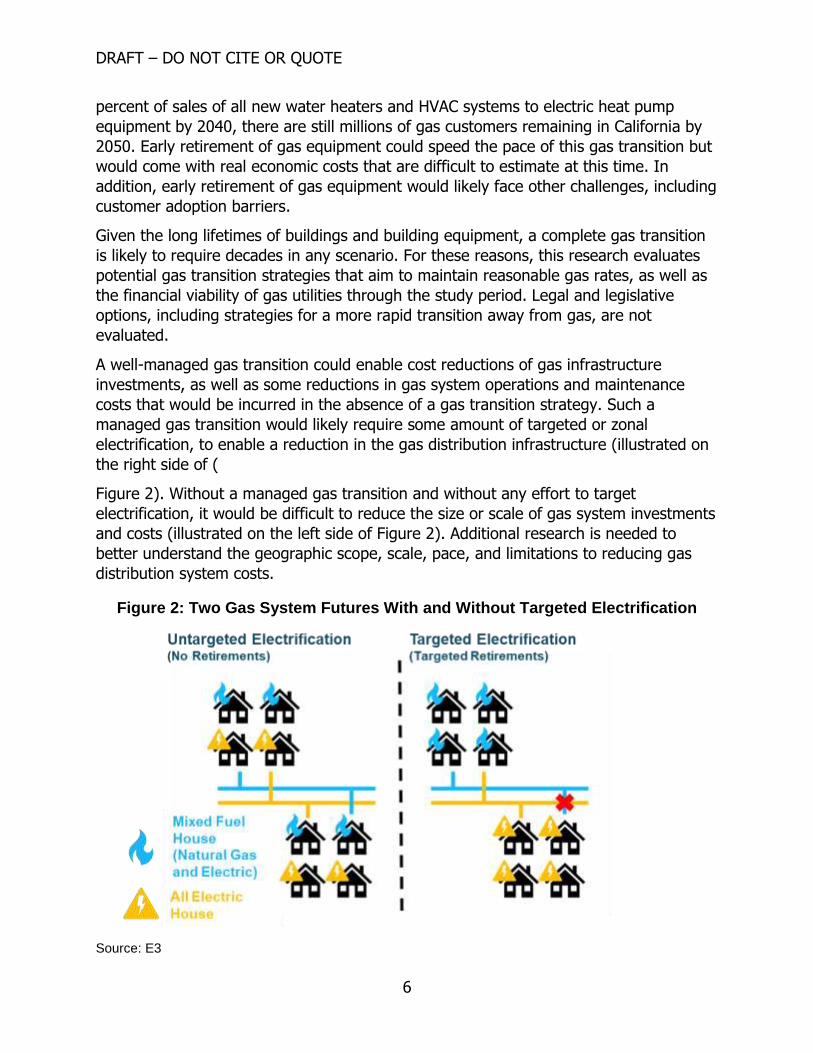
electrification, to enable a reduction in the gas distribution infrastructure (illustrated on
the right side of (
Figure 2). Without a managed gas transition and without any effort to target
electrification, it would be difficult to reduce the size or scale of gas system investments
and costs (illustrated on the left side of Figure 2). Additional research is needed to
better understand the geographic scope, scale, pace, and limitations to reducing gas
distribution system costs.
Figure 2: Two Gas System Futures With and Without Targeted Electrification
Source: E3
DRAFT – DO NOT CITE OR QUOTE
7
A further reason a structured gas transition is needed is that high-pressure gas
transmission and underground storage systems may continue to serve important roles,
even in a scenario with an 80 percent or higher reduction in GHG emissions. Those
roles might include serving remaining electric generation, industrial customers,
compressed natural gas (CNG) trucks and other CNG transportation options, as well as
potentially providing resilience benefits via distributed fuel cells. However, each of these
uses would need to rely on an increasing share of RNG to meet the state’s climate
goals, rather than continued reliance on fossil natural gas. A comprehensive analysis of
the role of distributed fuel cells or the uses for the bulk gas system in a carbon-neutral
future is beyond the scope of this analysis and is an area that deserves further
investigation.
Other important next steps are recommended for additional research. Key policy
questions include the following:
How should the benefits and costs of a gas transition strategy be allocated
among stakeholders?
How can California protect low-income residents and gas workers during a gas
transition?
Key engineering questions around gas pipeline safety and costs remain as well. These
questions include the following:
To what degree can targeted electrification efforts safely reduce gas distribution
expenditures?
What is the cost of targeted electrification, considering the potential for early
retirements of consumer equipment? A better understanding is needed of the
real-world technical and economic options to reduce gas system expenditures.
Pilots and real-world research could help identify the costs and options to launch
targeted electrification in communities in such a way that would enable targeted
retirements of the gas distribution system and consider the impacts on the
electric distribution system of targeted electrification, along with the potential for
cost savings on the gas distribution system.
Finally, more research is needed to identify the legal and regulatory barriers to
implementing a gas transition strategy, along with targeted electrification programs. For
example:
Should natural gas companies be able to collect the entire value of their gas
system assets through 2050 or beyond? Should shareholder return be affected in
a gas transition strategy? How does the timing of a gas transition strategy affect
the answer to these questions?
Should California gas utilities’ obligation to serve be redefined?
DRAFT – DO NOT CITE OR QUOTE
8
This research paper does not seek to make policy recommendations, but rather
highlight key issues for further policy discussion. The paper also seeks to illuminate
some of the implications of meeting the state’s climate goals, with the goal that
California’s future is as equitable and well-planned as possible.
Knowledge Transfer
The CEC has taken steps to ensure that a broad audience has the opportunity to
comment on the draft results of this research. The Commission held a public staff
workshop June 6, 2019. More than 30 unique public comments were filed to the docket.
Furthermore, public comment is being solicited by the CEC in this draft report.
Some stakeholders have argued that California should move faster on meeting its
climate goals, phasing out the use of all natural gas as quickly as possible due to
concerns over combustion emissions, indoor and outdoor air quality concerns, and the
prospect of methane leakage—a high global warming potential gas. Other stakeholders
have highlighted the uncertain mix of climate change impacts on the future costs of
electricity in California. Wildfires, flooding, and extreme heat mean that the provision of
reliable and low-cost energy services in the state is becoming more complex and
challenging.
The research team envisions this project as the beginning of a broader and longer
conversation that stakeholders and policy makers will have over the next several years,
as the state considers what steps will be needed to meet the goal of economywide
carbon neutrality by 2045, and how to expedite a gas transition strategy that ensures
an equitable transition to a low-carbon future for all California residents.
Benefits to California
This project highlights the need for long-term planning for the natural gas system in the
context of meeting the state’s climate goals. This project provides a long-term,
scenario-based view to investigate how the natural gas system can help California meet
its long-term greenhouse gas reduction goals. Specifically, this project benefits
California by providing:
Information to help lower the costs of meeting California’s climate
goals. By taking a long-term view of the state’s climate goals and evaluating the
role of the natural gas infrastructure in that future, this research allows the state
to potentially avoid stranded assets in the gas system. Stranded assets are
investments which are not used and useful, and for which the full investment
cost cannot be recovered from ratepayers, triggering a premature write-down or
devaluation . This project provides information about the potential for changes in
natural gas demand and implications for future investments in the gas sector,
the gas system rate base, natural gas prices (wholesale and retail), customers’
home energy bills, costs of GHG reduction, and capital and fuel costs by sector.

DRAFT – DO NOT CITE OR QUOTE
9
Energy metrics to make better planning easier. Long-term scenarios
provide information on economywide energy use by sector and industry,
including energy demand for electricity and natural gas.
Environmental and public health metrics. This project evaluates long-term,
detailed criteria air emissions and pollutant levels statewide at a 4x4 kilometer
grid within the context of meeting the state’s climate goals. By identifying
scenarios that can provide cleaner air and improve public health, policy makers
can develop policies to enable a future with cleaner air for Californians and
particularly for environmental justice communities with a greater pollution
burden.

DRAFT – DO NOT CITE OR QUOTE
10
DRAFT – DO NOT CITE OR QUOTE
11
CHAPTER 1: Introduction
California has a long-standing commitment to reducing greenhouse gases (GHGs) and
combating climate change. The state’s landmark climate change mitigation goals, set
during Governor Arnold Schwarzenegger’s tenure in 2005, aimed to reduce emissions to
1990 levels by 2020 and reduce GHGs by 80 percent below 1990 levels by 2050 (EO S-
03-05). The 2020 goal was codified into law in 2006 in Assembly Bill 32 (Núñez,
Chapter 488, Statutes of 2006), while the 2050 goal remains an executive order.
A decade later, Governor Edmund G. Brown Jr. set an intermediate (2030) climate
target for the state when he signed Senate Bill (SB) 32 (Pavley, Chapter 249) in 2016,
requiring the state to reduce GHGs 40 percent below 1990 levels. In 2018, Governor
Brown called for the state to achieve carbon neutrality by no later than 2045 (EO B-55-
18). The carbon neutrality goal is in addition to the state’s 80 percent reduction goal for
greenhouse gas emissions.
This research project was defined before Governor Brown issued the 2018 carbon
neutrality executive order, so the scenarios evaluated here focus on investigating
futures that achieve a 40 percent reduction in GHGs by 2030 (“40 x 30”) and an 80
percent reduction in GHG emissions by 2050 (“80 x 50”). To meet the state’s carbon-
neutrality target by 2045, it is safe to assume that most of the mitigation measures
modeled here will be needed, as well as measures like negative emissions technologies
that are not considered in this analysis. While more research is needed to understand
the full scope and scale of actions needed to achieve carbon neutrality in California, the
research findings presented here serve as a useful guidepost.
California’s energy and climate policy extends beyond emissions targets. California law
requires the state to achieve a 60 percent Renewables Portfolio Standard (RPS) by 2030
and meet 100 percent of retail sales from zero-carbon electricity by 2045 (Senate Bill
100, De León, Chapter 312, Statutes of 2018). Complementary to electric sector
decarbonization goals are mandates and targets aimed at increasing the share of zero-
emission vehicles on California roads. The state’s energy transition also extends to the
built environment. Recent legislation (Assembly Bill 3232, Friedman, Chapter 373,
Statutes of 2018) requires the California Energy Commission to examine strategies to
reduce emissions from buildings 40 percent below 1990 levels by 2030. These and
other policy mechanisms are moving California toward achievement of the state’s long-
term decarbonization requirements and targets.
This study evaluates and synthesizes the potential impacts of technology innovation,
along with California’s many long-term energy and climate policies, that are acting on
the natural gas sector in California through 2030 and 2050. This research focuses
particularly on impacts to the natural gas distribution system, the low-pressure system

DRAFT – DO NOT CITE OR QUOTE
12
of pipelines that serve most homes and businesses in California. Other research (for
example, Long, 2018; Ming, 2019) has evaluated the role of gas on the higher-
pressure, bulk gas distribution system.
This project builds on recent studies pertinent to the future of the natural gas industry
in California. These studies include recently completed California Energy Commission
(CEC) Electric Program Investment Charge- (EPIC) funded research into the impacts of
climate change on temperature and hydroelectric availability in California, as well as the
development of long-term scenarios of California’s energy sector through 2050.
This study leverages Energy and Environmental Economics’ (E3’s) expertise in modeling
long-term, low-carbon scenarios for the State of California using the California
PATHWAYS model. In 2015, the CEC, California Public Utilities Commission (CPUC),
California Air Resources Board (CARB) and California Independent System Operator
(California ISO) engaged E3 in a joint effort to use the PATHWAYS model to develop
statewide greenhouse reduction scenarios through 2050. E3 evaluated several low-
carbon scenarios, including a “low-carbon gas” scenario that included the use of
biomethane, hydrogen, and synthetic methane in buildings and industry, as well as the
use of renewable compressed natural gas (CNG) in trucks. The PATHWAYS model has
been further developed for use in CARB’s Scoping Plan Update1 and through support
from the CEC’s EPIC research program. However, none of those past studies have fully
addressed the question of “what is the future of natural gas in California?”
The present study also builds on past work by synthesizing technical, economic, and
resource assessments of advanced biofuels and low-carbon technologies that have been
performed, synthesized, and leveraged for this study. Some of these studies had a
high-level focus on the potential for synergies between natural gas and renewable
electricity (Pless, 2015) without in-depth research on the potential advanced
alternatives or the technical and economic aspects. Other studies had deep analysis of
particular technologies (Melaina, 2013) or the potential feedstocks and conversion
technologies without a focus on the potential for decarbonization of the natural gas
system (DOE, 2016; McKendry, 2002).
This project builds on E3’s 2018 report to the CEC titled Deep Decarbonization in a High Renewables Future (Mahone et al, 2018). That report modeled ten scenarios that all
meet California’s 2030 targets of a 40 percent reduction in GHGs below 1990 levels and
an 80 percent reduction in GHGs below 1990 levels by 2050. A key finding of that study
is that electrification is among the lower-cost, lower-risk strategies to decarbonize the
1 California Air Resources Board. November 2017. California’s 2017 Climate Change Scoping Plan,
https://ww3.arb.ca.gov/cc/scopingplan/scoping_plan_2017.pdf.
DRAFT – DO NOT CITE OR QUOTE
13
buildings sector, given the cost and resource supply limitations associated with low-
carbon gas. Informed by this approach, deep decarbonization in the buildings sector
was recommended to avoid more expensive or speculative mitigation options elsewhere
in the economy.
However, the 2018 study focused on economywide metrics2 and did not evaluate in-
depth what the implications of building electrification, or technology innovation in low-
carbon gas technologies, would mean for the natural gas sector or natural gas
customers in the state. This study takes a closer look at the distributional implications of
building decarbonization in the context of the same 2030 and 2050 California GHG
reduction targets. Of particular interest are the impacts of building decarbonization
strategies on households’ energy bills and the gas utilities themselves.
This project examines several aspects of strategies to decarbonize buildings in an
economywide context. This examination included working with UC Irvine to look into a
range of costs for renewable natural gas; a detailed analysis of the gas utility financials
and rate impacts of low-carbon scenarios (for example, using a gas utility revenue
requirement model); an examination of the consumer bill effects that follow; and an
examination of potential gas system transition strategies.
This project asks three main research questions:
1) What are the technology options and potential costs to reduce GHG emissions
from natural gas consumption in California?
2) What are the natural gas rate and utility bill implications of different strategies to
reduce GHG emissions from natural gas use in California?
3) What are the air quality benefits and human health implications of different
electrification and decarbonization strategies?
Technical Advisory Committee and Public Comments The preparation of this report benefited from a wide range of inputs and perspectives
throughout the study development and presentation of draft findings. The Technical
Advisory Committee (TAC) members for this project listed in Appendix B represent a
wide and diverse range of viewpoints on the topics covered by this research. More than
30 unique comments were filed as part of the public comment period on the draft study
results, including comments from more than 200 Sierra Club members. In addition to
2 A total resource cost perspective captures the net costs of California’s energy system relative to a
reference scenario. This metric includes expenditures on infrastructure (for example, power plants,
trucks, heating, ventilation, and air-conditioning [HVAC] equipment) and fuels (for example, jet fuel,
biodiesel, renewable natural gas). This perspective does not, however, capture potential distributional
implications of different GHG mitigation options on customers.

DRAFT – DO NOT CITE OR QUOTE
14
written comments, many public comments were provided verbally in the staff workshop
on June 6, 2019. Overall, the key areas of discussion and disagreement include:
The pace and urgency of electrifying buildings as a decarbonization strategy.
The availability and cost of biomass resources to produce biofuels as an
alternative to rapid electrification in buildings.
The availability and cost of hydrogen as an alternative to rapid electrification in
buildings.
The impact of wildfires and wildfire liability on the future cost and reliability of
electricity.
This report does not represent a consensus document on these issues, and many areas
of disagreement remain. However, the researchers have seriously considered all the
comments provided by stakeholders and have responded to some of these comments
directly in this report and to other comments in a “frequently asked questions”
document in Appendix A.
Methods This research involved several phases of analysis steps, as illustrated in the figure
below.
First, E3 worked with the University of California, Irvine (UCI) APEP (Advanced Power
and Energy Program) (together, the research team) to develop assumptions for future
costs and efficiencies of different biofuel conversion processes. APEP also conducted a
technoeconomic assessment of power-to-gas pathways to produce renewable natural
gas. That analysis examines a variety of different processes to produce hydrogen and
synthetic natural gas. The result of that analysis is a conservative case and an
optimistic case for the cost of electrolytic fuels (“power to gas”).
The research team used these gas technology cost assumptions as inputs to the E3
California PATHWAYS Model. The authors PATHWAYS model is to develop economywide
mitigation strategies that meet the state’s climate policy targets using different
combinations of mitigation measures. PATHWAYS is an energy infrastructure, energy
and emissions counting model. A key source of variation in the PATHWAYS scenarios
evaluated in this study is the blend of pipeline gas and the quantity of gas that is
decarbonized.

DRAFT – DO NOT CITE OR QUOTE
15
Figure 3: Study Methods
Source: E3
Using the energy demand outputs from the PATHWAYS model, E3 evaluated how
changes in natural gas demand by sector could affect natural gas utility revenues, gas
rates, and customer energy bills. To perform this analysis, E3 developed the Natural
Gas Revenue Requirement Tool (RR Tool). The RR Tool tracks utility capital
expenditures, depreciation, and operational costs given user-defined scenario inputs,
including changes in natural gas consumption by sector (from PATHWAYS scenarios),
gas equipment reinvestment and depreciation schedules, cost allocation assumptions
and the utility cost of capital, among other financial criteria. The tool is benchmarked to
general rate case (GRC) filings from Southern California Gas Company (SoCalGas) and
Pacific Gas and Electric Company (PG&E),3 the state’s two largest gas distribution
utilities. The tool returns gas rates by customer class through 2050. It also includes the
ability to model potential gas transition scenarios to reduce the customer bill impacts of
spreading the same gas system costs over a decreasing quantity of throughput and
number of customers.
E3 also developed a bill impacts calculator. The residential customer utility bill
calculations in this analysis combine estimates of future electricity rates and gas
commodity costs from the PATHWAYS model with gas delivery rates from the RR Tool.
The result is a comparison of future utility bills for an “all-electric” and “mixed-fuel”
customer in each scenario.
Finally, the UCI APEP team used the PATHWAYS scenario results to inform a detailed air
quality and health impacts analysis. The energy demands from the PATHWAYS
scenarios were geographically distributed using a tool called Sparse Matrix Operator
3 The research team relied on the following regulatory filings to build and benchmark the revenue
requirement models: PG&E GCAP 2018, PG&E GRC 2020, PG&E GTS 2019, SCG TCAP 2020, SCG GRC
2019, SCG 2017 PSEP Forecast Application, SCG PSEP Forecast application.

DRAFT – DO NOT CITE OR QUOTE
16
Kerner Emissions (SMOKE). Then, the air quality impacts of these scenarios were
simulated using the Community Multiscale Air Quality Modeling System (CMAQ) tool,
accounting for atmospheric chemistry and transport effects to establish distributions of
ground-level ozone and PM2.5 at a local level. The air quality results were then
translated into human health and health benefits metrics using the Environmental
Benefits Mapping and Analysis Program (BenMAP) tool. The air quality analysis is in
Appendix F.
Key Findings Consistent with the research team’s 2018 finding, building electrification is likely to be a
lower-cost and lower-risk strategy to reduce greenhouse gas emissions from natural gas
use in buildings compared to the alternative low-carbon gas technologies evaluated.
This report finds that scenarios with more building electrification are lower cost than
scenarios with less building electrification, even applying optimistic assumptions about
the future costs of biofuels, hydrogen, and synthetic natural gas. Building electrification
scenarios also rely more on proven technologies than scenarios that rely on large
quantities of climate-neutral gas or mitigation in more energy-intensive sectors of the
economy.
After a closer look at RNG costs, partnering with APEP to develop conservative and
optimistic cost trajectories, this analysis finds that RNG is an expensive strategy to
decarbonize buildings in California. Relatively low-cost biomass feedstocks are limited in
quantity, so lower-cost PATHWAYS scenarios allocate these limited feedstocks to
sectors that are difficult to electrify, like aviation, industry, and trucking.
The limited supply of and competing uses for biofuels mean that scenarios that
maintain high volumes of gas throughput in buildings require hydrogen and synthetic
natural gas to reduce emissions. Even under optimistic cost projections, the blended
cost of these two electrolytic fuel constituents is 8 to 17 times more expensive than the
expected price trajectory of natural gas. Electrification is likely cost-effective for large
subsets of Californians today, so higher gas commodity costs only expand the set of
end-uses and customer types that would find electrification advantageous. If a
significant share of customers exit the gas system, the delivery portion of remaining
customer gas bills would increase, potentially spurring further electrification.
Gas demand decreases in each mitigation scenario. All scenarios see gas throughput fall
in the electric sector as natural gas generation is displaced by zero-emissions
technologies. Energy efficiency measures in buildings and industry lead to further
declines in throughput. This common finding of decreased gas throughput means that
cost pressure on gas delivery rates is likely to be a common challenge in any successful
mitigation scenario.
While this report finds that electrification scenarios are lower-cost from a total resource
cost perspective, those scenarios present distributional challenges. Residential
customers pay most of the costs of the gas distribution system. The gas distribution
DRAFT – DO NOT CITE OR QUOTE
17
system constitutes the majority of the book value of both California’s major natural gas
utilities. As residential customers exit the gas system, those costs are spread over a
smaller quantity of throughput and number of customers, leading to increased rates for
remaining customers. Absent a policy intervention, low-income customers who are less
able to electrify may face a disproportionate share of gas system costs.
A key challenge in all of the low-carbon scenarios evaluated here is managing the
customer cost impacts to remaining gas customers. There is upward pressure on gas
rates in all scenarios. This upward pressure raises the potential for economic
electrification in any future low-carbon scenario. A gas transition strategy is needed to
manage and reduce the costs of the gas system and fairly allocate remaining costs and
protect consumers. This analysis modeled several possible building blocks of a gas
transition, binned into three general categories:
1) The reduction of gas system expenditures through targeted electrification and
retirement of the gas distribution system
2) Changes to gas rates and rate design, including accelerated depreciation of gas
distribution assets
3) Recovery of gas system costs from electric ratepayers or from other funds
A key finding is that none of these building blocks are likely to be sufficient on their own
to manage customer cost impacts. The state’s ability to reduce gas system expenditures
is limited by the long lifetimes of gas infrastructure and a need to reinvest such that the
safety and reliability of the gas system are maintained. Changes to cost allocation
merely shift costs among customer classes and don’t fundamentally relieve the cost
pressure of decreased throughput. Finally, external sources of funding to ease a gas
transition for customers are limited. For example, electric customers could not likely
take on the full remaining cost of the gas distribution system, as doing so would
discourage electrification and jeopardize achievement of state climate goals.
From a health and outdoor air quality perspective, this research demonstrates that
electrification in buildings leads to significant improvements in regional air quality and
public health from reduced wintertime oxides of nitrogen (NOx) emissions, particularly
in the Central Valley. These outdoor air quality benefits are not as large as the benefits
of electrification in the industrial, freight, and transportation sectors, but building
electrification still represents a significant potential means to improve regional air
quality and public health. The health benefits of building electrification are not achieved
in scenarios that meet the state’s climate goals with greater reliance on biofuels or
combustion of hydrogen and synthetic natural gas in buildings. The effects of building
electrification on indoor air quality were not evaluated in this research.
DRAFT – DO NOT CITE OR QUOTE
18
Building Electrification in California Versus Other Regions
This study finds that electrification in buildings is likely to be the lowest-cost means of
dramatically reducing greenhouse gas emissions from California’s buildings. However,
this finding is influenced, in part, by California’s relatively mild winter climate.
Electric heat pumps are an efficient means to deliver heating and cooling, but the
associated efficiency decreases as the outdoor air temperature drops. Electric resistance
heating is commonly used as a supplemental heat source in cold climates, but this use
can also lead to substantial new electric-peak demands and the needs for new electric
infrastructure in colder climates. Cold climate heat pumps are making important
technology strides, but “peak-heat” challenges have been identified as legitimate
concerns in colder climates, including parts of northern Europe (Strbac, 2018) and the
northern United States (Aas, 2018). Research in those colder jurisdictions tends to find
a plausible ongoing role for “low-carbon” gas as a “peak-heat” capacity resource.
In studies from colder regions of the world, electrification is also identified as an
important strategy to decarbonize buildings, however with a greater reliance on
supplemental heat sources. For example, a recent report commissioned by a coalition of
European gas utilities finds that widespread electrification of buildings is necessary to
achieve the continent’s climate goals, and it can be achieved at reasonable cost
(Navigant 2019). In that study, gas is used in buildings solely as a capacity resource to
avoid large electric sector upgrades. In contrast, in California, with its relatively mild
winters and warm summers, electrification of buildings is not expected to cause the
state’s electricity system to shift from summer peaking to winter peaking (Mahone,
2019).
DRAFT – DO NOT CITE OR QUOTE
19
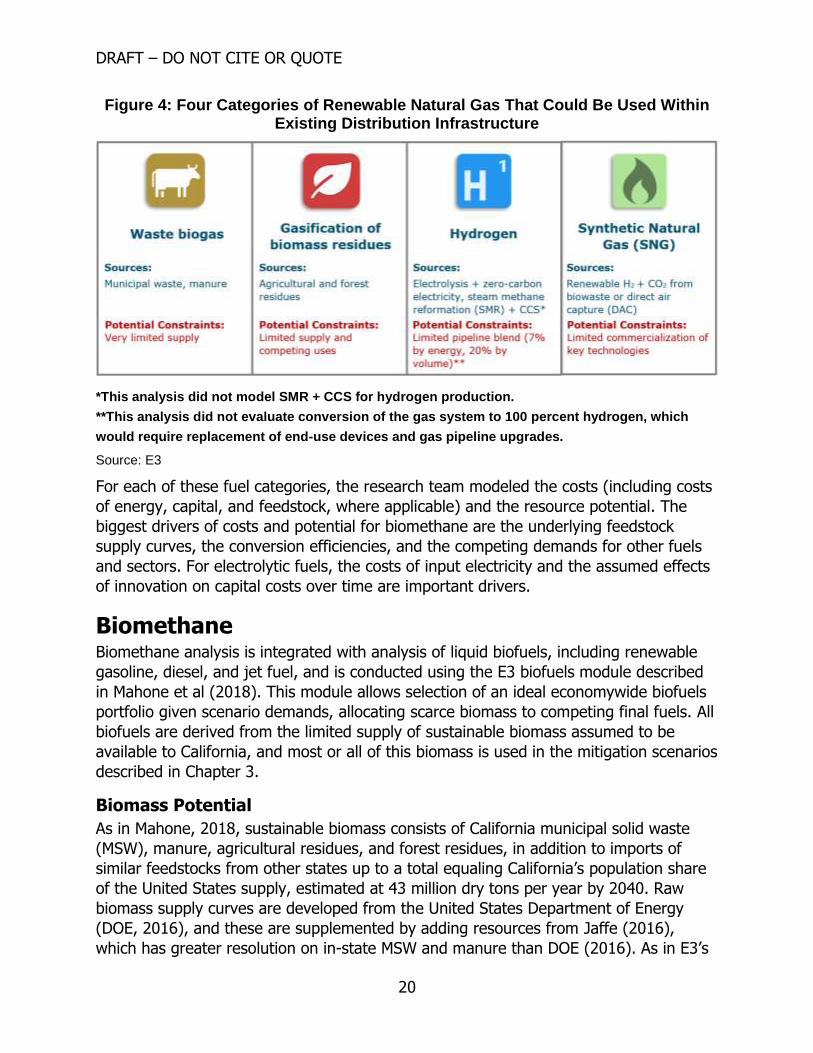
CHAPTER 2: Technology Options to Decarbonize the Natural Gas System
Overview Renewable natural gas (RNG) is an umbrella term that can encompass several low-GHG
substitute fuels for fossil natural gas (primarily methane). This report evaluated four
categories of RNG: biomethane derived from waste biogas resources via anaerobic
digestion, biomethane derived from waste or residues via gasification of biomass (a
biofuel production process), hydrogen derived from electrolysis, and synthetic natural
gas derived from hydrogen and a renewable CO2 source (Figure 4). These fuels allow
the continued use of natural gas distribution infrastructure, but each has limitations.
Biomethane purified from biogas sources such as landfills, organic waste digesters, and
manure digesters represents the form of RNG commonly available today, but supplies
are limited. Thermochemical processing of agricultural and forest residues and some
urban wastes via gasification extends the potential supply of biomethane. However,
these residues can also be processed for competing uses, such as yielding liquid
biofuels to substituting for petroleum-derived fuels.
Hydrogen can be produced relatively efficiently from zero-carbon electricity via
electrolysis, but an upper limit for how much hydrogen can be blended in the existing
pipeline system with only modest upgrades is 7 percent by energy (20 percent by
volume).4 Synthetic natural gas (SNG) also uses electricity as an input and can be
directly substituted for fossil natural gas, but it requires a renewable, climate-neutral
CO2 source in addition to hydrogen. Waste bio-CO2, the waste CO2 biproduct of ethanol
production, is available to produce SNG, however, this low-cost source of climate-
neutral CO2 is relatively limited. Once waste bio-CO2 sources of CO2 have been used up,
other more expensive sources of climate-neutral CO2 are needed produce SNG using
not-yet commercial technologies such as direct air capture. Collectively, hydrogen and
SNG are referred to here as examples of electrolytic fuels, or more specifically as power
to gas (P2G).
4 See Appendix C. Some literature supports a maximum of only 5 percent blending, by energy, without
pipeline system upgrades. It was assumed here that up to 7 percent could occur with about $1 per
million British thermal units (MMBtu) levelized cost of upgrades, based on Haines et al. (2005). Because 5
to 7 percent represents a small fraction of pipeline throughput, the results are not very sensitive to this
assumption.
DRAFT – DO NOT CITE OR QUOTE
20
Figure 4: Four Categories of Renewable Natural Gas That Could Be Used Within Existing Distribution Infrastructure
*This analysis did not model SMR + CCS for hydrogen production.
**This analysis did not evaluate conversion of the gas system to 100 percent hydrogen, which
would require replacement of end-use devices and gas pipeline upgrades.
Source: E3
For each of these fuel categories, the research team modeled the costs (including costs
of energy, capital, and feedstock, where applicable) and the resource potential. The
biggest drivers of costs and potential for biomethane are the underlying feedstock
supply curves, the conversion efficiencies, and the competing demands for other fuels
and sectors. For electrolytic fuels, the costs of input electricity and the assumed effects
of innovation on capital costs over time are important drivers.
Biomethane Biomethane analysis is integrated with analysis of liquid biofuels, including renewable
gasoline, diesel, and jet fuel, and is conducted using the E3 biofuels module described
in Mahone et al (2018). This module allows selection of an ideal economywide biofuels
portfolio given scenario demands, allocating scarce biomass to competing final fuels. All
biofuels are derived from the limited supply of sustainable biomass assumed to be
available to California, and most or all of this biomass is used in the mitigation scenarios
described in Chapter 3.
Biomass Potential
As in Mahone, 2018, sustainable biomass consists of California municipal solid waste
(MSW), manure, agricultural residues, and forest residues, in addition to imports of
similar feedstocks from other states up to a total equaling California’s population share
of the United States supply, estimated at 43 million dry tons per year by 2040. Raw
biomass supply curves are developed from the United States Department of Energy
(DOE, 2016), and these are supplemented by adding resources from Jaffe (2016),
which has greater resolution on in-state MSW and manure than DOE (2016). As in E3’s
DRAFT – DO NOT CITE OR QUOTE
21
prior work, purpose-grown crops and forests primarily for bioenergy production are
excluded from all scenarios due to ongoing sustainability concerns, including emissions
from indirect land-use change, as well as uncertainty around the plausibility and cost of
developing the supply chains necessary to grow, deliver, and process new types of
purpose-grown crops for biofuels.5
Conversion Efficiency and Costs
Anaerobic digestion is a series of biological processes through which microorganisms
decompose moist biomass in the absence of oxygen. The products are digestate and
biogas, which is typically around 60 percent methane. Anaerobic digesters are a mature
and commercialized technology and are being used at facilities like wastewater
treatment plants and agriculture and livestock farms. Because some of the bioenergy
content is consumed by microorganisms and left in the digestate, the methane yield is
relatively low, for instance, about 38 percent higher heating value (HHV) energy
efficiency for dairy manure today. This analysis assumes that industry learning
increases the assumed yield over time, reaching 47 percent HHV energy efficiency for
dairy manure by 2050. Additional cost is associated with upgrading and injecting the
methane into the pipeline. Landfill gas is a special case where the digestion is already
inherent to the landfill and most gas is already collected in California, so only the
upgrading and injection incur costs.
Gasification turns dry biomass such as cellulosic or woody feedstocks into syngas, a
gaseous mixture composed primarily of hydrogen and carbon monoxide, that is then
converted to methane. (Wet feedstocks such as food waste can be gasified as well, with
some energy penalty for predrying.) Gasification is a mature technology but not as
commercially common as anaerobic digestion for this purpose, and is more expensive,
with larger facilities typically required. However, yields are relatively high, and this
analysis assumes that they reach 75 percent lower heating value (LHV) energy
efficiency for dry woody feedstocks by 2050 compared with 67 percent today. As with
anaerobic digestion, upgrading and injection also incur costs. Full conversion efficiency
and costs for obtaining pipeline-quality biomethane from raw feedstocks are found in
Appendix D.
Biomethane Potential
With these conversion assumptions and biomass resources, the research team projects
the technical potential for biomethane availability for California in 2050, assuming that
all available 43 million dry tons of biomass is used exclusively for biomethane. This
potential is 635 trillion Btu, which is near the high end of the range estimated in the
literature for other studies that estimate the RNG potential for California. A detailed
5 In addition to the references in Mahone, 2018, also note newer work highlighting the concerns about
large-scale use of purpose-grown bioenergy resources such as Norton et al. (2019) and IPCC (2019).
DRAFT – DO NOT CITE OR QUOTE
22
comparison with these studies and explanations for differences is presented in Appendix
D.
Biofuel Portfolios
Along with biomethane conversion assumptions, liquid fuel conversion assumptions are
used in determining the optimal biofuel portfolios. Commensurate with the cost
reductions assumed from industrial production “learning by doing” for biomethane
pathways, this analysis incorporated industry learning for advanced liquid fuel pathways
that included thermochemical pyrolysis and Fischer Tropsch to convert cellulosic and
woody feedstocks to drop-in renewable gasoline, diesel, and jet fuel. Biochemical
hydrolysis of cellulosic feedstocks to advanced renewable ethanol was also considered,
and conventional corn ethanol was assumed to be phased out consistent with the
exclusion of purpose-grown bioenergy resources. Overall, the energy efficiency of
thermochemical conversion to liquid fuels reaches about 60 percent by 2050 for
conversion of woody feedstock to renewable diesel compared with 54 percent today,
somewhat less than assumed for gasification. Complete conversion assumptions are
found in Appendix D.
In the PATHWAYS scenarios described in Chapter 3, remaining liquid and gaseous fossil
fuel demands are calculated after scenario-driven efficiency and electrification
mitigation measures are applied. Given remaining liquid and gaseous fuel demands in
those scenarios, and a set of feedstock and conversion cost assumptions, PATHWAYS
identifies an optimal biofuels portfolio that maximizes cost-effective CO2 emissions
reduction.
Using a ceiling of $500/ton CO2 equivalent (tCO2e) net abatement cost in 2050, most of
the biomass is used in the mitigation scenarios. In the optimal portfolios, much of the
biomass is converted to liquid fuels because of the higher emissions intensity and cost
of petroleum fuels compared to natural gas. Some biomethane is also produced for use
in CNG trucks, as these attain an assumed market share of at least 24 percent of
heavy-duty trucks by 2040, displacing additional petroleum. After accounting for the
limited biomethane potential and the competing uses of the feedstock for liquid fuels,
biomethane is blended in the range of 15 and 25 percent of natural gas throughput in
2050 in the economywide PATHWAYS scenarios.
As in Mahone, 2018, biofuels costs are based on a single market-clearing price, with
economic rents flowing to lower-cost biomass suppliers. Here, the market-clearing price
assumes a single implicit carbon price for biofuels across sectors and fuels. Due to the
increase in conversion efficiency assumed to occur over time in this study, final biofuels
prices are lower than in E3’s prior work.
Market-based policies such as the Low Carbon Fuel Standard (LCFS) and cap and trade
are not modeled. This analysis uses a societal cost framework that excludes transfers
among customers within California. Furthermore, it is unclear what the 2050 carbon

DRAFT – DO NOT CITE OR QUOTE
23
prices for LCFS credits or the cap-and-trade market would look like in a future that
achieves an 80 percent reduction in GHG emissions economywide.
Electrolytic Fuels: Hydrogen and Synthetic Natural Gas
Overview
Power to gas (P2G) is a subset of electrolytic fuels that are considered here as options
to be blended into or replace natural gas in the gas transmission, distribution, and
storage infrastructure (the “gas system”). P2G consists of transforming electricity to
energy in the form of either hydrogen or methane, which can be considered zero-
carbon if the electricity source is zero carbon and associated emissions such as fugitive
methane or hydrogen are reduced or otherwise accounted for. Because P2G connects
the electric grid and the natural gas system (Figure 5), it allows complementary
characteristics of these two energy distribution systems to be used, such as the
“seasonal storage” capabilities of the gas system.
Figure 5: Electrolytic Fuel Pathways
This is an illustrative schematic; not all pathways shown here are considered in this study. The
hydrogen- and CNG-fueled cars represent broader use in the transportation sector including in
trucks.
Source: UCI APEP
Electrolytic fuels have also been modeled, in prior studies, to be a cost-effective use of
variable renewables such as wind and solar, which may need to be overbuilt to serve
demands at high levels of renewable penetration (Shaffer, Tarroja, & Samuelsen,
2015; Eichman, Mueller, Tarroja, Schell, & Samuelsen, 2013; Baranes, Jacqmin, &
Poudou, 2017). However, in the scenarios defined in Chapter 3, the significant
quantities of new load required for P2G would very likely require additional dedicated
renewable capacity than would merely be developed to satisfy other electricity
demands. This requirement is because the energy demands associated with producing
hydrogen and synthetic natural gas at the scales envisioned in deep decarbonization
scenarios far exceed the amount of electric curtailment that would occur in an electric
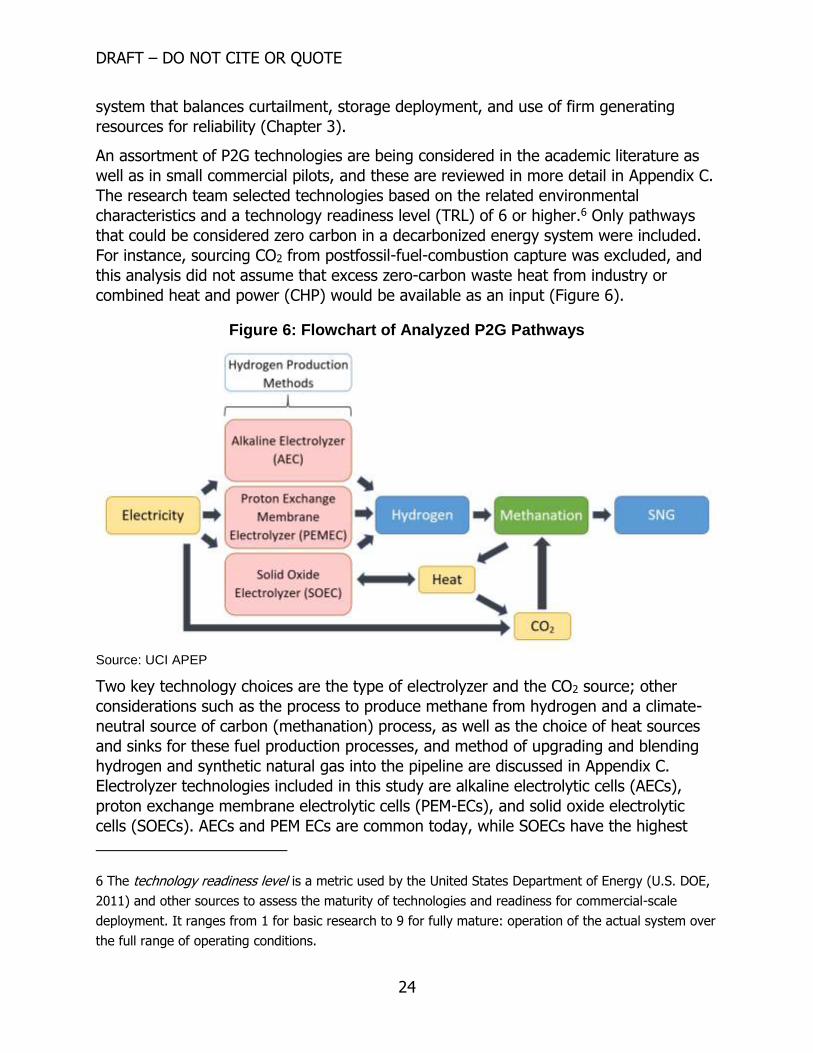
DRAFT – DO NOT CITE OR QUOTE
24
system that balances curtailment, storage deployment, and use of firm generating
resources for reliability (Chapter 3).
An assortment of P2G technologies are being considered in the academic literature as
well as in small commercial pilots, and these are reviewed in more detail in Appendix C.
The research team selected technologies based on the related environmental
characteristics and a technology readiness level (TRL) of 6 or higher.6 Only pathways
that could be considered zero carbon in a decarbonized energy system were included.
For instance, sourcing CO2 from postfossil-fuel-combustion capture was excluded, and
this analysis did not assume that excess zero-carbon waste heat from industry or
combined heat and power (CHP) would be available as an input (Figure 6).
Figure 6: Flowchart of Analyzed P2G Pathways
Source: UCI APEP
Two key technology choices are the type of electrolyzer and the CO2 source; other
considerations such as the process to produce methane from hydrogen and a climate-
neutral source of carbon (methanation) process, as well as the choice of heat sources
and sinks for these fuel production processes, and method of upgrading and blending
hydrogen and synthetic natural gas into the pipeline are discussed in Appendix C.
Electrolyzer technologies included in this study are alkaline electrolytic cells (AECs),
proton exchange membrane electrolytic cells (PEM-ECs), and solid oxide electrolytic
cells (SOECs). AECs and PEM ECs are common today, while SOECs have the highest
6 The technology readiness level is a metric used by the United States Department of Energy (U.S. DOE,
2011) and other sources to assess the maturity of technologies and readiness for commercial-scale
deployment. It ranges from 1 for basic research to 9 for fully mature: operation of the actual system over
the full range of operating conditions.
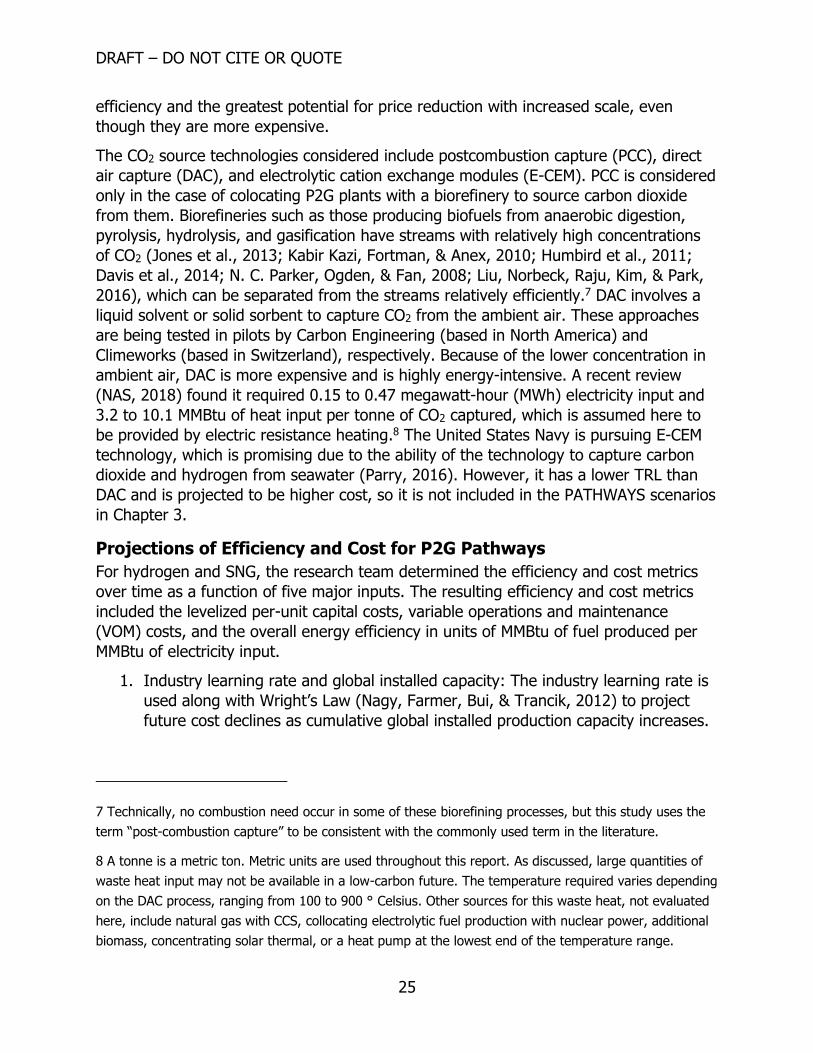
DRAFT – DO NOT CITE OR QUOTE
25
efficiency and the greatest potential for price reduction with increased scale, even
though they are more expensive.
The CO2 source technologies considered include postcombustion capture (PCC), direct
air capture (DAC), and electrolytic cation exchange modules (E-CEM). PCC is considered
only in the case of colocating P2G plants with a biorefinery to source carbon dioxide
from them. Biorefineries such as those producing biofuels from anaerobic digestion,
pyrolysis, hydrolysis, and gasification have streams with relatively high concentrations
of CO2 (Jones et al., 2013; Kabir Kazi, Fortman, & Anex, 2010; Humbird et al., 2011;
Davis et al., 2014; N. C. Parker, Ogden, & Fan, 2008; Liu, Norbeck, Raju, Kim, & Park,
2016), which can be separated from the streams relatively efficiently.7 DAC involves a
liquid solvent or solid sorbent to capture CO2 from the ambient air. These approaches
are being tested in pilots by Carbon Engineering (based in North America) and
Climeworks (based in Switzerland), respectively. Because of the lower concentration in
ambient air, DAC is more expensive and is highly energy-intensive. A recent review
(NAS, 2018) found it required 0.15 to 0.47 megawatt-hour (MWh) electricity input and
3.2 to 10.1 MMBtu of heat input per tonne of CO2 captured, which is assumed here to
be provided by electric resistance heating.8 The United States Navy is pursuing E-CEM
technology, which is promising due to the ability of the technology to capture carbon
dioxide and hydrogen from seawater (Parry, 2016). However, it has a lower TRL than
DAC and is projected to be higher cost, so it is not included in the PATHWAYS scenarios
in Chapter 3.
Projections of Efficiency and Cost for P2G Pathways
For hydrogen and SNG, the research team determined the efficiency and cost metrics
over time as a function of five major inputs. The resulting efficiency and cost metrics
included the levelized per-unit capital costs, variable operations and maintenance
(VOM) costs, and the overall energy efficiency in units of MMBtu of fuel produced per
MMBtu of electricity input.
1. Industry learning rate and global installed capacity: The industry learning rate is
used along with Wright’s Law (Nagy, Farmer, Bui, & Trancik, 2012) to project
future cost declines as cumulative global installed production capacity increases.
7 Technically, no combustion need occur in some of these biorefining processes, but this study uses the
term “post-combustion capture” to be consistent with the commonly used term in the literature.
8 A tonne is a metric ton. Metric units are used throughout this report. As discussed, large quantities of
waste heat input may not be available in a low-carbon future. The temperature required varies depending
on the DAC process, ranging from 100 to 900 ° Celsius. Other sources for this waste heat, not evaluated
here, include natural gas with CCS, collocating electrolytic fuel production with nuclear power, additional
biomass, concentrating solar thermal, or a heat pump at the lowest end of the temperature range.
DRAFT – DO NOT CITE OR QUOTE
26
Higher learning rates and greater global industry scale-up lead to greater cost
decreases.
2. Electrolysis technology: This technology is discussed above.
3. CO2 source (for SNG): CO2 is a waste product of biofuel production and may be
used as a climate-neutral CO2 source for SNG production. This product is referred
to as a biorefining CO2 coproduct and is used to produce SNG when possible, as
a cost saving measure. However, the availability of this biorefining CO2 coproduct
depends on SNG production colocated with biorefining, which is assumed to be
limited in each scenario. After this supply is exhausted, DAC is used as the CO2
source for SNG production.
4. Energy supply: This analysis assumes the energy is provided by utility-scale solar
PV or wind generation, harmonized with the PATHWAYS scenario. The electricity
could be provided on-grid. If operated flexibly, hydrogen and SNG production
could help to integrate renewable generation on the grid, for example, by turning
on during periods of renewable overgeneration, and turning off during peak
demand periods. Off-grid fuel production avoids new transmission costs. The
research team determined the latter option was more cost-effective in the
scenarios modeled here. In particular, researchers assumed enough flexibility in
other loads that the renewable integration benefits of on-grid fuel production
were outweighed by the cost of new transmission.
5. Capacity (that is, load) factor: The capacity factor is implied by the source of
energy supply. Greater capacity factors mean better capital utilization for P2G
equipment and, thus, lower levelized capital costs; however, especially if the
energy input is restricted to be zero-carbon, this improved utilization may mean
higher energy costs. In these scenarios, researchers did not consider baseload
zero-carbon feedstocks like nuclear power or fossil fuel with CCS, so the capacity
factor is aligned with the renewable generation resources determined to be
used.9
For each of these inputs, the research team developed assumptions for conservative
and optimistic P2G cost scenarios. These assumptions are summarized in Table 1, with
full details in Appendix C. The conservative cost scenario aligns more closely with the
costing approach used elsewhere in the PATHWAYS modeling (Chapter 3).
9 Higher capacity factor could be assumed if additional renewable integration solutions, such as batteries,
were used to maximize P2G capital utilization, with uncertain impacts on total cost. This option was not
evaluated here.

DRAFT – DO NOT CITE OR QUOTE
27
Table 1: Summary of P2G Assumptions
Assumption Conservative Scenario Optimistic Scenario
Industry
Learning
Moderate learning and scale-
up*
Rapid learning and scale-up*
Electrolysis
Technology
Even proportions of AEC and
PEM through 2030,
transitioning to SOEC by 2040
Even proportions of AEC and
PEM in 2020, transitioning to
SOEC by 2030
CO2 Source Limited California bio-CO2
coproduct, with most provided
by DAC
Entirely bio-CO2 coproduct
from co-located Midwest
biofuel production10
Energy Source Off-grid California solar
($26/MWh and 25% cap factor
in 2050)
Off-grid Midwest wind
($40/MWh and 40% cap factor
in 2050)
*Moderate scale-up implied 0.3 terawatt (TW, a trillion watts) of global electrolysis capacity by
2050, while rapid scale-up implied 2.7 TW. (Today’s capacity is estimated at 0.013 TW). See
Appendix C for full details.
Source: E3
In these two scenarios, this analysis projects the efficiency of hydrogen electrolysis with
SOECs to reach 80 percent by 2050. The overall energy efficiency of SNG production is
lower, as methanation and CO2 supply are associated with additional conversion losses.
The efficiency reaches 56 percent with bio-CO2 and 45 percent with DAC in 2050.
The resulting all-in commodity costs are illustrated in Figure 7. The costs of SNG are
very high when DAC is required. Even with modest cost declines due to industry
learning, SNG produced from a new plant is projected to be $86/MMBtu by 2050 in the
conservative P2G scenario, compared with a natural gas price forecast of $5/MMBtu.
Commensurate with the optimistic case with full use of bio-CO2 and rapid industry
learning, costs from a new plant decline to just greater than $30/MMBtu in 2050,
consistent with other studies (Navigant 2019). Commodity costs of hydrogen are
projected to be much lower than those of SNG, reaching as low as $20/MMBtu for a
new plant in 2050 in the low-cost scenario; however, the upper limit of 7 percent in the
existing distribution pipeline system limits the benefit of this lower-cost P2G option.
10 This requires coordination of biofuel production with SNG production outside California, the colocation
of this production with off-grid wind farms, and California GHG credit for injection of this SNG into the
gas pipeline system at the point of production.
DRAFT – DO NOT CITE OR QUOTE
28
Figure 7: P2G Commodity Costs for Production From a New Plant in 2030 or 2050
These are costs for production from a new plant in 2030 or 2050 with either 100 percent DAC or
100 percent bio-CO2 and a single electrolysis technology. The conservative and optimistic labels
roughly correspond with the PATHWAYS scenarios shown CHAPTER 3:
California Economywide Decarbonization Scenarios. In PATHWAYS, however, the capital costs
are vintage over an assumed 20-year life, the CO2 source blend varies over time in the base cost
scenario, and the electrolysis technology blend also varies over time.
Source: E3
RNG Supply Curve Figure 8 below summarizes the results of this section in a supply curve representing the
technical potential for RNG available to California using the four categories of RNG
assessed: biomethane from waste biogas via anaerobic digestion; biomethane from
gasification of wastes and residues; electrolytic hydrogen up to a 7 percent pipeline
blend; and electrolytic SNG, with a portion, representing the available bio-CO2 followed
by SNG with DAC as the marginal, potential-unlimited resource.
As was found in Mahone et al (2018), Figure 8 implies that there is insufficient low-cost,
sustainable RNG supply to decarbonize the pipeline fully without electrification. Pipeline
gas demand in 2017 was 2 quadrillion Btu (quads), including electricity generation. This
demand could decline to 1.3 quads in a scenario with high energy efficiency and
renewable electricity generation by 2050 (Chapter 3). However, the relatively low-cost
RNG from California’s population share of United States biomass, excluding purpose-
grown crops, provides only a maximum of 0.6 quads in the absence of any competing
demands for this resource. Consequently, expensive portions of the RNG supply curve
available would very likely be needed to decarbonize gas demand without
electrification.
Given uncertainties in the cost of P2G technologies, researchers developed “Optimistic”
and “Conservative” cost trajectories for hydrogen and SNG. The Optimistic scenario
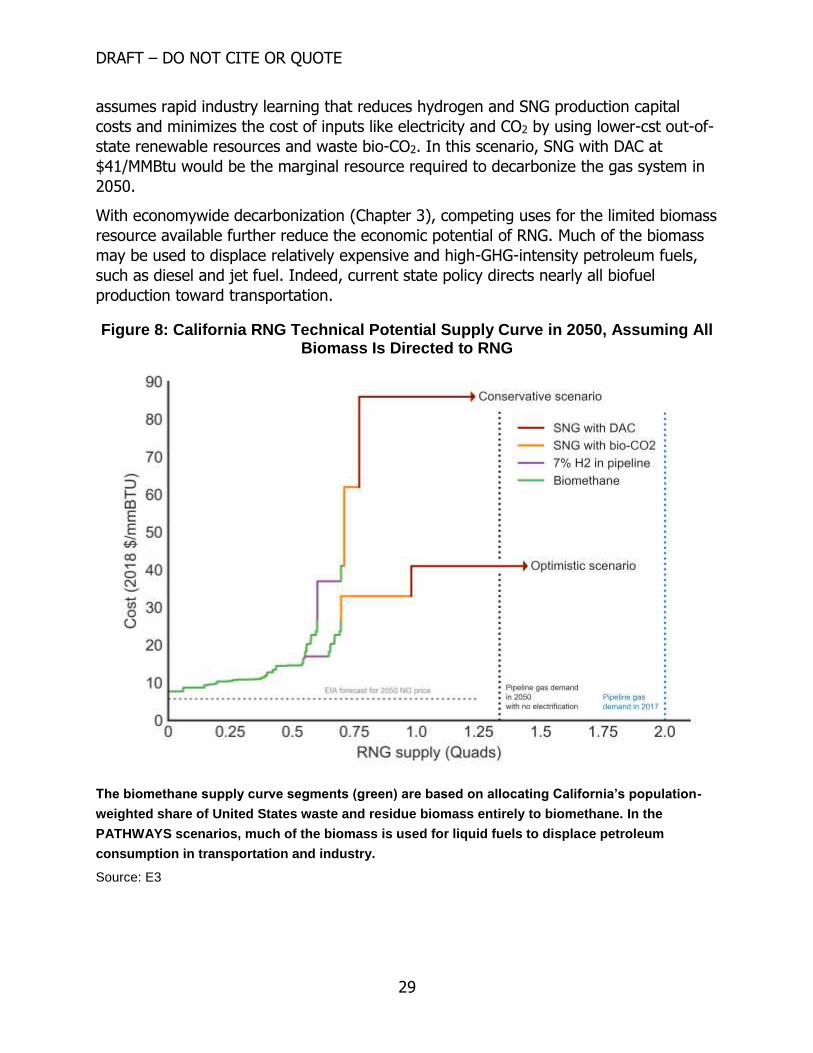
DRAFT – DO NOT CITE OR QUOTE
29
assumes rapid industry learning that reduces hydrogen and SNG production capital
costs and minimizes the cost of inputs like electricity and CO2 by using lower-cst out-of-
state renewable resources and waste bio-CO2. In this scenario, SNG with DAC at
$41/MMBtu would be the marginal resource required to decarbonize the gas system in
2050.
With economywide decarbonization (Chapter 3), competing uses for the limited biomass
resource available further reduce the economic potential of RNG. Much of the biomass
may be used to displace relatively expensive and high-GHG-intensity petroleum fuels,
such as diesel and jet fuel. Indeed, current state policy directs nearly all biofuel
production toward transportation.
Figure 8: California RNG Technical Potential Supply Curve in 2050, Assuming All Biomass Is Directed to RNG
The biomethane supply curve segments (green) are based on allocating California’s population-
weighted share of United States waste and residue biomass entirely to biomethane. In the
PATHWAYS scenarios, much of the biomass is used for liquid fuels to displace petroleum
consumption in transportation and industry.
Source: E3
DRAFT – DO NOT CITE OR QUOTE
30
CHAPTER 3: California Economywide Decarbonization Scenarios
Methods
PATHWAYS Model
The California PATHWAYS model uses user-defined scenarios to test how mitigation
measures interact across sectors and add up to meet deep economywide emissions
targets. The California PATHWAYS model has been used in several California studies,
including research that informed setting the state’s 2030 GHG goal (E3, 2015), studies
to model the California Air Resources Board (CARB) Scoping Plan Update (CARB, 2017),
and CEC research exploring a range of scenarios to achieve an 80 x 50 goal for 2050
(Mahone et al, 2018). Because the model represents the stocks and turnover of building
appliances and on-road vehicles, it inherently represents the infrastructure inertia of the
energy system. By including all energy consumption throughout the economy, achieving
a deep decarbonization scenario requires making tradeoffs about how to allocate scarce
fossil and bioenergy budgets across sectors. For example, different scenarios may leave
more fossil emissions in the transportation sector versus the industrial or buildings
sector.
The model used in this study includes minor updates to that used in Mahone et al
(2018) beyond the improved representation of RNG and biofuels discussed in Chapter 2
and described in Appendix E. Costs of renewable electricity generation and battery
storage resources have been updated to the Mahone et al (2018) assessment, resulting
in lower cost renewable electricity post-2030. In addition, retrofit costs for installing
heat pumps in existing buildings were added, with a range of $0 to $8,000 of
incremental capital cost assumed upon first fuel-switching to heat pump space heating
for homes, depending on vintage and the presence of existing air conditioning (AC).11
In addition, retrofit costs were added in commercial buildings upon first fuel-switching,
with a range of 0% to 100% of the capital cost of heat pump HVAC. Together, these
retrofit costs add nearly $3 billion of annualized capital costs to high electrification
scenarios in 2050 based on building retrofits over the preceding decades. This cost
11 See (Mahone et al., 2019) for a more detailed analysis of costs to retrofit existing buildings for electric
appliances. The range here is based loosely on TRC (2016) and accounts for electrical panel upgrade
costs, as well as first-time costs in the absence of existing air conditioning like compressor siting. See
Appendix E for more details.
DRAFT – DO NOT CITE OR QUOTE
31
increment peaks in 2048 and would decline over time if the scenario were continued
beyond 2050 as a smaller share of buildings incur retrofit costs over time.
Scenario Design
In (Mahone et al., 2018), researchers developed 10 scenarios for the CEC that met the
climate goal of 80 percent GHG reductions below 1990 levels by 2050 (“80 x 50”).
These scenarios tested the impact of greater or lesser reliance on key decarbonization
strategies, like building electrification, biofuels, and hydrogen trucks. That study found
that building electrification resulted in substantially lower economywide mitigation costs,
relative to a scenario that excluded building electrification but had comparable other
assumptions, such as biofuel availability.
In this study, the research team adapts several of the scenarios presented in 2018 to
incorporate the biofuels and P2G analysis in Chapter 2, as well as other minor updates
to cost and scenario assumptions. These scenarios (Table 2) were designed to
investigate whether updated RNG cost information changes any of the previous
findings, as well as to explore the distributional and air quality impacts of building
decarbonization strategies (subsequent chapters). This report highlights two bookend
scenarios, a “high building electrification” scenario (HBE) and a “no building
electrification” scenario (NBE). Those scenarios are compared against a common
baseline, the “current policy reference scenario” (shortened to Reference). Full scenario
assumptions, such as key input measures by sector, are in Appendix E. Several
additional scenarios were developed with intermediate levels of building electrification,
but these were found to show predictable intermediate results on key scenario metrics,
so they are included only in the appendix.
Current Policy Reference: This scenario does not meet California’s 2030 and 2050
GHG goals. It reflects the energy efficiency goals of Senate Bill (SB) 350, the
CARB Short-Lived Climate Pollutant Strategy (SLCP—De León, Chapter 547,
Statutes of 2015), the CARB Mobile Source Strategy, and other known policy
commitments included in the 2017 Scoping Plan Update (CARB, 2017),12 as well
as a “zero-carbon retail sales” interpretation of SB 100.13 Besides SB 100,
additional updates from the 2018 published “Current Policy Scenario,” based on
recent trends and legal challenges, include assuming reduced progress in
improving fuel economy of new vehicles and reducing vehicle miles traveled
12 As in previous PATHWAYS studies, the CARB Cap-and-Trade Program is not explicitly modeled, but it
would be expected to contribute to further emission reductions beyond those associated with these
known policy commitments.
13 Interpretation of SB 100, a 2018 law to decarbonize electricity, is still ongoing. This study assumes
that it requires utilities to procure zero-carbon generation equal to their retail sales by 2045, with a small
amount of remaining in-state or imported natural gas generation commensurate with losses, exports, and
other exemptions. In 2030, SB 100 is represented as a 60 percent RPS.
DRAFT – DO NOT CITE OR QUOTE
32
(VMT) (Mahone, 2018). Only very high efficiency natural gas furnaces and water
heaters are installed by 2025.
High Building Electrification: This scenario (based on the 2018 “no hydrogen”
scenario) achieves a 40 percent reduction of GHGs below 1990 levels by 2030
and 80 percent by 2050. It includes high electrification of buildings. The scenario
also includes high electrification of light-duty vehicles and moderate
electrification of medium- and heavy-duty vehicles, with fuel-switching of most
non-electrified diesel trucks to compressed natural gas (CNG) for air quality. The
limited biofuel and fossil energy emissions budgets are allocated largely to
transportation (particularly heavy-duty and off-road) and industry, including
pipeline biomethane. Buildings are nearly completely decarbonized by 2050. Most
but not all the available biomass is used for advanced biofuels, as the maximum
portfolio is not needed to meet the economywide GHG target.
No Building Electrification: In this scenario, fuel-switching in buildings is not
assumed. Natural gas and electric appliance shares remain constant from 2015.
This scenario represents a hypothetical bookend, as some economic or local
policy-driven electrification is underway. Only high-efficiency natural gas
furnaces and water heaters are installed by 2025. The same high level of light-
duty vehicle electrification is assumed as in high building electrification, and most
non-electrified diesel trucks shift to CNG. To make up for the emissions
mitigation shortfall from not electrifying buildings, hydrogen and SNG are
blended into the pipeline as well as biomethane; in addition, more battery-
electric and hydrogen fuel cell trucks are included. Much of the limited biofuel
and fossil energy emissions budgets are allocated to buildings. The pipeline gas
blend remains 56 percent fossil natural gas by 2050 to avoid increasing scenario
costs by blending additional expensive SNG. In addition to a similar amount of
biomethane and renewable diesel as in the high building electrification scenario,
the remainder of the biomass supply is used to make renewable gasoline and jet
fuel to displace additional GHGs. For cost results, this analysis presents both
using the conservative and optimistic P2G cost scenarios (Chapter 2).
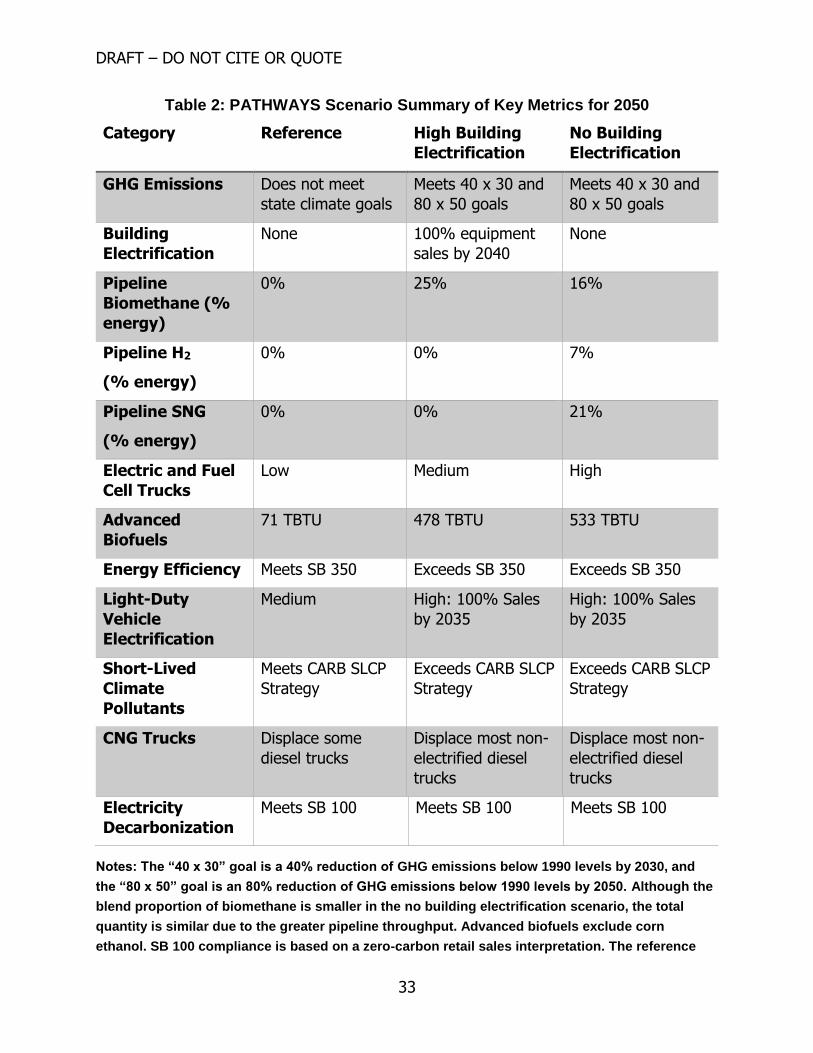
DRAFT – DO NOT CITE OR QUOTE
33
Table 2: PATHWAYS Scenario Summary of Key Metrics for 2050
Category Reference High Building
Electrification
No Building
Electrification
GHG Emissions Does not meet
state climate goals
Meets 40 x 30 and
80 x 50 goals
Meets 40 x 30 and
80 x 50 goals
Building
Electrification
None 100% equipment
sales by 2040
None
Pipeline
Biomethane (%
energy)
0% 25% 16%
Pipeline H2
(% energy)
0% 0% 7%
Pipeline SNG
(% energy)
0% 0% 21%
Electric and Fuel
Cell Trucks
Low Medium High
Advanced
Biofuels
71 TBTU 478 TBTU 533 TBTU
Energy Efficiency Meets SB 350 Exceeds SB 350 Exceeds SB 350
Light-Duty
Vehicle
Electrification
Medium High: 100% Sales
by 2035
High: 100% Sales
by 2035
Short-Lived
Climate
Pollutants
Meets CARB SLCP
Strategy
Exceeds CARB SLCP
Strategy
Exceeds CARB SLCP
Strategy
CNG Trucks Displace some
diesel trucks
Displace most non-
electrified diesel
trucks
Displace most non-
electrified diesel
trucks
Electricity
Decarbonization
Meets SB 100 Meets SB 100 Meets SB 100
Notes: The “40 x 30” goal is a 40% reduction of GHG emissions below 1990 levels by 2030, and
the “80 x 50” goal is an 80% reduction of GHG emissions below 1990 levels by 2050. Although the
blend proportion of biomethane is smaller in the no building electrification scenario, the total
quantity is similar due to the greater pipeline throughput. Advanced biofuels exclude corn
ethanol. SB 100 compliance is based on a zero-carbon retail sales interpretation. The reference

DRAFT – DO NOT CITE OR QUOTE
34
and no building electrification scenarios do not include any fuel substitution of natural gas end
uses in buildings for electricity, instead maintaining a constant market share of natural gas end
uses; however, some propane and fuel oil end uses are electrified. A more detailed listing of
scenario measures is in Appendix E.
Source: E3
GHG Accounting and Methane Leaks
PATHWAYS uses a direct GHG emissions accounting metric benchmarked to the CARB
inventory for 2015 emissions. The CARB inventory is used to monitor California’s
progress against its emissions reduction targets. This inventory accounts for in-state
emissions as well as emissions from imported electricity. It uses the 100-year global
warming potentials (GWP) calculated based on the 2007 IPCC (Forster et al., 2007).14
Because the inventory focuses on in-state emissions, upstream or life-cycle emissions
from imported fossil fuels and biofuels are excluded,15 as are embedded emissions from
imported goods and raw materials. The 20-year GWP is sometimes used to emphasize
the role of short-lived climate pollutants (SLCPs), such as methane, black carbon or
fluorinated gases, which have a shorter residence period in the atmosphere than carbon
dioxide in near-term warming. However, the research team cautions that neither GWP
metric is universally appropriate.
The CARB inventory includes fugitive methane emissions from in-state natural gas
production and the pipeline system. The most recent inventory update (2019) also
includes behind-the-meter methane leakage from homes, which is equivalent to roughly
14 The United States EPA explains 100-year global warming potential in the following way, “The Global
Warming Potential (GWP) was developed to allow comparisons of the global warming impacts of different
gases. Specifically, it is a measure of how much energy the emissions of 1 ton of a gas will absorb over a
given period of time, relative to the emissions of 1 ton of carbon dioxide (CO2). The larger the GWP, the
more that a given gas warms the Earth compared to CO2 over that time period. The time period usually
used for GWPs is 100 years. GWPs provide a common unit of measure, which allows analysts to add up
emissions estimates of different gases (e.g., to compile a national GHG inventory), and allows
policymakers to compare emissions reduction opportunities across sectors and gases.” Quoted from
United States Environmental Protection Agency (https://www.epa.gov/ghgemissions/understanding-
global-warming-potentials).
15 To avoid GHG emissions from indirect land-use change, additional fertilizer use, and so forth, biofuels
are limited to those derived from waste and residue resource (Chapter 2). Depending on the future
biofuels industry development, fossil emissions associated with collecting, transporting, and processing
the biomass may occur. Fossil natural gas extraction incurs significant upstream emissions from fugitive
methane, but petroleum extraction and transport are also associated with large upstream emissions,
varying widely depending on the petroleum source.
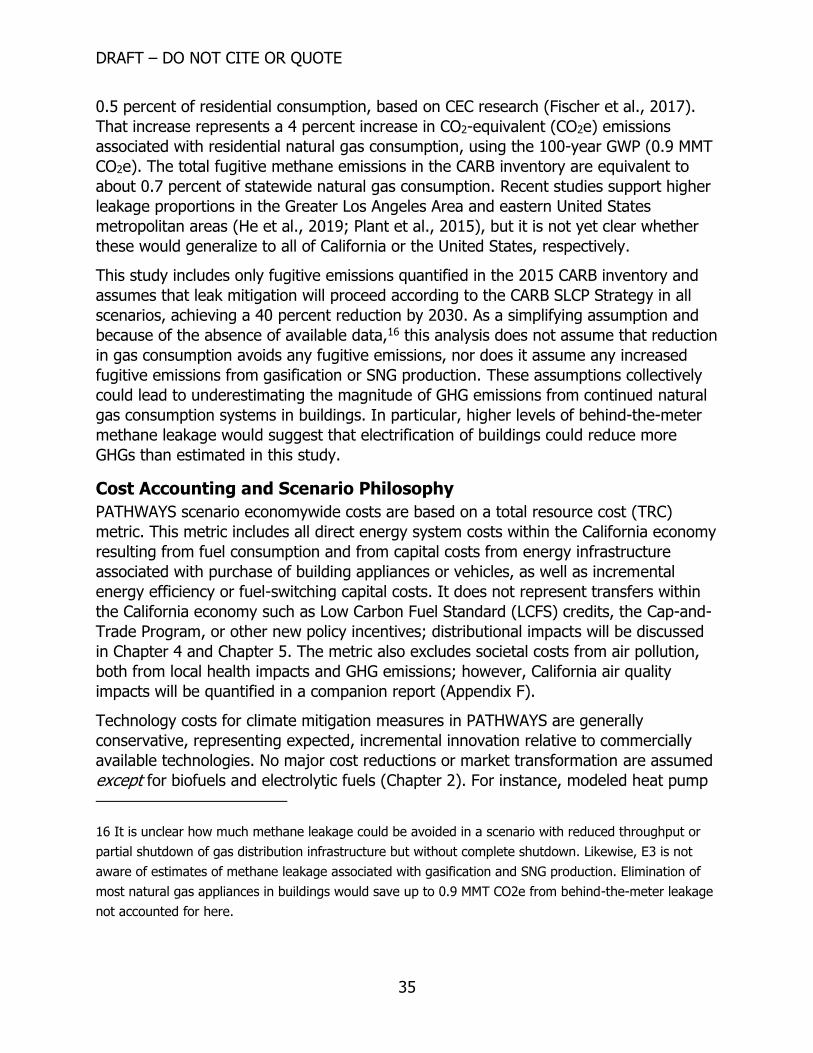
DRAFT – DO NOT CITE OR QUOTE
35
0.5 percent of residential consumption, based on CEC research (Fischer et al., 2017).
That increase represents a 4 percent increase in CO2-equivalent (CO2e) emissions
associated with residential natural gas consumption, using the 100-year GWP (0.9 MMT
CO2e). The total fugitive methane emissions in the CARB inventory are equivalent to
about 0.7 percent of statewide natural gas consumption. Recent studies support higher
leakage proportions in the Greater Los Angeles Area and eastern United States
metropolitan areas (He et al., 2019; Plant et al., 2015), but it is not yet clear whether
these would generalize to all of California or the United States, respectively.
This study includes only fugitive emissions quantified in the 2015 CARB inventory and
assumes that leak mitigation will proceed according to the CARB SLCP Strategy in all
scenarios, achieving a 40 percent reduction by 2030. As a simplifying assumption and
because of the absence of available data,16 this analysis does not assume that reduction
in gas consumption avoids any fugitive emissions, nor does it assume any increased
fugitive emissions from gasification or SNG production. These assumptions collectively
could lead to underestimating the magnitude of GHG emissions from continued natural
gas consumption systems in buildings. In particular, higher levels of behind-the-meter
methane leakage would suggest that electrification of buildings could reduce more
GHGs than estimated in this study.
Cost Accounting and Scenario Philosophy
PATHWAYS scenario economywide costs are based on a total resource cost (TRC)
metric. This metric includes all direct energy system costs within the California economy
resulting from fuel consumption and from capital costs from energy infrastructure
associated with purchase of building appliances or vehicles, as well as incremental
energy efficiency or fuel-switching capital costs. It does not represent transfers within
the California economy such as Low Carbon Fuel Standard (LCFS) credits, the Cap-and-
Trade Program, or other new policy incentives; distributional impacts will be discussed
in Chapter 4 and Chapter 5. The metric also excludes societal costs from air pollution,
both from local health impacts and GHG emissions; however, California air quality
impacts will be quantified in a companion report (Appendix F).
Technology costs for climate mitigation measures in PATHWAYS are generally
conservative, representing expected, incremental innovation relative to commercially
available technologies. No major cost reductions or market transformation are assumed
except for biofuels and electrolytic fuels (Chapter 2). For instance, modeled heat pump
16 It is unclear how much methane leakage could be avoided in a scenario with reduced throughput or
partial shutdown of gas distribution infrastructure but without complete shutdown. Likewise, E3 is not
aware of estimates of methane leakage associated with gasification and SNG production. Elimination of
most natural gas appliances in buildings would save up to 0.9 MMT CO2e from behind-the-meter leakage
not accounted for here.

DRAFT – DO NOT CITE OR QUOTE
36
space heater efficiencies in PATHWAYS improve only modestly from an achieved
coefficient of performance (COP) of 3.2 to 4.3 for new installations between 2015 and
2030. No improvements are assumed between 2030 and 2050.17
This report focused on the potential innovation in RNG technologies specifically to test
whether these would change the results from E3’s 2018 Deep Decarbonization study,
which showed that building electrification was a more cost-effective option to
decarbonize buildings. In addition, this analysis does not assume any increase in air
conditioning adoption relative to the adoption share found in existing buildings, even
though recent trends that could be enhanced by climate change show greater levels of
AC adoption.18 This assumption is a modeling limitation that the research team intends
to address in future studies. Previous work (Mahone et al, 2019) finds that heat pump
space heaters have zero or negative incremental capital cost when central AC is present
or planned. If there were more AC in the current policy reference scenario, the
incremental cost of the high building electrification scenario would be lower than that
calculated here.
Scenario Results
Energy Consumption
Both mitigation scenarios show a large increase in electricity demand and decrease in
fossil energy demand relative to today’s fuels, with especially large reductions in
transportation fossil energy demand (Figure 9 and Figure 10). However, several
differences between the high building electrification and the no building electrification
scenarios emerge. The high building electrification scenario has lower energy demand
overall because of the efficiency associated with building electrification. Both scenarios
include substantial quantities of remaining fossil natural gas and relatively similar
quantities of biofuels, but these are allocated to different sectors. The high building
electrification scenario allocates more natural gas and biomethane to transportation,
industry, and agriculture, while in the no building electrification scenario, about half of
17 The COP is a measurement of the efficiency of the equipment. In California, where temperatures are
relatively mild compared to other parts of the country, the achieved efficiency of heat pumps can exceed
the rated efficiency. The COP assumptions applied in this study are conservative, as the COP of 3.2 is
close to the code minimum requirement, and most models on the market would exceed it if properly
installed.
18 The Residential Appliance Saturation Survey shows a trend of increasing central air-conditioning
penetration in newer building vintages.
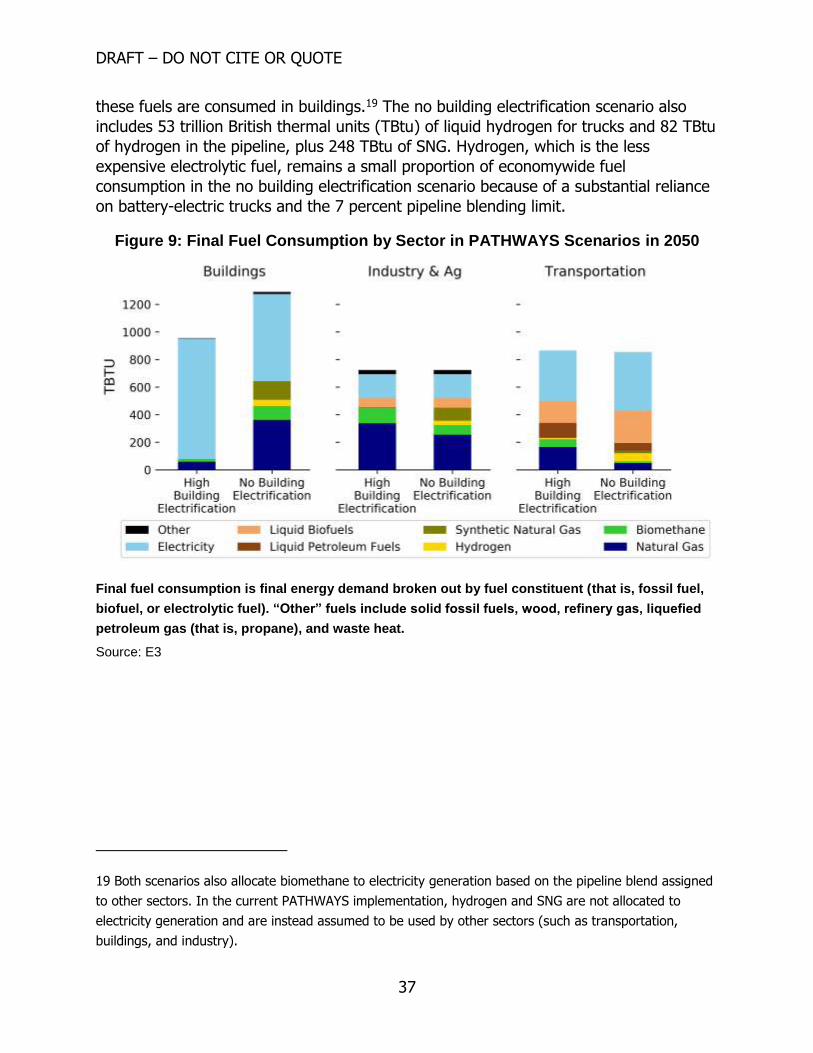
DRAFT – DO NOT CITE OR QUOTE
37
these fuels are consumed in buildings.19 The no building electrification scenario also
includes 53 trillion British thermal units (TBtu) of liquid hydrogen for trucks and 82 TBtu
of hydrogen in the pipeline, plus 248 TBtu of SNG. Hydrogen, which is the less
expensive electrolytic fuel, remains a small proportion of economywide fuel
consumption in the no building electrification scenario because of a substantial reliance
on battery-electric trucks and the 7 percent pipeline blending limit.
Figure 9: Final Fuel Consumption by Sector in PATHWAYS Scenarios in 2050
Final fuel consumption is final energy demand broken out by fuel constituent (that is, fossil fuel,
biofuel, or electrolytic fuel). “Other” fuels include solid fossil fuels, wood, refinery gas, liquefied
petroleum gas (that is, propane), and waste heat.
Source: E3
19 Both scenarios also allocate biomethane to electricity generation based on the pipeline blend assigned
to other sectors. In the current PATHWAYS implementation, hydrogen and SNG are not allocated to
electricity generation and are instead assumed to be used by other sectors (such as transportation,
buildings, and industry).
DRAFT – DO NOT CITE OR QUOTE
38
Figure 10: Economywide Final Fuel Consumption in PATHWAYS Scenarios
Final fuel consumption is final energy demand broken out by fuel constituent (in other words,
fossil fuel, biofuel, or electrolytic fuel). “Other” fuels include solid fossil fuels, wood, refinery gas,
liquefied petroleum gas (that is, propane), and waste heat. The bar charts on the right are for 2050.
Source: E3
Both scenarios show large increases in electricity loads relative to today’s loads, but
loads are greater in the no building electrification scenario, when the fuel production
loads are accounted for: these are 195 to 222 TWh in 2050, depending on the P2G cost
scenario, compared with today’s loads of about 293 TWh. Most of these fuel production
loads are assumed served by off-grid wind and solar, so they may avoid buildout of new
transmission and distribution infrastructure but still represent a larger expansion of the
electricity system and renewable generation capacity requirement than in the high
building electrification scenario. In the high building electrification scenario, nearly
complete electrification of buildings induces 47 terawatt-hours (TWh) of new load,
which is less than half that associated with transportation electrification.

DRAFT – DO NOT CITE OR QUOTE
39
Figure 11: Electricity Loads by Sector in PATHWAYS Scenarios
Electricity loads consist of final demand for electricity, except for fuel production loads;
production of hydrogen and SNG are assumed served by off-grid renewables, except for liquid
hydrogen for delivery to fuel cell trucks, which are assumed to be produced on-grid so they can
be relatively close to consumption. The no building electrification scenario loads shown here
correspond to the conservative cost P2G scenario. These loads would be slightly lower in the
optimistic cost P2G scenario due to greater use of bio-CO2 rather than DAC.
Source: E3
A common claim is that electrolytic fuel production can use low-cost wind and solar
energy that would otherwise be curtailed. This study finds that the loads required to
produce sufficient quantities of hydrogen and SNG far exceed the amount of curtailment
that can be expected in a future electricity system that uses renewable integration
solutions. Those solutions include flexible loads, storage, and gas combustion turbine
electric generators that use a small amount of biomethane or natural gas. Using those
solutions, only 16 percent of renewable generation, or 63 TWh, is curtailed in the no
building electrification scenario.20 This curtailment means that up to 159 TWh of
additional electricity generation is needed for fuel-production alone, or just greater than
half of California’s annual electric loads today.
20 This amount is based on PATHWAYS modeling, which does not optimize the portfolio of renewables
and storage to strictly minimize electricity generation costs. RESOLVE modeling for an 80 x 50 scenario in
(Mahone 2018) showed 15 percent curtailment. Newer simulations with lower-cost storage yield lower
optimal curtailment levels.

DRAFT – DO NOT CITE OR QUOTE
40
Figure 12: 2050 Curtailment Compared to P2G Loads in the No Building Electrification Scenario
Source: E3
Natural Gas Throughput and Commodity Composition
Natural gas throughput declines in all scenarios. In the reference scenario, natural gas
electricity generation declines markedly as renewables displace natural gas because of
modeled implementation of SB 100 (Figure 13). In the no building electrification
scenario, high energy efficiency and reduced petroleum industry energy demand
(included in both mitigation scenarios) further reduce natural gas demand. However,
natural gas demand in buildings remains relatively flat in this scenario (and in the
reference), with efficiency offsetting population and economic growth. In the high
building electrification scenario, in contrast, natural gas demand in buildings falls
precipitously post-2030, reaching an 89 percent reduction by 2050, and on pace to
decline further after the end of the scenario time frame.
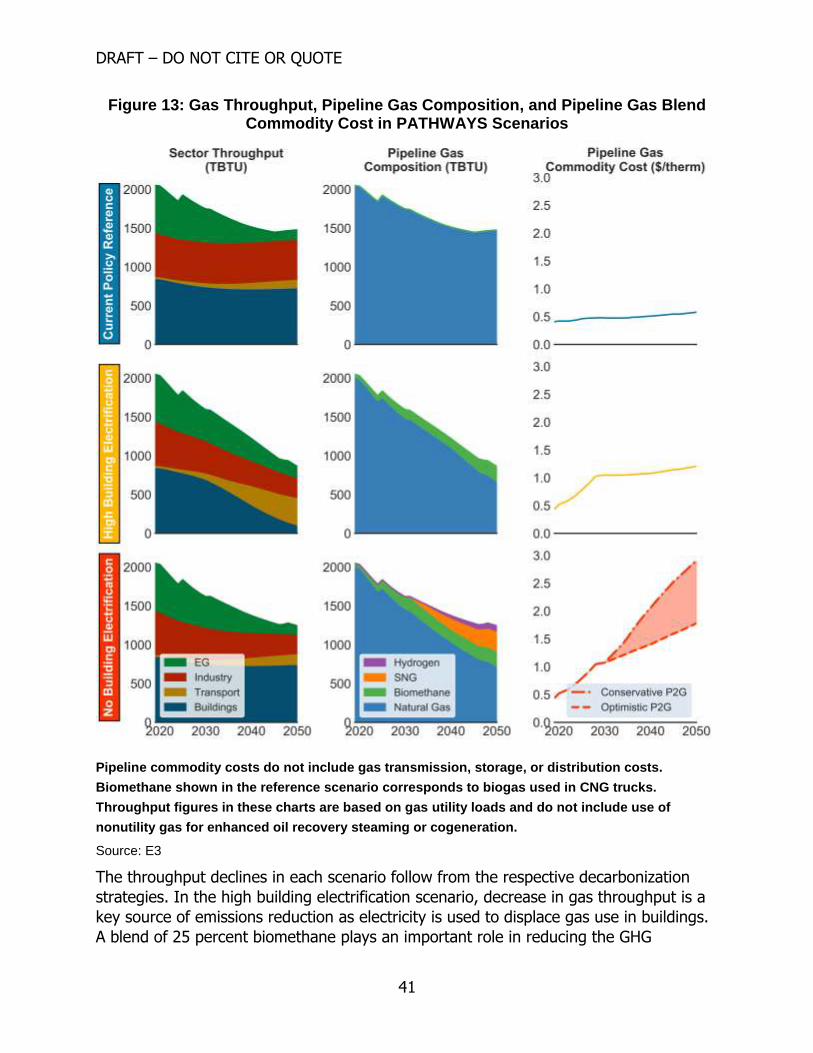
DRAFT – DO NOT CITE OR QUOTE
41
Figure 13: Gas Throughput, Pipeline Gas Composition, and Pipeline Gas Blend Commodity Cost in PATHWAYS Scenarios
Pipeline commodity costs do not include gas transmission, storage, or distribution costs.
Biomethane shown in the reference scenario corresponds to biogas used in CNG trucks.
Throughput figures in these charts are based on gas utility loads and do not include use of
nonutility gas for enhanced oil recovery steaming or cogeneration.
Source: E3
The throughput declines in each scenario follow from the respective decarbonization
strategies. In the high building electrification scenario, decrease in gas throughput is a
key source of emissions reduction as electricity is used to displace gas use in buildings.
A blend of 25 percent biomethane plays an important role in reducing the GHG
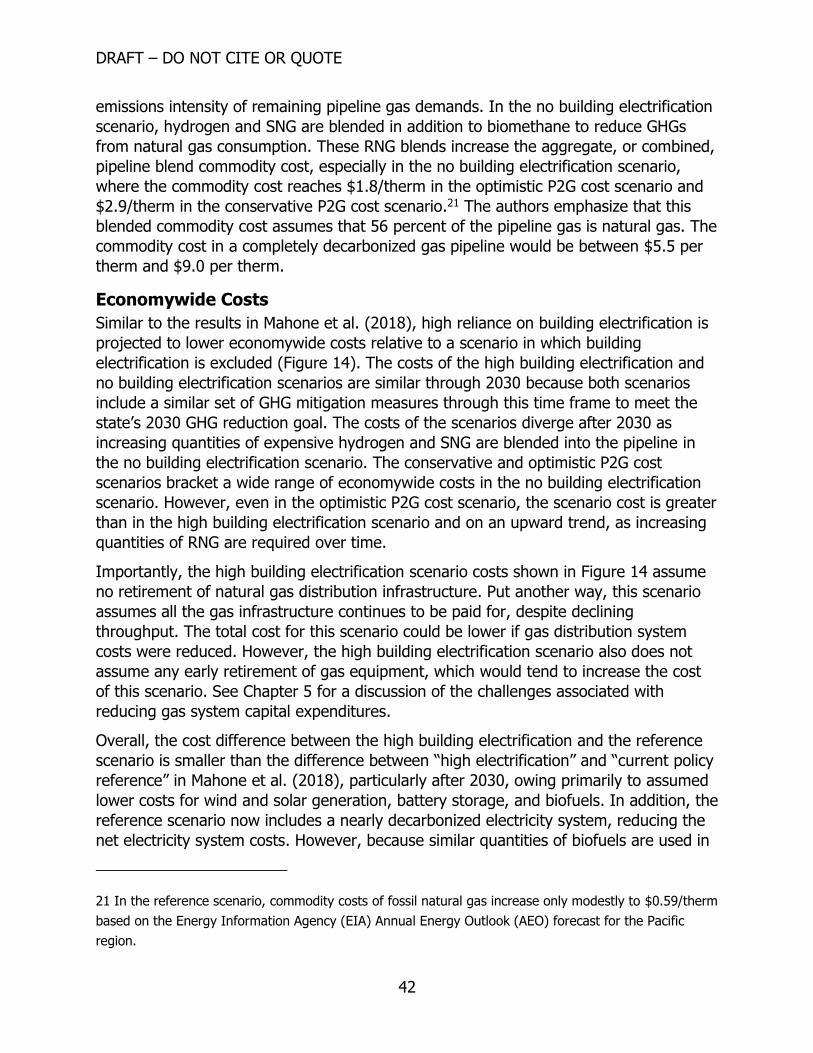
DRAFT – DO NOT CITE OR QUOTE
42
emissions intensity of remaining pipeline gas demands. In the no building electrification
scenario, hydrogen and SNG are blended in addition to biomethane to reduce GHGs
from natural gas consumption. These RNG blends increase the aggregate, or combined,
pipeline blend commodity cost, especially in the no building electrification scenario,
where the commodity cost reaches $1.8/therm in the optimistic P2G cost scenario and
$2.9/therm in the conservative P2G cost scenario.21 The authors emphasize that this
blended commodity cost assumes that 56 percent of the pipeline gas is natural gas. The
commodity cost in a completely decarbonized gas pipeline would be between $5.5 per
therm and $9.0 per therm.
Economywide Costs
Similar to the results in Mahone et al. (2018), high reliance on building electrification is
projected to lower economywide costs relative to a scenario in which building
electrification is excluded (Figure 14). The costs of the high building electrification and
no building electrification scenarios are similar through 2030 because both scenarios
include a similar set of GHG mitigation measures through this time frame to meet the
state’s 2030 GHG reduction goal. The costs of the scenarios diverge after 2030 as
increasing quantities of expensive hydrogen and SNG are blended into the pipeline in
the no building electrification scenario. The conservative and optimistic P2G cost
scenarios bracket a wide range of economywide costs in the no building electrification
scenario. However, even in the optimistic P2G cost scenario, the scenario cost is greater
than in the high building electrification scenario and on an upward trend, as increasing
quantities of RNG are required over time.
Importantly, the high building electrification scenario costs shown in Figure 14 assume
no retirement of natural gas distribution infrastructure. Put another way, this scenario
assumes all the gas infrastructure continues to be paid for, despite declining
throughput. The total cost for this scenario could be lower if gas distribution system
costs were reduced. However, the high building electrification scenario also does not
assume any early retirement of gas equipment, which would tend to increase the cost
of this scenario. See Chapter 5 for a discussion of the challenges associated with
reducing gas system capital expenditures.
Overall, the cost difference between the high building electrification and the reference
scenario is smaller than the difference between “high electrification” and “current policy
reference” in Mahone et al. (2018), particularly after 2030, owing primarily to assumed
lower costs for wind and solar generation, battery storage, and biofuels. In addition, the
reference scenario now includes a nearly decarbonized electricity system, reducing the
net electricity system costs. However, because similar quantities of biofuels are used in
21 In the reference scenario, commodity costs of fossil natural gas increase only modestly to $0.59/therm
based on the Energy Information Agency (EIA) Annual Energy Outlook (AEO) forecast for the Pacific
region.
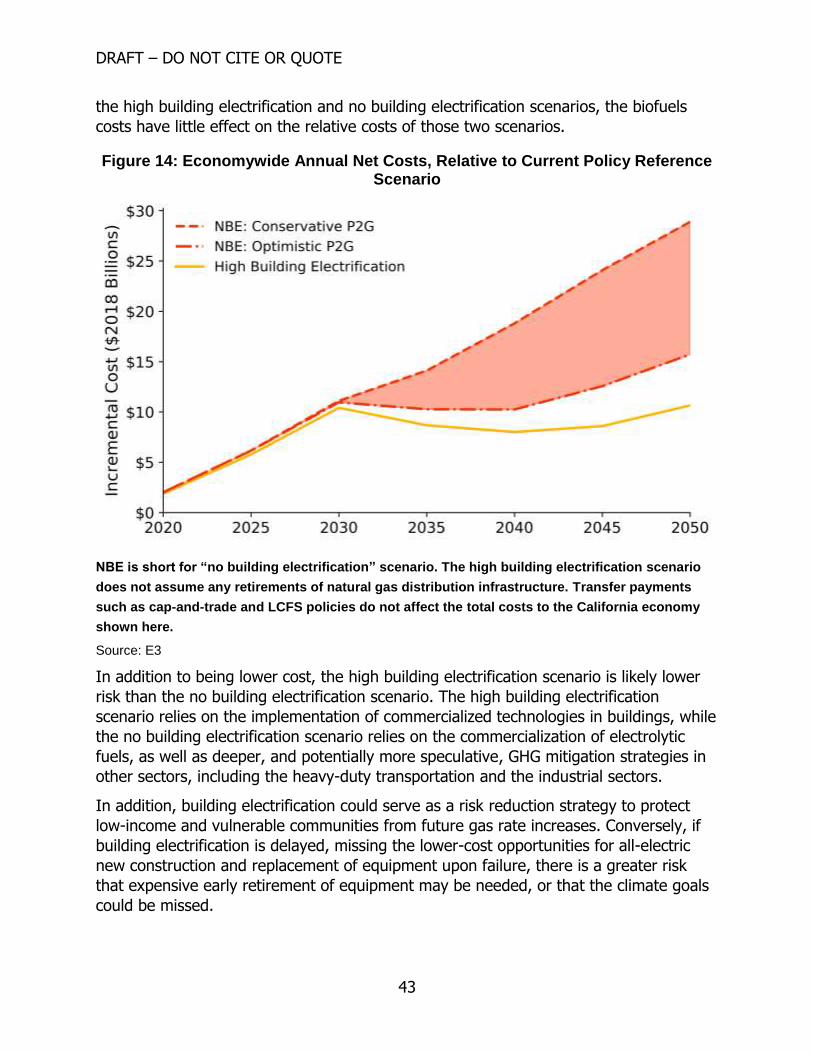
DRAFT – DO NOT CITE OR QUOTE
43
the high building electrification and no building electrification scenarios, the biofuels
costs have little effect on the relative costs of those two scenarios.
Figure 14: Economywide Annual Net Costs, Relative to Current Policy Reference Scenario
NBE is short for “no building electrification” scenario. The high building electrification scenario
does not assume any retirements of natural gas distribution infrastructure. Transfer payments
such as cap-and-trade and LCFS policies do not affect the total costs to the California economy
shown here.
Source: E3
In addition to being lower cost, the high building electrification scenario is likely lower
risk than the no building electrification scenario. The high building electrification
scenario relies on the implementation of commercialized technologies in buildings, while
the no building electrification scenario relies on the commercialization of electrolytic
fuels, as well as deeper, and potentially more speculative, GHG mitigation strategies in
other sectors, including the heavy-duty transportation and the industrial sectors.
In addition, building electrification could serve as a risk reduction strategy to protect
low-income and vulnerable communities from future gas rate increases. Conversely, if
building electrification is delayed, missing the lower-cost opportunities for all-electric
new construction and replacement of equipment upon failure, there is a greater risk
that expensive early retirement of equipment may be needed, or that the climate goals
could be missed.

DRAFT – DO NOT CITE OR QUOTE
44
Remaining Emissions in 2050 and Implications for Carbon Neutrality
The no building electrification scenario allocates nearly half of the 2050 fossil energy
emissions budget to buildings (Figure 15). In contrast, the high building electrification
scenario has eliminated most emissions from buildings and is on track to reduce them
further as remaining natural gas appliances reach the end of useful life.
This study focused on modeling scenarios reaching the 80 x 50 goal, but Executive
Order B-55-18 of 2018 set a more stringent goal of a carbon-neutral California by 2045.
Both 80 x 50 scenarios modeled here would require additional GHG mitigation measures
throughout the economy to achieve net-zero GHG emissions. However, the high
building electrification scenario is better placed to reach that goal because it has more
remaining low-cost options to decarbonize transportation and industry, whereas these
are already used in the no building electrification scenario to make up for continued
emissions in buildings. Bringing down the building sector emissions in the no building
electrification scenario to match those in the high building electrification scenario by
2050 would require using SNG with DAC, as other less expensive RNG options are
already fully used. This option would cost $4.1 to $8.6 per therm in commodity cost,
assuming the optimistic and conservative P2G cost scenarios, respectively, relative to
$0.59/therm fossil natural gas. This would result in an additional economywide cost of
$11 billion to $24 billion per year in 2050.
Figure 15: Energy Emissions by Sector
Energy emissions by sector include upstream emissions in electricity in this chart.
Source: E3

DRAFT – DO NOT CITE OR QUOTE
45
Scenario Discussion
Understanding the Economywide Cost Results
Based on the finding that there is likely to be insufficient biomethane available to fully
decarbonize the natural gas system, decarbonized electrolytic fuels are likely to be
required. These fuels require zero-carbon electricity generation.22 The electricity
generation requirement can be compared with using the electricity directly in a heat
pump to serve the same heating demand.
The life-cycle primary energy efficiency23 of using zero-carbon electricity to provide
building space heating ranges from about 300 to 500 percent, accounting for heat
pump efficiency and 7 percent electricity transmission and distribution losses. This
amount equates to about 0.1 kilowatt-hour (kWh) of electricity generation input for 1
kBtu of heat delivered. In contrast, producing SNG from DAC or bio-CO2 and then
burning this in a natural gas furnace provides about 35 to 53 percent primary energy
efficiency accounting for conversion losses, or about 1 kWh of input electricity for each
1 kBtu of heat delivered, given 45 to 56 percent production efficiency (Chapter 2) and a
combined 77 to 95 percent efficiency for delivery and furnace operation.24
More broadly, this is an example of a principle emerging from a consensus in the deep
decarbonization literature (for example, Committee on Climate Change 2019) of
reserving biofuels for the sectors that are the most challenging to electrify, where
required energy density or lack of efficiency benefit from electrification makes
electrification most challenging. With known technologies, low-cost, sustainable liquid
and gaseous fuels are likely to be scarce in any low-carbon future; so they are likely
best targeted to uses like aviation, freight, industrial high-temperature heating, and
backup thermal electricity generation. Because buildings can be electrified at high
efficiency with existing technology, this sector is a less ideal candidate to absorb a large
proportion of biofuel supply.
22 An alternative would be using hydrogen produced from fossil NG with steam methane reformation
coupled with CCS and upgrading the pipeline infrastructure and appliances to use greater blends of
hydrogen. This alternative was not modeled in this study.
23 This is defined as the ratio of the delivered useful energy (that is, heating service) to the energy in the
form of renewable electricity generation to serve this use. Conversion losses in fuel production, losses in
transmission and distribution, and wasted energy in heating systems reduce this ratio.
24 The Energy Information Administration (EIA) estimates about 3 percent consumption of natural gas
within the pipeline system itself, which is not modeled here (EIA 2017).
DRAFT – DO NOT CITE OR QUOTE
46
Thought Experiment of Decarbonizing Space Heating Using Electricity or RNG
The order of magnitude difference in primary energy efficiency drives large differences
in the projected costs of decarbonizing space heating using these two approaches
(Figure 16). Assuming that space heating is fully decarbonized25 by either a heat pump
powered by decarbonized electricity or 100 percent RNG, this analysis finds that the
heat pump would cost from $34 to $53 per month to operate, while RNG in a gas
furnace would cost from $160 to $263 per month to operate.
For this calculation, the research team assumed that space heating service demand
averaged 29 therms per month, based on the PATHWAYS assumption for a single-
family home in the PG&E service territory. Then, the team calculated the energy
demand as the service demand divided by the efficiency. To make a direct comparison,
researchers express units of energy consumed in therms (1 therm = 29.3 kWh). In
California’s mild climate, heat pumps can deliver an equivalent amount of heat with less
than one-fifth the site energy of a gas furnace.26 In 2020, the statewide residential
electricity rate is projected to be $5.30/therm, several times the gas rate of
$1.60/therm, and could be higher if wildfire-related costs and liabilities are passed on
(Chapter 4). This rate partially offsets the higher efficiency, yielding a monthly cost
estimate of $34 to $53 to run the heat pump vs. $38 to $57 to run the gas furnace.
However, the difference is greater in 2050 with decarbonized electricity and gas.
PATHWAYS projects an electricity rate of $5.90/therm in 2050 in the high electrification
scenario, but given uncertainties in electric sector costs, this study shows a range of
results up to $7.70/therm, resulting in a monthly cost range from $34 to $44. The gas
rate in the no building electrification scenario if the RNG blend were increased to 100
percent would range from $5.50 to $9.00, according to the optimistic and conservative
P2G cost scenarios, respectively. Even assuming a 98 percent condensing gas furnace,
this scenario yields a monthly cost of $160 to $263. The 2050 Reference scenario result
is included as a conservative comparison, in which electricity is decarbonized because of
SB 100, but the natural gas blend remains 100 percent fossil. Even in this case,
25 A small amount of emissions would remain in both cases because of 5 percent natural gas generation
in electricity and any unmitigated fugitive methane emissions from the pipeline system and end uses.
26 In today’s electricity system, site energy, a measure of direct energy consumption on-site (rather than
“source energy”, which includes upstream energy consumption associated with electricity generation), is
a somewhat incomplete metric given thermal losses that occur in generating electricity in combustion-
based power plants. However, these scenarios assume that California’s electricity shifts to a largely
noncombustion-based system, at which point the site-energy versus source-energy distinction is less
meaningful.
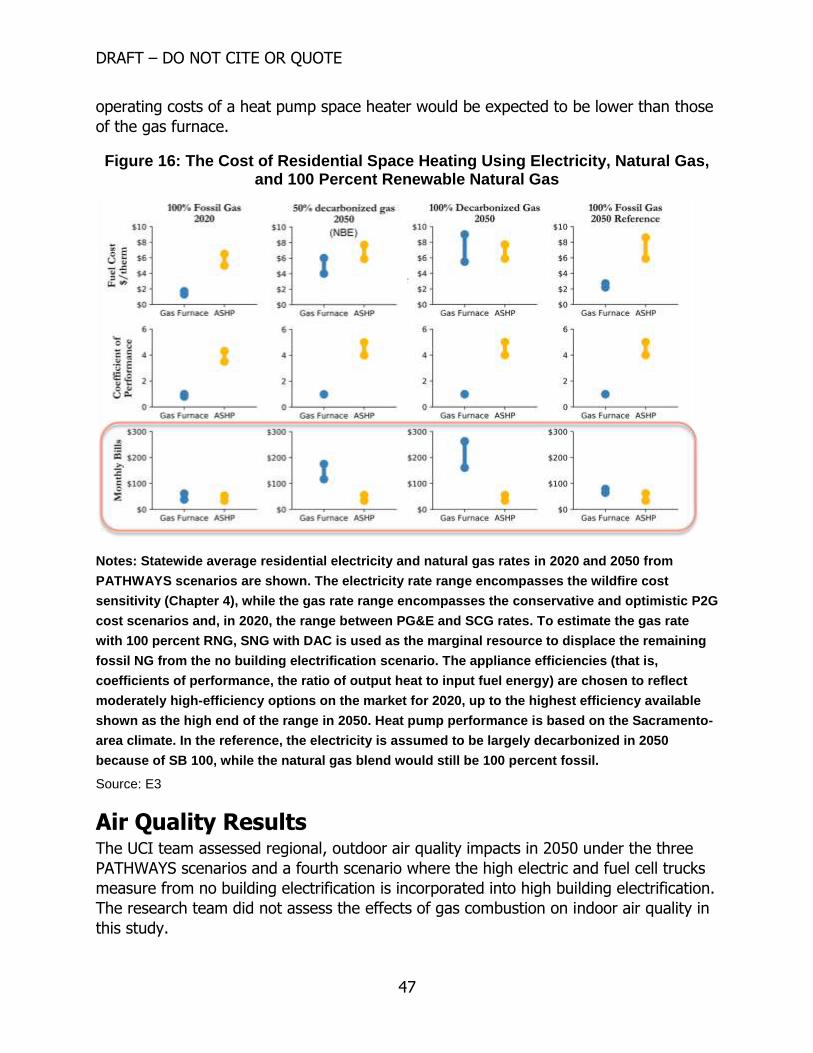
DRAFT – DO NOT CITE OR QUOTE
47
operating costs of a heat pump space heater would be expected to be lower than those
of the gas furnace.
Figure 16: The Cost of Residential Space Heating Using Electricity, Natural Gas, and 100 Percent Renewable Natural Gas
Notes: Statewide average residential electricity and natural gas rates in 2020 and 2050 from
PATHWAYS scenarios are shown. The electricity rate range encompasses the wildfire cost
sensitivity (Chapter 4), while the gas rate range encompasses the conservative and optimistic P2G
cost scenarios and, in 2020, the range between PG&E and SCG rates. To estimate the gas rate
with 100 percent RNG, SNG with DAC is used as the marginal resource to displace the remaining
fossil NG from the no building electrification scenario. The appliance efficiencies (that is,
coefficients of performance, the ratio of output heat to input fuel energy) are chosen to reflect
moderately high-efficiency options on the market for 2020, up to the highest efficiency available
shown as the high end of the range in 2050. Heat pump performance is based on the Sacramento-
area climate. In the reference, the electricity is assumed to be largely decarbonized in 2050
because of SB 100, while the natural gas blend would still be 100 percent fossil.
Source: E3
Air Quality Results The UCI team assessed regional, outdoor air quality impacts in 2050 under the three
PATHWAYS scenarios and a fourth scenario where the high electric and fuel cell trucks
measure from no building electrification is incorporated into high building electrification.
The research team did not assess the effects of gas combustion on indoor air quality in
this study.
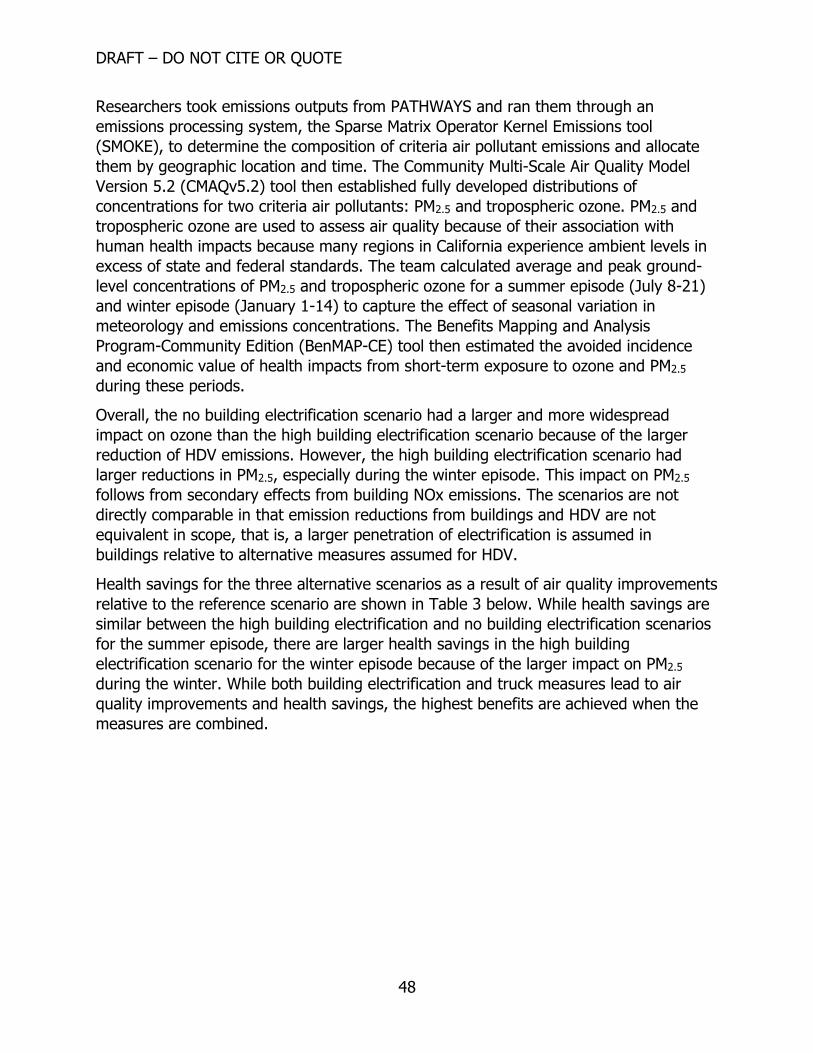
DRAFT – DO NOT CITE OR QUOTE
48
Researchers took emissions outputs from PATHWAYS and ran them through an
emissions processing system, the Sparse Matrix Operator Kernel Emissions tool
(SMOKE), to determine the composition of criteria air pollutant emissions and allocate
them by geographic location and time. The Community Multi-Scale Air Quality Model
Version 5.2 (CMAQv5.2) tool then established fully developed distributions of
concentrations for two criteria air pollutants: PM2.5 and tropospheric ozone. PM2.5 and
tropospheric ozone are used to assess air quality because of their association with
human health impacts because many regions in California experience ambient levels in
excess of state and federal standards. The team calculated average and peak ground-
level concentrations of PM2.5 and tropospheric ozone for a summer episode (July 8-21)
and winter episode (January 1-14) to capture the effect of seasonal variation in
meteorology and emissions concentrations. The Benefits Mapping and Analysis
Program-Community Edition (BenMAP-CE) tool then estimated the avoided incidence
and economic value of health impacts from short-term exposure to ozone and PM2.5
during these periods.
Overall, the no building electrification scenario had a larger and more widespread
impact on ozone than the high building electrification scenario because of the larger
reduction of HDV emissions. However, the high building electrification scenario had
larger reductions in PM2.5, especially during the winter episode. This impact on PM2.5
follows from secondary effects from building NOx emissions. The scenarios are not
directly comparable in that emission reductions from buildings and HDV are not
equivalent in scope, that is, a larger penetration of electrification is assumed in
buildings relative to alternative measures assumed for HDV.
Health savings for the three alternative scenarios as a result of air quality improvements
relative to the reference scenario are shown in Table 3 below. While health savings are
similar between the high building electrification and no building electrification scenarios
for the summer episode, there are larger health savings in the high building
electrification scenario for the winter episode because of the larger impact on PM2.5
during the winter. While both building electrification and truck measures lead to air
quality improvements and health savings, the highest benefits are achieved when the
measures are combined.
DRAFT – DO NOT CITE OR QUOTE
49
Table 3: Mean Health Savings for Air Quality Improvements Estimated for Summer and Winter Episodes in 2050
Episode
Mean health
savings
High Building
Electrification
Mean health
savings
No Building
Electrification
Mean health savings
High Building
Electrification With
Trucks
Summer $202 $202 $261
Winter $190 $166 $249
Mean health savings in million $/episode.
Source: UCI APEP
While annual health savings cannot be estimated from the episodic modeling method
used in this study, the use of long-term exposure PM2.5 health impact functions like
those used in a recent analysis of air quality impacts from electrification in California27
would lead to substantially higher health benefits. The full draft air quality impacts
assessment by UCI can be found in Appendix F, which will also be released in a
companion CEC report.
Other studies have investigated the impacts of natural gas cooking on indoor air quality
(Logue et al., 2013) and the impact of gas appliances more generally on indoor air
quality (Mullen, 2012). Logue et al. (2013) conclude that using natural gas cook stoves
without venting range hoods can expose a substantial proportion of residents to
pollutant concentrations that exceed health-based standards and guidelines for outdoor
air quality. Logue uses simulated results to evaluate only emissions from natural gas
combustion, not emissions from cooking food. While Logue concludes that indoor air
pollution from natural gas cooking burners can be reduced, but not eliminated, through
the use of current venting range hoods, Mullen’s empirical results showed no statistical
association between the use of a kitchen exhaust fan and pollutant concentrations in
California homes.
27 Alexander et al. 2019. Air Quality Implications of an Energy Scenario for California Using High Levels
of Electrification. California Energy Commission. Publication Number: CEC-500-2019-049.
DRAFT – DO NOT CITE OR QUOTE
50
CHAPTER 4: Implications for Natural Gas Customers
This chapter explores the customer energy rate and bill impacts of the PATHWAYS
scenarios described in Chapter 3. It examines the effects of those scenarios on
customers who electrify their homes and businesses and those who do not. This
distinction is particularly important from an energy equity and environmental justice
perspective. While some customers may prefer to continue to use gas even if it
becomes more expensive than electricity over time, other customers may not be able to
electrify. For instance, low-income customers have more limited access to capital and
may not be able to afford the upfront costs associated with a building retrofit (Scavo et
al 2016). Renters do not own their buildings, so they typically have little to no say about
what types of equipment are installed in their homes and businesses.
To assess the energy equity and energy bill effects of different low-carbon scenarios,
the research team developed a representation of the revenue requirements of
California’s natural gas distribution utilities. That analysis, paired with scenarios of gas
throughput and pipeline composition from PATHWAYS, allowed estimates of gas rates
and bills for each scenario through 2050.
California’s Energy Cost Challenge California’s electric and natural gas systems face daunting cost challenges. A common
driver of increasing costs among electric and natural gas utilities are recent safety-
related incidents. Incidents like the San Bruno gas pipeline explosion and Aliso Canyon
gas storage field leak have spurred renewed investment in the state’s gas
infrastructure. The state’s electric system also faces increasing costs following a series
of catastrophic wildfires attributed to ignitions from electric infrastructure. These fires
put upward pressure on electric utility rates because of expected damages owed to
victims of the fires, a portion of which will be passed onto ratepayers, and utility costs
associated with reducing future wildfire risks.
The cost impacts of safety-related investments are already being felt. Gas utilities in
California are in the midst of large safety-related investments, and those investments
are expected to increase gas rates over the next three years. PG&E has requested an
increase of 15 percent for its gas revenue requirement, and a recent decision in SCG’s
rate case will increase that utility’s revenue requirement by 25 percent ($2018 real)
from 2018 to 2022. (PG&E 2018, CPUC 2019).
The extent and duration of wildfire-related electric system cost increases are not yet
known. However, California’s investor-owned electric utilities have proposed substantial
increases in their cost of capital in response to the large liabilities wildfires present to
their systems under the state’s current liability standards (PG&E 2019, SCE 2019).
DRAFT – DO NOT CITE OR QUOTE
51
Utilities have also begun to implement the set of operational expenditures and
investments required to reduce the risk of wildfires associated with their systems. These
expenditures will increase the cost of serving the state’s electric loads, although the
extent and duration of those cost increases, and how they will be allocated among
electric customers, are not yet known.
The Financial Structure of the California Gas System Today The California Public Utilities Commission regulates natural gas utilities in California. Gas
utilities file their planned revenue requirement and rates on three-year intervals and are
allowed the opportunity to earn a fair return on their investment in return for safe,
reliable gas service to their customers. The gas utility revenue requirement covers the
infrastructure and operational costs associated with delivering gas to homes and
businesses in California, not the commodity cost of natural gas itself.
To evaluate the financial implications of decreased throughput on California gas utilities,
the research team developed a gas revenue requirement model for PG&E and
SoCalGas. The revenue requirement model captures the set of operational and
investment expenses associated with delivering gas through those utilities’ systems. The
revenue requirement model developed by the research team is benchmarked to each
utility’s most recent general rate case (GRC) filed with the CPUC.28 PG&E and SoCal Gas
comprise roughly 94 percent of gas utility throughput in California. After combining
those two utilities’ revenue requirements and scaling by their proportion of total
statewide gas utility load, this analysis estimates that the gas utility revenue
requirement in California is $7 billion in 2019. Operational costs are just over half the
statewide gas revenue requirement, while costs related to capital expenditures are
responsible for most of the remainder. Those costs include annual depreciation
expenses, payments to holders of debt, equity returns and taxes (Figure 17).
Importantly, the utility financial data obtained from these regulatory filings do not
readily distinguish between costs to provide and maintain gas service to new gas
interconnections and costs to maintain and operate the existing gas system. As such,
the E3 gas revenue requirement model is not designed to explicitly estimate the gas
system cost savings from, for example, all-electric new construction. Rather, the tool is
designed to test broad scenarios around what the effect on gas revenue requirements
and rates would look if a reduction in total gas system expenditures were achieved.
28 The research team relied on the following regulatory filings to build and benchmark the revenue
requirement models: PG&E GCAP 2018, PG&E GRC 2020, PG&E GTS 2019, SCG TCAP 2020, SCG GRC
2019, SCG 2017 PSEP Forecast Application, SCG PSEP Forecast application.
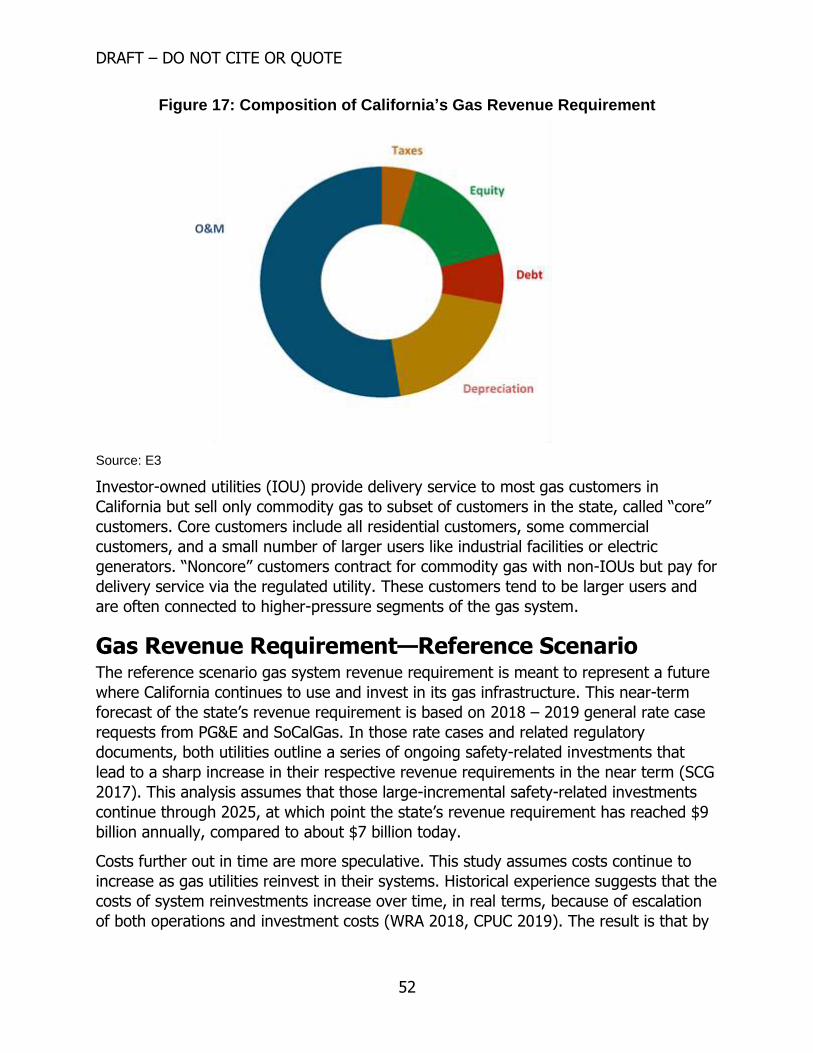
DRAFT – DO NOT CITE OR QUOTE
52
Figure 17: Composition of California’s Gas Revenue Requirement
Source: E3
Investor-owned utilities (IOU) provide delivery service to most gas customers in
California but sell only commodity gas to subset of customers in the state, called “core”
customers. Core customers include all residential customers, some commercial
customers, and a small number of larger users like industrial facilities or electric
generators. “Noncore” customers contract for commodity gas with non-IOUs but pay for
delivery service via the regulated utility. These customers tend to be larger users and
are often connected to higher-pressure segments of the gas system.
Gas Revenue Requirement—Reference Scenario The reference scenario gas system revenue requirement is meant to represent a future
where California continues to use and invest in its gas infrastructure. This near-term
forecast of the state’s revenue requirement is based on 2018 – 2019 general rate case
requests from PG&E and SoCalGas. In those rate cases and related regulatory
documents, both utilities outline a series of ongoing safety-related investments that
lead to a sharp increase in their respective revenue requirements in the near term (SCG
2017). This analysis assumes that those large-incremental safety-related investments
continue through 2025, at which point the state’s revenue requirement has reached $9
billion annually, compared to about $7 billion today.
Costs further out in time are more speculative. This study assumes costs continue to
increase as gas utilities reinvest in their systems. Historical experience suggests that the
costs of system reinvestments increase over time, in real terms, because of escalation
of both operations and investment costs (WRA 2018, CPUC 2019). The result is that by
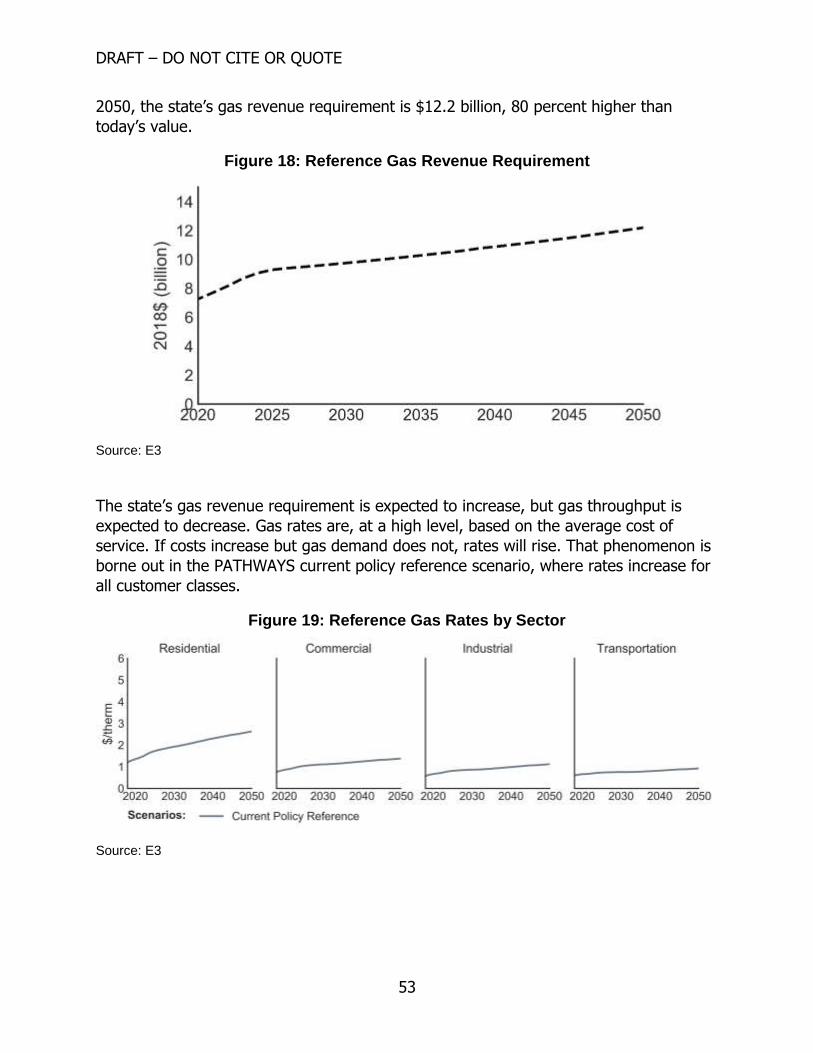
DRAFT – DO NOT CITE OR QUOTE
53
2050, the state’s gas revenue requirement is $12.2 billion, 80 percent higher than
today’s value.
Figure 18: Reference Gas Revenue Requirement
Source: E3
The state’s gas revenue requirement is expected to increase, but gas throughput is
expected to decrease. Gas rates are, at a high level, based on the average cost of
service. If costs increase but gas demand does not, rates will rise. That phenomenon is
borne out in the PATHWAYS current policy reference scenario, where rates increase for
all customer classes.
Figure 19: Reference Gas Rates by Sector
Source: E3

DRAFT – DO NOT CITE OR QUOTE
54
Costs of the Gas System in Mitigation Scenarios California’s gas system faces transformations in all scenarios that achieve an 80 percent
reduction of GHGs from 1990 levels by 2050. Those changes include decreased
throughput and a shift in the composition of commodity gas flowing through the
system.
Gas Commodity Costs
The composition of gas changes in California as a share of natural gas in each scenario
is replaced with either climate-neutral methane or renewable hydrogen. Those fuels
carry incremental costs above natural gas, so the blended cost of the commodity
flowing through the gas system will increase over time as well. As discussed in Chapter
3, the rank order of climate-neutral pipeline gases from least to most costly is
biomethane, hydrogen, and SNG. All mitigation scenarios blend biomethane into the
pipeline. Where the mitigation scenarios differ is in the associated use of the more
expensive hydrogen and SNG commodities. The high building electrification scenario
does not require these electrolytic fuels to meet the state’s 80 percent reduction by
2050 (80 x 50) climate target. In contrast, the no building electrification scenario has
higher gas system throughput. As a result, SNG and hydrogen are used in this scenario
to reduce emissions from gas use enough to meet the state’s 80 x 50 climate target.
Figure 20: Pipeline Gas Demand and Fuel Blend (Million Therms)
Source: E3
The use of hydrogen and SNG in the no building electrification scenario leads to a
pipeline gas commodity cost that is four to seven times higher than today in 2050.
Where commodity natural gas costs less than $0.4 per therm today, by 2050, the
blended pipeline commodity cost is between $1.4 and $2.4 per therm in the no building
electrification scenario. The high building electrification scenario sees a more moderate
gas commodity cost increase ending with a 2050 cost of $0.75 per therm.

DRAFT – DO NOT CITE OR QUOTE
55
Figure 21: Blended Commodity Cost by Scenario
Notes: “Conservative” and “Optimistic” refer to the respective P2G cost scenarios.
Source: E3
Gas System Revenue Requirement and Cost Recovery
As long as California’s gas system is being used, that system will require continued
reinvestment to ensure safe and reliable service. California’s gas system has many
components, ranging from interstate pipelines to the distribution laterals that connect
homes and businesses to gas supply. For the gas revenue requirement analysis, the
research team separated the gas system into two segments:
1. Transmission and underground storage: The gas transmission system is used to
transport gas from each utility’s citygate (that is, the connection to the interstate
gas pipeline system29) to load centers. Underground storage is used to ensure a
sufficient quantity of natural gas is available in the state during periods of high
load. The gas storage system also plays an important role in hedging commodity
gas costs.
2. Distribution: The distribution system delivers gas from the transmission and
underground storage systems to end users. It has the largest footprint of any
portion of the system. For instance, PG&E has more than 42,000 miles of
distribution pipeline compared to 6,400 miles of transmission pipeline (PG&E
2019b).
29 This study assumes that costs associated with the interstate pipeline system are captured in the basis
differential (the gas price difference between regions) incorporated in EIA natural gas commodity cost
forecasts. An examination of how that basis differential could change under lower levels of gas
throughput nationally is beyond the scope of this analysis.
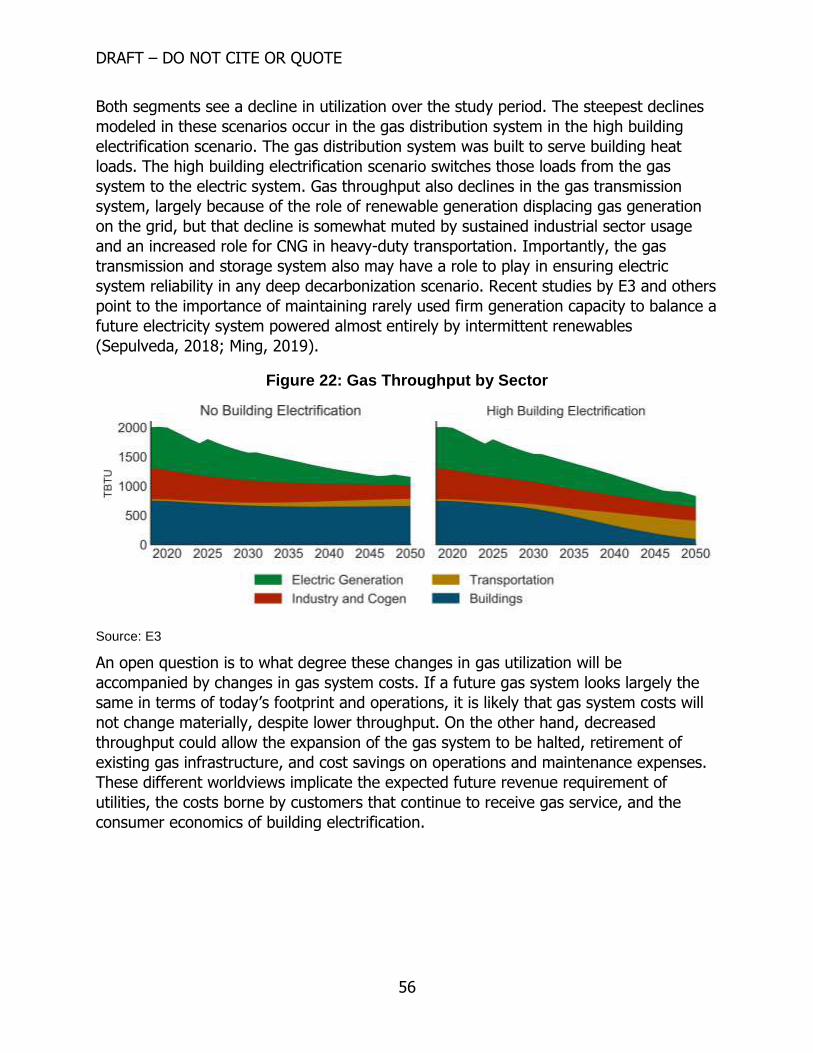
DRAFT – DO NOT CITE OR QUOTE
56
Both segments see a decline in utilization over the study period. The steepest declines
modeled in these scenarios occur in the gas distribution system in the high building
electrification scenario. The gas distribution system was built to serve building heat
loads. The high building electrification scenario switches those loads from the gas
system to the electric system. Gas throughput also declines in the gas transmission
system, largely because of the role of renewable generation displacing gas generation
on the grid, but that decline is somewhat muted by sustained industrial sector usage
and an increased role for CNG in heavy-duty transportation. Importantly, the gas
transmission and storage system also may have a role to play in ensuring electric
system reliability in any deep decarbonization scenario. Recent studies by E3 and others
point to the importance of maintaining rarely used firm generation capacity to balance a
future electricity system powered almost entirely by intermittent renewables
(Sepulveda, 2018; Ming, 2019).
Figure 22: Gas Throughput by Sector
Source: E3
An open question is to what degree these changes in gas utilization will be
accompanied by changes in gas system costs. If a future gas system looks largely the
same in terms of today’s footprint and operations, it is likely that gas system costs will
not change materially, despite lower throughput. On the other hand, decreased
throughput could allow the expansion of the gas system to be halted, retirement of
existing gas infrastructure, and cost savings on operations and maintenance expenses.
These different worldviews implicate the expected future revenue requirement of
utilities, the costs borne by customers that continue to receive gas service, and the
consumer economics of building electrification.
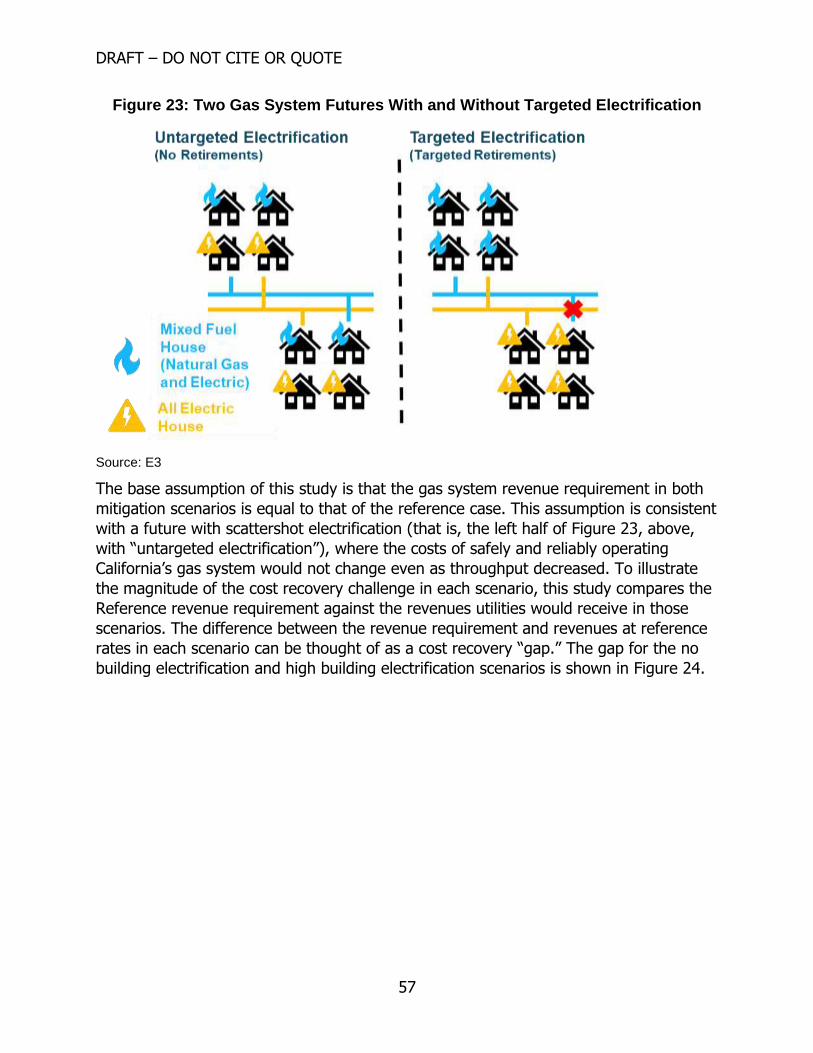
DRAFT – DO NOT CITE OR QUOTE
57
Figure 23: Two Gas System Futures With and Without Targeted Electrification
Source: E3
The base assumption of this study is that the gas system revenue requirement in both
mitigation scenarios is equal to that of the reference case. This assumption is consistent
with a future with scattershot electrification (that is, the left half of Figure 23, above,
with “untargeted electrification”), where the costs of safely and reliably operating
California’s gas system would not change even as throughput decreased. To illustrate
the magnitude of the cost recovery challenge in each scenario, this study compares the
Reference revenue requirement against the revenues utilities would receive in those
scenarios. The difference between the revenue requirement and revenues at reference
rates in each scenario can be thought of as a cost recovery “gap.” The gap for the no
building electrification and high building electrification scenarios is shown in Figure 24.
DRAFT – DO NOT CITE OR QUOTE
58
Figure 24: Gas System Revenues in Mitigation Scenarios Assuming Reference Rates
Source: E3
The default approach to close a gap between a utility’s revenue requirement and its
expected revenues is to increase customer rates. Gas delivery rates increase in both
mitigation scenarios for all end users. Gas delivery rates increase above the reference
scenario in the no building electrification and high building electrification mitigation
scenarios. These rate increases stem from a combination of increasing costs and
decreasing utilization. The largest decrease in gas system utilization occurs in the high
building electrification scenario. In that case, increasing gas system costs are paid for
by a rapidly shrinking set of customers. The results are rates that increase by 80
percent by 2030 and 480 percent by 2050).
Figure 25: Percentage Increase Relative to 2019 in Gas Sector Revenue Requirement, Loads, and Average Rates
Source: E3

DRAFT – DO NOT CITE OR QUOTE
59
However, rate increases are most marked for residential customers in the high building
electrification scenario. This outcome follows from how gas system costs are allocated
to customers. Recall that the California’s gas distribution system was built to serve
largely building heating loads. Large users—like those in the industrial sector—typically
do not receive distribution-level service. As a result, residential and (to a lesser extent)
commercial customers pay for the bulk of the distribution system, and the distribution
system is the most expensive segment of California’s gas infrastructure (Figure 26).
Figure 26: Estimated 2019 Gas System Revenues by Customer Type and System Segment
Source: E3
The average retail rate each customer class will pay includes commodity and delivery
charges. Both elements of gas rates increase in both mitigation scenarios. The no
building electrification sees larger increases in the commodity cost of gas due to a
higher blend of RNG. The high building electrification scenario sees a larger increase in
the delivery charge because of decreasing utilization. The result is that the scenarios
have different rates by customer class. The sectoral rate impacts of these scenarios are
a function of the composition of the rates of those sectors. Delivery chargers are a large
portion of residential rates, while commodity charges are a large portion of industrial
customers’ rates. The result is that residential gas rates increase more in the high
building electrification scenario, and industrial rates increase more in the no building
electrification scenario.
DRAFT – DO NOT CITE OR QUOTE
60
Figure 27: Gas Rates by Sector in the High Building Electrification Scenario
Source: E3
Figure 28: Gas Rates by Sector in the No Building Electrification Scenario
Notes: “Conservative” and “Optimistic” refer to the respective P2G cost scenarios.
Source: E3
Electric Sector Rates
The electric sector is pivotal to enabling economywide decarbonization in all mitigation
scenarios. Electrification-driven load growth increases annual on-grid electric loads by
24 percent in the no building electrification scenario and 43 percent in the high building
electrification scenario. Furthermore, these new electric loads offer the possibility of
providing flexibility to the grid, which could help reduce the cost of decarbonized
electricity.
Like the California gas system, the state’s electric system can also be expected to incur
substantial new costs through 2050. These costs are driven by three main factors: 1)
electrification-driven load growth, 2) large additions of new zero-emission electric
supply resources and the storage necessary to integrate them, and 3) wildfire-related
costs. The former two cost drivers are direct outputs of the PATHWAYS model. In
PATHWAYS, load growth and electric power supply decarbonization lead to between a
52 to a 71 percent increase in the state’s revenue requirement, depending on scenario.
DRAFT – DO NOT CITE OR QUOTE
61
The exact magnitude and duration of wildfire-related costs are less certain. To account
for those increases, the research team developed a “wildfire cost” sensitivity case. To
do so, researchers used PG&E’s filing to collect wildfire-related costs over its next
general rate case cycle (A. 18-12-009). If approved, those additional costs would
increase PG&E’s electricity rates 22 percent by 2022, though it is possible additional
cost increases will be incurred beyond that period. Like the gas system, increases in
wildfire safety-related investments are assumed to attenuate by 2025, at which point
they remain steady through 2050. An important caveat of this approach is that using
PG&E costs may bias upward the near-term rate increases that can be expected
statewide because PG&E has a larger share of its service territory in “high-risk
exposure” areas of California than other utilities in the state (Wildfire Strike Force
2019). Furthermore, the assumption that all costs related to wildfires will be borne by
ratepayers, and that those costs will be assessed on a purely volumetric basis, may not
hold in practice.
Despite those incremental costs, electric rate increases are relatively muted compared
to those seen in the gas system. Absent wildfire costs, electric rates remain almost flat
in near term and increase to 20 percent above today’s rates by 2050. In the wildfire
cost sensitivity, electric rates exhibit a marked near-term increase to 40 percent above
today’s rates but stabilize post-2030. In both cases, electric rates exhibit long-run
stability because the state’s rising electric revenue requirement is partially paid for by
new electrification loads
Figure 29: Percentage Increase in Electric Sector Revenue Requirement, On-Grid Loads and Average Rates
Source: E3
Residential Bills
To identify those potential utility bill impacts of these long-term, low-carbon scenarios,
the research team developed an indicative residential bill impact analysis based on
average rates. This analysis is intended to show directional changes over time between
electric and gas customers, recognizing that there is wide variation among homes

DRAFT – DO NOT CITE OR QUOTE
62
reflecting home type, home vintage, climate, utility, and rate design (as illustrated in
Mahone 2019).
The residential customer bill impact analysis compares “mixed-fuel” IOU customers
(buildings that use both gas and electricity) against “all-electric” IOU customers that
have electrified their appliances. Specifically, mixed-fuel customers are defined as
homes that have gas furnaces, water heaters, stoves, and clothes dryers and use
electricity for all other uses in the home. All-electric customers are defined as those
with homes that have electrified those four appliances.
This study finds that all-electric low-rise residential customers are likely to see lower
total utility bills, on average, post-2030. In the near term, mixed-fuel customers are
likely to see slightly lower utility bills than all-electric customers on average. This cost
advantage erodes over time in both mitigation scenarios as an increasing share of more
expensive biomethane is blended into the pipeline and gas delivery charges increase for
the reasons discussed above. Between 2025 and 2030, depending on wildfire mitigation
costs, the monthly utility bills of mixed-fuel customers increase above those of all-
electric customers in both mitigation scenarios. Of course, energy consumption and
utility bills vary widely by building and climate zone, so there is a wide range of
potential utility bill outcomes across the building stock in the state.
No Building Electrification
Utility bills in the no building electrification scenario increase over time because of a
combination of decreased gas system throughput and an increasing share of costly
electrolytic fuels that are blended into the pipeline (Figure 30). As a result, by 2040, a
typical mixed-fuel customer could pay between $35 to $50 more per month than a
typical all-electric customer in this scenario.
The largest impact of the wildfire cost sensitivity is to push out in time the point at
which a typical all-electric home sees bill savings relative to a mixed-fuel home. In the
base electricity cost case that crossover occurs in 2025, while in the wildfire sensitivity
electricity costs case, that point is 2030.
Residential customers may still find cost savings from electrifying a subset of their
appliances before cost savings would occur from electrifying their entire homes or
businesses. For instance, this analysis finds that typical single-family residential IOU
customers save from $6 to $12 per month on their utility bills in 2025 when adopting a
heat pump HVAC system. Given the bill savings available, economic electrification of
HVAC systems could become a particularly advantageous strategy for customers with
air conditioning. Customers with air conditioning generally already have the wiring,
ducting, and electrical panel capacity required to install an electric heat pump with low
to no retrofit costs. Heat pumps provide heating and air conditioning, allowing a single
piece of equipment to replace a traditional furnace and air-conditioning unit. In fact, the
cost of installing a heat pump may be less than the combined cost of the two separate
pieces of HVAC equipment it replaces. That hypothesis has been supported by recent
DRAFT – DO NOT CITE OR QUOTE
63
studies by E3 and others that find HVAC electrification to be economical at today’s gas
rates for a sizeable number of residential customers in California (Mahone et al 2018,
Bilimoria et al 2019 2018, Hopkins et al 2018).
Figure 30: Consumer Bills in the No Building Electrification Scenario
Notes: The range for the mixed-fuel home depicts a range of bill impacts between the optimistic
and conservative P2G commodity cost ranges. The no building electrification scenario assumes
no economic electrification and reaches a pipeline blend of 44 percent RNG and 56 percent fossil
NG by 2050; economic or policy-driven electrification or higher blends of RNG would increase
mixed-fuel bills.
Source: E3
Each customer that electrifies some or all their heating equipment decreases the use of
the gas system and increases the cost of service for remaining gas customers. As gas
rates increase, the economics of electrification will improve for additional segments of
residential and commercial customers. The dynamics of such a feedback loop will
depend on the relative cost of pipeline gas and electricity, the relative cost of gas and
electric end-use equipment and other factors ranging from consumer preferences to
builder practices. The potential for a feedback loop is particularly important when
considering relative risks and plausibility of the two mitigation scenarios examined in
this analysis.
High Building Electrification
The high building electrification scenario presents customer challenges and potential
instabilities. The customer rate and bill impacts seen in that scenario would represent a
cost imposition on households that continue to use gas. Those cost impacts are
particularly concerning for low-income consumers who are less likely to be able to
afford the upfront investments required to adopt electric technologies and are more
likely to be renters.

DRAFT – DO NOT CITE OR QUOTE
64
Figure 31: Consumer Bills in the High Building Electrification Scenario
Notes: The high building electrification scenario assumes no cost savings from retirement of gas
infrastructure and maintains the reference level of gas revenue requirement (excluding
commodity costs) through 2050.
Source: E3
Absent policy intervention, the rate increases seen in the high building electrification
scenario are unlikely to be consistent with financially stable gas utilities. Utilities raise
capital from debt and equity markets on the expectation of future revenues from a
customer base that is, at minimum, stable. In the high building electrification scenario,
the number of gas customers in the state decreases. Those customer exits accelerate
over time, leading to the rapid rate increases seen above. Those rate increases follow
from the assumption that all gas system costs continue to be recovered from gas
ratepayers. If that assumption does not hold, then some or all of the gap between
expected customer revenues and gas utility revenue requirements will need to be filled
to maintain safe operation of the remaining gas system.
Bill Impacts Comparison and Conclusions
With those bill savings and the recent work on the economics of building electrification
in mind, the research team concludes that the no building electrification scenario is
unlikely to represent a stable, internally consistent future. A world in which increasing
quantities of RNG are blended into the pipeline will lead to steady improvements in the
economics of building electrification. So long as the state is on track to meet its climate
targets, building electrification is likely to take hold. Given that conclusion, the
remainder of this report will focus on the challenges of implementing a structured
transition toward a largely electrified building stock in California.
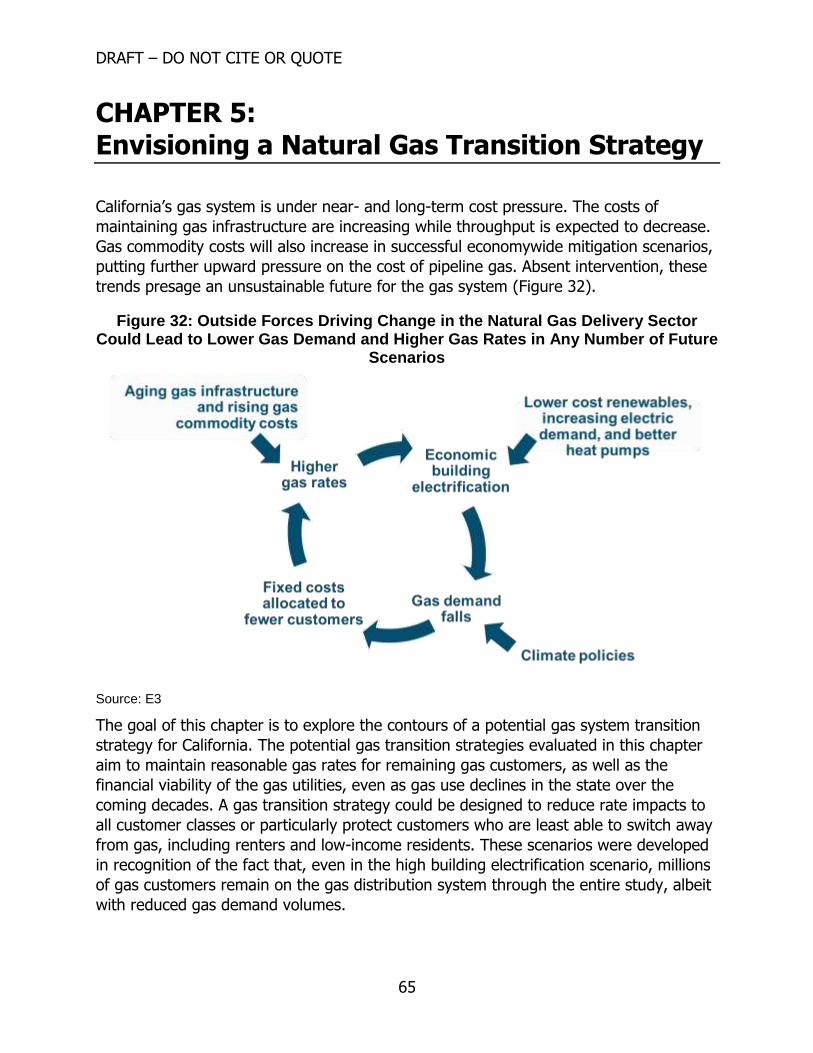
DRAFT – DO NOT CITE OR QUOTE
65
CHAPTER 5: Envisioning a Natural Gas Transition Strategy
California’s gas system is under near- and long-term cost pressure. The costs of
maintaining gas infrastructure are increasing while throughput is expected to decrease.
Gas commodity costs will also increase in successful economywide mitigation scenarios,
putting further upward pressure on the cost of pipeline gas. Absent intervention, these
trends presage an unsustainable future for the gas system (Figure 32).
Figure 32: Outside Forces Driving Change in the Natural Gas Delivery Sector Could Lead to Lower Gas Demand and Higher Gas Rates in Any Number of Future
Scenarios
Source: E3
The goal of this chapter is to explore the contours of a potential gas system transition
strategy for California. The potential gas transition strategies evaluated in this chapter
aim to maintain reasonable gas rates for remaining gas customers, as well as the
financial viability of the gas utilities, even as gas use declines in the state over the
coming decades. A gas transition strategy could be designed to reduce rate impacts to
all customer classes or particularly protect customers who are least able to switch away
from gas, including renters and low-income residents. These scenarios were developed
in recognition of the fact that, even in the high building electrification scenario, millions
of gas customers remain on the gas distribution system through the entire study, albeit
with reduced gas demand volumes.
DRAFT – DO NOT CITE OR QUOTE
66
In that context, maintaining reasonable gas rates becomes imperative because of the
substantial equity concerns that could follow from a world in which the wealthy are
more likely to be able to electrify, or to afford paying higher gas costs if they do not,
but low- and middle-income households are less able to do so.
Furthermore, the operation of a safe gas system will require continued reinvestment
and maintenance, even in scenarios with lower throughout. These scenarios evaluate a
future in which maintaining the financial viability of gas utilities is used to ensure that
these entities can continue to finance the ongoing operations and maintenance of this
system. Alternative operation and maintenance structures for the gas system are
conceivable, such as the creation of a state-owned enterprise. That and other legal and
legislative options for a more rapid transition are outside the scope of this study.
A comprehensive gas transition strategy, informed by a myriad of interested parties, is
needed. Such a strategy might include:
Efforts to reduce barriers to electrification. It is not a straightforward process for
even relatively motivated and well-resourced homeowners to install technologies
like electric heat pumps. Those interested run into issues like difficulty receiving
permits and contractors without heat pump installation experience. Market
transformation initiatives will be needed to lower the costs and barriers to
retrofits and make electrification an easy decision for homeowners.30 There will
also need to be initiatives in place to enable adoption of electric equipment for
low-income homeowners and renters, particularly given the relative vulnerability
of these groups to the bill impacts identified in Chapter 4.
Avoid gas system expansion. Gas system investments come with long lifetimes.
Making such investments in the context of declining throughput—an outcome
that occurs in all mitigation scenarios—will increase the average cost of gas
service. Unlike gas system retirements, a speculative measure at this point,
building communities without gas is a common practice in large portions of the
United States and world (Vivid Economics, 2017).
Reduce costs of the existing gas system. California’s gas system requires ongoing
reinvestment to ensure safe, reliable service. In recent years, the magnitude of
these reinvestments has increased as utilities have responded to high-profile
safety incidents. A key challenge in any gas transition will be to reduce the costs
of the existing gas system while still ensuring exacting standards of safety and
reliability are maintained. The research team hypothesized that geographically
targeted electrification and retirement of the gas system could be one potential
30 Senate Bill 1477 (Stern, Chapter 378) adopted in 2018 instructs state agencies to develop market
transformation programs for building decarbonization, and the CPUC has instituted rulemaking R.19-01-
011 on this topic, but rules were not finalized as of this writing.
DRAFT – DO NOT CITE OR QUOTE
67
strategy to achieve these reductions, though other measures (for example,
derating of pipes to lower pressures) may also be available.
Accelerated depreciation. Accelerated depreciation recovers investments over a
shorter period than the traditional useful lifetime. When paired with reduced gas
system expenditures, accelerated depreciation can further reduce the remaining
costs of the gas system toward midcentury. However, accelerated depreciation
will increase near-term gas rates and gas utility revenue collection. If it is not
combined with a reduction in gas system expenditures and a long-term gas
transition plan, accelerated depreciation may be counterproductive.
Changes to cost allocation. The gas distribution system was built to serve
building heating loads. As these loads decline, there could be justification to shift
a larger share of costs to customers that continue to use the gas system. Such
an approach would need to be balanced against competitiveness concerns that
follow from higher rates for remaining customer classes that use the gas system
(for example, industry).
Recover gas system costs on the bills of electric ratepayers. The gas distribution
system was built to serve demand from California homes and businesses. Utilities
raised funds to finance that system with the expectation of a fair opportunity to
recover their investments from a stable customer base. The plausibility of
recovering system costs for gas customers decreases as those customers exit the
gas system. It could be justifiable to collect some share of the gas system costs
from customers that exit the gas system and go all-electric. The potential equity
benefits of such an exit fee would need to be balanced against the potential for
such a fee to discourage beneficial electrification. An alternative approach could
be a competitive transition charge that is applied to the bills of all electricity
customers. This approach would allow costs to be spread out more evenly over
time but is less directly tied to the decision of a customer to exit and the amount
of gas system costs that were incurred on his or her behalf.
Additional funds from outside the gas system. Regulatory mechanisms to reduce
and reallocate gas system costs can reduce the rate and bill impacts of a gas
transition strategy. However, even under relatively aggressive assumptions about
the success of those mechanisms, a substantial cost challenge remains. One
option evaluated in this chapter examines the implications of infusing “additional
funds” to manage remaining costs. These funds could be derived from a variety
of sources (such as cap-and-trade revenues or the state general fund), though
this report does not try to specify a source for such additional funds.
Shut down uneconomic gas infrastructure built to serve building loads. In 2050,
there are still 2 million residential gas customers in the high building
electrification scenario. California’s gas system was built to serve more than 13
million residential customers. That imbalance only worsens beyond the 2050 time
DRAFT – DO NOT CITE OR QUOTE
68
horizon of this study. The high building electrification scenario assumes that the
last gas appliance is sold in 2040. Given the typical lifetimes of gas equipment,
this assumption means that, in a world with no early retirement of equipment,
the number of gas customers in California would approach zero toward the late
2050s. The PATHWAYS model assumes relatively smooth transitions between
gas and electric end uses, in part because it is so difficult to predict the timing
for more abrupt changes in customer behavior or energy system choices. That
said, there is likely a point between 2 million and 0 residential gas customers (or
perhaps before) where customers would abruptly leave the gas system for
economic reasons, even if meant early retirement of their gas equipment, and
there is a point when it would no longer be viable to operate much of the state’s
gas distribution system. In advance of that point, without knowing exactly when
that time will arrive, policy makers will need to consider what set of measures
are needed to shut down unused infrastructure.
Gas Transition Mechanisms Defining a complete gas transition strategy for California is beyond the scope of this or
any study. Instead, this analysis is meant to examine plausible impacts of a subset of
the policy and regulatory mechanisms that could fall within a broader transition plan.
The mechanisms examined target two key goals:
1. Reduce the cost of the gas system while ensuring reinvestment to ensure safety
and reliability
2. Equitably allocate the fixed costs of the gas system
Reduce the Costs of the Gas System
A fundamental challenge facing California’s gas system is that costs are expected to
increase, and throughput is expected to decrease. Chapter 4 outlined the adverse
consumer effects of this phenomenon assuming gas-system costs were equal to
business as usual and were collected entirely through rates. Those results are meant to
highlight the scale of the cost challenge facing the California gas system and associated
customers. Given those challenges, California’s energy policy and business community
will need to consider strategies to reduce the cost of the gas system.
A key premise of this analysis is that California’s gas system requires reinvestment to
ensure safety. Any strategy to reduce costs will need to be implemented with that
imperative in mind. Such reductions might be possible via a variety of mechanisms,
including:
Halting expansion of the gas system. Gas infrastructure is long-lived, with a
typical distribution main having a book life of between 50 and 65 years (PG&E
2018, SCG 2019). Adding new infrastructure increases the size of the gas system
financial obligation California will face in the future. Insofar as throughput
declines and customer exits can be expected, these additional obligations will
DRAFT – DO NOT CITE OR QUOTE
69
increase the cost of gas service for remaining gas customers, with all the
potential negative consumer equity implications outlined in Chapter 4. Avoiding
new infrastructure could help slow the growth of future financial obligations
without incurring any risk of declines in system safety or reliability.
Targeted retirement of the gas distribution system. California’s gas utilities spend
nearly $3.5 billion per year in operations and maintenance to ensure safe and
reliable gas service. That ongoing O&M expense is in addition to capital
reinvestments to replace aging infrastructure. A potential response to these
expenditures could be to reduce the overall footprint of the state’s gas
distribution system. Doing so would reduce the need to reinvest in, and
potentially reduce the O&M costs associated with, aging infrastructure. However,
this strategy is somewhat speculative, hinging on successful identification of
geographies that are ripe for retirement and successful targeting of electrification
efforts. That overlay is particularly important because early retirements of utility
infrastructure and consumer end-use equipment carries real economic costs.
Derating of infrastructure to reduce reinvestment and O&M costs. It may be
possible to reduce the cost of maintaining existing gas infrastructure if, for
instance, certain segments of the gas system could be operated at lower
pressures.
There are not sufficient data available at this time to allow precise modeling of each of
these mechanisms. Instead, this study models scenarios that stipulate a decrease in gas
system capital reinvestment and annual O&M. These scenarios are defined by two key
parameters.
1. Percentage reduction in annual capital expenditures. This analysis models the
amount of capital that needs to be reinvested as the previous year’s
depreciation, grossed-up by a real capital escalation factor of 1 percent per year.
The exact percentage chosen can be thought of as capturing either how sensitive
capital expenditures are to system utilization or how successfully a targeted gas
distribution program has been implemented.
2. The year in capital reinvestments that can start being reduced: This figure
represents how quickly a targeted electrification/targeted retirement program
can be ramped up. This study assumes that such a program would need to
achieve enough gas disconnections to avoid substantial early equipment
retirement costs.
Using those parameters, the research team defined three gas system cost reduction
scenarios (Table 4). These scenarios are meant to illustrate the effects of reduced gas
system expenditures. These cases are compared against a “no action” scenario where
the state’s gas revenue requirement is equal to the Reference scenario forecast.

DRAFT – DO NOT CITE OR QUOTE
70
Table 4: Gas Cost Reduction Scenarios
Retirement Scenario
Name
Year Reinvestments Are
Decreased
% Reinvestment
Avoided
Intensive Reductions 2030 50%
Moderate Reductions 2030 25%
Delayed Reductions 2040 50%
Source: E3
Figure 33 shows California’s gas revenue requirement in each of these scenarios.
Strikingly, even the most ambitious revenue requirement reduction scenario modeled,
the “intensive retirements” scenario, does not reduce the state’s gas system revenue
requirement below that of the current value. This result occurs for two reasons. First, as
discussed in Chapter 4, the state’s gas system revenue requirement is expected see a
marked near-term increase as utilities continue their safety-related upgrades to the
state’s gas system. By 2025, these investments increase the state’s revenue
requirement by more than one-third. The second reason is real escalation of gas capital
costs. This study assumes, based on historical indices of gas capital costs, 1 percent
real escalation of capital and operations and maintenance costs. The compounding
effect of this real cost escalation puts upward pressure on the reinvestment costs of the
gas system. Some of the growth assumed within that escalation rate could be offset by
avoiding expansion of the gas system.
Figure 33: Gas Cost Reduction Scenarios
Source: E3
DRAFT – DO NOT CITE OR QUOTE
71
The cost reduction scenarios modeled in this analysis are meant to represent a set of
plausible futures where the gas system revenue requirement can be reduced below the
no action baseline. Exactly what magnitude of cost decreases are achievable in practice
is not yet known. However, what this analysis does indicate is that even a very
aggressive set of cost-reduction measures can probably only mute—and certainly
cannot eliminate—the cost and equity challenges facing the state’s gas system. Further
measures are needed to ensure energy affordability and equity.
Equitably Allocate the Costs of the Gas System
The cost challenges facing the gas system result from declining throughput and
customer exits. The customer rates and residential bill impacts results presented above
reflect a world where gas system costs are allocated similarly to today. That means
residential customers continue to pay for the bulk of the gas distribution system,
depreciation schedules follow current assessments of the useful life of assets, and the
gas revenue requirement is recovered entirely via rates. However, current methods of
allocating gas system costs were designed for a world in which gas demand was
expanding in California. Current cost allocation methods may not be appropriate in a
world with rapidly decreasing gas demand.
Cost allocation changes could take different forms. Within the gas regulatory context,
costs could be shifted from customers that no longer use that system (that is,
residential) to customers that continue to use the system (that is, industrial). It could
also be advisable to shift costs within customer classes over time. For instance,
accelerated depreciation could allow long-term obligations to be paid for when a larger
share of customers continue to receive gas service. Finally, costs could be shifted
outside the gas system. Such a shift could be based on achieving procedural fairness
and equitable outcomes. This section examines several mechanisms to reallocate
remaining gas system costs.
Shift Cost Allocation Between Customer Classes
Today, gas delivery in California is allocated to customers based on their utilization of
the system. “Utilization” can be defined in a variety of ways but typically includes total
annual consumption and peak demands.31 For this analysis, researchers assumed that
transmission costs are allocated to customers based on their share of annual
throughput, while distribution costs are allocated based on the existing share of
revenue each customer class pays to that part of the system. In practice, distribution
costs are allocated based on peak demands, using either a peak-day or peak-month
method.
31 Peak demands are assessed based on daily and monthly consumption in the distribution system (SCG
TCAP 2019).
DRAFT – DO NOT CITE OR QUOTE
72
A key challenge with cost recovery in a future with high building electrification is that
throughput falls most rapidly in the gas distribution system. Further, those throughput
reductions occur in roughly equal proportion between the two primary users of the
distribution system, residential and commercial buildings. These reductions lead to
rapidly increasing costs for remaining gas distribution customers. A potential solution
could be to allocate distribution costs to a broader set of gas system customers. This
analysis models changes in gas cost allocation as a percentage shift from current
allocations of distribution costs toward a system throughput-based allocation. To
illustrate the effect of this cost reduction, it further models a scenario where the
percentage of distribution costs that are allocated based on throughput increase from 0
to 40 percent in 2050. Such a shift could reflect a different allocation of peak-day or
peak-month loads by customer classes.
Accelerated Depreciation
Accelerated depreciation shortens the period over which capital investments are
recovered. For instance, a utility asset with a baseline depreciation schedule of 20 years
could instead be collected over 10 years. In practice, this collection schedule would
effectively double the annual depreciation charge for that asset. This approach could be
justified for two key reasons. The first is that, as a matter of principle, depreciation
schedules are meant to reflect the useful life of an asset (Bilich et al 2018). In current
practice, the useful lives of assets are typically assessed based on a likely survivor curve
derived from historical experience. In the future, an empirical survivor curve is a less
accurate predictor of useful life than expected utilization over time. If utilization is
expected to decrease such that the asset is no longer used, then the associated useful
life could plausibly be considered shortened. A second reason to consider accelerated
deprecation is that it would effectively allow the fixed costs of the gas system to be
collected over a larger group of ratepayers. Accelerated depreciation would shift fixed-
cost recovery to periods before large-scale electrification and customer exits from the
gas system occur (Figure 34).
Exit Fees
The gas system was built with the expectation of a stable long-term customer base.
Customers that leave the gas system no longer contribute toward the fixed costs of
infrastructure that was built on their behalf. As shown above, this situation shifts those
fixed costs to remaining gas customers, with the associated rate bill effects and equity
concerns. A potential measure to address this issue could be to charge customers that
leave the gas system an exit fee. Such an exit fee could be collected either as a lump
sum or amortized over a longer time frame. This study assumes the latter approach
because it avoids adding a substantial upfront incremental cost that could slow
otherwise beneficial electrification. This approach is modeled as a $5-per-month exit fee
applied over a 15-year period, collecting a total of $900 per exiting customer. .
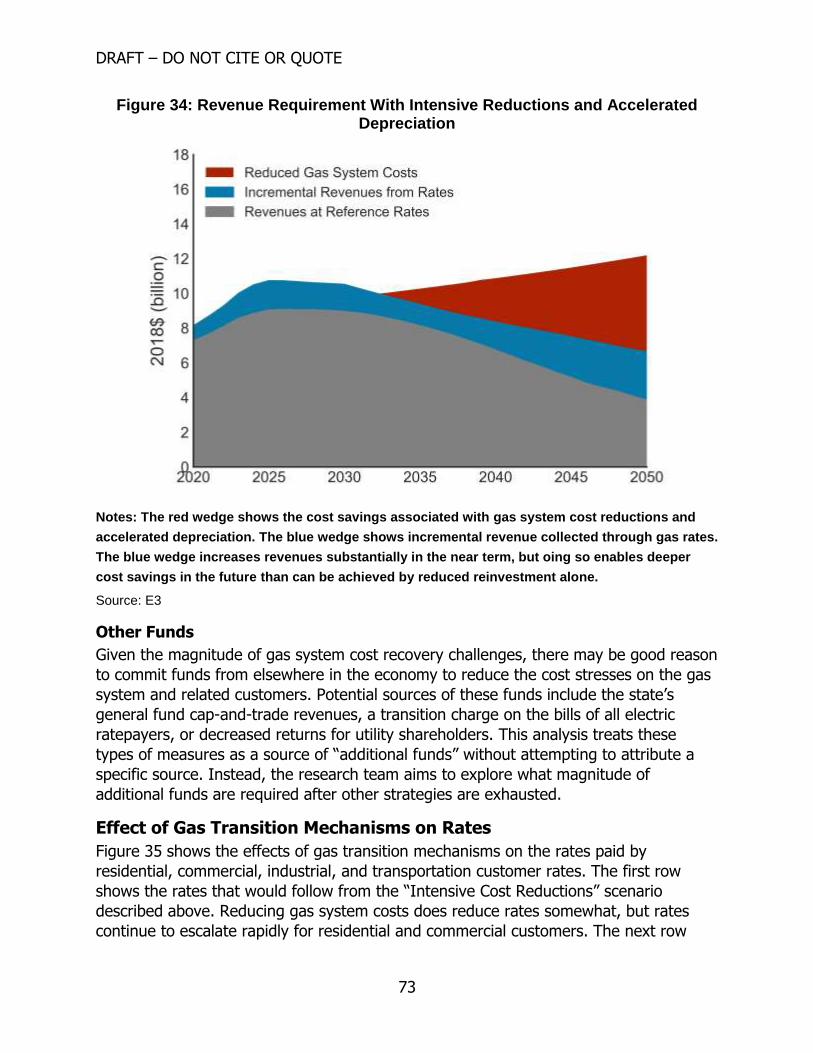
DRAFT – DO NOT CITE OR QUOTE
73
Figure 34: Revenue Requirement With Intensive Reductions and Accelerated Depreciation
Notes: The red wedge shows the cost savings associated with gas system cost reductions and
accelerated depreciation. The blue wedge shows incremental revenue collected through gas rates.
The blue wedge increases revenues substantially in the near term, but oing so enables deeper
cost savings in the future than can be achieved by reduced reinvestment alone.
Source: E3
Other Funds
Given the magnitude of gas system cost recovery challenges, there may be good reason
to commit funds from elsewhere in the economy to reduce the cost stresses on the gas
system and related customers. Potential sources of these funds include the state’s
general fund cap-and-trade revenues, a transition charge on the bills of all electric
ratepayers, or decreased returns for utility shareholders. This analysis treats these
types of measures as a source of “additional funds” without attempting to attribute a
specific source. Instead, the research team aims to explore what magnitude of
additional funds are required after other strategies are exhausted.
Effect of Gas Transition Mechanisms on Rates
Figure 35 shows the effects of gas transition mechanisms on the rates paid by
residential, commercial, industrial, and transportation customer rates. The first row
shows the rates that would follow from the “Intensive Cost Reductions” scenario
described above. Reducing gas system costs does reduce rates somewhat, but rates
continue to escalate rapidly for residential and commercial customers. The next row
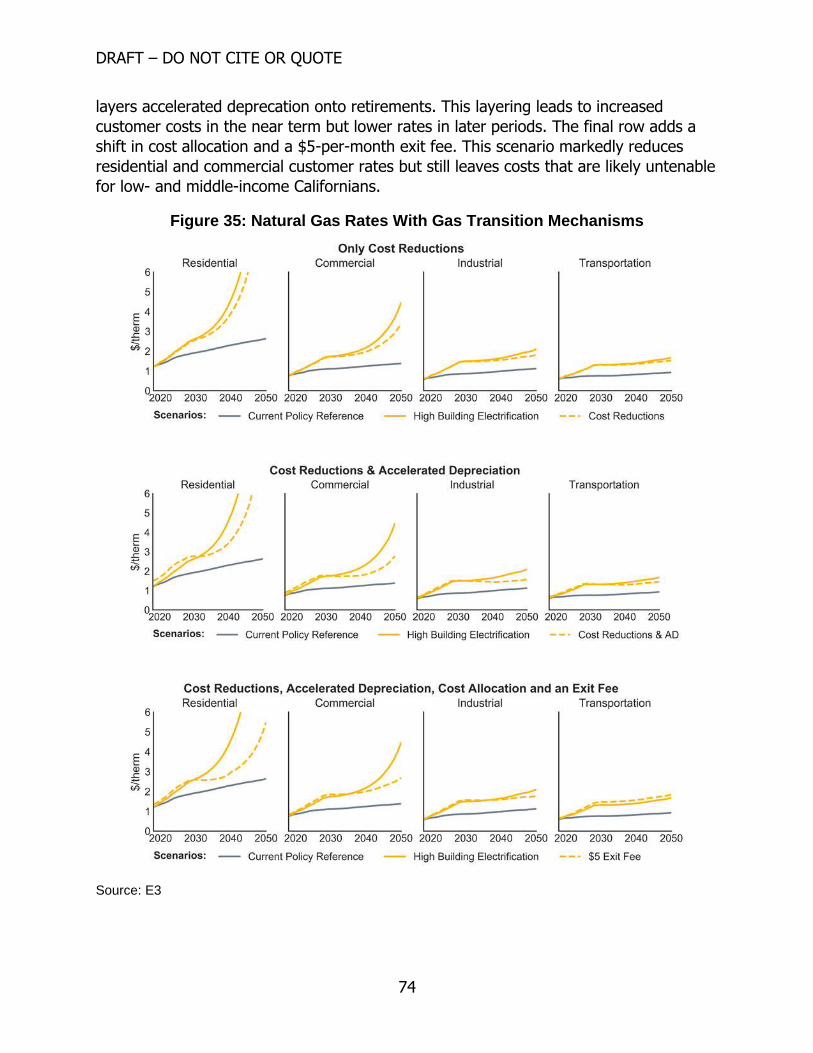
DRAFT – DO NOT CITE OR QUOTE
74
layers accelerated deprecation onto retirements. This layering leads to increased
customer costs in the near term but lower rates in later periods. The final row adds a
shift in cost allocation and a $5-per-month exit fee. This scenario markedly reduces
residential and commercial customer rates but still leaves costs that are likely untenable
for low- and middle-income Californians.
Figure 35: Natural Gas Rates With Gas Transition Mechanisms
Source: E3
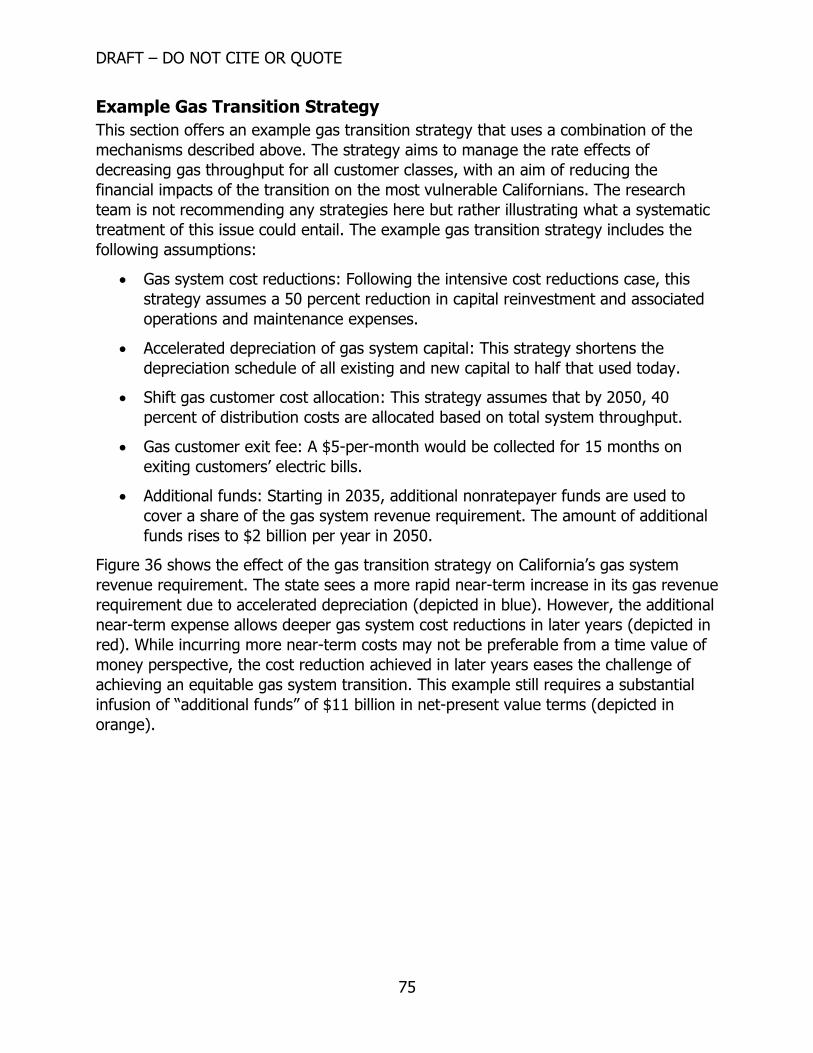
DRAFT – DO NOT CITE OR QUOTE
75
Example Gas Transition Strategy
This section offers an example gas transition strategy that uses a combination of the
mechanisms described above. The strategy aims to manage the rate effects of
decreasing gas throughput for all customer classes, with an aim of reducing the
financial impacts of the transition on the most vulnerable Californians. The research
team is not recommending any strategies here but rather illustrating what a systematic
treatment of this issue could entail. The example gas transition strategy includes the
following assumptions:
Gas system cost reductions: Following the intensive cost reductions case, this
strategy assumes a 50 percent reduction in capital reinvestment and associated
operations and maintenance expenses.
Accelerated depreciation of gas system capital: This strategy shortens the
depreciation schedule of all existing and new capital to half that used today.
Shift gas customer cost allocation: This strategy assumes that by 2050, 40
percent of distribution costs are allocated based on total system throughput.
Gas customer exit fee: A $5-per-month would be collected for 15 months on
exiting customers’ electric bills.
Additional funds: Starting in 2035, additional nonratepayer funds are used to
cover a share of the gas system revenue requirement. The amount of additional
funds rises to $2 billion per year in 2050.
Figure 36 shows the effect of the gas transition strategy on California’s gas system
revenue requirement. The state sees a more rapid near-term increase in its gas revenue
requirement due to accelerated depreciation (depicted in blue). However, the additional
near-term expense allows deeper gas system cost reductions in later years (depicted in
red). While incurring more near-term costs may not be preferable from a time value of
money perspective, the cost reduction achieved in later years eases the challenge of
achieving an equitable gas system transition. This example still requires a substantial
infusion of “additional funds” of $11 billion in net-present value terms (depicted in
orange).
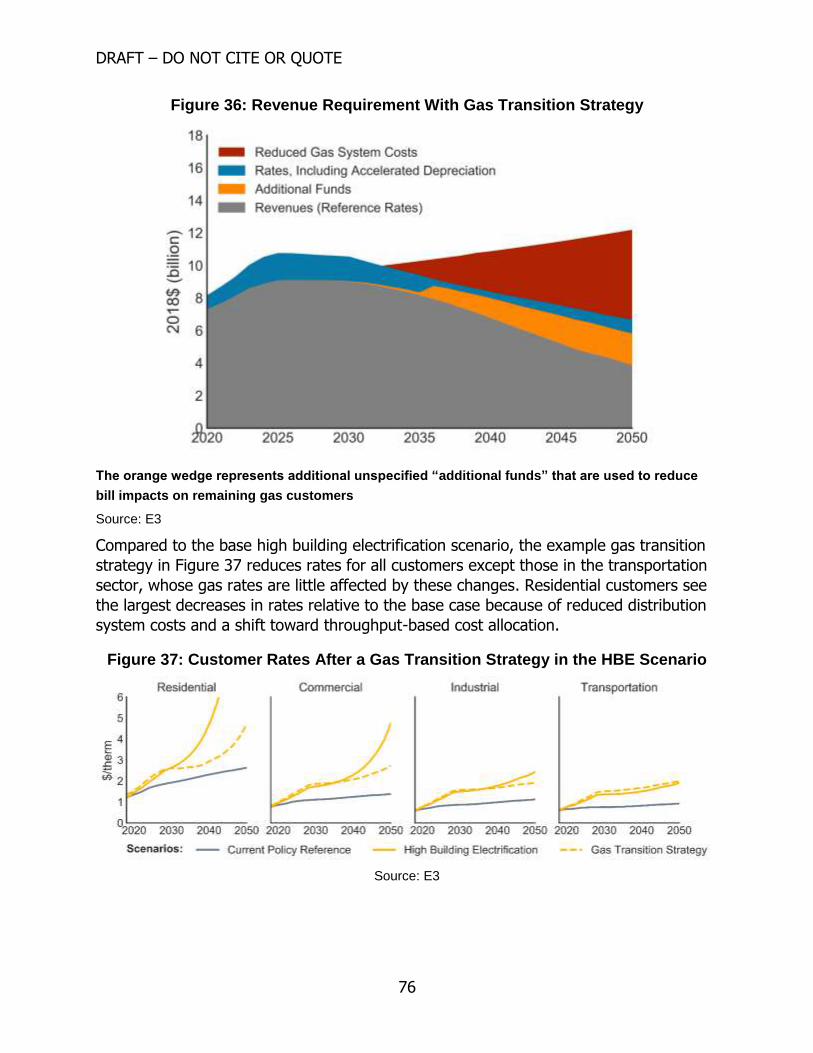
DRAFT – DO NOT CITE OR QUOTE
76
Figure 36: Revenue Requirement With Gas Transition Strategy
The orange wedge represents additional unspecified “additional funds” that are used to reduce
bill impacts on remaining gas customers
Source: E3
Compared to the base high building electrification scenario, the example gas transition
strategy in Figure 37 reduces rates for all customers except those in the transportation
sector, whose gas rates are little affected by these changes. Residential customers see
the largest decreases in rates relative to the base case because of reduced distribution
system costs and a shift toward throughput-based cost allocation.
Figure 37: Customer Rates After a Gas Transition Strategy in the HBE Scenario
Source: E3
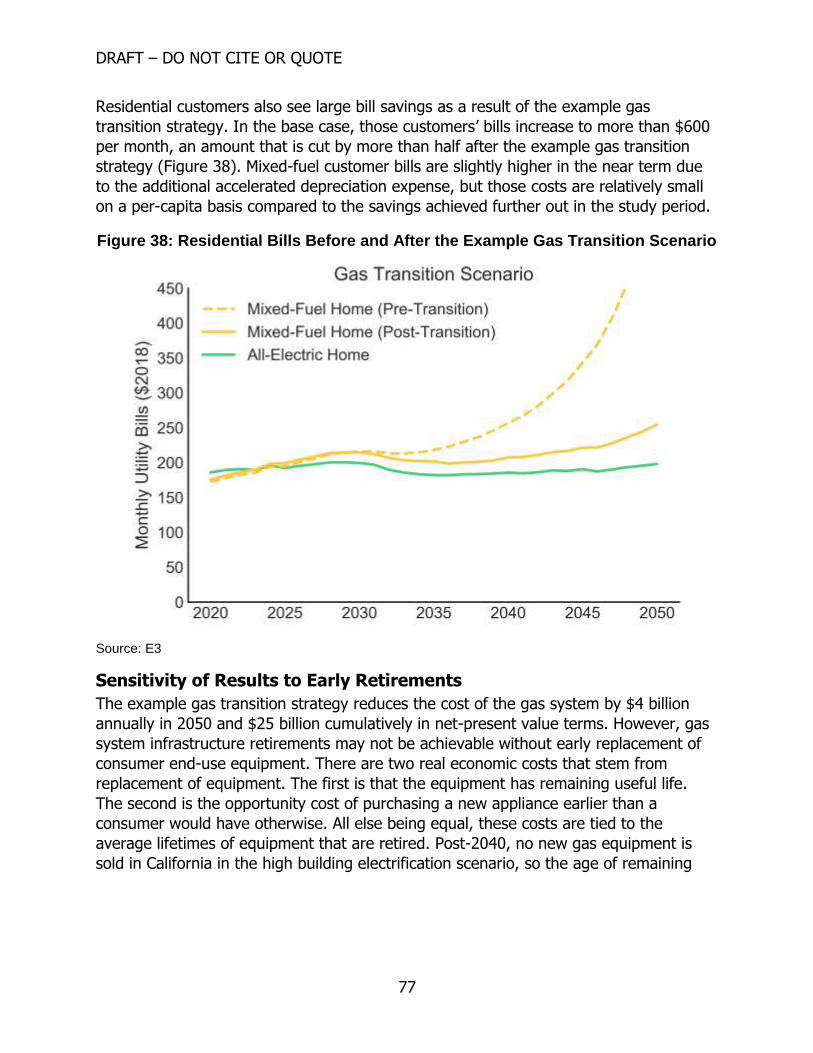
DRAFT – DO NOT CITE OR QUOTE
77
Residential customers also see large bill savings as a result of the example gas
transition strategy. In the base case, those customers’ bills increase to more than $600
per month, an amount that is cut by more than half after the example gas transition
strategy (Figure 38). Mixed-fuel customer bills are slightly higher in the near term due
to the additional accelerated depreciation expense, but those costs are relatively small
on a per-capita basis compared to the savings achieved further out in the study period.
Figure 38: Residential Bills Before and After the Example Gas Transition Scenario
Source: E3
Sensitivity of Results to Early Retirements
The example gas transition strategy reduces the cost of the gas system by $4 billion
annually in 2050 and $25 billion cumulatively in net-present value terms. However, gas
system infrastructure retirements may not be achievable without early replacement of
consumer end-use equipment. There are two real economic costs that stem from
replacement of equipment. The first is that the equipment has remaining useful life.
The second is the opportunity cost of purchasing a new appliance earlier than a
consumer would have otherwise. All else being equal, these costs are tied to the
average lifetimes of equipment that are retired. Post-2040, no new gas equipment is
sold in California in the high building electrification scenario, so the age of remaining
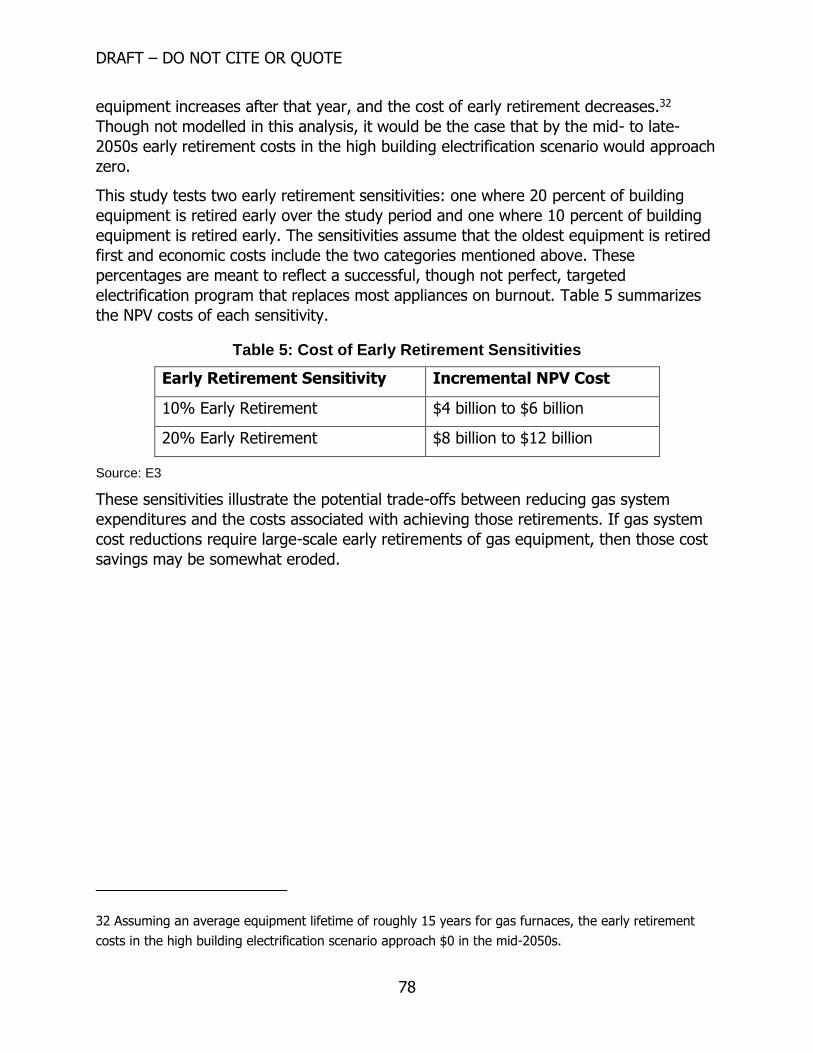
DRAFT – DO NOT CITE OR QUOTE
78
equipment increases after that year, and the cost of early retirement decreases.32
Though not modelled in this analysis, it would be the case that by the mid- to late-
2050s early retirement costs in the high building electrification scenario would approach
zero.
This study tests two early retirement sensitivities: one where 20 percent of building
equipment is retired early over the study period and one where 10 percent of building
equipment is retired early. The sensitivities assume that the oldest equipment is retired
first and economic costs include the two categories mentioned above. These
percentages are meant to reflect a successful, though not perfect, targeted
electrification program that replaces most appliances on burnout. Table 5 summarizes
the NPV costs of each sensitivity.
Table 5: Cost of Early Retirement Sensitivities
Early Retirement Sensitivity Incremental NPV Cost
10% Early Retirement $4 billion to $6 billion
20% Early Retirement $8 billion to $12 billion
Source: E3
These sensitivities illustrate the potential trade-offs between reducing gas system
expenditures and the costs associated with achieving those retirements. If gas system
cost reductions require large-scale early retirements of gas equipment, then those cost
savings may be somewhat eroded.
32 Assuming an average equipment lifetime of roughly 15 years for gas furnaces, the early retirement
costs in the high building electrification scenario approach $0 in the mid-2050s.
DRAFT – DO NOT CITE OR QUOTE
79
CHAPTER 6: Conclusions
Achieving California’s climate policy goals requires transformational changes across all
sectors of the state’s energy economy. This study focuses on the role of the state’s gas
infrastructure, examining different scenarios for how gas use will change in California. A
key finding is that gas use decreases in all scenarios that meet an 80 percent reduction
below 1990 emissions by 2050 target. Common drivers of that throughput decline
across scenarios are steep reductions in gas use in electric generation and energy
efficiency in industry and buildings. The key source of throughput variation in scenarios
developed in this study is the amount of electrification in buildings. Scenarios with more
building electrification lead to lower overall gas throughput, with especially sharp
declines in buildings. The level of gas throughput, in turn, has profound implications for
the overall amount and distribution of costs related to achieving California’s climate
policy objectives.
Scenarios with more gas throughput require a combination of more mitigation
elsewhere in the economy and higher levels of RNG. Relying on mitigation elsewhere in
the economy means that more energy-intensive sectors of the California economy, like
heavy-duty trucking and industry, would need to carry a greater share of the GHG
reduction load. If those challenging mitigation measures do not prove workable, then
the remaining strategy to achieve the 80 percent by 2050 reduction is to increase the
share of RNG in the pipeline.
Another key finding of this study is that relatively inexpensive RNG (for example,
biomethane from landfills and wastes) is limited and cannot alone reduce the GHG
intensity of pipeline gas enough to achieve 80 percent reduction. Once the biomethane
portion of the RNG supply curve is exhausted, then the state must turn to more
expensive hydrogen and yet more expensive SNG. The result is that by 2050, the
commodity cost of blended pipeline gas is more than four to seven times that of natural
gas today. This premium leads to large increases in rates and total costs for all
customers that use pipeline gas today. Importantly, the no building electrification
scenario leaves 56 percent of the pipeline as natural gas. If more pipeline
decarbonization were needed—as may be the case in a carbon-neutral scenario—the
cost of the marginal RNG resource, SNG with DAC, would be between 10 and 22 times
that of natural gas today. Indeed, the level of costs seen in the no building
electrification scenario suggest that there will be some level of economic electrification
based on price alone.
A conclusion of this analysis is that scenarios with more building electrification have
lower total societal costs. However, these scenarios raise challenging issues related to
the cost of maintaining the state’s gas infrastructure in the context of lower utilization.

DRAFT – DO NOT CITE OR QUOTE
80
If throughput declines and gas system costs do not, then large financial obligations will
be left to be paid by a smaller number of customers. In the later years of the study
period, this situation leads to rapidly increasing gas customer bills and rates. These
rates and bills are unlikely to be consistent with an economically sustainable gas
system. Particularly concerning is the prospect that low- and moderate-income
Californians or renters, who may be unable to electrify due to upfront costs or lack of
home ownership, could bear the impact of these cost increases.
Another consideration around building electrification pertains to risk and uncertainty.
The choices facing California regarding building decarbonization present asymmetric
risks, particularly because of the time required to transform building infrastructure and
the urgency of addressing climate change. The main barriers to building electrification
are upfront capital cost and consumer acceptance. However, once these costs are paid
and consumers gain familiarity with electric appliances, even if inexpensive sources of
RNG become available later, the state’s climate goals will still be met, and residents will
be able to heat their homes relatively affordably. In contrast, should building
electrification be delayed in the hope that RNG technology will progress more rapidly
than considered in the optimistic P2G cost scenario here, the failure of the technology
would lead to difficulty reducing emissions at reasonable cost. Further, customers who
do not electrify face the risks associated with high cost of gas, while customers who do
electrify do not face the same level of rate impact risk.
The results of the two bookend scenarios indicate that California should begin
investigating a natural gas system transition strategy. A gas transition strategy could
have several goals, ranging from cost reductions to protection of gas utility workers.
This study focuses on components of a gas transition strategy that relate to reducing
total system costs and the bill impacts for remaining gas customers. Results from this
analysis suggest that there is no silver bullet strategy to manage these challenges.
Instead, a suite of measures will need to be considered, including reductions in gas
system costs, accelerated depreciation, changes to cost allocation, and infusion of
electric- or nonratepayer funds. The gas distribution system continues to be used
throughout the study period in these scenarios, so such a strategy will need to be
developed without compromising the safety and reliability of the remaining system.
This study also sets out the contours of an ongoing research agenda for California. A
clear finding of this study is that RNG, particularly biomethane, is used in all mitigation
scenarios that achieve an 80 percent reduction by 2050. Electrolytic fuels appear to
have more limited roles in an 80 percent reduction policy regime but may have larger
roles in achieving the state’s 2045 carbon-neutrality target, particularly in sectors of the
economy that are otherwise difficult to decarbonize. Research by UCI suggests that
there is a wide range of potential cost trajectories for those technologies, so further
consideration of how to achieve costs consistent with the “optimistic” P2G scenario of
this study is warranted.
DRAFT – DO NOT CITE OR QUOTE
81
Another area deserving of further research relates to the development of the gas
transition strategy itself. Many important next steps are recommended for additional
research in the arenas of policy questions, engineering questions, and legal and
regulatory questions. Key policy questions include the following:
How should the benefits and costs of a gas transition strategy be allocated
among stakeholders?
How can California protect low-income residents, and gas workers, during a gas
transition?
Key engineering questions around gas pipeline safety and costs include the following:
To what degree can targeted electrification efforts safely reduce gas distribution
expenditures? To answer this question, more data are needed to understand the
geographic details of the gas system in California, as well as the replacement
schedules for the existing gas system.
What is the cost of targeted electrification, considering the potential for early
retirements of consumer equipment? A better understanding is needed of the
real-world technical and economic options to reduce gas system expenditures.
Pilots and real-world research could help understand the costs and options to
launch targeted electrification in communities in such a way that would enable
targeted retirements of the gas distribution system and would consider the
impacts on the electric distribution system of targeted electrification, along with
the potential for cost savings on the gas distribution system.
Finally, more research is needed to identify the legal and regulatory barriers to
implementing a gas transition strategy, along with targeted electrification programs. For
example:
Should natural gas companies be able to collect the entire book value of their
assets? Should shareholder return be affected in a gas transition strategy? How
does the timing of a gas transition strategy affect the answer to these questions?
Should California gas utilities’ obligation to serve be redefined?
This research paper does not seek to make policy recommendations, but rather
highlight key issues for further policy debate and illuminate some implications of
meeting the state’s climate goals. With foresight and coordination, Californians can plan
for an equitable, low-carbon future.

DRAFT – DO NOT CITE OR QUOTE
82
LIST OF ACRONYMS
Term Definition
AAEE Additional achievable energy efficiency
AEC Alkaline electrolytic cells
APEP Advanced Power and Energy Program
CARB California Air Resources Board
BEV Battery-electric vehicle
CCS Carbon capture and storage
CEC California Energy Commission
CFC Chlorofluorocarbons
CNG Compressed natural gas
CPUC California Public Utilities Commission
CO2 Carbon dioxide
DAC Direct air capture
E3 Energy and Environmental Economics, Inc.
EE Energy efficiency
EJ Exajoule, a unit of energy equal to one quintillion (1018) joules
EPIC Electric Program Investment Charge
EV Electric vehicle
FCEV Fuel cell electric vehicle
F-gas Fluorinated gas
GGE Gallons of gasoline equivalent
GHG Greenhouse gas
GRC General rate case
GWh Gigawatt-hour, a unit of energy in electricity
GWP Global Warming Potential
H2 Hydrogen
DRAFT – DO NOT CITE OR QUOTE
83
Term Definition
HBE High building electrification scenario
HDV Heavy-duty vehicles
HFC Hydrofluorocarbons
HHV Higher heating value
HVAC Heating, ventilation, and air conditioning
IOU Investor-owned utility
LCFS Low Carbon Fuel Standard
LDV Light-duty vehicles
LHV Lower heating value
MDV Medium-duty vehicles
MW Megawatt, a million watts, a unit of capacity in electricity
NBE No building electrification scenario
PCC Postcombustion capture
PEM-ECs Proton exchange membrane electrolytic cells
P2G Power to gas
PHEV Plug-in hybrid electric vehicle
PJ Petajoule, a unit of energy equal to one quadrillion (1015) joules
PM Particulate matter
NOx Oxides of nitrogen
RNG Renewable natural gas
RR Revenue requirement
RPS Renewables Portfolio Standard
SB Senate Bill
SLCP Short-lived climate pollutant
SOEC Solid oxide electrolytic cells
SNG Synthetic natural gas
TRC Total resource cost
DRAFT – DO NOT CITE OR QUOTE
84
Term Definition
TRL Technology readiness level
TW Terawatt is a trillion watts (1012), or a million megawatts
TWh Terawatt is a trillion watt-hours (1012), or a million megawatt-hours
UCI University of California, Irvine
VMT Vehicle miles traveled
ZEV Zero-emission vehicle

DRAFT – DO NOT CITE OR QUOTE
85
REFERENCES
Aas, Daniel, Sharad Bharadwaj, Amber Mahone, Zack Subin, Tory Clark, and Snuller
Price. 2018. Pacific Northwest Pathways to 2050: Achieving an 80% Reduction
Economy-Wide Greenhouse Gases by 2050. Energy and Environmental
Economics, Inc.
Bilich, Andy, Michael Colvin, and Timothy O’Conner. 2018. Managing the Transition:
Proactive Solutions for Stranded Gas Asset Risk in California. Environmental
Defense Fund.
Billimoria, Sherri, Leia Guccione, Mike Henchen, and Leah Louis-Prescott 2018. The
Economics of Electrifying Buildings. Rocky Mountain Institute.
California Air Resources Board. 2017. The 2017 Climate Change Scoping Plan Update:
The Proposed Strategy for Achieving California’s 2030 Greenhouse Gas Target.
California Public Utilities Commission (CPUC) 2019. “Decision Addressing the Test Year.
2019 General Rate Cases of San Diego Gas & Electric Company and Southern
California Gas Company.”
Committee on Climate Change. 2019. Net Zero Technical Report.
DOE, U.S. Department of Energy. 2016. 2016 Billion-Ton Report: Advancing Domestic
Resources for a Thriving Bioeconomy, Volume 1: Economic Availability of
Feedstocks. M. H. Langholtz, B. J. Stokes, and L. M. Eaton (Leads), ORNL/TM-
2016/160. Oak Ridge National Laboratory, Oak Ridge, Tennessee. 448p.
Energy and Environmental Economics, Inc., 2015. Decarbonizing Pipeline Gas to Help
Meet California’s 2050 Greenhouse Gas Reduction Goal. https://www.ethree.com/wp-content/uploads/2017/02/E3_Decarbonizing_Pipeline_01-
27-2015.pdf.
Fischer, Mark, Wanyu Chan, Seongeun Jeong, Zhimin Zhu. 2018. Natural Gas Methane
Emissions From California Homes.
Forster, P., V. Ramaswamy, P. Artaxo, T. Berntsen, R. Betts, D.W. Fahey, J. Haywood,
J. Lean, D.C. Lowe, G. Myhre, J. Nganga, R. Prinn, G. Raga, M. Schulz and R.
Van Dorland, 2007: “Changes in Atmospheric Constituents and in Radiative
Forcing.” In Climate Change 2007: The Physical Science Basis. Contribution of
Working Group I to the Fourth Assessment Report of the Intergovernmental
Panel on Climate Change (Solomon, S., D. Qin, M. Manning, Z. Chen, M. Marquis,
K.B. Averyt, M.Tignor and H.L. Miller [eds.]). Cambridge University Press,
Cambridge, United Kingdom and New York, New York, United States of America.
DRAFT – DO NOT CITE OR QUOTE
86
Governor Newsom’s Strike Force (Wildfire Strike Force). 2019. Wildfires and Climate
Change: California’s Energy Future.
Hopkins, Asa, Kenji Takahashi, Devi Glick, and Melissa Whited. 2018. Decarbonization of
Heating Energy Use in California Buildings: Technology, Markets, Impacts and
Policy Solutions.
Humbird, D., Davis, R., Tao, L., Kinchin, C., Hsu, D., Aden, A., Schoen, P., Lukas, J.,
Olthof, B., Worley, M. and Sexton, D., 2011. National Renewable Energy Lab.
(NREL). Process Design and Economics for Biochemical Conversion of
Lignocellulosic Biomass to Ethanol: Dilute-Acid Pretreatment and Enzymatic
Hydrolysis of Corn Stover (No. NREL/TP-5100-47764). Golden, Colorado.
IPCC. 2019. Climate Change and Land. An IPCC Special Report on Climate Change,
Desertification, Land Degradation, Sustainable Land Management, Food Security,
and Greenhouse Gas Fluxes in Terrestrial Ecosystems.
https://www.ipcc.ch/site/assets/uploads/2019/08/Edited-
SPM_Approved_Microsite_FINAL.pdf.
Jaffe, Amy Meyers, Rosa Dominguez-Faul, Nathan C. Parker, Daniel Scheitrum, Justin
Wilcock, and Marshall Miller. Institute of Transportation Studies, University of
California, Davis. 2016. The Feasibility of Renewable Natural Gas as a Large-
Scale, Low Carbon Substitute. Research Report UCD-ITS-RR-16-20.
Liu, Z., J. M. Norbeck, A. S. Raju, S. Kim, and C. S. Park. May 9, 2016. “Synthetic
Natural Gas Production by Sorption-Enhanced Steam Hydrogasification-Based
Processes for Improving CH4 Yield and Mitigating CO2 Emissions.” Energy
Conversion and Management, 10.
Liyin He, Zhao-Cheng Zeng, Thomas Pongetti, Clare Wong, Jianming Liang, Kevin
Gurney, Sally Newman, Vineet Yadav, Kristal Verhulst, Charles Miller, Riley
Duren, Christian Frankenberg, Paul Wennberg, Run-Lie Shia, Yuk Yuni, and
Tanley Sander. 2019. Atmospheric Methane Emissions Correlate With Natural
Gas Consumption From Residential and Commercial Sectors in Los Angeles.
Logue, Jennifer M., Neil E. Klepeis, Agnes B. Lobscheid, and Brett C. Singer. 2013.
“Pollutant Exposures From Natural Gas Cooking Burners: A Simulation-Based
Assessment for Southern California.” Environmental Health Perspectives, Vol.
122, Number 1, January 2014.
Long, Jane, Jens Birkholzer, Amber Mace, Sarah Brady, et al. 2018. California Council
on Science and Technology. Long-Term Viability of Underground Natural Gas
Storage in California: An Independent Review of Scientific and Technical
Information.

DRAFT – DO NOT CITE OR QUOTE
87
Mahone, Amber, Charles Li, Zack Subin, Michael Sontag, Gabe Mantegna, Alexis
Karolides, Alea German, and Peter Morris. Energy+Environmental Economics.
2019. Residential Building Electrification in California: Consumer Economics,
Greenhouse Gases and Grid Impacts.
Mahone, Amber, Elaine Hart, Ben Haley, Jim William, Sam Borgeson, Nancy Ryan, and
Snuller Price. Energy+Environmental Economics. 2015. “California PATHWAYS:
GHG Scenario Results.”
Mahone, Amber, Zachary Subin, Jenya Kahn-Lang, Douglas Allen, Vivian Li, Gerrit De
Moor, Nancy Ryan, Snuller Price. Energy+Environmental Economics. 2018. Deep
Decarbonization in a High Renewables Future: Updated Results From the
California PATHWAYS Model. California Energy Commission. Publication Number:
CEC-500-2018-012.
McKendry, P. 2002. “Energy Production From Biomass (Part 2): Conversion
Technologies.” Bioresource Technology, 83(1), 47–54.
http://doi.org/10.1016/S0960-8524 (01)00119-5.
Melaina, M. W., O. Antonia, and M. Penev. National Renewable Energy Laboratory.
2013. Blending Hydrogen Into Natural Gas Pipeline Networks: A Review of Key
Issues. NREL/TP-5600-51995.
Ming, Zach, Arne Olson, Gerrit De Moor, Huai Jiang, and Nick Schlag. Energy and
Environmental Economics, Inc. 2019. Long-Run Resource Adequacy Under Deep
Decarbonization Pathways for California.
Mullen, Nasim A., Jina Li, and Brett C Singer. Lawrence Berkeley National Laboratory.
2012. Impact of Natural Gas Appliances on Pollutant Levels in California Homes.
LBNL-5970e. Berkeley, California.
Nagy, Bela, J. Doyne Farmer, Quan Bui, and Jessika Trancik. 2013. Statistical Basis for
Prediction Technological Progress. PLoS ONE 8(2): e52669/.
Navigant. 2019. Gas for Climate: The Optimal Role for Gas in a Net-Zero Emissions
Energy System.
Norton, M, Baldi, A, Buda, V, et al. “Serious Mismatches Continue Between Science and
Policy in Forest Bioenergy.” GCB Bioenergy. 2019; 00: 1– 8.
https://doi.org/10.1111/gcbb.12643.
Parker, N.C., J. M. Ogden, and Y. Fan. 2008. “The Role of Biomass in California's
Hydrogen Economy.” Energy Policy, 36(10), pp. 3925-3939.
DRAFT – DO NOT CITE OR QUOTE
88
Parry, Daniel. 2016. News release. “NRL Seawater Carbon Capture Process Receives
U.S. Patent.” https://www.nrl.navy.mil/news/releases/nrl-seawater-carbon-
capture-process-receives-us-patent.
PG&E 2018b. “Pacific Gas and Electric Company. 2020 General Rate Case, Exhibit
(PG&E-10) Results of Operations Workpapers Supporting Chapter 11, Volume 2
of 2.”
PG&E. 2018. “Summary of PG&E’s 2020 General Rate Case.”
PG&E. 2019. News Release. “PG&E Submits Updated Financing Proposal for Safety and
Reliability Infrastructure Investments for 16 Million Customers; Commits to
Working Toward Long-Term Policy Solutions to Best Serve Interests of
Consumers.”
PG&E. 2019b. 2019 Gas Safety Plan.
Plant, Genevieve, Eric Kort, Cody Floerchinger, Alexandar Gvakharia, Isaac Vimont, and
Colm Sweeny. 2019. Large Fugitive Methane Emissions From Urban Centers
Along the U.S. East Coast.
Pless, J., D. Arent, J. Logan, J. Cochran, O. Zinaman, and C. Stark, C. 2015. Pathways
to Decarbonization: Natural Gas and Renewable Energy Lessons Learned From
Energy System Stakeholders. National Renewable Energy Laboratory. NREL/TP-
6A50-63904.
Scavo, Jordan, Suzanne Korosec, Esteban Guerrero, Bill Pennington, and Pamela
Doughman. 2016. Low-Income Barriers Study, Part A: Overcoming Barriers to
Energy Efficiency and Renewables for Low-Income Customers and Small
Business Contracting Opportunities in Disadvantaged Communities. California
Energy Commission. Publication Number: CEC-300-2016-009-CMFSB
350 Barriers Study.
Sepulveda, Nestor A. Jessie Jenkins, Fernando J. de Sisternes, and Richard K. Lester.
2018. “The Role of Firm Low-Carbon Electrification Resources in Deep
Decarbonization of Power Generation.” Joule, Volume 2, Issue 11.
Southern California Edison. 2019. “Application of Southern California Edison Company
for Authority to Establish Its Authorized Cost of Capital for Utility Operations for
2020 and to Partially Reset the Annual Cost of Capital Adjustment Mechanism.”
Southern California Gas Company. 2017. “Triennial Cost Allocation Proceeding
Application of Southern California Gas Company (U 904 G) and San Diego Gas &
Electric Company (U 902 G).”
DRAFT – DO NOT CITE OR QUOTE
89
Southern California Gas Company. 2017b. “Application of Southern California Gas
Company (U 904 G) and San Diego Gas & Electric Company (U 902 G) for (A)
Approval of the Forecasted Revenue Requirement Associated With Certain
Pipeline Safety Enhancement Plan Project and Associated Rate Recovery, and (B)
Authority to Modify and Created Certain Balancing Accounts.”
Southern California Gas Company. 2017b. “Workpapers to Prepared Direct Testimony of
Scott R. Wilder on Behalf of Southern California Gas Company.”
Southern California Gas Company. 2017c. “Revised SoCalGas Direct Testimony of Flora
Ngai (Depreciation).”
Southern California Gas Company. 2018. “Second Revised SoCal Gas Directory
Testimony of Ryan Hom (Summary of Earnings).”
Southern California Gas Company. 2019. “Test Year 2020 Cost of Capital Application of
Southern California Gas Company (U 904 G).”
Strbac, Goran, Danny Pudjianto, Robert Sanson, Predrag Djapic, Hossein Ameli, Nilay
Shah, Nigel Brandon, and Adam Hawkes. 2018. Analysis of Alternative U.K. Heat
Decarbonization Pathways. For the Committee on Climate Change.
TRC. 2016. Palo Alto Electrification Final Report.
United States Energy Information Administration (EIA) 2017. Natural Gas Annual.
Vivid Economics 2017. International Comparisons of Heating, Cooling and Heat
Decarbonisation Scenarios.
Williams J. H., A. DeBenedictis, R. Ghanadan, A. Mahone, J. Moore, W. R. Morrow III,
S. Price, and M. S Torn. 2012. “The Technology Path to Deep Greenhouse Gas
Emissions Cuts by 2050: The Pivotal Role of Electricity.” Science 335 53‐59.
WRA. 2018. “Handy Whitman Index of Public Utility Construction Costs.”
Yeh, Sonia, et al. 2016. “A Modeling Comparison of Deep Greenhouse Gas Emissions
Reduction Scenarios by 2030 in California.” Energy Strategy Reviews 13-14, pp
169-180.


![Integrated Soil Fertility Management [ISFM]in Subin Sub ...ipnc.ucdavis.edu/powerpoints/R307_0830_0915_Vanlauwe.pdf · Integrated Soil Fertility Management [ISFM]in Subin Sub--Saharan](https://img.pdfslide.us/doc/110x75/5c65a6ec09d3f29b6e8d1459/integrated-soil-fertility-management-isfmin-subin-sub-ipnc-integrated.jpg)