Embed Size (px)
Citation preview

Full Terms & Conditions of access and use can be found athttp://www.tandfonline.com/action/journalInformation?journalCode=rtpg20
Download by: [UNICAMP], [Dr Ramon Felipe Bicudo da Silva] Date: 24 May 2016, At: 06:16
The Professional Geographer
ISSN: 0033-0124 (Print) 1467-9272 (Online) Journal homepage: http://www.tandfonline.com/loi/rtpg20
Land Changes Fostering Atlantic Forest Transitionin Brazil: Evidence from the Paraíba Valley
Ramon Felipe Bicudo da Silva, Mateus Batistella, Emilio Federico Moran &Dengsheng Lu
To cite this article: Ramon Felipe Bicudo da Silva, Mateus Batistella, Emilio Federico Moran& Dengsheng Lu (2016): Land Changes Fostering Atlantic Forest Transition in Brazil: Evidencefrom the Paraíba Valley, The Professional Geographer
To link to this article: http://dx.doi.org/10.1080/00330124.2016.1178151
Published online: 24 May 2016.
Submit your article to this journal
View related articles
View Crossmark data

Land Changes Fostering Atlantic Forest Transition in Brazil: Evidencefrom the Para�ıba Valley
Ramon Felipe Bicudo da SilvaUniversity of Campinas
Mateus BatistellaEMBRAPA, Brazilian Corporation for Agricultural Research
Emilio Federico Moran and Dengsheng LuMichigan State University
The Atlantic Forest biome has only 13 percent of its pristine vegetation cover left. This article analyzes the consequences of landchanges on forest cover in the Paraíba Valley, S~ao Paulo state, Brazil, from 1985 to 2011. Multitemporal satellite imageclassifications were carried out to map eight land use and land cover classes. The forest cover increased from 2,696 km2 in 1985to 4,704 km2 in 2011, mostly over areas of degraded pastures. The highest rates of afforestation were observed within protectedareas around eucalyptus plantations. On the other hand, deforestation processes were concentrated on areas covered bysecondary forests. Socioeconomic changes taking place in particular Brazilian settings, such as industrialization and agriculturalmodernization, allied to the Paraíba Valley’s natural biophysical constraints for agricultural production, have led the region toexperience a remarkable case of forest transition. Key Words: land abandonment, Landsat, regional environmental change,secondary succession, socioeconomic changes.
大西洋森林生物群落,仅存有原始植被覆盖的百分之十三。本文分析巴西圣保罗的帕拉伊巴河谷自 1985 年至 2011 年
间,森林植被的土地变迁之后果。本文进行多时相卫星影像分类,以绘製八种土地使用和土地植被的类别。森林植被自
1985 年的两千六百九十六平方公里,增加至 2011 年的四千七百零四平方公里,且多半是在退化的放牧地区中。最高
比例的造林,是在尤加利树植栽附近的保育地区中被发现。另一方面而言,森林砍伐过程则集中于由原始次生林所覆盖
的区域中。在特定的巴西脉络中发生的社会经济变迁,例如工业化和农业现代化,结合帕拉伊巴河谷之于农业生产的自
然生物物理限制,导致了该区域经历了可观的森林变迁案例。 关键词: 土地退耕,土地使用卫星影像,区域环境变迁,
次生演替,社会经济变迁。
Solamente queda en pie el 13 por ciento de la cubierta de vegetaci�on prístina en el bioma del Bosque Atl�antico. Este artículoanaliza las consecuencias de los cambios de la tierra sobre la cubierta boscosa del Valle de Paraíba, en el estado de S~ao Paulo,Brasil, de 1985 a 2011. Se efectuaron clasificaciones de im�agenes satelitales multitemporales para cartografiar ocho clases deuso del suelo y cobertura de la tierra. La cobertura boscosa se increment�o de 2.696 km2 en 1985 a 4.704 km2 en 2011,principalmente sobre �areas de pasturas deterioradas. Las tasas m�as altas de reforestaci�on se observaron dentro de �areasprotegidas alrededor de plantaciones de eucaliptos. Por otra parte, los procesos de deforestaci�on se concentraron en �areascubiertas con bosques secundarios. Los cambios socioecon�omicos que est�an d�andose en ciertos escenarios brasile~nos, talescomo industrializaci�on y modernizaci�on agrícola, sumados a los limitantes biofísicos naturales para la producci�on agrícola en elValle de Paraíba, han llevado la regi�on a experimentar un notable caso de transici�on forestal. Palabras clave: abandono de latierra, Landsat, cambio ambiental regional, sucesi�on secundaria, cambios socioecon�omicos.
L and use and land cover changes result from acomplex interaction of biophysical and human
dimensions (Moran and Ostrom 2005; Caldas et al.2013). Proximate causes are human actions thatdirectly affect those changes (Geist and Lambin 2002).Examples include agricultural expansion, wood extrac-tion, and urban development (Kaimowitz and Angel-sen 1998; Caldas et al. 2007; Pacheco and Poccard-Chapuis 2012; Caldas et al. 2013). Several studiesemphasize the importance of multitemporal imageclassification to estimate land use and land cover
changes and to quantify the human impacts on land-scape structure (Foley et al. 2005; Lu et al. 2005;Moran and Ostrom 2005; Teixeira et al. 2009; Lira etal. 2012; Vaca et al. 2012; Lu et al. 2013).Regional studies of forest cover in the Atlantic forest
biome indicate periods of slight recovery followed bydeforestation without a consistent trajectory of forestregrowth (Teixeira et al. 2009; Freitas, Hawbaker, andMetzger 2010; Lira et al. 2012). Different deforesta-tion rates were observed for the Brazilian states in thisbiome, indicating a general trend of decline followed
The Professional Geographer, 0(0) 2016, pages 1–14 © 2016 American Association of GeographersInitial submission, August 2015; revised submission, December 2015; final acceptance, February 2016.
Published by Taylor & Francis Group, LLC.
Dow
nloa
ded
by [
UN
ICA
MP]
, [D
r R
amon
Fel
ipe
Bic
udo
da S
ilva]
at 0
6:16
24
May
201
6

by the stabilization of forest remnants (Fundac~ao SOSMata Atlantica/INPE 2014). There are discrepancies,however, among data sets provided by different organ-izations and a lack of detailed information about pro-cesses of secondary succession (SS; Magnago et al.2011), necessary to understand landscape dynamics(Farinaci and Batistella 2012).The reversal trend in land cover for a given territory
from a period of forest area net loss (e.g., deforesta-tion) to a period of forest area net gain is known as for-est transition (Rudel et al. 2005; Rudel, Schneider, andUriarte 2010). The forest transition might notincrease biodiversity in the short term due to the lowerbiological value of secondary forests and plantationscompared to undisturbed forest ecosystems (Vaca etal. 2012). According to Queiroz et al. (2014), countriesin Central and South America have reported positiveeffects of farmland abandonment on biodiversity. Ananalysis of ecological restoration projects across theglobe indicates that restoration projects enhance pro-vision of biodiversity by 44 percent compared to intactreference ecosystems (Benayas et al. 2009). The Bra-zilian Atlantic forest has been degraded for centuriesand recent research on biodiversity reveals a decline infauna leading the forest remnants to critical conserva-tion levels (Galetti and Dirzo 2013; Dirzo et al. 2014).The Atlantic forest remnants, however, provide keyecosystem services influencing how water is channeledand stored in catchments, providing a source of medic-inal plants, provisioning climate regulation, soil con-servation, carbon storage, and aesthetic landscapevalues (Di Stasi et al. 2002; Silvano et al. 2005; Ditt etal. 2010; Paula, Costa, and Tabarelli 2011; Villela etal. 2012). The growth of new forest areas is a means toincrease the core area of forest fragments and its con-nectivity, as well as to diminish edge effects, thereforeenhancing biodiversity conservation values (Lira et al.2012).Atlantic forest remnants represent around 13 per-
cent of its original vegetation cover (Fundac~ao SOSMata Atlantica/INPE 2014). This is the Brazilianbiome with the highest number of extinct or endan-gered species as well as a biodiversity hotspot (Myerset al. 2000; Machado, Drummond, and Paglia 2008).The biome hosts the most developed regions of thecountry, concentrating around 60 percent of thehuman population (Fundac~ao SOS Mata Atlantica/INPE 2014).In the 1950s, Brazil began an era of industrialization
that was followed by the agricultural modernizationperiod (Buainain et al. 2014; Silva 2015). These socio-economic changes brought a variety of changes to theBrazilian population dynamics (e.g., massive rural-to-urban migration), developed new agricultural areas(e.g., Brazilian Cerrado biome), promoted the adop-tion of land use mechanization, started the integrationof Brazilian agro-production systems into interna-tional commodity markets, and marginalized unsuit-able agricultural areas (Buainain et al. 2014). A vastliterature in land use science has correlated land
abandonment with unsuitable agricultural areas (e.g.,steep slopes, low-fertility soils, etc.) or as consequen-ces of socioeconomic factors, public policies, marketdemands, and land reforms (Dong et al. 2011; Alcan-tara et al. 2013).S~ao Paulo is the most developed state and concen-
trates 22 percent of the Brazilian population (BrazilianInstitute of Geography and Statistics [IBGE] 2010).Approximately two thirds of the state’s territory is partof the Atlantic forest biome (Fundac~ao SOS MataAtlantica/INPE 2014). S~ao Paulo is a Brazilian agri-cultural power and contributed 20 percent of Brazil’sgross domestic product (GDP) of the agricultural sec-tor in 2013 (Barros et al. 2015). In the Paraíba Valleyof S~ao Paulo State, however, a region settled since theseventeenth century, a decrease in agricultural activi-ties followed by farmland abandonment have beenobserved (Itani et al. 2011).We hypothesize that forest transition is a major
trend of land change in the Paraíba Valley in recentdecades. This article critically assesses (1) land useand land cover for 1985, 1995, 2005, and 2011 calcu-lated through a series of Landsat-5 Thematic Map-per (TM) images; (2) forest cover dynamics(afforestation and deforestation); and (3) major landuse and land cover changes and their relation withsocioeconomic factors.
Study Area
The Paraíba Valley region, encompassed by the Para-íba do Sul watershed, spanning the states of S~ao Paulo,Rio de Janeiro, and Minas Gerais in Brazil, has a fun-damental role in water and energy supplies to morethan 5 million inhabitants. The S~ao Paulo portion ofthis basin, the study region (Figure 1), covers an areaof more than 14,500 km2, supports a population ofmore than 2 million people, and represents 4.5 percentof the GDP of the State of S~ao Paulo (Itani et al.2011). The physical landscape is determined by twomajor geomorphological features: the mountainousareas with altitudes up to 2,000 m above sea level, androlling hills with altitude variation around 200 m. Theregion is influenced by the Tropical Atlantic and Polarair masses that cause cold fronts, responsible for partof the annual rainfall of 1,700 mm on average, mainlyconcentrated between December and March (Rocha-Le~ao 2005).In the past, coffee and milk production were the
dominant economic activities. The rural economy hasincreasingly taken a back seat to industry in theregion’s GDP; consequently, the greatest increase inland use has been from eucalyptus plantations, mainlyfor pulp and paper exports (Itani et al. 2011). Thelandscape of the Paraíba Valley is predominantly com-posed of hilly terrain, considered a marginal area foragriculture (Silva 2015) and covered by pasturelands,patches of Atlantic forest remnants, eucalyptus planta-tions, and urban areas (Arguello et al. 2010).
2 Volume 0, Number 0, Xxxxxxxxxxx 20XX
Dow
nloa
ded
by [
UN
ICA
MP]
, [D
r R
amon
Fel
ipe
Bic
udo
da S
ilva]
at 0
6:16
24
May
201
6

Data and Methods
Multitemporal Land Use and Land Cover Mapping
The data set consists of Landsat-5 Thematic Mapper(TM) imagery for 1985, 1994, 1995, 2005, and 2011(Table 1), a set of forty-three RapidEye scenes, andfieldwork.Image preprocessing started with registration and
atmospheric correction using the Improved Dark-Object Subtraction (DOS2) method (Chavez 1988).Ancillary data sets included the Forest Inventory ofthe Natural Vegetation of S~ao Paulo state (InstitutoFlorestal [IF] 2005) and the land use and land covermaps of S~ao Paulo state in 1994, 2002, 2005 and 2008(Funcate 2012). These maps were generated by visualinterpretation of TM images including eight land useand land cover (LULC) classes (Table 2).
Training Data
The RapidEye imagery of 2011 as well as fieldwork(2011 and 2012) data were used to define the trainingdata for the supervised classification of 2011. Theentire region is covered by a set of forty-three Rapid-Eye tiles (25 km £ 25 km). The training data for the
eight classes (Table 2) were sampled in all RapidEyeimages using interpretation of high spatial resolutionimages. The fieldwork used in situ inspection to accessground truth information and validate the trainingdata. To perform in situ inspection we randomlyselected a subset of thirty samples for each LULCclass. To validate the samples located in areas of diffi-cult access such as steep slopes and forest fragmentswith restricted visiting conditions, we used the highspatial resolution imagery (RapidEye) as a surrogatefor ground observation. The characterization of eachLULC class followed the description presented inTable 2. We also took georeferenced pictures of eachLULC class to assist with visual interpretation ofhigh-resolution images in a computational environ-ment. Based on the training data from 2011 (referencedata), two steps were carried out to define the trainingdata for the retrospective TM imagery: (1) spectrallibrary and preliminary maps and (2) training data col-lection to the retrospective TM imagery.First, from the training data from 2011, we built a
spectral reference library using the TM spectral signa-tures for each LULC. The spectral library was used toclassify the time series of TM images with the SpectralAngle Mapper (SAM). The SAM is a classificationmethod for feature spectra based on a comparison ofthe spectral image with a reference spectrum (end
Figure 1 The Para�ıba Valley study region and the regional context. (Color figure available online.)
Table 1 Landsat-5 thematic mapper imagery
Landsat-5 Thematic Mapper Acquisition
Scene 218/76 10/15/1985 08/24/1995 08/03/2005 09/09/2011Scene 219/76 11/07/1985 07/27/1994 04/20/2005 04/21/2011
Land Changes Fostering Atlantic Forest Transition in Brazil 3
Dow
nloa
ded
by [
UN
ICA
MP]
, [D
r R
amon
Fel
ipe
Bic
udo
da S
ilva]
at 0
6:16
24
May
201
6

members or spectral libraries; Shafri, Suhaili, andMansor 2007). The purpose of the classification bySAM was to generate preliminary maps to serve assupport information to collect training data for eachclass in the retrospective imagery. This cascade classi-fication procedure explores the existing temporal cor-relation between images acquired at different dates(Bruzzone and Cossu 2002).The 2011 spectral reference data were then used
to examine the field and spectral response patternsof the corresponding TM images in the time seriesto derive reference data for 1985, 1995, and 2005LULC classes. Each sample used for training of2011 images was checked against the TM images inthe time series and with the preliminary maps gen-erated by the SAM classifier, and thematic maps(ancillary data set) to ensure that the general LULCclasses were the same. Based on this survey, thetraining data for 1985, 1995, and 2005 that did notmatch the corresponding LULC classes in 2011were discarded from the reference data.To evaluate the method’s reliability, each set of
training data for the retrospective imagery gener-ated a spectral library from the reflectance informa-tion contained in the respective TM images. Themean and standard deviation were calculated fromthe spectral library data for six TM bands (1, 2, 3, 4,5, 7) and for each year and mapping class. Thus, atwo-tailed hypothesis test with a significance level of1 percent was applied to evaluate the compatibilitybetween the reflectance values of each class in thesix bands with the average reflectance values of thesame classes and bands in 2011 (reference data).The following hypotheses were defined: H0: m D u(null hypothesis), and H1: m 6¼ u (alternative hypothe-sis), where m is the average reflectance value for agiven class and band between the years 1985, 1995,and 2005 and u is the reflectance value of the sameclass and band in the year 2011.
Image Classification and Accuracy Assessment
Based on the survey of existing pixel-based classifica-tion algorithms (Lu and Weng 2007) and suggestions
on the selection of classifiers (Shafri, Suhaili, andMansor 2007; Mountrakis, Im, and Ogole 2011; Du etal. 2012), the method of maximum likelihood was useddue to the higher results of the kappa index comparedto other classifiers applied to the same LULC classifi-cation test.The maximum likelihood classifier works with the
assumption that the distribution of a class sample isnormal and calculates the probability that a given pixelbelongs to a specific class. Unless a probability thresh-old is selected, all pixels are classified. Each pixel isassigned to the class that has the highest probability(Shafri, Suhaili, and Mansor 2007). The classifier wasperformed with a set of training data containing theLULC classes. Each TM image was performed with arespective set of training data. The classificationresults for each scene of the same year weremosaicked, generating the LULC map. For the refine-ments of the classification procedure (over the LULCmaps), a majority filter was applied with a window sizeof 3 £ 3 pixels to reassign an LULC class to the centerof the 3 £ 3 window.For the supervised classification we used a stratified
random sample of 90 percent from the training data.For the accuracy assessment we used the 10 percent ofremaining training data–validation samples. The set ofvalidation samples and the LULC maps generatedresults for global accuracy, omission, and commissionerrors. These parameters were calculated from theconfusion matrix (Pontius and Millones 2011).
Forest Cover Changes
To determine the gross rate of forest gain and its per-sistence through time (SS forests), deforestation, andunchanged forest vegetation (the forest cover classmapped in 1985 that persisted in 2011, or stable for-est), we applied a postclassification comparison using ageographic information system (GIS). This methodcompared two independently produced LULC mapsfrom images of two diferent dates (Yang and Lo 2002)through band operations (Equations 1–3). All classeswere converted to the value 0 (nonforest), except the
Table 2 Land use and land cover classes used for the Para�ıba Valley, S~ao Paulo, Brazil
Classes Description
Agriculture Areas occupied by annual and perennial crops for food, feed, and fuel production (e.g., sugarcane,napier grass, rice, beans, and corn)
Water Rivers, lakes, and reservoirsBuilt-up areas Urban and periurban areas, highways, industrial sites, and other built-up areasEucalyptus Monocultural forest plantation with species of the Eucalyptus genusForest Vegetation formations including stages of secondary succession (shrubland, young forest) and
mature forestManaged pasture Areas used for grazing by cattle for milk and beef production with a predominance of grasses
(e.g., molasses grass and Brachiaria sp.)Degraded pasture Areas with grasses cover, presence of shrubs, and other herbs, being used as pasture or
abandonedBare soil Exposed soils associated with agriculture and forestry activities, deforestation, or preparation for
new built-up areas
4 Volume 0, Number 0, Xxxxxxxxxxx 20XX
Dow
nloa
ded
by [
UN
ICA
MP]
, [D
r R
amon
Fel
ipe
Bic
udo
da S
ilva]
at 0
6:16
24
May
201
6

forest cover class, which was converted to the value 5(1985), to the value 10 (1995), to the value 20 (2005),and to the value 40 (2011).
B1985 CB1995 DBC1995 (1)
BC1995 CB2005 DBC2005 (2)
BC2005 CB2011 DBC2011; (3)
where B is the converted raster map to forest and non-forest; BC is the forest cover class represented by thestable forest, and changes deforestation and forestgain. From the BC maps, the annual rate of deforesta-tion (Baumann et al. 2012) was calculated as follows(Equation 4):
D D DAY=FCYð Þ � 100=a (4)
with DA as the deforested area (km2) during a timespan y, FC is the forested area (km2) at the beginningof the same time span, and a is the number of yearsbetween TM image acquisitions. The results obtainedby the BC maps were overlaid with the LULC maps toidentify the contributing classes to the deforestationprocess and forest gains. The postclassification com-parison approach is often used for change detection toexamine land cover change trajectories, and the accu-racy of the change detection result is the multipliedvalue of overall accuracy from the two compared the-matic maps (Coppin et al. 2004). We performed a con-sistency assessment of the deforestation detection andforest gain by confirming the land cover trajectory for150 pixels classified as deforestation, 150 pixels classi-fied as forest gain, and 150 pixels classified as stableforest during the time span of 2005 to 2011 using colorcomposites (TM images) for 2005 and the RapidEyeimages for 2011 based on a method proposed by Brug-geman, Meyfroidt, and Lambin (2015). Then, we cal-culated the proportion of forest cover gain (FGY)following Baumann et al. (2012) and Kuemmerle et al.(2009) using Equation 5:
FGY D RY=NFð Þ � 100=a; (5)
where R is the area not being forested at the beginningof the same time span but forested in the time period y(km2); NF is all nonforested area at the beginning ofthe same time span (km2); and a is the number of yearsbetween TM image acquisitions. Also, we calculatedthe relative forest cover net change for the entireperiod (RNC) as suggested by Kuemmerle et al.(2009), as shown in Equation 6:
RNCD FC2011=FC1985� 1ð Þ � 100; (6)
where FC is the forest cover (km2) of thedescribed time span.
Results
Land Use and Land Cover
The multitemporal land use and land cover mappingfor the Paraíba Valley provided high-accuracy results(confusion matrices, see Appendices A–D) using themaximum likelihood supervised classifier: global accu-racy of 85 percent for 1985 and 1995, 88 percent for2005, and 86 percent for 2011. Figure 2 shows theoccupied area in the Paraíba Valley region for eachLULC class in the time series.Widespread land changes were observed during the
study period. Between 1985 and 2011, the relative for-est cover net change was C74 percent (from 2,696 km2
to 4,704 km2). Eucalyptus increased from 375 km2 to863 km2, and managed pasture maintained its coverarea of 4,033 km2 between 1985 and 2011. The majorchange in the Paraíba Valley was the decrease ofdegraded pasture from 5,692 km2 in 1985 to 3,400km2 in 2011 (–2,291 km2).The hypothesis test was used to assess the compatibil-
ity between the training data for the entire time seriesassuming the reflectance values contained in the trainingdata for 2011 as reference data. For the hypothesis testswith a significance level of 1 percent, all classes, exceptthe bare soil, had the null hypothesis (H0: m D u) notrejected, for a total of forty-eight tests (six hypothesistests for each class in the TM bands 1, 2, 3, 4, 5, and 7;see Table 3). By the hypothesis test, the sets of trainingdata showed coherent levels of reflectance in the timeseries, providing a confidence level of 99 percent thateach pixel of the training data belongs to the assignedLULC class. For thematic mapping approaches basedon supervised classification algorithms (e.g., maximumlikelihood classifier), the results from the hypothesistests demonstrate the high confidence level of each sam-ple to represent its respective LULC class.
Forest Cover Changes and Land Use Dynamics
Forest cover changes were detected from the 1985,1995, 2005, and 2011 LULC maps. The overall accu-racy for the maps of change reached 72 percent, 74percent, and 75 percent for 1985 to 1995, 1995 to2005, and 2005 to 2011, respectively. The consistencyassessment of the postclassification between 2005 and2011 showed that 85 percent of pixels classified asdeforested did undergo a change from a forest to anonforest class, and 89 percent of the pixels classifiedas forest gain changed from nonforest to forest class.Moreover, 98 percent of the pixels classified as stableforest by the postclassification procedure were for-ested for the two dates. The annual rate of forest covergain was 0.92 percent between 1985 and 1995, 0.38percent between 1995 and 2005, and 0.81 percentbetween 2005 and 2011.New forest areas resulting from SS were devel-
oped mostly over classes of degraded pasture andmanaged pasture in the proportions of 74 percent
Land Changes Fostering Atlantic Forest Transition in Brazil 5
Dow
nloa
ded
by [
UN
ICA
MP]
, [D
r R
amon
Fel
ipe
Bic
udo
da S
ilva]
at 0
6:16
24
May
201
6

and 11 percent, respectively. The stable forest from1985 remained 88 percent stable during the periodof study. The annual rate of deforestation reached1.9 percent between 1985 and 1995, 1.7 percentbetween 1995 and 2005, and 2.1 percent between2005 and 2011. The deforestation shows a decreas-ing trend for the more advanced stages of SS and forthe stable forest as seen in Figure 3. Advanced stagesof SS are the areas of stable forest gain throughoutthe next time spans—SS from BC1995 and SS fromBC2005 in Figure 3.Annual deforestation rates for the stable forest
decreased to 0.26 percent between 2005 and 2011compared to 0.36 percent between 1995 and 2005 and1.9 percent between 1985 and 1995. At the same time,a trend in deforestation in secondary successional areaswas observed. The annual deforestation rate on SS
from BC1995 was 1.38 percent between 1995 and 2005;between 2005 and 2011 the annual deforestation rateon SS from BC2005 was 1.21 percent and 0.66 percenton SS from BC1995. Figure 4 shows the contributionof each LULC class to the deforestation and gross rateof forest gain processes—drivers of forest coverdynamics.The change analysis allowed us to identify the pres-
sure of eucalyptus plantations on deforestation ratesduring the period of analysis. After the first periodfrom 1985 to 1995, the deforestation caused by theexpansion of this activity occurred mostly over SSareas. These results show that there is a decreasingtrend in the pressure of eucalyptus plantations overforest remnants in the Paraíba Valley, yet it remainsrelevant to areas in SS where higher deforestationrates were observed.
Table 3 Results for the hypothesis tests applied in Band 4 for all classes
1985/1995/2005
Band 4 Sum Average SD ME UL LL 2011 Result
Agriculture 1.4141 0.4713 0.0838 0.1248 0.5962 0.3464 0.4046 H0: m D uWater 0.1052 0.0351 0.0084 0.01260 0.0476 0.0224 0.0265 H0: m D uBuilt-up 0.8604 0.2868 0.0475 0.0708 0.3576 0.2159 0.2574 H0: m D uEucalyptus 1.5431 0.5143 0.1958 0.2917 0.8061 0.2225 0.4099 H0: m D uForest 0.9499 0.3166 0.0428 0.0638 0.3804 0.2528 0.2745 H0: m D uManaged pasture 1.1313 0.3771 0.0752 0.1120 0.4891 0.2650 0.2973 H0: m D uDegraded pasture 0.9611 0.3203 0.0579 0.0863 0.4066 0.2339 0.2653 H0: m D uBare soil 0.8061 0.2687 0.0541 0.0805 0.3492 0.1881 0.1679 H1: m 6¼ u
Note: The same test was applied to Bands 2, 3, 5, and 7 of the TM/Landsat-5. Sum D addition of the mean reflectance values for 1985,1995, and 2005; Average D average value for 1985, 1995, and 2005; ME D margin of error; UL D upper limit of the two-tailed hypothesistest; LL D lower limit of the two-tailed hypothesis test. The value of confidence interval (Z) at 1 percent was 2.53.
Figure 2 (A) Occupied area (km2) of land use and land cover classes in the time series. (B) Area changed (km2) repre-
sents the amount of net loss or net gain for each land use and land cover class across the time series. (Color figure avail-
able online.)
6 Volume 0, Number 0, Xxxxxxxxxxx 20XX
Dow
nloa
ded
by [
UN
ICA
MP]
, [D
r R
amon
Fel
ipe
Bic
udo
da S
ilva]
at 0
6:16
24
May
201
6

Discussion
Mapping Techniques
This article explored the spectral relationship betweenLULC classes in a Landsat-5 TM time series for thepurposes of multitemporal classifications. The LULCmaps and the postclassification comparison with GISallowed the analysis of forest cover process changes
through the time series. Taking into account the chal-lenges behind LULC classifications for specific dateswhere there is little if any ancillary information, theprocedures explored to develop the training data fordates prior to 2011 (reference data) contributed tothese advances of multitemporal LULC classification.This statement is possible because the results from thespectral analysis show that the LULC classes are con-sistent with expected spectral behavior, expressedthrough constant reflectance values in the time series,
Figure 3 Stable forest and secondary succession dynamics between 1985 and 2011 in the Para�ıba Valley. The gross rate
of forest gain is the initial stage of secondary succession. The percentage values are relative to the area of the study region
(14,500 km2). (Color figure available online.)
Land Changes Fostering Atlantic Forest Transition in Brazil 7
Dow
nloa
ded
by [
UN
ICA
MP]
, [D
r R
amon
Fel
ipe
Bic
udo
da S
ilva]
at 0
6:16
24
May
201
6
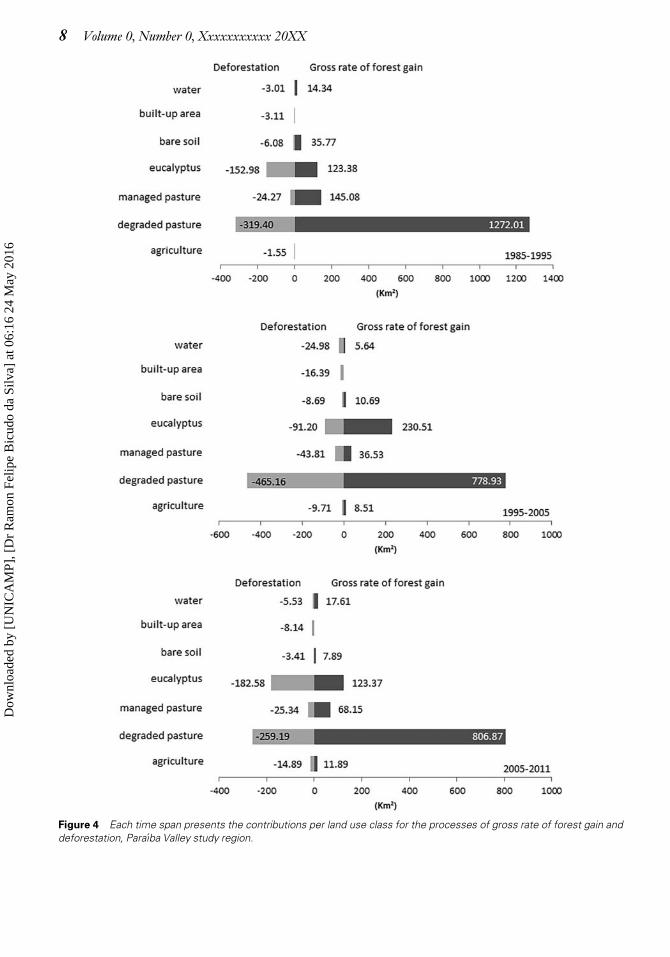
Figure 4 Each time span presents the contributions per land use class for the processes of gross rate of forest gain and
deforestation, Para�ıba Valley study region.
8 Volume 0, Number 0, Xxxxxxxxxxx 20XX
Dow
nloa
ded
by [
UN
ICA
MP]
, [D
r R
amon
Fel
ipe
Bic
udo
da S
ilva]
at 0
6:16
24
May
201
6

and were statistically significant at the 1 percent signifi-cance level.The postclassification comparison provided a
dynamic view of forest cover in the transitional land-scape of the Paraíba Valley, providing informationabout the forest stability and the rates of deforestationand forest gain. To monitor land cover changes, Afify(2011) demonstrated the postclassification approachbased on two thematic maps generated by the maxi-mum likelihood algorithm as more accurate than prin-cipal component analysis, image rationing, and imagedifferencing. Several regions have shown the expansionand recovery of forest cover (e.g., forest transition)over areas where there was land abandonment, a landtrajectory related to social, economic, and politicalchanges (Lambin and Meyfroidt 2010; Farinaci andBatistella 2012; Prishchepov et al. 2012). The resultsfrom the Paraíba Valley land cover dynamics revealthat 74 percent of the new forest areas between 1985and 2011 occurred over areas of degraded pasture andindicate that land abandonment and consequent forestregeneration is a phenomenon observed in this studyregion and the main trajectory of change should beconsidered to explain the forest transition process.
Regional Atlantic Forest Transition
The forest cover area increased from 2,696 km2 in 1985to 4,704 km2 in 2011, reaching 32 percent of the Para-íba Valley’s area. The observed phenomenon reveals aparticular regional forest dynamic still not observedwithin the Atlantic Forest biome (Ferreira, Alves, andShimabukuro 2014; Fundac~ao SOS Mata Atlantica/INPE 2014). Over the past fifty years, the Paraíba Val-ley has undergone a major socioeconomic transition,from being primarily characterized by agricultural pro-duction to an industrialized economy, with importantcontributions to the GDP of S~ao Paulo State (Boffi,Ricci, and Oliveira 2006; Itani et al. 2011). The ruralpopulation, which in 1950 was 55 percent of the totalpopulation, decreased to 5.3 percent by 2010 (IBGE2010), and the outmigration process was driven toindustrialized municipalities in the region (Vieira2012). Even as Brazil became a major player in interna-tional food commodity markets in recent decades bythe development of large-scale production areas (e.g.,central and western S~ao Paulo state—sugarcane; MatoGrosso, Mato Grosso do Sul, and Par�a states—soybeanand beef; western S~ao Paulo and Mato Grosso states—eucalyptus plantations), in the Paraíba Valley the agri-cultural area for temporary crops (e.g., soybean, corn,sugar cane) decreased 61 percent, from 587.40 km2 to225.96 km2 between 1990 and 2013. In the sameperiod, Brazil’s agricultural area increased 44 percentfrom 459,807.38 km2 to 664,060.24 km2 (IBGE—Municipal Agricultural Production1). The decline ofagricultural activities has significantly influenced landabandonment processes in less suitable areas for agri-culture. In the Paraíba Valley, forest regeneration was aconsequence of this change.
The Paraíba Valley pasturelands, around 67 percentof the total land area in 1985, decreased to 51 percentby 2011. The number of cattle in the Paraíba Valleyincreased from 434,053 in 1985 to 669,667 (animalunit) in 2011 (IBGE—Municipal Cattle Survey2),indicating that the stocking rate increased from 0.4 to0.9 AU/ha (animal unit/hectare). Considering only themanaged pasture class (Figure 2), the stocking ratechanged from 1.07 to 1.66 AU/ha. For the next fewyears if this trend does not change, the results couldbe overgrazing with consequent decay in productivityand degradation of pasturelands, or agricultural inten-sification, both with potential effects on forest andland changes. For the first case, overgrazing will leadthe Atlantic forest in Paraíba Valley to new cycles ofdeforestation or pressure over the successional vegeta-tion, affecting the trend for forest transition. In thesecond case, the intensification has the potential topromote changes, raising the productivity of the pas-turelands and reducing the needs of new lands for cat-tle, thus contributing to the return of forest coveredareas. According to Grau and Aide (2008), the poten-tial switch from production in traditional extensivegrazing areas to intensive modern beef productionprovides opportunities to significantly increase foodproduction while sparing land for nature conservation.Eucalyptus plantations had a significant role as proxi-
mate causes of the Atlantic forest dynamics as a defores-tation agent during its period of expansion (from 1985to 2005) and afterward by releasing pressure overmatureforest remnants. The region’s eucalyptus plantations arecommitted to pulp production for trade in the interna-tional market. This economic dimension is acting, in thelast decade, as a globalization pathway (Lambin andMeyfroidt 2010) to the forest transition (underlyingcause) in the Paraíba Valley (Silva 2015). The forestryand pulp companies must follow strict internationalrules, such as those of the Forest Stewardship Council(FSC) protocol, stimulating the adoption of Brazilianenvironmental policies and controlling fire events, witha positive impact on the forest transition process (Fari-naci 2012; Farinaci, Ferreira, and Batistella 2013).Based on the Brazilian National System of Conser-
vation Units (Law No. 9985 of 2000), the annual rateof relative forest cover net change within protectedareas in the Paraíba Valley observed between 1985and 2011 was 4.8 percent and 1.53 percent outside theprotected areas.Previous research in the Atlantic forest biome had
identified a progressive predominance of secondaryforests compared to mature forests, thereby callingattention to a decrease in the capacity of this biome toprovide a home to the most sensitive species (Teixeiraet al. 2009). In the Paraíba Valley landscapes, 14.72percent of forest cover area in 2005 was already SS,and 14.07 percent was mature forest (stable forest).The tendency was accentuated in 2011, when 18.57 per-cent of the forest cover area was SS and 13.61 percentwasmature forest. Despite the fact that secondary forestsmight not ensure home to the most sensitive species,
Dow
nloa
ded
by [
UN
ICA
MP]
, [D
r R
amon
Fel
ipe
Bic
udo
da S
ilva]
at 0
6:16
24
May
201
6

Lira et al. (2012) highlighted the increase of secondaryforest areas as important for biodiversity conservation inthe biome due to the potential effect of young secondaryforests in reducing the isolation of forest remnants andmaintaining significant amounts of original biodiversity.According to the Fundac~ao SOS Mata Atlantica/
INPE (2014), the Atlantic forest biome has presenteda stable forest cover area during the last twenty-eightyears (1985–2013). The deforestation rates of the for-est patches with less anthropic pressure (forest patcheswith best conditions to support the original biodiver-sity) decreased from 5,364.8 km2 to 239.4 km2 duringthe same period. Thus, the biome is approaching thepoint of inflection of the forest transition curve (Rudelet al. 2005). The biome might not necessarily gothrough the forest transition process, however, as inthe case of Thailand, where the decrease of deforesta-tion rates over the last decades was not followed by anincrement of new forested areas (Southworth, Nagen-dra, and Cassidy 2012). National-scale forest surveysmight conceal regional forest trajectories (Tucker andSouthworth 2005), but our regionally scaled analysispermits a more refined conclusion. This scale relationis pertinent to the case of Paraíba Valley where theforest cover trajectory in the last decades has shown aclear regional forest transition process that is worthyof attention. This mesoscale study might also contrib-ute to the understanding of global and continentalscale processes, such as climate change, land use tran-sitions, and ecosystem services. The Paraíba Valleycase arises as a strong message to the global commu-nity about the potential of environmental regenerationin endangered tropical biomes, such as the Atlanticforest, which has been depleted for centuries.
Conclusions
The main objective of this research was to quantifyLULC and forest cover dynamics over the last decadesto investigate the phenomenon of regional forest tran-sition in the Atlantic forest of Brazil’s Paraiba Valley.As the results demonstrate, the research presented thefirst case of regional forest transition in the Atlantic for-est biome in S~ao Paulo State, highlighting the potentialof forest regrowth over deforested lands. These resultsshould stimulate studies to assess the effects on biodi-versity and ecosystem functions, as well as to informconservation policies and strategies guiding ecologicalrestoration projects. From the analysis of forest coverdynamics, we concluded that deforestation rates in theParaíba Valley tended to decrease as well as concentrateon early stages of SS. This result indicates pressurereduction exerted by deforestation over mature forestsand on advanced stages of successional forest. Thehighest contribution of deforestation by eucalyptusplantations was in 2005 to 2011. A total of 86.7 percentof this contribution was concentrated in secondary suc-cessional areas, though, indicating a tendency to dimin-ish the pressure exerted by eucalyptus plantations onAtlantic forest remnants. The Paraíba Valley seems to
be undergoing a process of landscape change where thegains of new areas of forest are greater than losses fromdeforestation; that is, the area is experiencing a foresttransition (Rudel, Schneider, and Uriarte 2010). Thisprocess is still recent and requires further studies andlong-term monitoring to assess its stability. Thedynamics of LULC changes illustrate that degradedpasture, considered as land use abandonment, is impor-tant to the forest cover gain. This phenomenon indi-cates that the underlying causes of changes, such as theeffect of economic development, the international mar-ket rules (pulp from eucalyptus), public policies, mas-sive rural-to-urban migration, and agriculturalmodernization have played a fundamental role in theland change trajectories and have resulted in a regionalAtlantic forest transition in the Paraíba Valley.&
Acknowledgments
We acknowledge Dr. Samuel W. Murphy (Universityof Campinas) and Dr. Michael Keller (U.S. Depart-ment of Agriculture Forest Service) for help with finalrevisions. The opinions expressed herein are the soleresponsibility of the authors.
Funding
We gratefully acknowledge the funding support by theS~ao Paulo Research Foundation (FAPESP) processnumber 2011/13568-0 and 2013/09243-3. We alsoacknowledge the help and support provided by theCenter for Environmental Studies (NEPAM/UNI-CAMP), EMBRAPA (Brazilian Corporation for Agri-cultural Research), and the Center for Global Changeand Earth Observations (Michigan State University).
Notes
1Municipal Agricultural Production: Systematic rural censusaddressed to rural properties in the Brazilian countrysideevery year since 1990. See http://www.sidra.ibge.gov.br/bda/pesquisas/pam/default.asp?oD28&iDP (last accessed 8July 2015).
2Municipal Cattle Survey: Systematic rural census addressedto rural properties in the Brazilian countryside every yearsince 1974. See http://www.sidra.ibge.gov.br/bda/pesquisas/ppm/default.asp?oD27&iDP (last accessed 8 July 2015).
Literature Cited
Afify, H. A. 2011. Evaluation of change detection techniquesfor monitoring land-cover changes: A case study in newBurg El-Arad area. Alexandria Engineering Journal 50:187–95.
Alcantara, C., T. Kuemmerle, M. Baumann, E. V. Bragina, P.Griffiths, P. Hostert, and J. Knorn. 2013. Mapping theextent of abandoned farmland in Central and EasternEurope using MODIS time series satellite data.Environmental Research Letters 8 (3): 035035.
Arguello, F. V. P., G. T. Batista, F. J. Ponzoni, and N. W.Dias. 2010. Distribuic~ao espacial de plantios de Eucalyptono trecho paulista da bacia hidrogr�afica Rio Paraíba do Sul,SP, Brasil [Spatial distribution of eucalyptus plantations in
10 Volume 0, Number 0, Xxxxxxxxxxx 20XX
Dow
nloa
ded
by [
UN
ICA
MP]
, [D
r R
amon
Fel
ipe
Bic
udo
da S
ilva]
at 0
6:16
24
May
201
6

S~ao Paulo stretch of Rio Paraiba do Sul watershed, SP,Brazil]. Ambi- �Agua 5 (3): 133–46.
Barros, G. S. C., A. F. Silva, A. L. Fachinello, N. R. Castro,and L. Gilio, eds. 2015. GDP agribusiness—Brazil outlook.S~ao Paulo, Brazil: CEPEA.
Baumann, M., M. Ozdogan, T. Kuemmerle, K. J. Wendland,E. Esipova, and V. C. Radeloff. 2012. Using the Landsatrecord to detect forest-cover changes during and after thecollapse of the Soviet Union in the temperate zone ofEuropean Russia. Remote Sensing of Environment 124:174–84.
Benayas, J. M. R., A. C. Newton, A. Diaz, and J. M. Bullock.2009. Enhancement of biodiversity and ecosystem servicesby ecological restoration: A meta-analysis. Science 325(5944): 1121–24.
Boffi, S. A. N. O., F. Ricci, and E. A. A. Q. Oliveira. 2006.An�alise hist�orica da regi~ao do Vale do Paraíba comoatrativo para a implantac~ao da ind�ustria de base (1930–1980) [Historical analysis of the Paraíba Valley region asattractive for the implementation of basic industry (1930–1980)]. Revista Univap 13 (24): 3059–63.
Brazilian Institute of Geography and Statistics (IBGE). 2010.Censo demografico 2010 [Demographic census of 2010].http://www.ibge.gov.br/estatistica (last accessed July 2015).
Bruggeman, D., P. Meyfroidt, and E. F. Lambin. 2015.Production forests as a conservation tool: Effectiveness ofCameroon’s land use zoning policy. Land Use Policy 42:151–64.
Bruzzone, L., and R. Cossu. 2002. A multiple-cascade-classifier system for a robust and partially unsupervisedupdating of land-cover maps. IEEE Transactions onGeoscience and Remote Sensing 40 (9): 1984–96.
Buainain, A. M., E. Alves, J. M. Silveira, and Z. Navarroeds.2014. O Mundo rural no Brasil do s�eculo 21 [The Braziliancountryside of the 21th century]. Brasília, Brazil: EMBAPA.
Caldas, M. M., D. Goodin, S. Sherwood, J. M. C. Krauer, and S.M. Wisely. 2013. Land-cover change in the ParaguayanChaco: 2000–2011. Journal of Land Use Science 10 (1): 1–18.
Caldas, M., R. Walker, E. Arima, S. Perz, C. Wood, S. Aldrich,and C. Simmons. 2007. Theorizing land cover and land usechange: The peasant economy of Amazonian deforestation.Annals of the Association of American Geographers 97 (1): 86–110.
Chavez, P. S. 1988. An improved dark-object subtractiontechnique for atmospheric scattering correction of multis-pectral data. Remote Sensing of Environment 24 (3): 459–79.
Coppin, P., I. Jonckheere, K. Nackaerts, and B. Muys. 2004.Digital change detection methods in ecosystemmonitoring: A review. International Journal of RemoteSensing 25 (9): 1565–69.
Dirzo, R., H. S. Yong, M. Galetti, G. Ceballos, N. J. B. Isaac,and B. Collen. 2014. Defaunation in the Anthropocene.Science 345 (6195): 401–06.
Di Stasi, L. C., G. P. Oliveira, M. A. Carvalhaes, M. Queiroz-Junior, O. S. Tien, S. H. Kakinami, and M. S. Reis. 2002.Medicinal plants popularly used in the Brazilian tropicalAtlantic forest. Fitoterapia 73 (1): 69–91.
Ditt, E. H., S. Mourato, J. Ghazoul, and J. Knight. 2010.Forest conversion and provision of ecosystem services inthe Brazilian Atlantic forest. Land Degradation &Development 21 (6): 591–603.
Dong, J., J. Liu, H. Yan, F. Tao, and W. Kuang. 2011.Spatio-temporal pattern and rationality of landreclamation and cropland abandonment in mid-easternInner Mongolia of China in 1990–2005. EnvironmentalMonitoring and Assessment 179 (1–4): 137–53.
Du, P., J. Xia, W. Zhang, K. Tan, Y. Liu, and S. Liu. 2012.Multiple classifier system for remote sensing imageclassification: A review. Sensors 12 (4): 4764–92.
Farinaci, J. S. 2012. The new forests in S~ao Paulo State: Amultiscalar study under the perspective of the foresttransition theory. PhD dissertation, University ofCampinas, Campinas, Brazil.
Farinaci, J. S., and M. Batistella. 2012. Variac~ao NaCobertura Vegetal Nativa Em S~ao Paulo: Um PanoramaDo Conhecimento Atual [Variation on native vegetationcover in S~ao Paulo: An overview of current knowledge].Revista �Arvore 36 (4): 695–705.
Farinaci, J. S., L. C. Ferreira, and M. Batistella. 2013. Foresttransition and ecological modernization: Eucalyptus forestrybeyond good and bad. Ambiente e SociedadeXVI:25–44.
Ferreira, M. P., D. S. Alves, and Y. E. Shimabukuro. 2014.Forest dynamics and land-use transitions in the BrazilianAtlantic forest: The case of sugarcane expansion. RegionalEnvironmental Change 15 (2): 365–77.
Foley, J. A., R. Defries, G. P. Asner, C. Barford, G. Bonan, S.R. Carpenter, and F. S. Chapin. 2005. Globalconsequences of land use. Science 309 (5734): 570–74.
Freitas, S. R., T. J. Hawbaker, and J. P. Metzger. 2010.Effects of roads, topography, and land use on forest coverdynamics in the Brazilian Atlantic forest. Forest Ecology andManagement 259 (3): 410–17.
Funcate. 2012. Emiss~oes do setor de uso da terra, mudancas do usoda terra e florestas: relat�orio de referencia/FUNCATE,CETESB [Emissions of the land use sector, land usechanges and forest: Report/FUNCATE, CETESB]. S~aoPaulo, Brazil: CETESB.
Fundac~ao SOS Mata Atlantica/INPE. 2014. Atlas dosremanescentes de Mata Atlantica período 2012–2013 [Atlas ofthe Atlantic Forest remnants, period of 2012–2013]. S~aoPaulo, Brazil: Fundac~ao SOS Mata Atlantica/INPE.
Galetti, M., and R. Dirzo. 2013. Ecological and evolutionaryconsequences of living in a defaunated world. BiologicalConservation 163:1–6.
Geist, H. J., and E. F. Lambin. 2002. Proximate causes andunderlying driving forces of tropical deforestation.BioScience 52 (2): 143.
Grau, H. R., and M. Aide. 2008. Globalization anduncertainty in Latin America. Ecology and Society 13 (2): 16.
Instituto Florestal (IF). 2005. Invent�ario Florestal da Vegetac~aoNatural do Estado de Sao Paulo [Forest inventory of the naturalvegetation of S~ao Paulo State]. S~ao Paulo, Brazil: SMA/IF.
Itani, M. R., C. M. Barros, F. E. L. Figueiredo, M. R. N.Andrade, M. T. C. Mansor, R. L. Mangabeira, and V. S.Carvalho, eds. 2011. Subsídios ao planejamento ambiental:Unidade de Gerenciamento de Recursos hídricos Paraíba do Sul—UGRHI 02 [Environmental planning: Unit of water resourcesmanagement of Paraíba do Sul]. S~ao Paulo, Brazil: SMA.
Kaimowitz, D., and A. Angelsen. 1998. Economic models oftropical deforestation: A review. Indonesia: CIFOR.
Kuemmerle, T., O. Chaskovskyy, J. Knorn, V. C. Radeloff, I.Kruhlov, W. S. Keeton, and P. Hostert. 2009. Forest coverchange and illegal logging in the Ukrainian Carpathians inthe transition period from 1988 to 2007. Remote Sensing ofEnvironment 113:1194–1207.
Lambin, E. F., and P. Meyfroidt. 2010. Land use transitions:Socio-ecological feedback versus socio-economic change.Land Use Policy 27 (2): 108–18.
Lira, P. K., L. R. Tambosi, R. M. Ewers, and J. P. Metzger.2012. Land-use and land-cover change in Atlantic forestlandscapes. Forest Ecology and Management 278:80–89.
Lu, D., G. Li, E. Moran, and S. Hetrick. 2013.Spatiotemporal analysis of land-use and land-cover changein the Brazilian Amazon. International Journal of RemoteSensing 34 (16): 5953–78.
Land Changes Fostering Atlantic Forest Transition in Brazil 11
Dow
nloa
ded
by [
UN
ICA
MP]
, [D
r R
amon
Fel
ipe
Bic
udo
da S
ilva]
at 0
6:16
24
May
201
6

Lu, D., P. Mausel, M. Batistella, and E. Moran. 2005.Land�cover binary change detection methods for use inthe moist tropical region of the Amazon: A comparativestudy. International Journal of Remote Sensing 26 (1): 101–14.
Lu, D., and Q. Weng. 2007. A survey of image classificationmethods and techniques for improving classificationperformance. International Journal of Remote Sensing 28 (5):823–70.
Machado, A. M. B., G. M. Drummond, and A. P. Paglia.2008. Livro vermelho da fauna brasileira ameacada de extinc~ao[Red book of endangered Brazilian fauna]. Brasília, Brazil:MMA/Fundac~ao Biodiversitas.
Magnago, L. F. S., M. Simonelli, S. V. Martins, F. A. R.Matos, and V. G. Demuner. 2011. Variac~oes estruturais ecaracterísticas ed�aficas em diferentes est�adios sucessionaisde floresta ciliar de tabuleiro, ES [Structural changes andedaphic characteristics in different succession stages oftabuleiro riparian forest, ES]. Revista �Arvore 35 (3): 445–56.
Moran, E. F., and E. Ostrom, eds. 2005. Seeing the forest andthe trees: Human–environment interactions in forest ecosystems.Cambridge, MA: MIT Press.
Mountrakis, G., J. Im, and C. Ogole. 2011. Support vectormachines in remote sensing: A review. ISPRS Journal ofPhotogrammetry and Remote Sensing 66 (3): 247–59.
Myers, N., R. A. Mittermeier, C. G. Mittermeier, G. A. B.Fonseca, and J. Kent. 2000. Biodiversity hotspots forconservation priorities. Nature 403 (6772): 853–58.
Pacheco, P., and R. Poccard-Chapuis. 2012. The complexevolution of cattle ranching development amid marketintegration and policy shifts in the Brazilian Amazon. Annalsof the Association of American Geographers 102 (6): 1366–90.
Paula, M. D., P. A. Costa, and M. Tabarelli. 2011. Carbonstorage in a fragmented landscape of Atlantic forest: Therole played by edge-affected habitats and emergent trees.Tropical Conservation Science 4 (3): 349–58.
Pontius, R. G., and M. Millones. 2011. Death to Kappa: Birthof a quantity disagreement and allocation disagreement foraccuracy assessment. International Journal of Remote Sensing32 (15): 4407–29.
Prishchepov, A. V., V. C. Radeloff, M. Baumann, T.Kuemmerle, and D. M€uller. 2012. Effects of institutionalchanges on land use: Agricultural land abandonmentduring the transition from state-command to market-driven economies in post-Soviet Eastern Europe.Environmental Research Letters 7 (2): 024021.
Queiroz, C., R. Beilin, C. Folke, and R. Lindborg. 2014.Farmland abandonment: Threat or opportunity forbiodiversity conservation? A global review. Frontiers inEcology and the Environment 12 (5): 288–96.
Rocha-Le~ao, O. M. 2005. Regressive evolution of networkchannels by groundwater flows in drainage headwaters:Geo-hidro-geological basis for recovery of degraded areaswith erosion control. PhD dissertation, Federal Universityof Rio de Janeiro, Rio de Janeiro, Brazil.
Rudel, T. K., O. T. Coomes, E. Moran, F. Achard, A.Angelsen, J. Xu, and E. Lambin. 2005. Forest transitions:Towards a global understanding of land use change. GlobalEnvironmental Change 15 (1): 23–31.
Rudel, T. K., L. Schneider, and M. Uriarte. 2010. Foresttransitions: An introduction. Land Use Policy 27 (2): 95–97.
Shafri, H. Z. M., A. Suhaili, and S. Mansor. 2007. Theperformance of maximum likelihood, spectral anglemapper, neural network and decision tree classifiers inhyperspectral image analysis. Journal of Computer Science 3(6): 419–23.
Silva, R. F. B. 2015. Eucalyptus and Atlantic forest: Analysisof the land use and land cover and their political,biophysical and socioeconomic connection. PhDdissertation, University of Campinas, Campinas, Brazil.
Silvano, R. A. M., S. Udvardy, M. Ceroni, and J. Farley. 2005.An ecological integrity assessment of a Brazilian Atlanticforest watershed based on surveys of stream health andlocal farmers’ perceptions: Implications for management.Ecological Economics 53 (3): 369–85.
Southworth, J., H. Nagendra, and L. Cassidy. 2012. Foresttranstion pathways in Asia—Studies from Nepal, India,Thailand and Cambodia. Journal of Land Use Science 7 (1):51–65.
Teixeira, A. M. G., S. S. F. Britaldo, S. R. Freitas, and J. P.Metzger. 2009. Modeling landscape dynamics in anAtlantic rainforest region: Implications for conservation.Forest Ecology and Management 257 (4): 1219–30.
Tucker, C. M., and J. Southworth. 2005. Processes of forestchange at the local and landscape levels in Honduras andGuatemala. In Seeing the forest and trees: Human-environment interactions in forest ecosystems, ed. E. F. Moranand E. Ostrom, 253–77. Cambridge, MA: MIT Press.
Vaca, R. A., D. J. Golicher, L. Cayuela, J. Hewson, and M.Steininger. 2012. Evidence of incipient forest transition insouthern Mexico. PLoS ONE 7 (8): 1–15.
Vieira, E. T. 2012. Industrialization policies and regionaldevelopment: A study of the Paraíba Valley during theperiod 1970 to 2000. Desenvolvimento Regional em debate 2(2): 161–81.
Villela, D. M., E. A. Mattos, A. A. Pinto, S. A. Vieira, and L.A. Martinelli. 2012. Carbon and nitrogen stock and lluxesin coastal Atlantic forest of southeast Brazil: Potentialimpacts of climate change on biogeochemical functioning.Brazilian Journal of Biology 72 (3): 633–42.
Yang, X., and C. P. Lo. 2002. Using a time series of satelliteimagery to detect land use and land cover changes in theAtlanta, Georgia metropolitan area. International Journal ofRemote Sensing 23 (9): 1775–98.
RAMON FELIPE BICUDO DA SILVA is a PostdoctoralFellow at the Center for Environmental Studies andResearch, University of Campinas, Brazil, Campinas, SP13083–867, Brazil. E-mail: [email protected]. Hisresearch interests include land use/cover change, remotesensing, human interaction with the environment, and envi-ronmental science.
MATEUS BATISTELLA is a reearcher at EMBRAPA, Bra-zilian Corporation for Agricultural Research, Campinas, SP13070–115, Brazil. E-mail: [email protected] works with geotechnologies, landscape ecology, and landchange, coordinating projects in distinct Brazilian sites.
EMILIO FEDERICO MORAN is John A. Hannah Distin-guished Professor at Michigan State University, East Lans-ing, MI 48823. E-mail: [email protected]. His researchaddressed broader issues of human interaction with the envi-ronment under conditions of environmental change.
DENGSHENG LU is a Professor at the Center for GlobalChange and Earth Observations, Michigan State University,East Lansing, MI 48823. E-mail: [email protected]. Hisresearch interests include land-use/cover change, biomass/carbon estimation, land degradation evaluation, human–envi-ronment interaction, and urban impervious surface mapping.
Dow
nloa
ded
by [
UN
ICA
MP]
, [D
r R
amon
Fel
ipe
Bic
udo
da S
ilva]
at 0
6:16
24
May
201
6

Appendix A Estimated population matrix based on 589 pixels (10 percent of training data), thematic map of 1985
Reference (%)
Population(pixel) Classified Class 1 Class 2 Class 3 Class 4 Class 5 Class 6 Class 7 Class 8
Total MAPproportion
Commissionerror
604824 Class 1 3.00 0.00 0.00 0.00 0.00 0.00 0.00 0.00 4.00 0.00270964 Class 2 0.00 2.00 0.00 0.00 0.00 0.00 0.00 0.00 2.00 0.00442433 Class 3 0.00 0.00 2.00 0.00 0.00 0.00 0.00 1.00 3.00 1.00416774 Class 4 0.00 0.00 0.00 2.00 1.00 0.00 0.00 0.00 3.00 1.002995678 Class 5 1.00 0.00 0.00 0.00 17.0 0.00 0.00 0.00 19.00 1.006325265 Class 6 1.00 0.00 0.00 0.00 1.00 33.00 3.00 1.00 39.00 6.004476719 Class 7 0.00 1.00 0.00 0.00 0.00 4.00 21.00 2.00 28.00 6.00586220 Class 8 0.00 0.00 0.00 0.00 0.00 0.00 0.00 4.00 4.00 0.00
Total REF proportion 5.00 2.00 2.00 2.00 19.00 38.00 24.00 7.00 100.00 15.00Omission error 2.00 1.00 0.00 1.00 2.00 4.00 3.00 3.00 15.00
Global accuracy D 85%
Note: MAP D thematic map; REF D validation samples; Class 1 D agriculture; Class 2 D water; Class 3 D built-up; Class 4 D eucalyptus;Class 5 D forest; Class 6 D degraded pasture; Class 7 Dmanaged pasture; Class 8 D bare soil.
Appendix B Estimated population matrix based on 600 pixels (10 percent of training data), thematic map of 1995
Reference (%)
Population(pixel) Classified Class 1 Class 2 Class 3 Class 4 Class 5 Class 6 Class 7 Class 8
Total MAPproportion
Commissionerror
232360 Class 1 1.00 0.00 0.00 0.00 0.00 0.00 0.00 0.00 4.00 0.00232082 Class 2 0.00 1.00 0.00 0.00 0.00 0.00 0.00 0.00 2.00 0.00510153 Class 3 0.00 0.00 3.00 0.00 0.00 0.00 0.00 1.00 3.00 0.00614577 Class 4 0.00 3.00 0.00 3.00 0.00 0.00 0.00 0.00 3.00 1.004207850 Class 5 0.00 1.00 0.00 1.00 24.00 0.00 0.00 0.00 19.00 2.006923142 Class 6 1.00 0.00 0.00 0.00 1.00 33.00 5.00 2.00 39.00 10.003018004 Class 7 0.00 1.00 0.00 0.00 0.00 1.00 17.00 0.00 28.00 2.00381246 Class 8 0.00 0.00 0.00 0.00 0.00 0.00 0.00 2.00 4.00 0.00
Total REF proportion 3.00 2.00 3.00 5.00 25.00 35.00 22.00 5.00 100.00 15.00Omission error 1.00 1.00 0.00 2.00 1.00 2.00 5.00 3.00 15.00
Global accuracy D 85%
Note: MAP D thematic map; REF D validation samples; Class 1 D agriculture; Class 2 D water; Class 3 D built-up; Class 4 D eucalyptus;Class 5 D forest; Class 6 D degraded pasture; Class 7 Dmanaged pasture; Class 8 D bare soil.
Appendix C Estimated population matrix based on 681 pixels (10 percent of training data), thematic map of 2005
Reference (%)
Population(pixel) Classified Class 1 Class 2 Class 3 Class 4 Class 5 Class 6 Class 7 Class 8
Total MAPproportion
Commissionerror
649517 Class 1 3.00 0.00 0.00 0.00 0.00 0.00 1.00 0.00 4.00 0.00302121 Class 2 0.00 2.00 0.00 0.00 0.00 0.00 0.00 0.00 2.00 0.00515981 Class 3 0.00 0.00 3.00 0.00 0.00 0.00 0.00 0.00 3.00 0.00544594 Class 4 0.00 0.00 0.00 3.00 0.00 0.00 0.00 0.00 3.00 1.004668882 Class 5 0.00 0.00 0.00 1.00 27.00 1.00 0.00 0.00 29.00 2.005774987 Class 6 0.00 0.00 0.00 0.00 1.00 31.00 3.00 1.00 36.00 10.003385715 Class 7 0.00 0.00 0.00 0.00 0.00 2.00 18.00 1.00 21.00 2.00278190 Class 8 0.00 0.00 0.00 0.00 0.00 0.00 0.00 1.00 2.00 0.00
Total REF proportion 3.00 3.00 3.00 5.00 27.00 35.00 22.00 3.00 100.00 12.00Omission error 0.00 1.00 0.00 1.00 0.00 3.00 4.00 2.00 12.00
Global accuracy D 88%
Note: MAP D thematic map; REF D validation samples; Class 1 D agriculture; Class 2 D water; Class 3 D built-up; Class 4 D eucalyptus;Class 5 D forest; Class 6 D degraded pasture; Class 7 Dmanaged pasture; Class 8 D bare soil.
Land Changes Fostering Atlantic Forest Transition in Brazil 13
Dow
nloa
ded
by [
UN
ICA
MP]
, [D
r R
amon
Fel
ipe
Bic
udo
da S
ilva]
at 0
6:16
24
May
201
6

Appendix D Estimated population matrix based on 807 pixels (10 percent of training data), thematic map of 2011
Reference (%)
Population(pixel) Classified Class 1 Class 2 Class 3 Class 4 Class 5 Class 6 Class 7 Class 8
Total MAPproportion
Commissionerror
580519 Class 1 3.00 0.00 0.00 0.00 0.00 0.00 0.00 0.00 4.00 1.00301433 Class 2 0.00 2.00 0.00 0.00 0.00 0.00 0.00 0.00 2.00 0.00623293 Class 3 0.00 0.00 3.00 0.00 0.00 0.00 0.00 0.00 4.00 0.00959938 Class 4 0.00 0.00 0.00 5.00 1.00 0.00 0.00 0.00 6.00 1.005226685 Class 5 0.00 0.00 0.00 2.00 29.00 1.00 0.00 0.00 32.00 3.003778798 Class 6 0.00 0.00 0.00 0.00 0.00 21.00 1.00 1.00 23.00 3.004481386 Class 7 0.00 0.00 0.00 0.00 0.00 4.00 21.00 2.00 28.00 7.00169452 Class 8 0.00 0.00 0.00 0.00 0.00 0.00 0.00 1.00 1.00 0.00
Total REF proportion 4.00 2.00 4.00 8.00 30.00 26.00 22.00 4.00 100.000 14.00Omission error 1.00 1.00 0.00 3.00 1.00 5.00 1.00 3.00 14.00
Global accuracy D 86%
Note: MAP D thematic map; REF D validation samples; Class 1 D agriculture; Class 2 D water; Class 3 D built-up; Class 4 D eucalyptus;Class 5 D forest; Class 6 D degraded pasture; Class 7 Dmanaged pasture; Class 8 D bare soil.
14 Volume 0, Number 0, Xxxxxxxxxxx 20XX
Dow
nloa
ded
by [
UN
ICA
MP]
, [D
r R
amon
Fel
ipe
Bic
udo
da S
ilva]
at 0
6:16
24
May
201
6