Embed Size (px)
Citation preview

A Comparative Study of Landsat TM and SPOT HRG Images forVegetation Classification in the Brazilian Amazon
Dengsheng Lu,School of Forestry and Wildlife Services, Auburn University, 602 Duncan Drive, Auburn, AL 36849([email protected])
Mateus Batistella,Brazilian Agricultural Research Corporation, Embrapa Satellite Monitoring, Campinas, São Paulo,Brazil
Evaristo E. de Miranda, andBrazilian Agricultural Research Corporation, Embrapa Satellite Monitoring, Campinas, São Paulo,Brazil
Emilio MoranCenter for the Study of Institutions, Population, and Environmental Change (CIPEC), IndianaUniversity, Bloomington, IN, and the Anthropological Center for Training and Research on GlobalEnvironmental Change (ACT), Indiana University, Bloomington, IN
AbstractComplex forest structure and abundant tree species in the moist tropical regions often causedifficulties in classifying vegetation classes with remotely sensed data. This paper exploresimprovement in vegetation classification accuracies through a comparative study of different imagecombinations based on the integration of Landsat Thematic Mapper (TM) and SPOT High ResolutionGeometric (HRG) instrument data, as well as the combination of spectral signatures and textures. Amaximum likelihood classifier was used to classify the different image combinations into thematicmaps. This research indicated that data fusion based on HRG multispectral and panchromatic dataslightly improved vegetation classification accuracies: a 3.1 to 4.6 percent increase in the kappacoefficient compared with the classification results based on original HRG or TM multispectralimages. A combination of HRG spectral signatures and two textural images improved the kappacoefficient by 6.3 percent compared with pure HRG multispectral images. The textural images basedon entropy or second-moment texture measures with a window size of 9 pixels × 9 pixels played animportant role in improving vegetation classification accuracy. Overall, optical remote-sensing dataare still insufficient for accurate vegetation classifications in the Amazon basin.
IntroductionThe moist tropical forests in the Amazon have special importance in the biodiversity andclimate of the world. High deforestation rates in the Amazon have been associated with theexpansion of highways and roads and the growth of Amazonian cattle ranching and soybeanfarming (Skole et al., 1994; Laurance et al., 2004). Large areas of primary forests have beenconverted into a mosaic of agricultural lands, pastures, and different successional formations(Lucas et al., 2000; Roberts et al., 2002). The unprecedented tropical deforestation rates havebeen regarded as an important factor in the climate change and environmental degradation atregional and global scales (Skole et al., 1994). In order to better understand the consequencescaused by deforestation and landscape transformations in the region, an international researchprogram called Large Scale Biosphere-Atmosphere Experiment in Amazonia (LBA), has beencarried out since 1997 (http://lba.cptec.inpe.br/lba/). Through this program, an important
NIH Public AccessAuthor ManuscriptPhotogramm Eng Remote Sensing. Author manuscript; available in PMC 2009 September 28.
Published in final edited form as:Photogramm Eng Remote Sensing. 2008 ; 74(3): 311–321.
NIH
-PA Author Manuscript
NIH
-PA Author Manuscript
NIH
-PA Author Manuscript
research topic is the mapping and monitoring of land-use/land-cover changes. A research teamfrom the USA (Indiana University and Indiana State University) and Brazil (Embrapa:Brazilian Company of Farming Research and INPE: National Institute of Space Research) hasmade great efforts to improve the accuracy of vegetation classifications, especiallysuccessional vegetation classification (Mausel et al., 1993; Moran et al., 1994; Brondízio etal., 1996; Lu, 2005a).
In the moist tropical regions, complex forest stand structure and abundant tree species oftencause difficulties in classifying vegetation classes using remotely sensed data. Most previousresearch in the moist tropical regions provided only coarse vegetation classes, such as primaryforest and successional vegetation (Adams et al., 1995; Roberts et al., 2002). However, thebiomass densities of different successional stages vary considerably, ranging from less than 2kg/m2 in initial successional vegetation to greater than 20 kg/m2 in advanced successionalvegetation (Lu, 2005b). The biomass densities of primary forests also vary considerably,ranging from approximately 12 kg/m2 to greater than 50 kg/m2 due to different environments.Obviously, a single class of primary forest or successional vegetation is not suitable for manyapplications such as carbon estimation or land degradation assessments. Lu (2005a) hasprovided a detailed summary of the previous efforts on vegetation classification using fieldmeasurements and satellite images. A new approach based on the complexity of forest standstructure was then developed for successional vegetation classification. But in practice, thecollection of a large number of field measurements, including vegetation stand attributes (e.g.,height, diameter at breast height), is often very challenging, especially in the Brazilian Amazondue to the difficult access to some remote areas and the intensive labor required in anenvironment characterized by such high biodiversity. Thus, it is important to find a suitableapproach for improving vegetation classification performance based on the use of remote-sensing features, such as spectral, spatial, and temporal characteristics to address these needs.Without accurate land-cover classification, estimates of biomass and carbon are fraught withdegrees of error that make modeling subject to unacceptable uncertainties.
Time series of Landsat Thematic Mapper (TM) data have been extensively used for land-coveror vegetation classification in the moist tropical regions (Mausel et al., 1993; Moran et al.,1994; Adams et al., 1995; Foody et al., 1996; Brondízio et al., 1996; Roberts et al., 2002;Vieira et al., 2003; Lu et al., 2004), but a fine vegetation classification based on the mediumspatial resolution images have proven difficult. Although higher spatial resolution data, suchas SPOT High Resolution Visible (HRV), and recently SPOT High Resolution Geometric(HRG) instrument data are readily available, they are frequently used for urban-related studies(Marceau et al., 1990; Gong et al., 1992; Shaban and Dikshit, 2002), and their roles forimproving vegetation classification, especially in the moist tropical regions have not beenexamined in detail. Increased spatial resolution considerably reduces the mixed pixel problem,and effective use of spatial information may improve detailed vegetation classificationaccuracies. Two image processing techniques for making use of the higher spatial resolutioninformation are often used for improving land-cover classification performance. One approachis based on data fusion through the integration of multispectral and high spatial resolutioninformation. Previous research has explored the data fusion approaches for improvement ofland-cover or vegetation classification (Welch and Ehlers, 1987; Yocky, 1996; Haack et al.,2002). The second approach is to use the spatial information inherent in high spatial resolutionimagery. In particular, textures have proven useful in improving land-cover classificationaccuracy (Marceau et al., 1990; Shaban and Dikshit, 2001; Chen et al., 2004). Many texturemeasures have been developed since the 1970s (Haralick et al., 1973; Kashyap et al., 1982).Of the many texture measures, the grey-level co-occurrence matrix (GLCM) texture measureis frequently used.
Lu et al. Page 2
Photogramm Eng Remote Sensing. Author manuscript; available in PMC 2009 September 28.
NIH
-PA Author Manuscript
NIH
-PA Author Manuscript
NIH
-PA Author Manuscript
In the moist tropical regions, the classification of detailed vegetation classes with remotelysensed data is still very difficult and the use of higher spatial resolution images in improvingvegetation classification accuracy is poorly understood. Hence, this paper aims to explore thepossibility of mapping fine vegetation classes through a comparative analysis of differentimage combinations, such as the incorporation of the spectral features in the Landsat TM imageand the spatial features in the SPOT HRG image, as well as the combinations of textures andspectral signatures. A maximum likelihood classifier was used to classify different imagecombinations into thematic maps, followed by an accuracy assessment using reference data toevaluate the classification performance and to identify suitable image processing proceduresfor vegetation classification in the study area.
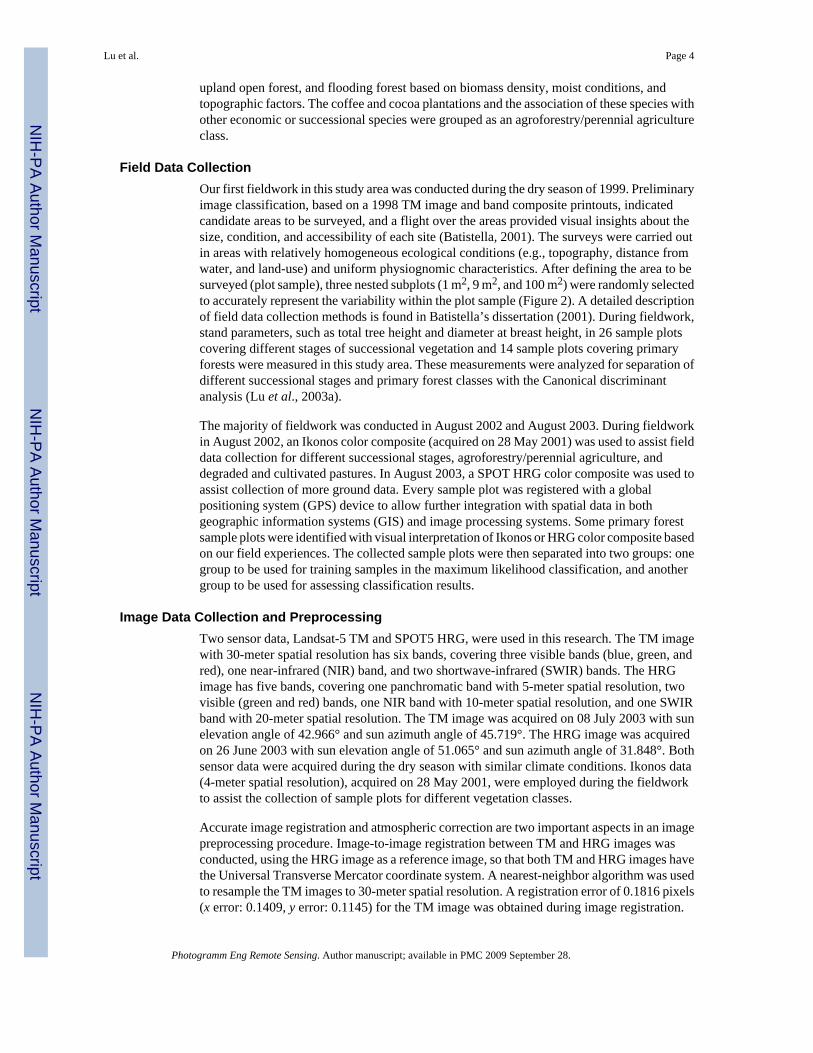
Study AreaThe study area is located at Machadinho d’Oeste in northeastern Rondônia (Figure 1). A well-defined dry season lasts from June to August. The annual average precipitation is 2,016 mmand annual average temperature is 25.5° C (Rondônia, 1998). The terrain is undulating, rangingfrom 100 to 450 m above sea level. Several soil types, mainly alfisols, oxisols, ultisols, andalluvial soils, have been identified (Bognola and Soares, 1999). Although Machadinho d’Oestehas a specific institutional and architectural design (Batistella et al., 2003), the study area isrepresentative of rural settlements in the Amazon and mimics the dynamics of deforestationand land-use cycles found in other parts of the region, specifically in the state of Rondônia.
The settlement of Machadinho d’Oeste covers about 2,000 km2 and is adjacent to the borderswith the states of Amazonas and Mato Grosso. The major deforestation began in late-1980s.Due to land-use intensification, most successional vegetations are in the initial and intermediatestages, and limited areas are in the advanced stage. The majority of successional vegetationhas biomass density of less than 15 kg/m2, but most of the primary forest has biomass densitygreater than 20 kg/m2 (Lu, 2005a). In deforested areas, pastures, perennial crops (e.g., coffee,cocoa), agroforestry (e.g., cocoa associated with the rubber tree), and small fields of annualcrops are the most common land-uses. Because of the high temperature and precipitation, thesoil nutrients are lost rapidly and soil erosion can be severe, thus the land degrades rapidly ifnot properly used, resulting in the land being left to fallow, setting the stage for the return ofsuccessional vegetation. Settlers, rubber tappers, and loggers inhabit the area, transforming thelandscape through their economic activities and use of resources (Batistella, 2001). Farmingsystems are mainly household-based, and little depends on larger group efforts. Rubber tappershave rights over communal forest reserves where they practice extraction. Loggers play a majorrole in providing access to remote areas within the settlement as they open trails through theforest to reach valuable species.
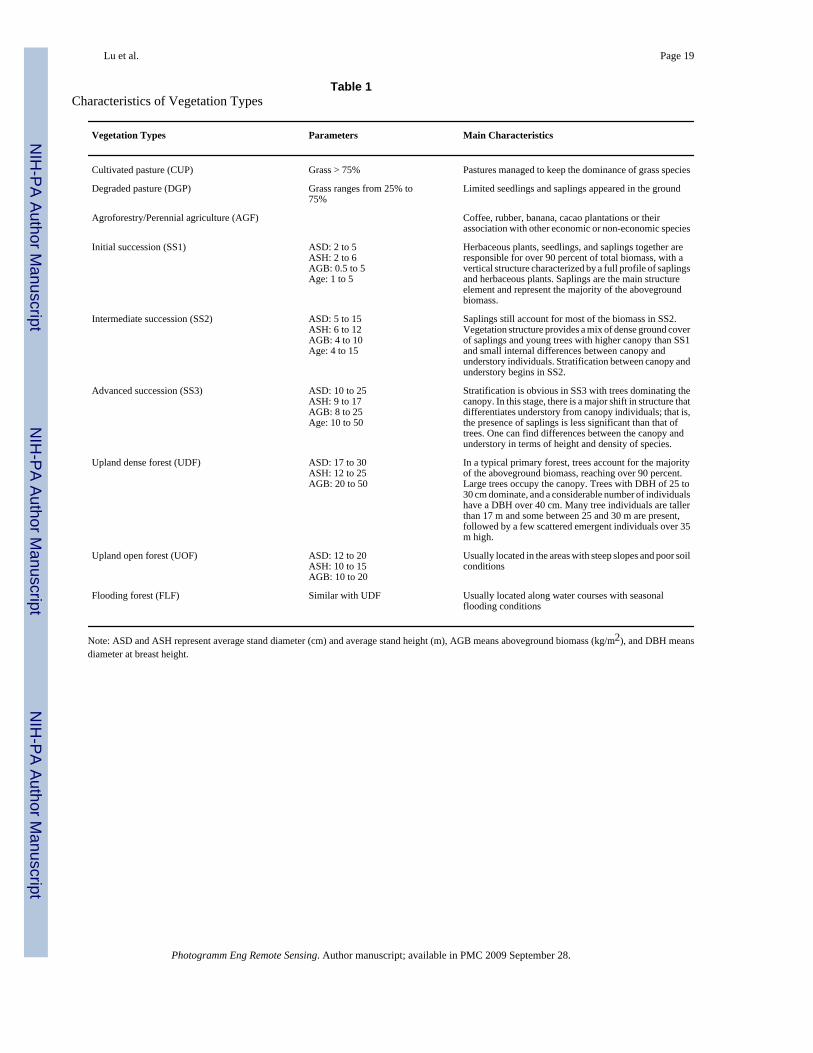
MethodsBefore implementing field data collection and image classification, a suitable vegetationclassification system was required. The selection of a vegetation classification scheme wasmotivated by two factors: our previous experience in vegetation classification since themid-1990s (e.g., Mausel et al., 1993; Brondízio et al., 1996; Lu et al., 2004) and the requirementof detailed vegetation information for our Amazonian research (Batistella and Moran, 2005).Table 1 summarizes the major characteristics of the vegetation classification system used inthis study. Pastures were separated from other vegetation classes based on the percentage ofgrass cover and the limited presence of seedlings and saplings. Successional vegetations wereassigned solely to the vegetation areas where grass cover was less than 25 percent, whichgenerally occurred in sites that had been abandoned for more than two years. The separationof different successional stages was based on stand structural parameters: biomass and averagesof forest stand diameter and height. The primary forest was separated into upland dense forest,
Lu et al. Page 3
Photogramm Eng Remote Sensing. Author manuscript; available in PMC 2009 September 28.
NIH
-PA Author Manuscript
NIH
-PA Author Manuscript
NIH
-PA Author Manuscript
upland open forest, and flooding forest based on biomass density, moist conditions, andtopographic factors. The coffee and cocoa plantations and the association of these species withother economic or successional species were grouped as an agroforestry/perennial agricultureclass.
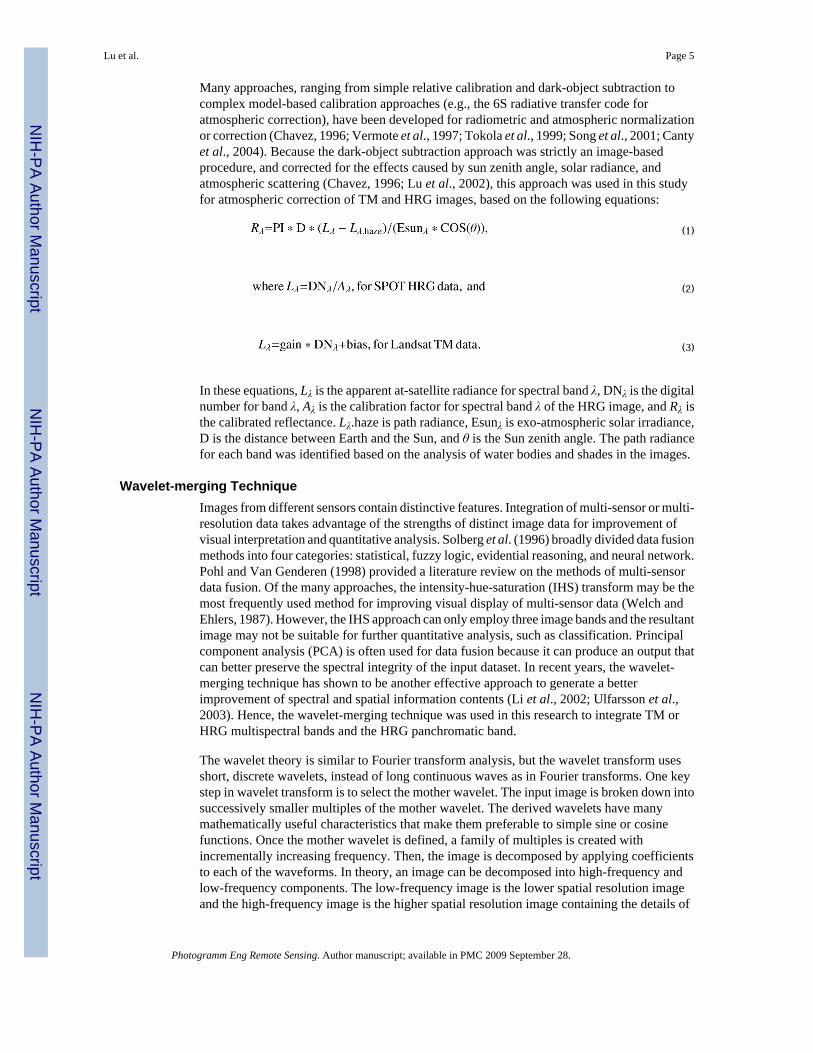
Field Data CollectionOur first fieldwork in this study area was conducted during the dry season of 1999. Preliminaryimage classification, based on a 1998 TM image and band composite printouts, indicatedcandidate areas to be surveyed, and a flight over the areas provided visual insights about thesize, condition, and accessibility of each site (Batistella, 2001). The surveys were carried outin areas with relatively homogeneous ecological conditions (e.g., topography, distance fromwater, and land-use) and uniform physiognomic characteristics. After defining the area to besurveyed (plot sample), three nested subplots (1 m2, 9 m2, and 100 m2) were randomly selectedto accurately represent the variability within the plot sample (Figure 2). A detailed descriptionof field data collection methods is found in Batistella’s dissertation (2001). During fieldwork,stand parameters, such as total tree height and diameter at breast height, in 26 sample plotscovering different stages of successional vegetation and 14 sample plots covering primaryforests were measured in this study area. These measurements were analyzed for separation ofdifferent successional stages and primary forest classes with the Canonical discriminantanalysis (Lu et al., 2003a).
The majority of fieldwork was conducted in August 2002 and August 2003. During fieldworkin August 2002, an Ikonos color composite (acquired on 28 May 2001) was used to assist fielddata collection for different successional stages, agroforestry/perennial agriculture, anddegraded and cultivated pastures. In August 2003, a SPOT HRG color composite was used toassist collection of more ground data. Every sample plot was registered with a globalpositioning system (GPS) device to allow further integration with spatial data in bothgeographic information systems (GIS) and image processing systems. Some primary forestsample plots were identified with visual interpretation of Ikonos or HRG color composite basedon our field experiences. The collected sample plots were then separated into two groups: onegroup to be used for training samples in the maximum likelihood classification, and anothergroup to be used for assessing classification results.
Image Data Collection and PreprocessingTwo sensor data, Landsat-5 TM and SPOT5 HRG, were used in this research. The TM imagewith 30-meter spatial resolution has six bands, covering three visible bands (blue, green, andred), one near-infrared (NIR) band, and two shortwave-infrared (SWIR) bands. The HRGimage has five bands, covering one panchromatic band with 5-meter spatial resolution, twovisible (green and red) bands, one NIR band with 10-meter spatial resolution, and one SWIRband with 20-meter spatial resolution. The TM image was acquired on 08 July 2003 with sunelevation angle of 42.966° and sun azimuth angle of 45.719°. The HRG image was acquiredon 26 June 2003 with sun elevation angle of 51.065° and sun azimuth angle of 31.848°. Bothsensor data were acquired during the dry season with similar climate conditions. Ikonos data(4-meter spatial resolution), acquired on 28 May 2001, were employed during the fieldworkto assist the collection of sample plots for different vegetation classes.
Accurate image registration and atmospheric correction are two important aspects in an imagepreprocessing procedure. Image-to-image registration between TM and HRG images wasconducted, using the HRG image as a reference image, so that both TM and HRG images havethe Universal Transverse Mercator coordinate system. A nearest-neighbor algorithm was usedto resample the TM images to 30-meter spatial resolution. A registration error of 0.1816 pixels(x error: 0.1409, y error: 0.1145) for the TM image was obtained during image registration.
Lu et al. Page 4
Photogramm Eng Remote Sensing. Author manuscript; available in PMC 2009 September 28.
NIH
-PA Author Manuscript
NIH
-PA Author Manuscript
NIH
-PA Author Manuscript
Many approaches, ranging from simple relative calibration and dark-object subtraction tocomplex model-based calibration approaches (e.g., the 6S radiative transfer code foratmospheric correction), have been developed for radiometric and atmospheric normalizationor correction (Chavez, 1996; Vermote et al., 1997; Tokola et al., 1999; Song et al., 2001; Cantyet al., 2004). Because the dark-object subtraction approach was strictly an image-basedprocedure, and corrected for the effects caused by sun zenith angle, solar radiance, andatmospheric scattering (Chavez, 1996; Lu et al., 2002), this approach was used in this studyfor atmospheric correction of TM and HRG images, based on the following equations:
(1)
(2)
(3)
In these equations, Lλ is the apparent at-satellite radiance for spectral band λ, DNλ is the digitalnumber for band λ, Aλ is the calibration factor for spectral band λ of the HRG image, and Rλ isthe calibrated reflectance. Lλ.haze is path radiance, Esunλ is exo-atmospheric solar irradiance,D is the distance between Earth and the Sun, and θ is the Sun zenith angle. The path radiancefor each band was identified based on the analysis of water bodies and shades in the images.
Wavelet-merging TechniqueImages from different sensors contain distinctive features. Integration of multi-sensor or multi-resolution data takes advantage of the strengths of distinct image data for improvement ofvisual interpretation and quantitative analysis. Solberg et al. (1996) broadly divided data fusionmethods into four categories: statistical, fuzzy logic, evidential reasoning, and neural network.Pohl and Van Genderen (1998) provided a literature review on the methods of multi-sensordata fusion. Of the many approaches, the intensity-hue-saturation (IHS) transform may be themost frequently used method for improving visual display of multi-sensor data (Welch andEhlers, 1987). However, the IHS approach can only employ three image bands and the resultantimage may not be suitable for further quantitative analysis, such as classification. Principalcomponent analysis (PCA) is often used for data fusion because it can produce an output thatcan better preserve the spectral integrity of the input dataset. In recent years, the wavelet-merging technique has shown to be another effective approach to generate a betterimprovement of spectral and spatial information contents (Li et al., 2002; Ulfarsson et al.,2003). Hence, the wavelet-merging technique was used in this research to integrate TM orHRG multispectral bands and the HRG panchromatic band.
The wavelet theory is similar to Fourier transform analysis, but the wavelet transform usesshort, discrete wavelets, instead of long continuous waves as in Fourier transforms. One keystep in wavelet transform is to select the mother wavelet. The input image is broken down intosuccessively smaller multiples of the mother wavelet. The derived wavelets have manymathematically useful characteristics that make them preferable to simple sine or cosinefunctions. Once the mother wavelet is defined, a family of multiples is created withincrementally increasing frequency. Then, the image is decomposed by applying coefficientsto each of the waveforms. In theory, an image can be decomposed into high-frequency andlow-frequency components. The low-frequency image is the lower spatial resolution imageand the high-frequency image is the higher spatial resolution image containing the details of
Lu et al. Page 5
Photogramm Eng Remote Sensing. Author manuscript; available in PMC 2009 September 28.
NIH
-PA Author Manuscript
NIH
-PA Author Manuscript
NIH
-PA Author Manuscript
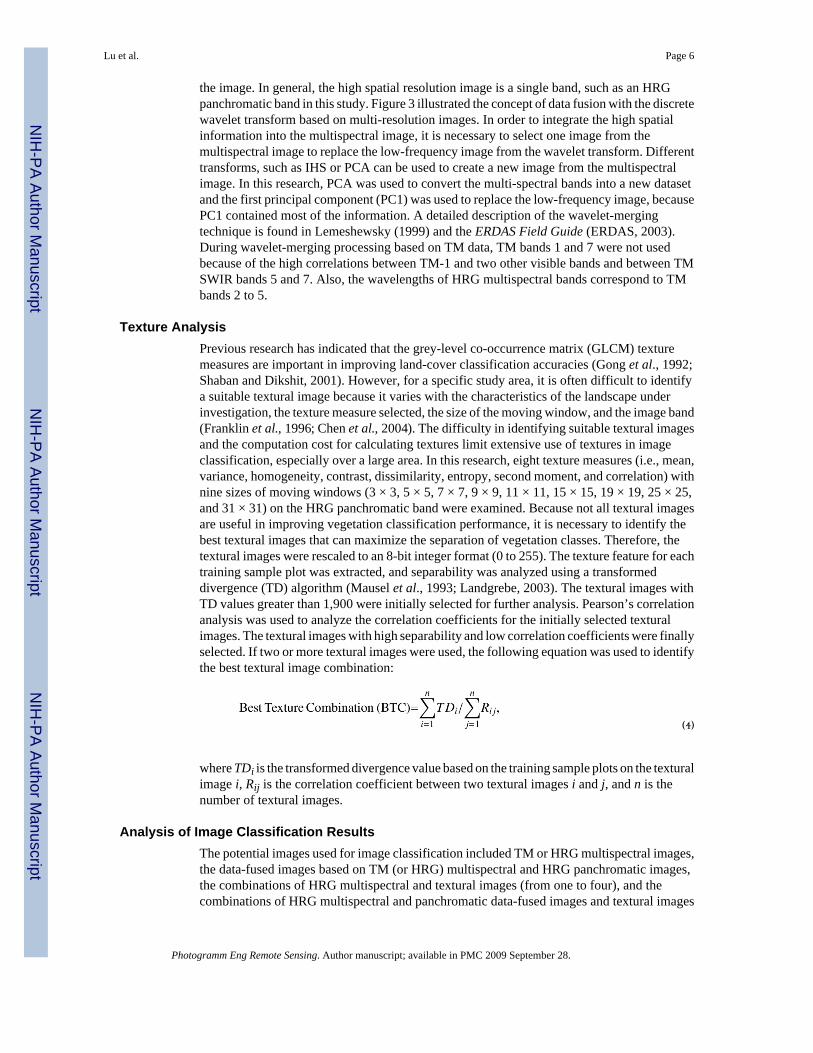
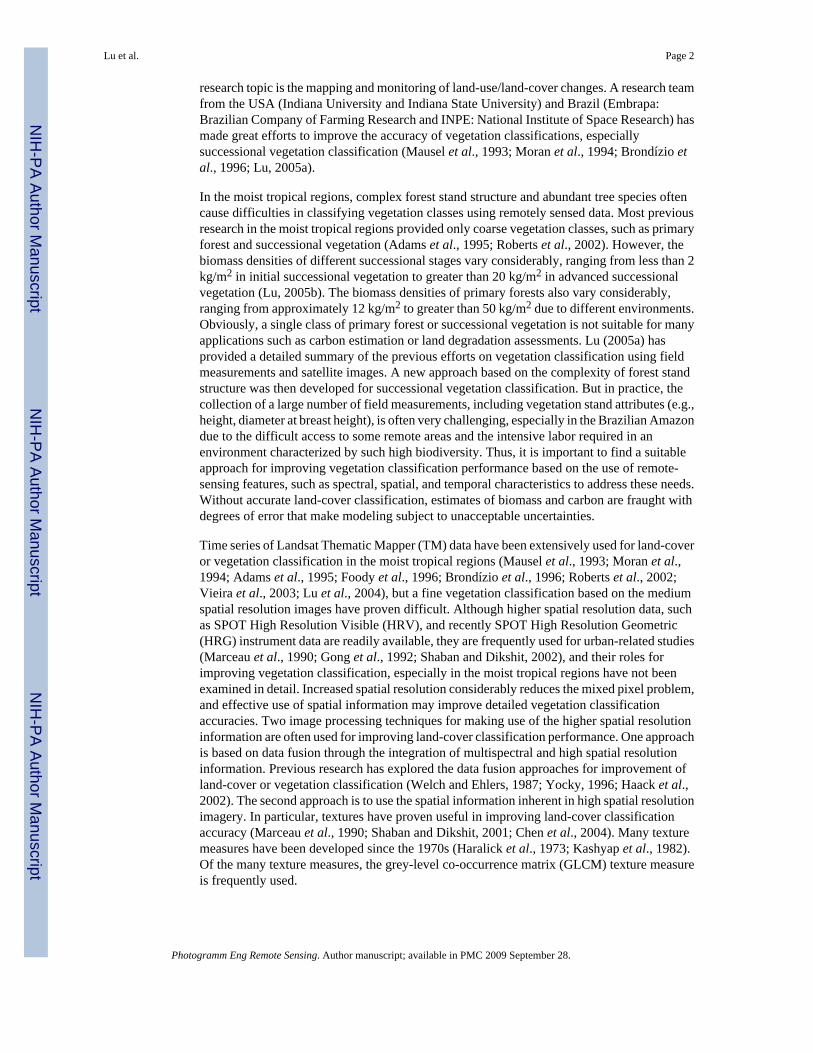
the image. In general, the high spatial resolution image is a single band, such as an HRGpanchromatic band in this study. Figure 3 illustrated the concept of data fusion with the discretewavelet transform based on multi-resolution images. In order to integrate the high spatialinformation into the multispectral image, it is necessary to select one image from themultispectral image to replace the low-frequency image from the wavelet transform. Differenttransforms, such as IHS or PCA can be used to create a new image from the multispectralimage. In this research, PCA was used to convert the multi-spectral bands into a new datasetand the first principal component (PC1) was used to replace the low-frequency image, becausePC1 contained most of the information. A detailed description of the wavelet-mergingtechnique is found in Lemeshewsky (1999) and the ERDAS Field Guide (ERDAS, 2003).During wavelet-merging processing based on TM data, TM bands 1 and 7 were not usedbecause of the high correlations between TM-1 and two other visible bands and between TMSWIR bands 5 and 7. Also, the wavelengths of HRG multispectral bands correspond to TMbands 2 to 5.
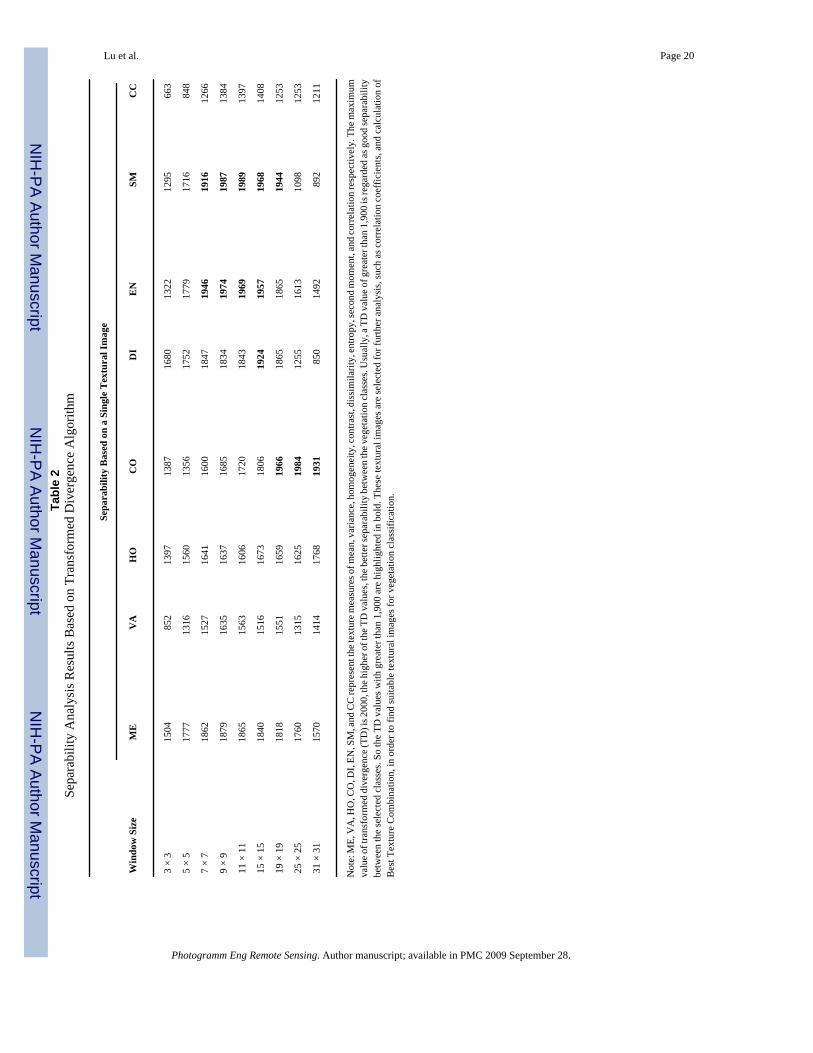
Texture AnalysisPrevious research has indicated that the grey-level co-occurrence matrix (GLCM) texturemeasures are important in improving land-cover classification accuracies (Gong et al., 1992;Shaban and Dikshit, 2001). However, for a specific study area, it is often difficult to identifya suitable textural image because it varies with the characteristics of the landscape underinvestigation, the texture measure selected, the size of the moving window, and the image band(Franklin et al., 1996; Chen et al., 2004). The difficulty in identifying suitable textural imagesand the computation cost for calculating textures limit extensive use of textures in imageclassification, especially over a large area. In this research, eight texture measures (i.e., mean,variance, homogeneity, contrast, dissimilarity, entropy, second moment, and correlation) withnine sizes of moving windows (3 × 3, 5 × 5, 7 × 7, 9 × 9, 11 × 11, 15 × 15, 19 × 19, 25 × 25,and 31 × 31) on the HRG panchromatic band were examined. Because not all textural imagesare useful in improving vegetation classification performance, it is necessary to identify thebest textural images that can maximize the separation of vegetation classes. Therefore, thetextural images were rescaled to an 8-bit integer format (0 to 255). The texture feature for eachtraining sample plot was extracted, and separability was analyzed using a transformeddivergence (TD) algorithm (Mausel et al., 1993; Landgrebe, 2003). The textural images withTD values greater than 1,900 were initially selected for further analysis. Pearson’s correlationanalysis was used to analyze the correlation coefficients for the initially selected texturalimages. The textural images with high separability and low correlation coefficients were finallyselected. If two or more textural images were used, the following equation was used to identifythe best textural image combination:
(4)
where TDi is the transformed divergence value based on the training sample plots on the texturalimage i, Rij is the correlation coefficient between two textural images i and j, and n is thenumber of textural images.
Analysis of Image Classification ResultsThe potential images used for image classification included TM or HRG multispectral images,the data-fused images based on TM (or HRG) multispectral and HRG panchromatic images,the combinations of HRG multispectral and textural images (from one to four), and thecombinations of HRG multispectral and panchromatic data-fused images and textural images
Lu et al. Page 6
Photogramm Eng Remote Sensing. Author manuscript; available in PMC 2009 September 28.
NIH
-PA Author Manuscript
NIH
-PA Author Manuscript
NIH
-PA Author Manuscript
(from one to four). The image classifications based on the extensive combinations attemptedto answer the following questions:
1. Comparing HRG and TM multispectral images, can the HRG image, with its higherspatial resolution, improve vegetation classification performance?
2. Comparing data-fused images between TM multispectral and HRG panchromaticimages and between HRG multispectral and panchromatic images, which one canprovide better vegetation classification accuracy? Can the data-fused images improvethe vegetation classification accuracy comparing their original multispectral images?
3. Can incorporation of textural images as extra bands into multispectral images improvevegetation classification performance? Can incorporation of textural images intoHRG multispectral-panchromatic data-fused images further improve vegetationclassification accuracy? How many textural images are suitable?
Before implementing image classification, all images, including multispectral and textural,were rescaled to 8-bit integer format (0 to 255). Then non-vegetation types (e.g., water, urbanand residential area, and bare soils) were masked, based on the analysis of an unsupervisedclassification (ISODATA) image on the HRG multispectral image. In the vegetated areas, aclassification system with nine vegetation types was adopted (see Table 1 for the characteristicsof each vegetation type). About 12 to 20 sample plots were selected for each class, with apolygon size of 9 to 40 pixels being used for each plot depending on the homogeneity of thevegetation type. A maximum likelihood classier was then used to classify each combinedimage. The same training sample plots were used to implement image classification for eachimage combination.
In order to evaluate the classification accuracy for each image combination, a common methodfor accuracy assessment is through the use of an error matrix. Previous literature has providedthe meanings and calculation methods for overall accuracy, producer’s accuracy, user’saccuracy, and kappa coefficient (Congalton, 1991; Smits et al., 1999; Foody, 2002). In thisstudy, a total of 306 test samples were used for accuracy assessment. Most of these test plotswere collected during fieldwork in 2002 and 2003. The HRG and Ikonos color compositeswere also used to collect more test samples based on visual interpretation. The second authorhas studied this area for more than a decade and collected extensive datasets through LBA andEmbrapa projects, which is important for the validation of the classification procedures. Theproducer’s accuracy and user’s accuracy for each class, and overall accuracy and kappacoefficient for each image combination were calculated based on the error matrix.
ResultsAnalysis of Textural Images
Different texture measures have various capabilities in separating vegetation classes. Differentsizes of the moving window on the same texture measure also affect this capability. Therefore,there exists a best combination of texture measure and size of moving window suitable for theseparation of vegetation classes. Table 2 summarized the separability analysis results of 72 testcases. It indicates that the size of the moving window is important in the separability ofvegetation classes. The best window size varies, depending on the use of texture measures. Forexample, the best sizes for entropy and second-moment texture measures were 9 × 9 and 11 ×11, respectively, but for dissimilarity and contrast texture measures, the best window sizeswere 15 × 15 and 25 × 25, respectively. In general, window sizes that were too small, such as3 × 3 and 5 × 5, or too large, such as 31 × 31, produced poor separability of vegetation classes.Some texture measures, such as entropy and second-moment texture measures, provided better
Lu et al. Page 7
Photogramm Eng Remote Sensing. Author manuscript; available in PMC 2009 September 28.
NIH
-PA Author Manuscript
NIH
-PA Author Manuscript
NIH
-PA Author Manuscript
separability of vegetation classes than others, such as variance and correlation texturemeasures.
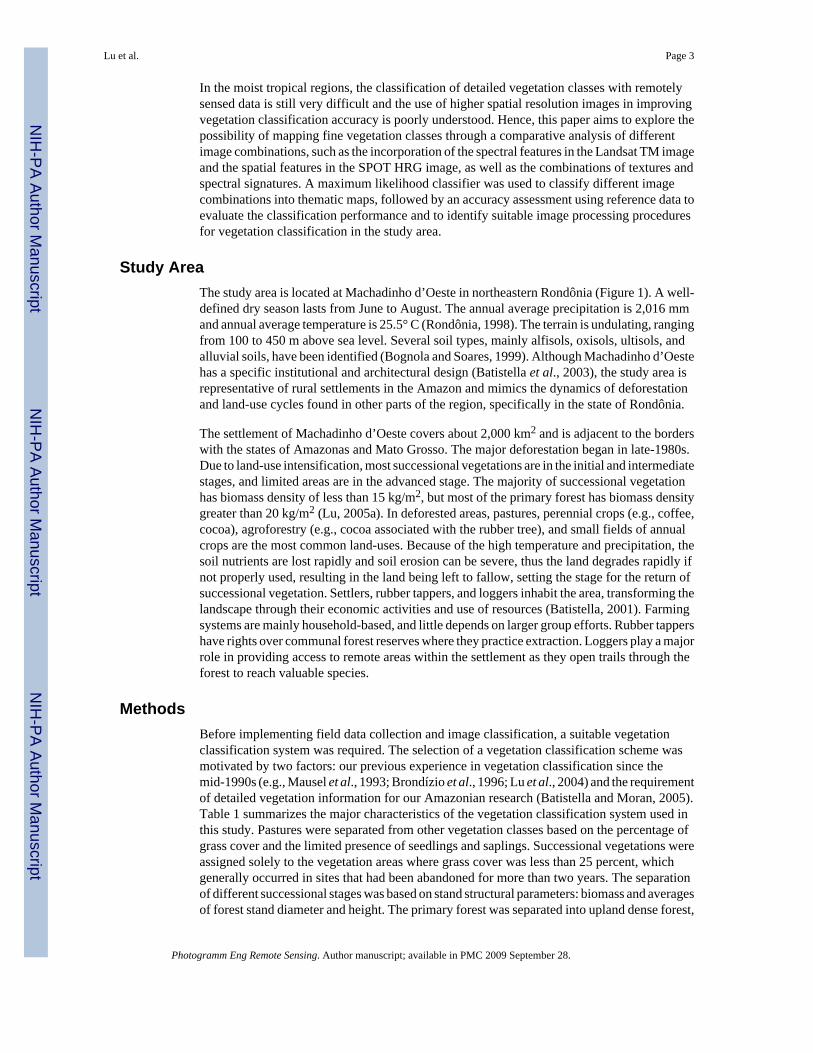
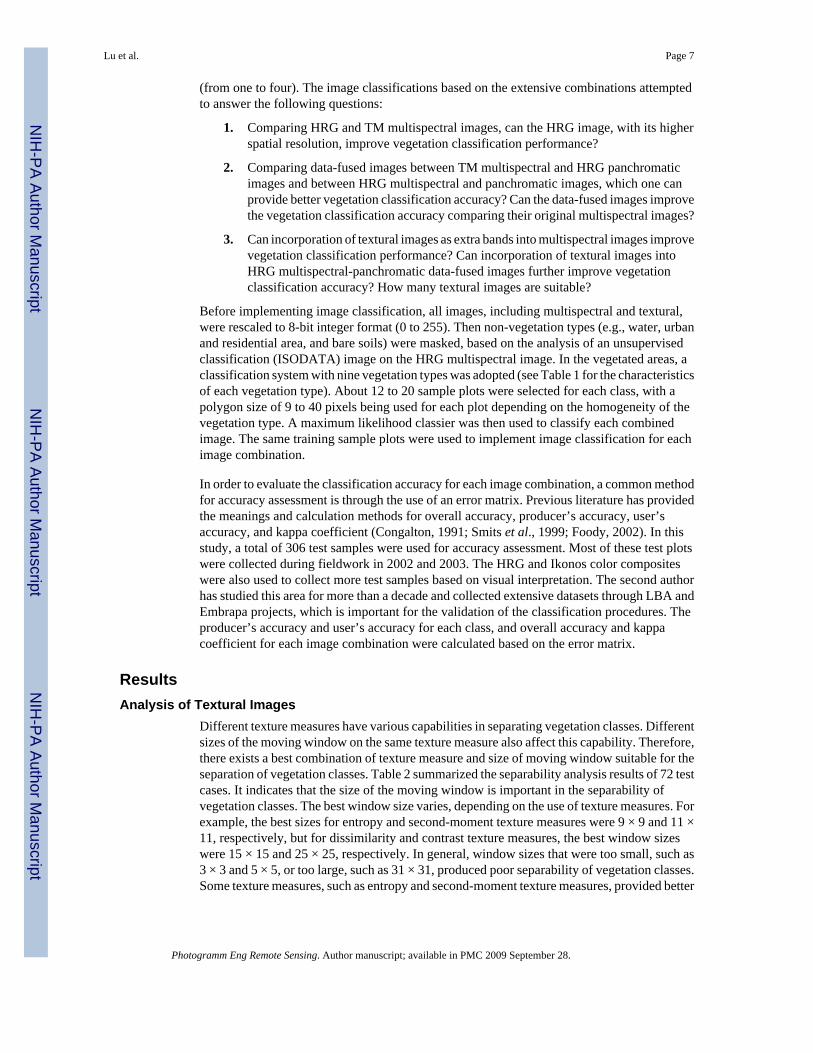
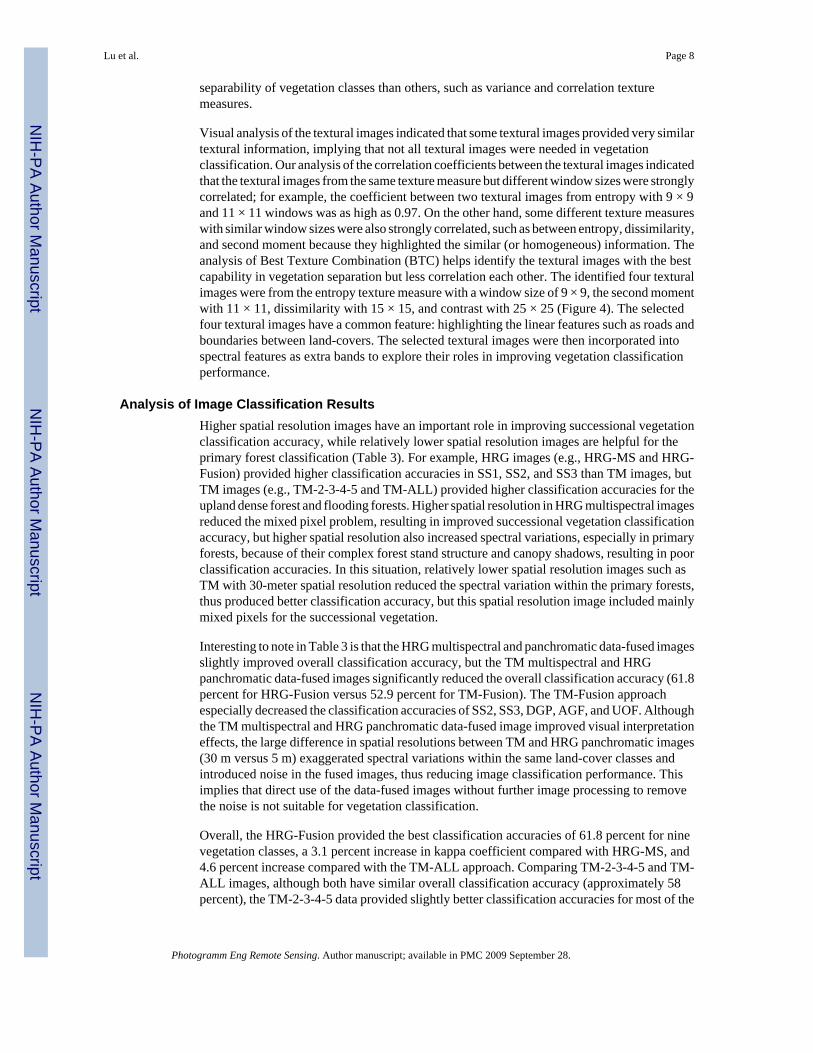
Visual analysis of the textural images indicated that some textural images provided very similartextural information, implying that not all textural images were needed in vegetationclassification. Our analysis of the correlation coefficients between the textural images indicatedthat the textural images from the same texture measure but different window sizes were stronglycorrelated; for example, the coefficient between two textural images from entropy with 9 × 9and 11 × 11 windows was as high as 0.97. On the other hand, some different texture measureswith similar window sizes were also strongly correlated, such as between entropy, dissimilarity,and second moment because they highlighted the similar (or homogeneous) information. Theanalysis of Best Texture Combination (BTC) helps identify the textural images with the bestcapability in vegetation separation but less correlation each other. The identified four texturalimages were from the entropy texture measure with a window size of 9 × 9, the second momentwith 11 × 11, dissimilarity with 15 × 15, and contrast with 25 × 25 (Figure 4). The selectedfour textural images have a common feature: highlighting the linear features such as roads andboundaries between land-covers. The selected textural images were then incorporated intospectral features as extra bands to explore their roles in improving vegetation classificationperformance.
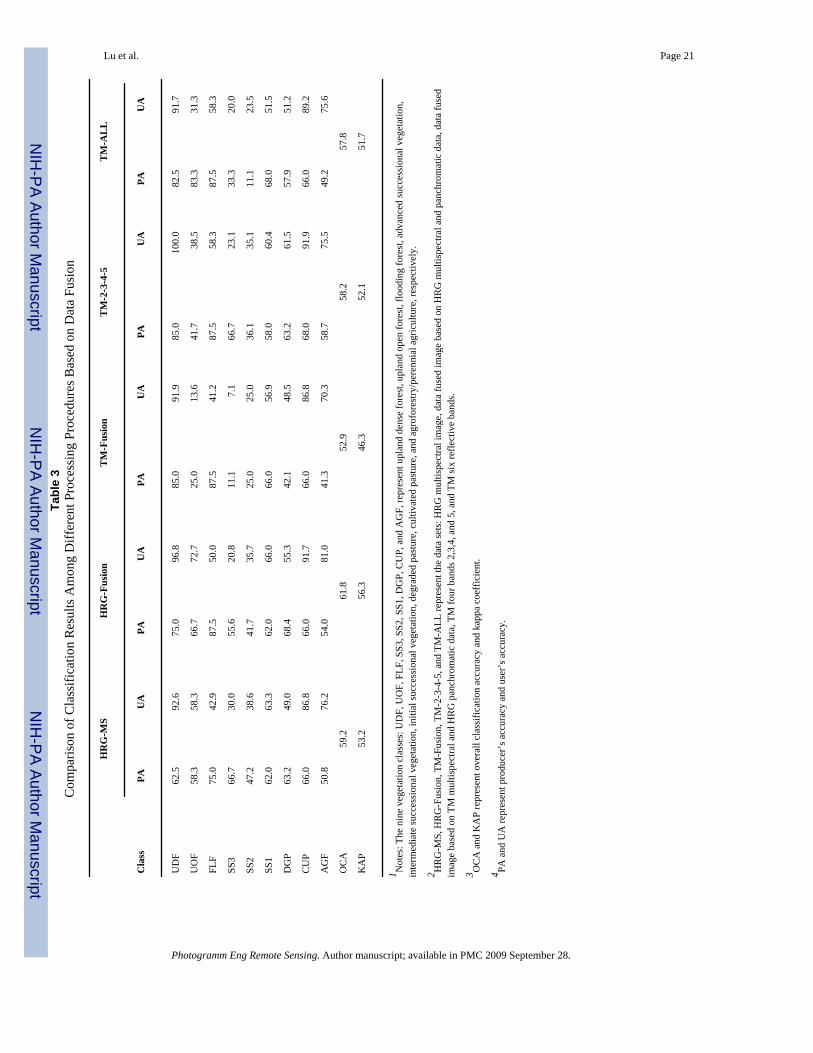
Analysis of Image Classification ResultsHigher spatial resolution images have an important role in improving successional vegetationclassification accuracy, while relatively lower spatial resolution images are helpful for theprimary forest classification (Table 3). For example, HRG images (e.g., HRG-MS and HRG-Fusion) provided higher classification accuracies in SS1, SS2, and SS3 than TM images, butTM images (e.g., TM-2-3-4-5 and TM-ALL) provided higher classification accuracies for theupland dense forest and flooding forests. Higher spatial resolution in HRG multispectral imagesreduced the mixed pixel problem, resulting in improved successional vegetation classificationaccuracy, but higher spatial resolution also increased spectral variations, especially in primaryforests, because of their complex forest stand structure and canopy shadows, resulting in poorclassification accuracies. In this situation, relatively lower spatial resolution images such asTM with 30-meter spatial resolution reduced the spectral variation within the primary forests,thus produced better classification accuracy, but this spatial resolution image included mainlymixed pixels for the successional vegetation.
Interesting to note in Table 3 is that the HRG multispectral and panchromatic data-fused imagesslightly improved overall classification accuracy, but the TM multispectral and HRGpanchromatic data-fused images significantly reduced the overall classification accuracy (61.8percent for HRG-Fusion versus 52.9 percent for TM-Fusion). The TM-Fusion approachespecially decreased the classification accuracies of SS2, SS3, DGP, AGF, and UOF. Althoughthe TM multispectral and HRG panchromatic data-fused image improved visual interpretationeffects, the large difference in spatial resolutions between TM and HRG panchromatic images(30 m versus 5 m) exaggerated spectral variations within the same land-cover classes andintroduced noise in the fused images, thus reducing image classification performance. Thisimplies that direct use of the data-fused images without further image processing to removethe noise is not suitable for vegetation classification.
Overall, the HRG-Fusion provided the best classification accuracies of 61.8 percent for ninevegetation classes, a 3.1 percent increase in kappa coefficient compared with HRG-MS, and4.6 percent increase compared with the TM-ALL approach. Comparing TM-2-3-4-5 and TM-ALL images, although both have similar overall classification accuracy (approximately 58percent), the TM-2-3-4-5 data provided slightly better classification accuracies for most of the
Lu et al. Page 8
Photogramm Eng Remote Sensing. Author manuscript; available in PMC 2009 September 28.
NIH
-PA Author Manuscript
NIH
-PA Author Manuscript
NIH
-PA Author Manuscript
vegetation classes than TM-ALL data, implying that the addition of more spectral bands withhigh correlation coefficients to each other may decrease classification accuracy.
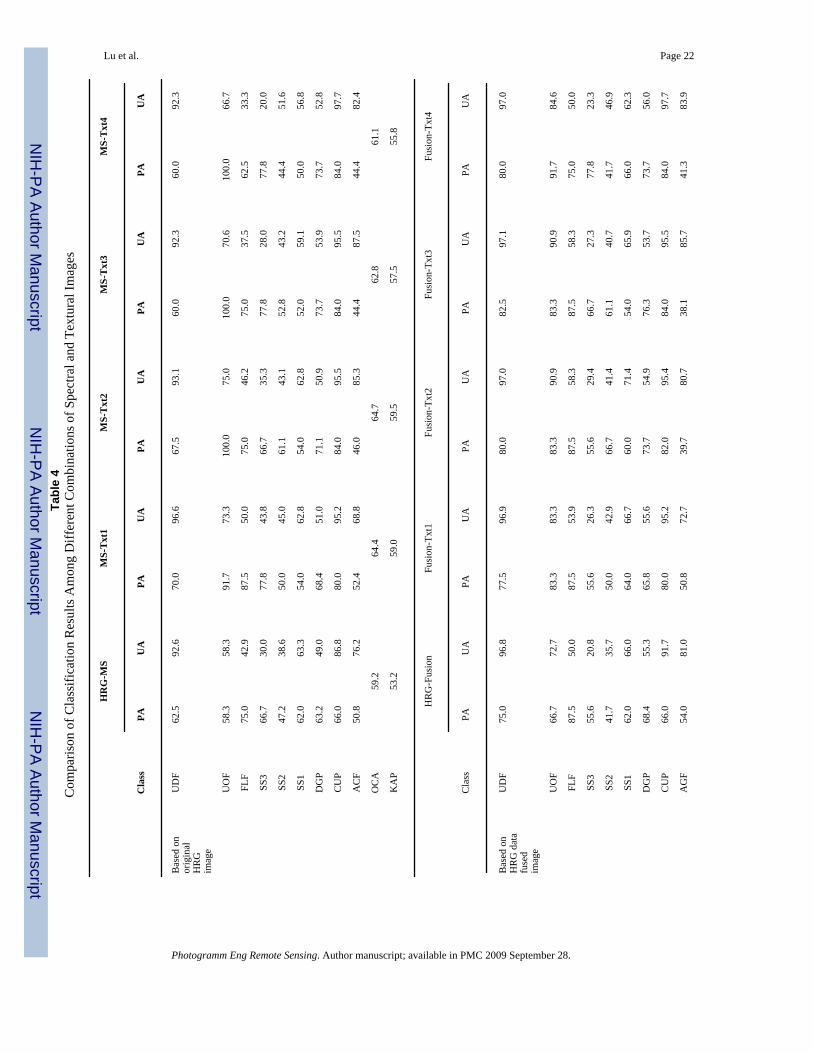
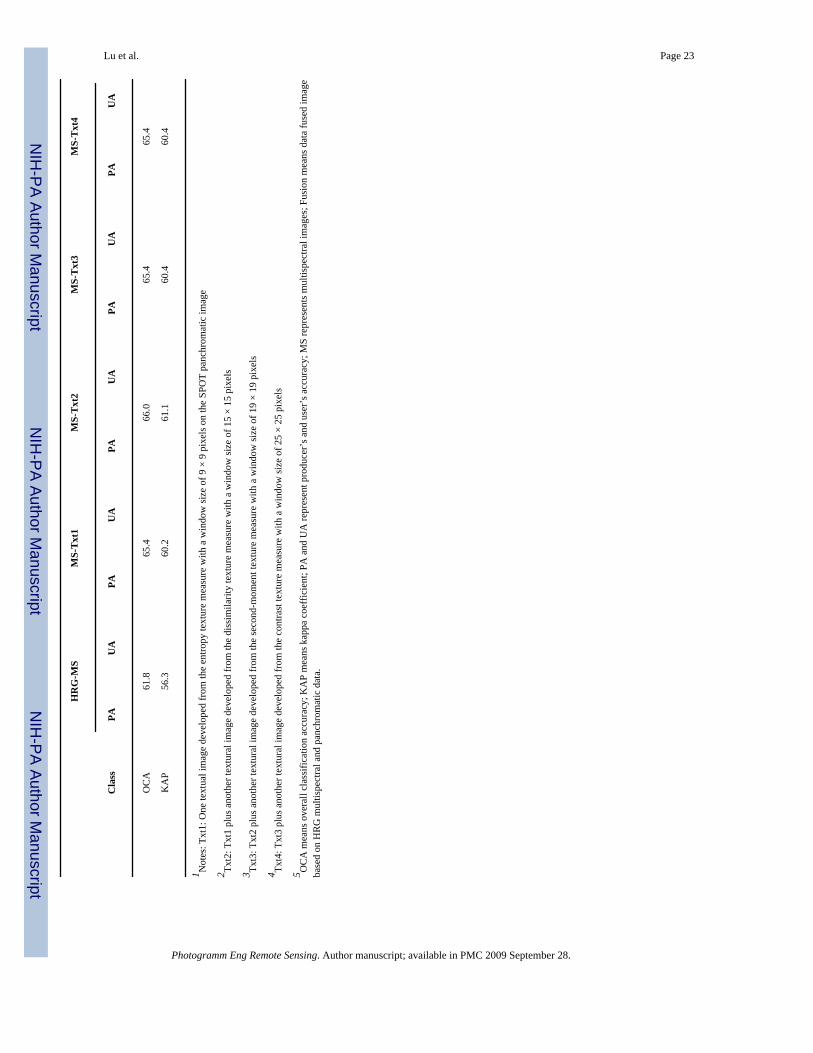
Incorporation of textural and multispectral images improved vegetation classificationperformance (Table 4). For example, the combination of entropy texture image and HRGmultispectral image (MS-Txt1) improved the vegetation classification accuracies for all exceptSS1. Overall classification accuracy and kappa coefficient were increased by 5.2 percent and5.8 percent, respectively, compared with the results from the original HRG multispectral image.The incorporation of textural images and HRG-Fusion images, as well as two textural and HRGmultispectral images (MS-Txt2) can further improve the classification accuracy. However, useof more textural images (e.g., MS-Txt3, MS-Txt4, or Fusion-Txt3 and Fusion-Txt4) cannotfurther improve classification accuracy because of the correlation between the images. Table4 also indicates that use of textural images was especially helpful in improving primary forestclassification. This implies that textural images can reduce the spectral variations of primaryforests caused by complex forest stand structure and canopy shadows in the high spatialresolution image.
DiscussionThe complex biophysical environments in the moist tropical region may be the most importantfactor resulting in the difficulty of vegetation classification. Based on the vegetation verticalstructure complexity (Lu, 2005a), a concept showing the relationships among the vegetationtypes is illustrated in Figure 5. Degraded pastures can be regarded as a transition betweencultivated pastures and SS1, because some saplings and seedlings appeared in degradedpastures indicating the degraded pastures may become SS1 after a couple years, if they are notproperly managed. Also, if no disturbance occurs, SS1 will progress to SS2 and then to SS3.However, there are no clear boundaries between the adjacent stages that separate SS2 fromSS1 and SS3 because of the smooth transitions in their vegetation stand structures. Therefore,classification of successional vegetation stages is often difficult, even on the ground. Anotherdifficulty is separating AGF from successional vegetations. The agroforestry/perennialagriculture class can include a variety of vegetation types, from coffee, cocoa, or rubber treeplantations to arrangements of many plants, including successional and economic species. Thisclass is often confused with different successional stages, especially SS2. Also, agroforestry/perennial agriculture and different successional vegetation stages usually appeared in smallpatches in the landscape (i.e., 0.5 to 3 ha). This implies that most of these vegetation typesappear on Landsat TM images as mixed pixels. This often results in difficulty in collectingsufficient and suitable training and test samples for these vegetation classes. The trend towardland-use intensification has reduced the extension of successional vegetation patches andshortened the cycle of conversion of fallow areas into agricultural production. Thus, use ofsubpixel information benefit these vegetation classification accuracies (Roberts et al., 2002;Lu et al., 2003b). In this study area, lack of typical SS3 samples is another important factorresulting in poor SS3 classification accuracy. The selected SS3 samples are mainly in earlystages of advanced secondary succession and often confused with old SS2 vegetation becauseof their similar vegetation stand structure. The limitation in finding SS3 areas also createddifficulties for the selection of sufficient test sample plots for accuracy assessment. In thissituation, the use of expert rules based on the forest stand structure can significantly improvethe classification accuracies (Lu, 2005a).
Classification of primary forests into multiple classes is also a challenge because the similarforest stand structures and the influence of canopy shadows which leads to data saturation inoptical remote-sensing data. However, the abundant moisture can reduce the reflectance valuesof flooding forests. Poor soil conditions and the topographic effects of upland open forests onsteep slopes may produce different tree species composition and vegetation vigor compared to
Lu et al. Page 9
Photogramm Eng Remote Sensing. Author manuscript; available in PMC 2009 September 28.
NIH
-PA Author Manuscript
NIH
-PA Author Manuscript
NIH
-PA Author Manuscript
upland dense forests. Conversely, non-forest vegetations (e.g., successional vegetations,agroforestry) are usually distributed in relatively flat areas with easy access. Topography andmoisture are not important factors in separating successional vegetation stages in this studyarea.
The optical sensor data, such as Landsat TM and SPOT HRG that mainly capture canopy andassociated shadow information, create difficulties in vegetation classification. The shadowproblem often reduces vegetation reflectance, and the complex forest stand structure causesdata saturation making it difficult to classify forest and advanced successional vegetationclasses, even though their biomass densities may vary significantly (Lu, 2005b). Use of radardata, especially the long wavelengths such as L- and P-bands, may improve the vegetationclassification because radar can penetrate the canopy to a certain depth to capture moreinformation under the canopy (Leckie, 1998; Santos et al., 2003). The integration of opticalsensor and radar data may provide new insights for vegetation classification in the moisttropical regions.
This research has shown the importance of high spatial resolution images in improvingvegetation classification accuracies, especially the successional vegetation. High spatialresolution images greatly reduce the mixed pixel problem because non-forest vegetation oftenhas small patch sizes on the ground. On the other hand, high spatial resolution images haverich spatial information, but also show high spectral variation within the same land-cover class.Effective use of spatial information and reduction of the impacts of spectral variation are criticalfor improving overall classification performance. This study has indicated the importance oftextural images in improving vegetation classification accuracies. One critical step in a studyis to identify suitable textural images that can provide the best separability for the specifiedclasses. However, selection of suitable textural images is still a challenge, because texturesvary with the characteristics of the landscape under investigation and images used. In particular,the selection of a suitable size of moving window is important for a textural image, but nowindow size is perfect for all vegetation types because the field sizes of the vegetation typesvary greatly, i.e., from less than one hectare for some successional vegetation and agroforestryto hundreds of hectares for some primary forests. Therefore, there are tradeoffs among movingwindow size, spatial resolution of images, and the sizes of vegetation types on the ground. Forthis study, the selection of window size is based on the overall separability of vegetation types,but the best window size for extraction of textural images for the separation of non-forestvegetation types and the separation of primary forest classes may vary because of their differentvegetation stand structures and patch sizes. A stratification of primary forests and non-forestvegetation types may be necessary before the selection of suitable textural images. Twoapproaches may be used to evaluate the textural images: qualitative assessment based on visualinterpretation to see whether the specified information was highlighted or not on the selectedtextural image; and quantitative analysis, such as the calculation of separability of vegetationclasses based on training samples, as used in this paper. For the selection of a single texturalimage, one can select the textural image with highest separability, but for the selection of twoor more textural images, the BTC approach developed in this paper provides an easy way toidentify the suitable combination of textural images that can be used for improvingclassification performance.
ConclusionsHigh spatial resolution images benefit the classification of successional vegetation stages, andrelatively low spatial resolution is useful for primary forests. The incorporation of texturalimages into an HRG multispectral image is an effective approach to improve vegetationclassification performance. The entropy or second-moment texture measure with a windowsize of 9 × 9 or 11 × 11 pixels provided the best separability for vegetation classes. Overall,
Lu et al. Page 10
Photogramm Eng Remote Sensing. Author manuscript; available in PMC 2009 September 28.
NIH
-PA Author Manuscript
NIH
-PA Author Manuscript
NIH
-PA Author Manuscript

vegetation classification with optical sensor data in the moist tropical region remains difficult,especially for the separation of different successional vegetation stages and the separation ofagroforestry from other non-forest vegetation types. More research is needed to incorporateoptical sensor and radar data to improve vegetation classification.
AcknowledgmentsThe authors wish to thank the three anonymous reviewers for their constructive suggestions and comments. The authorsalso thank the National Science Foundation (Grant #99-06826), the National Aeronautics and Space Administration(Grant #NCC5-695), and the Brazil’s Embrapa Satellite Monitoring for their support. This project is part of the LargeScale Biosphere-Atmosphere Experiment in Amazônia (LBA) Program, LC-09 and LC-34, which aims to examinethe human and physical dimensions of land-use/land-cover change.
ReferencesAdams JB, Sabol DE, Kapos V, Filho RA, Roberts DA, Smith MO, Gillespie AR. Classification of multi-
spectral images based on fractions of endmembers: Application to land-cover change in the BrazilianAmazon. Remote Sensing of Environment 1995;52:137–154.
Batistella, M. PhD dissertation. Indiana University, Bloomington; Indiana: 2001. Landscape Change andLand-use/Land-cover Dynamics in Rondônia, Brazilian Amazon; p. 399
Batistella M, Robeson S, Moran EF. Settlement design, forest fragmentation, and landscape change inRondônia, Amazônia. Photogrammetric Engineering & Remote Sensing 2003;69:805–812.
Batistella M, Moran EF. Dimensões humanas do uso e cobertura das terras na Amazônia: Umacontribuição do LBA. Acta Amazonica 2005;35:239–247.
Bognola, IA.; Soares, AF. Pesquisa em Andamento. Vol. 10. Embrapa Monitoramento por Satélite;Campinas, Brazil: 1999. Solos das “glebas 01, 02, 03 e 06” do Município de Machadinho d’Oeste,RO; p. 7
Brondízio ES, Moran EF, Mausel P, Wu Y. Land cover in the Amazon estuary: Linking of the ThematicMapper with botanical and historical data. Photogrammetric Engineering & Remote Sensing 1996;62(9):921–929.
Canty MJ, Nielsen AA, Schmidt M. Automatic radiometric normalization of multitemporal satelliteimagery. Remote Sensing of Environment 2004;91:441–451.
Chavez PS Jr. Image-based atmospheric corrections Revisited and improved. PhotogrammetricEngineering & Remote Sensing 1996;62(10):1025–1036.
Chen D, Stow DA, Gong P. Examining the effect of spatial resolution and texture window size onclassification accuracy: An urban environment case. International Journal of Remote Sensing2004;25:2177–2192.
Congalton RG. A review of assessing the accuracy of classification of remotely sensed data. RemoteSensing of Environment 1991;37:35–46.
ERDAS. ERDAS Field Guide. Vol. 7. Leica Geosystems GIS & Mapping, LLC; Atlanta, Georgia: 2003.Foody GM, Palubinskas G, Lucas RM, Curran PJ, Honzák M. Identifying terrestrial carbon sinks:
Classification of successional stages in regenerating tropical forest from Landsat TM data. RemoteSensing of Environment 1996;55:205–216.
Foody GM. Status of land cover classification accuracy assessment. Remote Sensing of Environment2002;80:185–201.
Franklin SE, Wulder MA, Lavigne MB. Automated derivation of geographic window sizes for remotesensing digital image texture analysis. Computers and Geosciences 1996;22:665–673.
Gong P, Marceau DJ, Howarth PJ. A comparison of spatial feature extraction algorithms for land-useclassification with SPOT HRV data. Remote Sensing of Environment 1992;40:137–151.
Haack BN, Solomon EK, Bechdol MA, Herold ND. Radar and optical data comparison/integration forurban delineation: A case study. Photogrammetric Engineering & Remote Sensing 2002;68(12):1289–1296.
Haralick RM, Shanmugam K, Dinstein I. Textural features for image classification. IEEE Transactionson Systems, Man and Cybernetics 1973;SMC-3:610–620.
Lu et al. Page 11
Photogramm Eng Remote Sensing. Author manuscript; available in PMC 2009 September 28.
NIH
-PA Author Manuscript
NIH
-PA Author Manuscript
NIH
-PA Author Manuscript

Kashyap RL, Chellappa R, Khotanzad A. Texture classification using features derived from random fieldmodels. Pattern Recognition Letters 1982;1:43–50.
Landgrebe, DA. Signal Theory Methods in Multispectral Remote Sensing. Hoboken, New Jersey: JohnWiley and Sons; 2003. p. 508
Laurance W, Albernaz AKM, Fearnside PM, Vasconcelos HL, Ferreira LV. Deforestation in Amazonia.Science 2004;304:1109. [PubMed: 15155931]
Leckie, DG. Forestry applications using imaging radar. In: Henderson, FM.; Lewis, AJ., editors.Principles and Applications of Imaging Radar, Manual of Remote Sensing. Vol. 3. Vol. 2. John Wileyand Sons; New York: 1998. p. 437-509.
Lemeshewsky, GP. Multispectral multisensor image fusion using wavelet transforms. In: Park, SK.;Juday, R., editors. Visual Image Processing VIII; Proceedings of SPIE 3716; 1999. p. 214-222.
Li S, Kwok JT, Wang Y. Using the discrete wavelet frame transform to merge Landsat TM and SPOTpanchromatic images. Information Fusion 2002;3:17–23.
Lu D. Integration of vegetation inventory data and Landsat TM image for vegetation classification in thewestern Brazilian Amazon. Forest Ecology and Management 2005a;213:369–383.
Lu D. Aboveground biomass estimation using Landsat TM data in the Brazilian Amazon. InternationalJournal of Remote Sensing 2005b;26:2509–2525.
Lu D, Mausel P, Brondízio E, Moran E. Assessment of atmospheric correction methods for Landsat TMdata applicable to Amazon basin LBA research. International Journal of Remote Sensing2002;23:2651–2671.
Lu D, Mausel P, Brondízio E, Moran E. Classification of successional forest stages in the BrazilianAmazon basin. Forest Ecology and Management 2003a;181:301–312.
Lu D, Moran E, Batistella M. Linear mixture model applied to Amazônian vegetation classification.Remote Sensing of Environment 2003b;87:456–469.
Lu D, Mausel P, Batistella M, Moran E. Comparison of land-cover classification methods in the BrazilianAmazon basin. Photogrammetric Engineering & Remote Sensing 2004;70(7):723–731.
Lucas RM, Honzák M, Curran PJ, Foody GM, Milne R, Brown T, Amaral S. The regeneration of tropicalforests within the Legal Amazon. International Journal of Remote Sensing 2000;21:2855–2881.
Marceau DJ, Howarth PJ, Dubois JM, Gratton DJ. Evaluation of the grey-level co-occurrence matrixmethod for land-cover classification using SPOT imagery. IEEE Transactions on Geoscience andRemote Sensing 1990;28:513–519.
Mausel P, Wu Y, Li Y, Moran E, Brondízio E. Spectral identification of succession stages followingdeforestation in the Amazon. Geocarto International 1993;8:61–72.
Moran EF, Brondízio E, Mausel P, Wu Y. Integrating Amazonian vegetation, land use, and satellite data.Bioscience 1994;44:329–338.
Pohl C, van Genderen JL. Multisensor image fusion in remote sensing: Concepts, methods, andapplications. International Journal of Remote Sensing 1998;19:823–854.
Roberts DA, Numata I, Holmes K, Batista G, Krug T, Monteiro A, Powell B, Chadwick OA. Large areamapping of land-cover change in Rondonia using decision tree classifiers. Journal of GeophysicalResearch 2002;107(D20):8073 LBA 40-1–40-18.
Rondônia. Diagnóstico Sócio-econômico do Estado de Rondônia e Assistência Técnica para Formulaçãoda Segunda Aproximação do Zoneamento Sócio-econômico-ecológico – Climatologia. Vol. 1.Governo de Rondônia/PLANAFLORO; Porto Velho, Brasil: 1998.
Santos JR, Freitas CC, Araujo LS, Dutra LV, Mura JC, Gama FF, Soler LS, Sant’ Anna SJS. AirborneP-band SAR applied to the aboveground biomass studies in the Brazilian tropical rainforest. RemoteSensing of Environment 2003;87:482–493.
Shaban MA, Dikshit O. Improvement of classification in urban areas by the use of textural features: Thecase study of Lucknow city, Uttar Pradesh. International Journal of Remote Sensing 2001;22:565–593.
Shaban MA, Dikshit O. Evaluation of the merging of SPOT multispectral and panchromatic data forclassification of an urban environment. International Journal of Remote Sensing 2002;23:249–262.
Skole DL, Chomentowski WH, Salas WA, Nobre AD. Physical and human dimension of deforestationin Amazonia. BioScience 1994;44:314–328.
Lu et al. Page 12
Photogramm Eng Remote Sensing. Author manuscript; available in PMC 2009 September 28.
NIH
-PA Author Manuscript
NIH
-PA Author Manuscript
NIH
-PA Author Manuscript

Smits PC, Dellepiane SG, Schowengerdt RA. Quality assessment of image classification algorithms forland-cover mapping: A review and a proposal for a cost-based approach. International Journal ofRemote Sensing 1999;20:1461–1486.
Solberg AHS, Taxt T, Jain AK. A Markov random field model for classification of multisource satelliteimagery. IEEE Transactions on Geoscience and Remote Sensing 1996;34:100–112.
Song C, Woodcock CE, Seto KC, Lenney MP, Macomber SA. Classification and change detection usingLandsat TM data: When and how to correct atmospheric effect. Remote Sensing of Environment2001;75:230–244.
Tokola T, Löfman S, Erkkilä A. Relative calibration of multitemporal Landsat data for forest cover changedetection. Remote Sensing of Environment 1999;68:1–11.
Ulfarsson MO, Benediktsson JA, Sveinsson JR. Data fusion and feature extraction in the wavelet domain.International Journal of Remote Sensing 2003;24:3933–3945.
Vermote E, Tanre D, Deuze JL, Herman M, Morcrette JJ. Second simulation of the satellite signal in thesolar spectrum, 6S: An overview. IEEE Transactions on Geoscience and Remote Sensing1997;35:675–686.
Vieira ICG, de Almeida AS, Davidson EA, Stone TA, de Carvalho CJR, Guerrero JB. Classifyingsuccessional forests using Landsat spectral properties and ecological characteristics in easternAmazonia. Remote Sensing of Environment 2003;87:470–481.
Welch R, Ehlers M. Merging multi-resolution SPOT HRV and Landsat TM data. PhotogrammetricEngineering & Remote Sensing 1987;53(3):301–303.
Yocky DA. Multiresolution wavelet decomposition image merger of Landsat Thematic Mapper andSPOT panchromatic data. Photogrammetric Engineering & Remote Sensing 1996;62(10):1067–1074.
Lu et al. Page 13
Photogramm Eng Remote Sensing. Author manuscript; available in PMC 2009 September 28.
NIH
-PA Author Manuscript
NIH
-PA Author Manuscript
NIH
-PA Author Manuscript
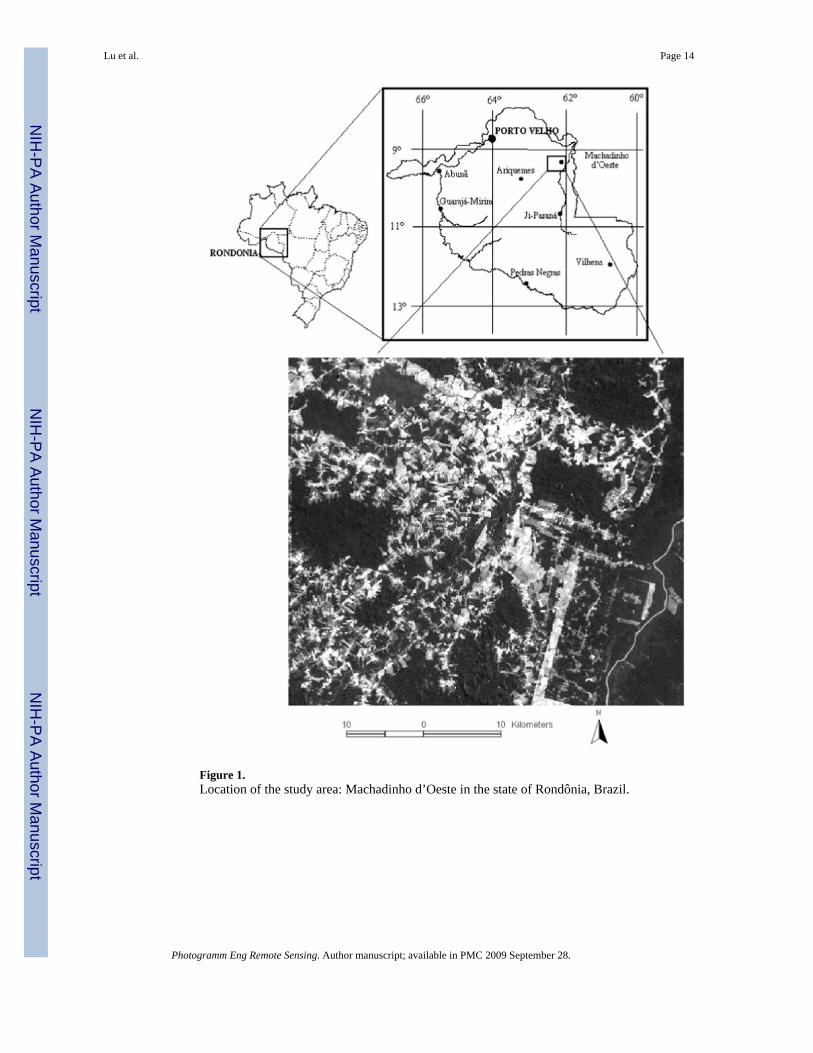
Figure 1.Location of the study area: Machadinho d’Oeste in the state of Rondônia, Brazil.
Lu et al. Page 14
Photogramm Eng Remote Sensing. Author manuscript; available in PMC 2009 September 28.
NIH
-PA Author Manuscript
NIH
-PA Author Manuscript
NIH
-PA Author Manuscript
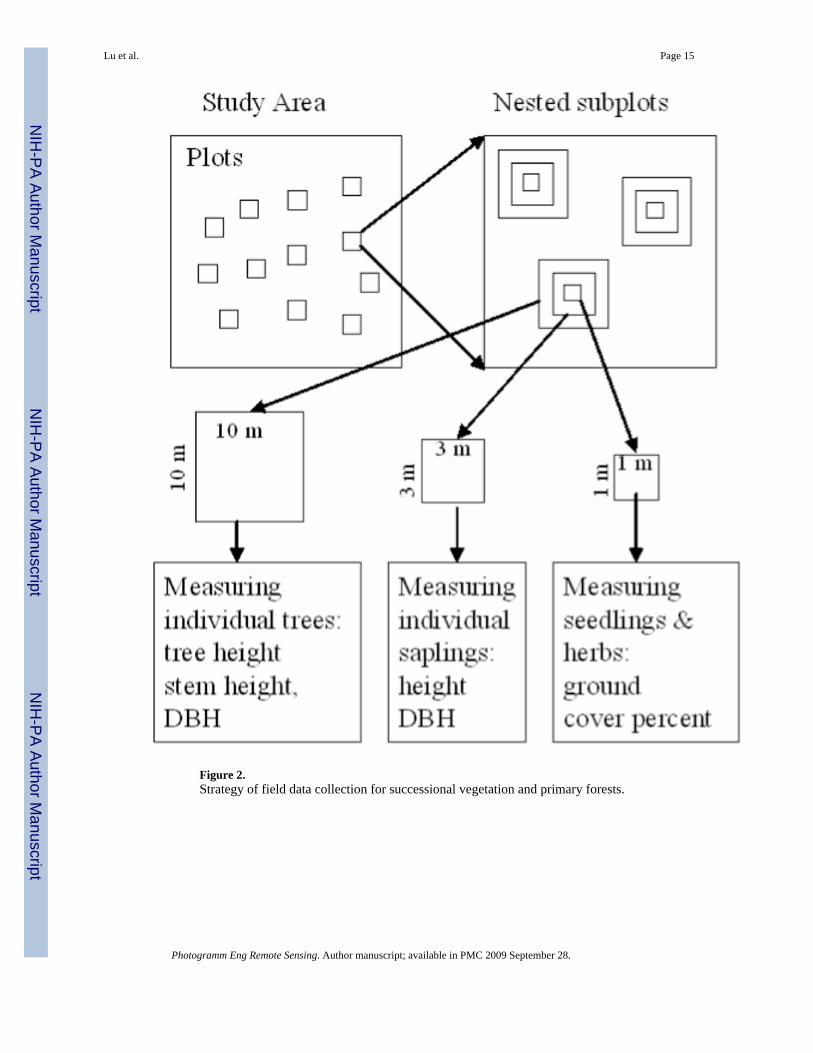
Figure 2.Strategy of field data collection for successional vegetation and primary forests.
Lu et al. Page 15
Photogramm Eng Remote Sensing. Author manuscript; available in PMC 2009 September 28.
NIH
-PA Author Manuscript
NIH
-PA Author Manuscript
NIH
-PA Author Manuscript

Figure 3.Wavelet-merging approach based on multiple spatial resolution images (PCA and PC1represent principal component analysis and the first principal component, DWT and IDWTrepresent discrete wavelet transform and inverse discrete wavelet transform, HP and LPrepresent high pass and low pass, and c and r represent column and row decimation)
Lu et al. Page 16
Photogramm Eng Remote Sensing. Author manuscript; available in PMC 2009 September 28.
NIH
-PA Author Manuscript
NIH
-PA Author Manuscript
NIH
-PA Author Manuscript
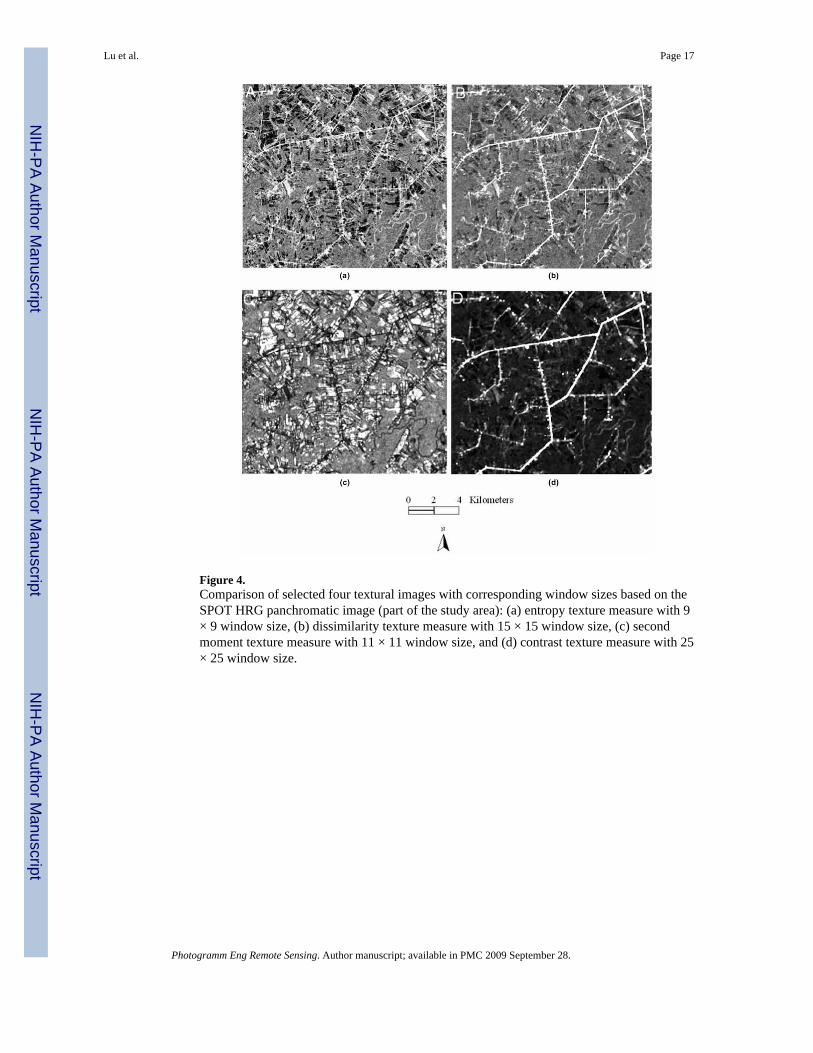
Figure 4.Comparison of selected four textural images with corresponding window sizes based on theSPOT HRG panchromatic image (part of the study area): (a) entropy texture measure with 9× 9 window size, (b) dissimilarity texture measure with 15 × 15 window size, (c) secondmoment texture measure with 11 × 11 window size, and (d) contrast texture measure with 25× 25 window size.
Lu et al. Page 17
Photogramm Eng Remote Sensing. Author manuscript; available in PMC 2009 September 28.
NIH
-PA Author Manuscript
NIH
-PA Author Manuscript
NIH
-PA Author Manuscript
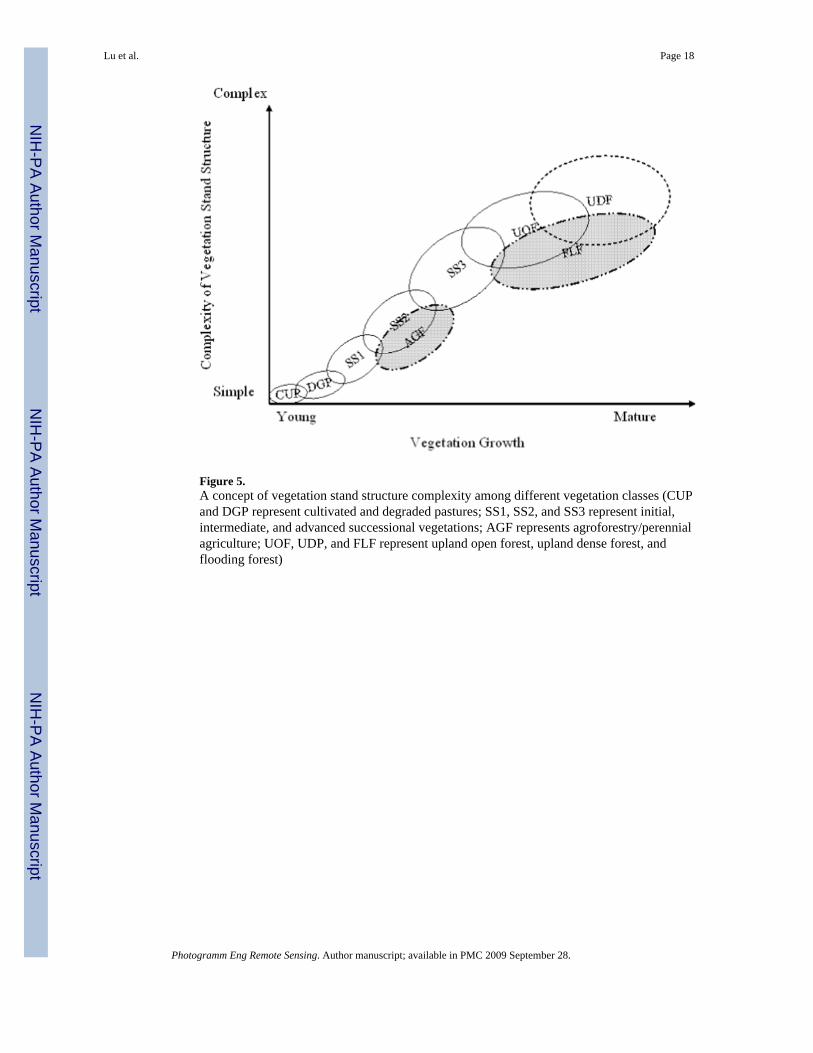
Figure 5.A concept of vegetation stand structure complexity among different vegetation classes (CUPand DGP represent cultivated and degraded pastures; SS1, SS2, and SS3 represent initial,intermediate, and advanced successional vegetations; AGF represents agroforestry/perennialagriculture; UOF, UDP, and FLF represent upland open forest, upland dense forest, andflooding forest)
Lu et al. Page 18
Photogramm Eng Remote Sensing. Author manuscript; available in PMC 2009 September 28.
NIH
-PA Author Manuscript
NIH
-PA Author Manuscript
NIH
-PA Author Manuscript
NIH
-PA Author Manuscript
NIH
-PA Author Manuscript
NIH
-PA Author Manuscript
Lu et al. Page 19
Table 1Characteristics of Vegetation Types
Vegetation Types Parameters Main Characteristics
Cultivated pasture (CUP) Grass > 75% Pastures managed to keep the dominance of grass species
Degraded pasture (DGP) Grass ranges from 25% to75%
Limited seedlings and saplings appeared in the ground
Agroforestry/Perennial agriculture (AGF) Coffee, rubber, banana, cacao plantations or theirassociation with other economic or non-economic species
Initial succession (SS1) ASD: 2 to 5ASH: 2 to 6AGB: 0.5 to 5Age: 1 to 5
Herbaceous plants, seedlings, and saplings together areresponsible for over 90 percent of total biomass, with avertical structure characterized by a full profile of saplingsand herbaceous plants. Saplings are the main structureelement and represent the majority of the abovegroundbiomass.
Intermediate succession (SS2) ASD: 5 to 15ASH: 6 to 12AGB: 4 to 10Age: 4 to 15
Saplings still account for most of the biomass in SS2.Vegetation structure provides a mix of dense ground coverof saplings and young trees with higher canopy than SS1and small internal differences between canopy andunderstory individuals. Stratification between canopy andunderstory begins in SS2.
Advanced succession (SS3) ASD: 10 to 25ASH: 9 to 17AGB: 8 to 25Age: 10 to 50
Stratification is obvious in SS3 with trees dominating thecanopy. In this stage, there is a major shift in structure thatdifferentiates understory from canopy individuals; that is,the presence of saplings is less significant than that oftrees. One can find differences between the canopy andunderstory in terms of height and density of species.
Upland dense forest (UDF) ASD: 17 to 30ASH: 12 to 25AGB: 20 to 50
In a typical primary forest, trees account for the majorityof the aboveground biomass, reaching over 90 percent.Large trees occupy the canopy. Trees with DBH of 25 to30 cm dominate, and a considerable number of individualshave a DBH over 40 cm. Many tree individuals are tallerthan 17 m and some between 25 and 30 m are present,followed by a few scattered emergent individuals over 35m high.
Upland open forest (UOF) ASD: 12 to 20ASH: 10 to 15AGB: 10 to 20
Usually located in the areas with steep slopes and poor soilconditions
Flooding forest (FLF) Similar with UDF Usually located along water courses with seasonalflooding conditions
Note: ASD and ASH represent average stand diameter (cm) and average stand height (m), AGB means aboveground biomass (kg/m2), and DBH meansdiameter at breast height.
Photogramm Eng Remote Sensing. Author manuscript; available in PMC 2009 September 28.
NIH
-PA Author Manuscript
NIH
-PA Author Manuscript
NIH
-PA Author Manuscript
Lu et al. Page 20Ta
ble
2Se
para
bilit
y A
naly
sis R
esul
ts B
ased
on
Tran
sfor
med
Div
erge
nce
Alg
orith
m
Win
dow
Siz
e
Sepa
rabi
lity
Bas
ed o
n a
Sing
le T
extu
ral I
mag
e
ME
VA
HO
CO
DI
EN
SMC
C
3 ×
315
0485
213
9713
8716
8013
2212
9566
3
5 ×
517
7713
1615
6013
5617
5217
7917
1684
8
7 ×
718
6215
2716
4116
0018
4719
4619
1612
66
9 ×
918
7916
3516
3716
8518
3419
7419
8713
84
11 ×
11
1865
1563
1606
1720
1843
1969
1989
1397
15 ×
15
1840
1516
1673
1806
1924
1957
1968
1408
19 ×
19
1818
1551
1659
1966
1865
1865
1944
1253
25 ×
25
1760
1315
1625
1984
1255
1613
1098
1253
31 ×
31
1570
1414
1768
1931
850
1492
892
1211
Not
e: M
E, V
A, H
O, C
O, D
I, EN
, SM
, and
CC
repr
esen
t the
text
ure m
easu
res o
f mea
n, v
aria
nce,
hom
ogen
eity
, con
trast
, dis
sim
ilarit
y, en
tropy
, sec
ond
mom
ent,
and
corr
elat
ion
resp
ectiv
ely.
The
max
imum
valu
e of t
rans
form
ed d
iver
genc
e (TD
) is 2
000,
the h
ighe
r of t
he T
D v
alue
s, th
e bet
ter s
epar
abili
ty b
etw
een
the v
eget
atio
n cl
asse
s. U
sual
ly, a
TD
val
ue o
f gre
ater
than
1,9
00 is
rega
rded
as g
ood
sepa
rabi
lity
betw
een
the
sele
cted
cla
sses
. So
the
TD v
alue
s with
gre
ater
than
1,9
00 a
re h
ighl
ight
ed in
bol
d. T
hese
text
ural
imag
es a
re se
lect
ed fo
r fur
ther
ana
lysi
s, su
ch a
s cor
rela
tion
coef
ficie
nts,
and
calc
ulat
ion
ofB
est T
extu
re C
ombi
natio
n, in
ord
er to
find
suita
ble
text
ural
imag
es fo
r veg
etat
ion
clas
sific
atio
n.
Photogramm Eng Remote Sensing. Author manuscript; available in PMC 2009 September 28.
NIH
-PA Author Manuscript
NIH
-PA Author Manuscript
NIH
-PA Author Manuscript
Lu et al. Page 21Ta
ble
3C
ompa
rison
of C
lass
ifica
tion
Res
ults
Am
ong
Diff
eren
t Pro
cess
ing
Proc
edur
es B
ased
on
Dat
a Fu
sion
HR
G-M
SH
RG
-Fus
ion
TM
-Fus
ion
TM
-2-3
-4-5
TM
-AL
L
Cla
ssPA
UA
PAU
APA
UA
PAU
APA
UA
UD
F62
.592
.675
.096
.885
.091
.985
.010
0.0
82.5
91.7
UO
F58
.358
.366
.772
.725
.013
.641
.738
.583
.331
.3
FLF
75.0
42.9
87.5
50.0
87.5
41.2
87.5
58.3
87.5
58.3
SS3
66.7
30.0
55.6
20.8
11.1
7.1
66.7
23.1
33.3
20.0
SS2
47.2
38.6
41.7
35.7
25.0
25.0
36.1
35.1
11.1
23.5
SS1
62.0
63.3
62.0
66.0
66.0
56.9
58.0
60.4
68.0
51.5
DG
P63
.249
.068
.455
.342
.148
.563
.261
.557
.951
.2
CU
P66
.086
.866
.091
.766
.086
.868
.091
.966
.089
.2
AG
F50
.876
.254
.081
.041
.370
.358
.775
.549
.275
.6
OC
A59
.261
.852
.958
.257
.8
KA
P53
.256
.346
.352
.151
.7
1 Not
es: T
he n
ine
vege
tatio
n cl
asse
s: U
DF,
UO
F, F
LF, S
S3, S
S2, S
S1, D
GP,
CU
P, a
nd A
GF,
repr
esen
t upl
and
dens
e fo
rest
, upl
and
open
fore
st, f
lood
ing
fore
st, a
dvan
ced
succ
essi
onal
veg
etat
ion,
inte
rmed
iate
succ
essi
onal
veg
etat
ion,
initi
al su
cces
sion
al v
eget
atio
n, d
egra
ded
past
ure,
cul
tivat
ed p
astu
re, a
nd a
grof
ores
try/p
eren
nial
agr
icul
ture
, res
pect
ivel
y.
2 HR
G-M
S, H
RG
-Fus
ion,
TM
-Fus
ion,
TM
-2-3
-4-5
, and
TM
-ALL
repr
esen
t the
dat
a se
ts: H
RG
mul
tispe
ctra
l im
age,
dat
a fu
sed
imag
e ba
sed
on H
RG
mul
tispe
ctra
l and
pan
chro
mat
ic d
ata,
dat
a fu
sed
imag
e ba
sed
on T
M m
ultis
pect
ral a
nd H
RG
pan
chro
mat
ic d
ata,
TM
four
ban
ds 2
,3,4
, and
5, a
nd T
M si
x re
flect
ive
band
s.
3 OC
A a
nd K
AP
repr
esen
t ove
rall
clas
sific
atio
n ac
cura
cy a
nd k
appa
coe
ffic
ient
.
4 PA a
nd U
A re
pres
ent p
rodu
cer’
s acc
urac
y an
d us
er’s
acc
urac
y.
Photogramm Eng Remote Sensing. Author manuscript; available in PMC 2009 September 28.
NIH
-PA Author Manuscript
NIH
-PA Author Manuscript
NIH
-PA Author Manuscript
Lu et al. Page 22Ta
ble
4C
ompa
rison
of C
lass
ifica
tion
Res
ults
Am
ong
Diff
eren
t Com
bina
tions
of S
pect
ral a
nd T
extu
ral I
mag
es
HR
G-M
SM
S-T
xt1
MS-
Txt
2M
S-T
xt3
MS-
Txt
4
Cla
ssPA
UA
PAU
APA
UA
PAU
APA
UA
Bas
ed o
nor
igin
alH
RG
imag
e
UD
F62
.592
.670
.096
.667
.593
.160
.092
.360
.092
.3
UO
F58
.358
.391
.773
.310
0.0
75.0
100.
070
.610
0.0
66.7
FLF
75.0
42.9
87.5
50.0
75.0
46.2
75.0
37.5
62.5
33.3
SS3
66.7
30.0
77.8
43.8
66.7
35.3
77.8
28.0
77.8
20.0
SS2
47.2
38.6
50.0
45.0
61.1
43.1
52.8
43.2
44.4
51.6
SS1
62.0
63.3
54.0
62.8
54.0
62.8
52.0
59.1
50.0
56.8
DG
P63
.249
.068
.451
.071
.150
.973
.753
.973
.752
.8
CU
P66
.086
.880
.095
.284
.095
.584
.095
.584
.097
.7
AC
F50
.876
.252
.468
.846
.085
.344
.487
.544
.482
.4
OC
A59
.264
.464
.762
.861
.1
KA
P53
.259
.059
.557
.555
.8
HR
G-F
usio
nFu
sion
-Txt
1Fu
sion
-Txt
2Fu
sion
-Txt
3Fu
sion
-Txt
4
Cla
ssPA
UA
PAU
APA
UA
PAU
APA
UA
Bas
ed o
nH
RG
dat
afu
sed
imag
e
UD
F75
.096
.877
.596
.980
.097
.082
.597
.180
.097
.0
UO
F66
.772
.783
.383
.383
.390
.983
.390
.991
.784
.6
FLF
87.5
50.0
87.5
53.9
87.5
58.3
87.5
58.3
75.0
50.0
SS3
55.6
20.8
55.6
26.3
55.6
29.4
66.7
27.3
77.8
23.3
SS2
41.7
35.7
50.0
42.9
66.7
41.4
61.1
40.7
41.7
46.9
SS1
62.0
66.0
64.0
66.7
60.0
71.4
54.0
65.9
66.0
62.3
DG
P68
.455
.365
.855
.673
.754
.976
.353
.773
.756
.0
CU
P66
.091
.780
.095
.282
.095
.484
.095
.584
.097
.7
AG
F54
.081
.050
.872
.739
.780
.738
.185
.741
.383
.9
Photogramm Eng Remote Sensing. Author manuscript; available in PMC 2009 September 28.
NIH
-PA Author Manuscript
NIH
-PA Author Manuscript
NIH
-PA Author Manuscript
Lu et al. Page 23
HR
G-M
SM
S-T
xt1
MS-
Txt
2M
S-T
xt3
MS-
Txt
4
Cla
ssPA
UA
PAU
APA
UA
PAU
APA
UA
OC
A61
.865
.466
.065
.465
.4
KA
P56
.360
.261
.160
.460
.4
1 Not
es: T
xt1:
One
text
ual i
mag
e de
velo
ped
from
the
entro
py te
xtur
e m
easu
re w
ith a
win
dow
size
of 9
× 9
pix
els o
n th
e SP
OT
panc
hrom
atic
imag
e
2 Txt2
: Txt
1 pl
us a
noth
er te
xtur
al im
age
deve
lope
d fr
om th
e di
ssim
ilarit
y te
xtur
e m
easu
re w
ith a
win
dow
size
of 1
5 ×
15 p
ixel
s
3 Txt3
: Txt
2 pl
us a
noth
er te
xtur
al im
age
deve
lope
d fr
om th
e se
cond
-mom
ent t
extu
re m
easu
re w
ith a
win
dow
size
of 1
9 ×
19 p
ixel
s
4 Txt4
: Txt
3 pl
us a
noth
er te
xtur
al im
age
deve
lope
d fr
om th
e co
ntra
st te
xtur
e m
easu
re w
ith a
win
dow
size
of 2
5 ×
25 p
ixel
s
5 OC
A m
eans
ove
rall
clas
sific
atio
n ac
cura
cy; K
AP
mea
ns k
appa
coe
ffic
ient
; PA
and
UA
repr
esen
t pro
duce
r’s a
nd u
ser’
s acc
urac
y; M
S re
pres
ents
mul
tispe
ctra
l im
ages
; Fus
ion
mea
ns d
ata
fuse
d im
age
base
d on
HR
G m
ultis
pect
ral a
nd p
anch
rom
atic
dat
a.
Photogramm Eng Remote Sensing. Author manuscript; available in PMC 2009 September 28.