Embed Size (px)
Citation preview
Improving the Detection of Simulated Massesin Mammograms through Two Different
Image-processing Techniques1
Bradley M. Hemminger, PhD, Shuquan Zong, MS, Keith E. Muller, PhD, Christopher S. Coffey, PhDMarla C. DeLuca, MS, R. Eugene Johnston, PhD, Etta D. Pisano, MD
Rationale and Objectives. The purpose of this study was to determine whether contrast-limited adaptive histogram equal-ization (CLAHE) or histogram-based intensity windowing (HIW) improves the detection of simulated masses in densemammograms.
Materials and Methods. Simulated masses were embedded in portions of mammograms of patients with dense breasts;the mammograms were digitized at 50 �m per pixel, 12 bits deep. In two different experiments, images were printed bothwith no processing applied and with related parameter settings of two image-processing methods. A simulated mass wasembedded in a realistic background of dense breast tissue, with its position varied. The key variables in each trial in-cluded the position of the mass, the contrast levels of the mass relative to the background, and the selected parameter set-tings for the image-processing method.
Results. The success in detecting simulated masses on mammograms with dense backgrounds depended on the parametersettings of the algorithms used. The best HIW setting performed better than the best fixed-intensity window setting andbetter than no processing. Performance with the best CLAHE settings was no different from that with no processing. Inthe HIW experiment, there were no significant differences in observer performance between processing conditions for ra-diologists and nonradiologists.
Conclusion. HIW should be tested in clinical images to determine whether the detection of masses by radiologists can beimproved. CLAHE processing will probably not improve the detection of masses on clinical mammograms.
Key Words. Breast neoplasms, diagnosis; breast radiography; diagnostic radiology, observer performance; images,processing.
Effective image display allows for an improvement in theclarity of structural details. Mammography, especially inpatients with dense breasts, is a low-contrast examination
that might benefit from increased contrast between malig-nant tissue and normal dense tissue. Image processingmay enable improved visualization of details (1). Ouroverall aim is to improve the accuracy of mammographythrough image processing, because at least 10% of palpa-ble breast cancers are not visible with standard mammo-graphic techniques (2).
Image-processing methods accentuate or emphasizeparticular objects or structures in an image by manipulat-ing the gray levels in the display. A predetermined trans-formation is imposed to amplify the contrast betweenstructures and modify the recorded intensities, enhancingvisualization of important features on the displayed image
Acad Radiol 2001; 8:845–855
1 From the Departments of Radiology (B.M.H., R.E.J., E.D.P.), BiomedicalEngineering (S.Z.), and Biostatistics (K.E.M.. M.C.D.) and the UNC-Lineberger Comprehensive Cancer Center (E.D.P.), University of NorthCarolina, Chapel Hill, NC 27599-7510; and the Department of PreventiveMedicine, Division of Biostatistics, Vanderbilt University, Nashville, Tenn(C.S.C.). Received February 5, 2001; revision requested March 20; revisionreceived May 2; accepted May 7. Supported by NIH PO1-CA 47982, NIHRO1-65583, and DOD DAMD17-94-J-4345. Address correspondence toB.M.H.
© AUR, 2001
845
(3). These methods are designed not to increase or sup-plement the inherent structural information provided bythe image but simply to improve the contrast and, theoret-ically, to enhance particular characteristics (4). Intensitywindowing (IW) is an image-processing techniquewhereby new pixel intensities are determined by means ofa linear transformation that maps a fixed subrange of in-tensity values for the image onto the available gray levelrange of the display system (4). Histogram-based IW(HIW) is an extension of IW that dynamically determinesa selected subrange for IW based on the histogram ofintensity values for an individual image. Contrast-limitedadaptive histogram equalization (CLAHE) modifies theintensity values of the image in a nonlinear fashion tomaximize contrast at all pixels on the recorded image.
Many investigators have studied the application of dig-ital image-processing techniques to mammography. Mc-Sweeney et al (5) tried to enhance the visibility of calcifi-cations by using edge detection for small objects, but theynever reported any clinical results. Smathers et al (6)showed that intensity band filtering could increase thevisibility of small objects. Chan et al (7) applied unsharpmasking to mammograms in a digital form and found thatthe detectability of microcalcifications improved. Chan etal (8) noted that the improvements may have been greaterhad the observers been trained to make diagnoses fromprocessed rather than unprocessed (normal) mammo-grams.
Hale et al (9) used Photoshop software (Adobe, SanJose, Calif) to apply nonspecific contrast and brightnessadjustment to digitized mammograms and found that radi-ologists were better able to determine the likelihood ofmalignancy for mammographically apparent lesions. Yinet al (10,11) showed that nonlinear bilateral subtraction isuseful in the computer detection of mammographicmasses. Kheddache and Kvist (12), using their own quali-tative visual grading analysis, found improvements in thegrading of masslike structures when they compared digi-tally acquired, processed mammograms with conventionalmammograms. Wiebringhaus et al used phantoms to eval-uate four different acquisition techniques. They found thattechniques that used digital image processing (IW, un-sharp masking, and regulatable edge enhancement) hadmore favorable receiver operating characteristic curves(13). Muramatsu et al (14) and Nakata (15) have investi-gated the parameters of the computed radiography ma-chines used for mammography and found that certain pa-rameter combinations are more favorable than others forthe depiction of masses and microcalcifications.
Previous work at the University of North Carolina(UNC), Chapel Hill, has explored the use of IW and theadaptive histogram equalization family of algorithms inmammography and computed tomography (16–21). Wehave previously described a laboratory-based method totest the efficacy of image-processing algorithms in im-proving the detection of masses in dense mammographicbackgrounds (22,23). With that method, on which ourcurrent work is based, radiologists and nonradiologistsexhibit similar trends in detection performance. Whilenonradiologists (who are easier to recruit for such studies)did not perform as well as radiologists overall, the twopopulations displayed parallel increases and decreases inperformance when image-processing methods were ap-plied. Thus, nonradiologists may be used as an effectivesurrogate for radiologists when the effects of image pro-cessing on feature detection is being evaluated. The ex-periments described in this article were performed to de-termine whether CLAHE or HIW could improve the de-tection of simulated masses in dense mammograms in alaboratory setting.
MATERIALS AND METHODS
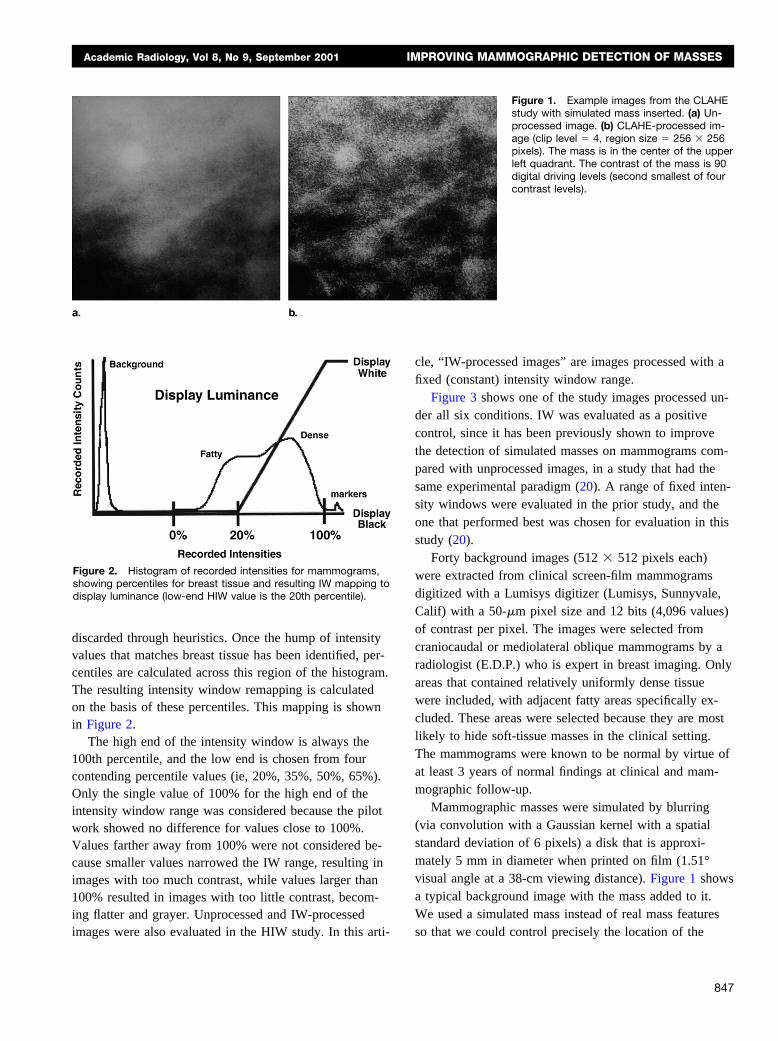
Both the experimental design and the data analysis forthe two experiments are the same, as in several previ-ously published studies; further details can be found inearlier publications (19–22). This same experimental par-adigm was used for both the HIW and CLAHE studiesand allows for the laboratory testing of a range of param-eter values. The experimental subject is shown a series oftest images that include an area of a dense mammogramwith a simulated mass embedded in one of the four quad-rants. The observer’s task is to determine in which quad-rant the mass is located, resulting in a four-alternativeforced-choice task. The test images are displayed withmasses inserted in different locations multiple times foreach combination of different processing parameters andcontrast values. The contrast of the object is varied fromeasy to impossible to detect. Figure 1 shows an exampleimage from the CLAHE experiment with an inserted massof medium contrast.
HIW StudyThe processing algorithm for HIW is one developed
locally at UNC by two of us (B.M.H., S.Z.). The algo-rithm uses peak-seeking methods to identify the “hump”of breast tissue in the histogram. Other humps corre-sponding to nonbreast tissue (markers, labels, etc) are
HEMMINGER ET AL Academic Radiology, Vol 8, No 9, September 2001
846
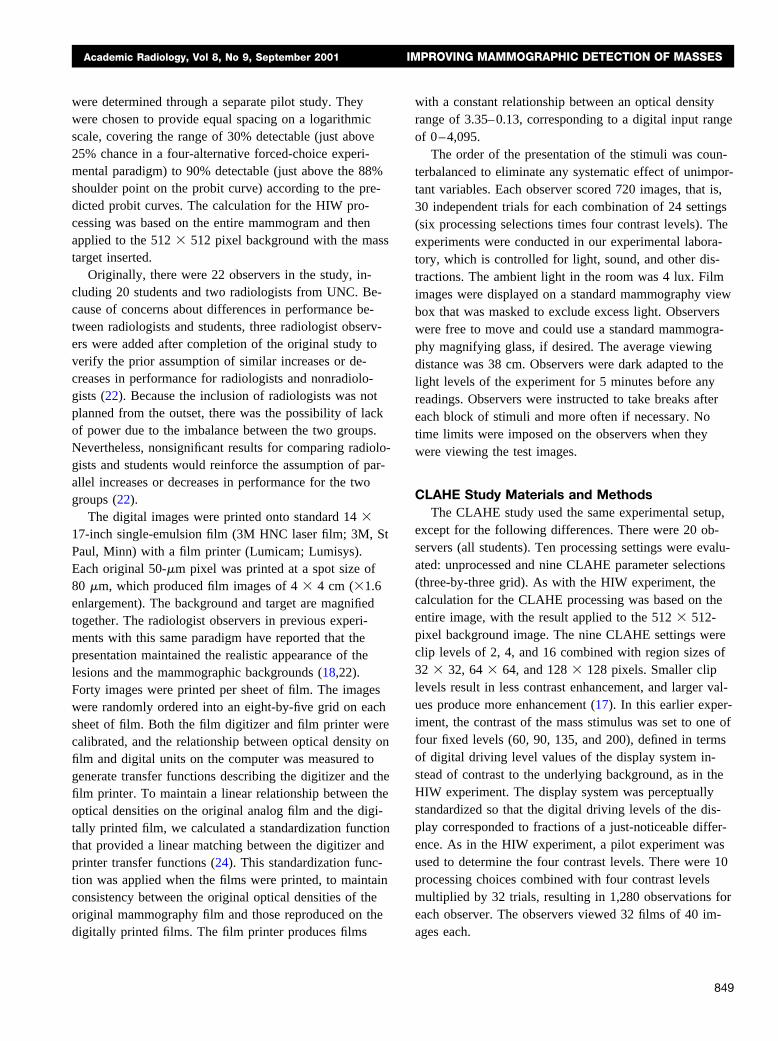
discarded through heuristics. Once the hump of intensityvalues that matches breast tissue has been identified, per-centiles are calculated across this region of the histogram.The resulting intensity window remapping is calculatedon the basis of these percentiles. This mapping is shownin Figure 2.
The high end of the intensity window is always the100th percentile, and the low end is chosen from fourcontending percentile values (ie, 20%, 35%, 50%, 65%).Only the single value of 100% for the high end of theintensity window range was considered because the pilotwork showed no difference for values close to 100%.Values farther away from 100% were not considered be-cause smaller values narrowed the IW range, resulting inimages with too much contrast, while values larger than100% resulted in images with too little contrast, becom-ing flatter and grayer. Unprocessed and IW-processedimages were also evaluated in the HIW study. In this arti-
cle, “IW-processed images” are images processed with afixed (constant) intensity window range.
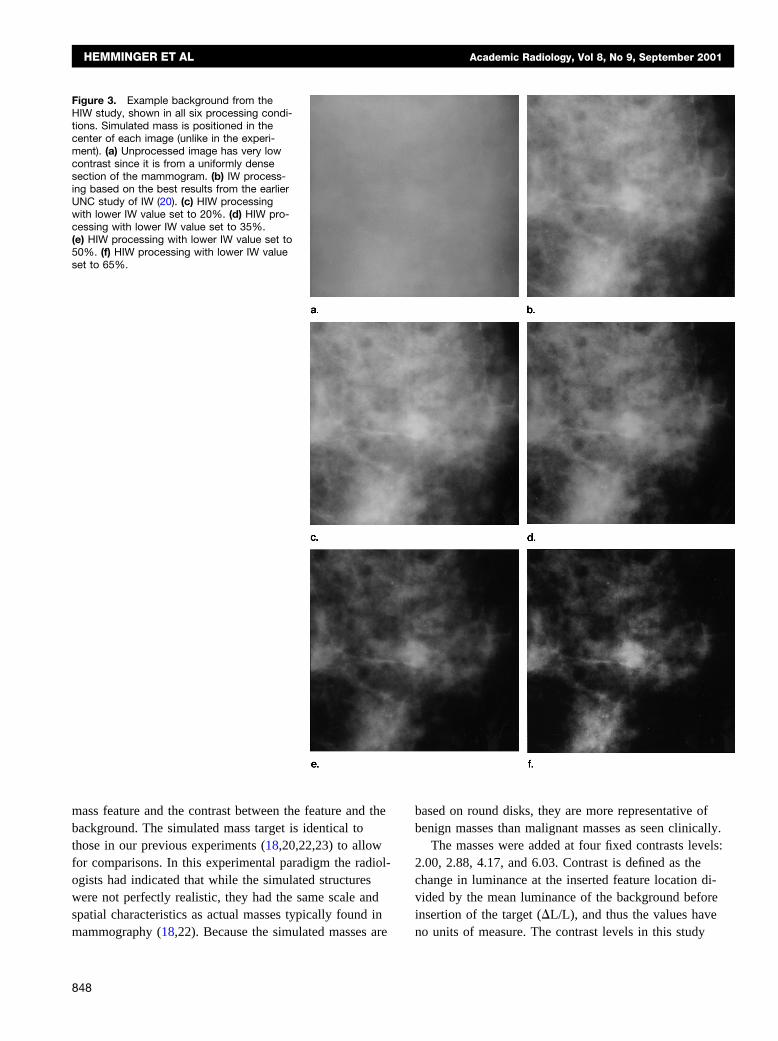
Figure 3 shows one of the study images processed un-der all six conditions. IW was evaluated as a positivecontrol, since it has been previously shown to improvethe detection of simulated masses on mammograms com-pared with unprocessed images, in a study that had thesame experimental paradigm (20). A range of fixed inten-sity windows were evaluated in the prior study, and theone that performed best was chosen for evaluation in thisstudy (20).
Forty background images (512 � 512 pixels each)were extracted from clinical screen-film mammogramsdigitized with a Lumisys digitizer (Lumisys, Sunnyvale,Calif) with a 50-�m pixel size and 12 bits (4,096 values)of contrast per pixel. The images were selected fromcraniocaudal or mediolateral oblique mammograms by aradiologist (E.D.P.) who is expert in breast imaging. Onlyareas that contained relatively uniformly dense tissuewere included, with adjacent fatty areas specifically ex-cluded. These areas were selected because they are mostlikely to hide soft-tissue masses in the clinical setting.The mammograms were known to be normal by virtue ofat least 3 years of normal findings at clinical and mam-mographic follow-up.
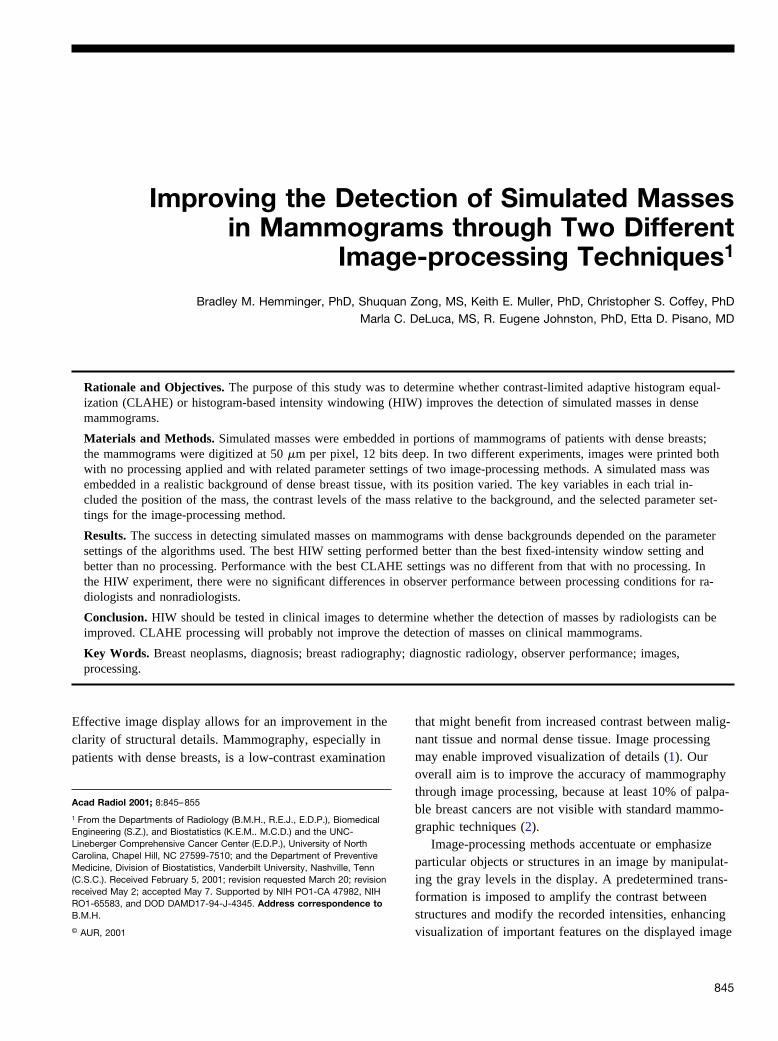
Mammographic masses were simulated by blurring(via convolution with a Gaussian kernel with a spatialstandard deviation of 6 pixels) a disk that is approxi-mately 5 mm in diameter when printed on film (1.51°visual angle at a 38-cm viewing distance). Figure 1 showsa typical background image with the mass added to it.We used a simulated mass instead of real mass featuresso that we could control precisely the location of the
Figure 2. Histogram of recorded intensities for mammograms,showing percentiles for breast tissue and resulting IW mapping todisplay luminance (low-end HIW value is the 20th percentile).
Figure 1. Example images from the CLAHEstudy with simulated mass inserted. (a) Un-processed image. (b) CLAHE-processed im-age (clip level � 4, region size � 256 � 256pixels). The mass is in the center of the upperleft quadrant. The contrast of the mass is 90digital driving levels (second smallest of fourcontrast levels).
Academic Radiology, Vol 8, No 9, September 2001 IMPROVING MAMMOGRAPHIC DETECTION OF MASSES
847
mass feature and the contrast between the feature and thebackground. The simulated mass target is identical tothose in our previous experiments (18,20,22,23) to allowfor comparisons. In this experimental paradigm the radiol-ogists had indicated that while the simulated structureswere not perfectly realistic, they had the same scale andspatial characteristics as actual masses typically found inmammography (18,22). Because the simulated masses are
based on round disks, they are more representative ofbenign masses than malignant masses as seen clinically.
The masses were added at four fixed contrasts levels:2.00, 2.88, 4.17, and 6.03. Contrast is defined as thechange in luminance at the inserted feature location di-vided by the mean luminance of the background beforeinsertion of the target (�L/L), and thus the values haveno units of measure. The contrast levels in this study
Figure 3. Example background from theHIW study, shown in all six processing condi-tions. Simulated mass is positioned in thecenter of each image (unlike in the experi-ment). (a) Unprocessed image has very lowcontrast since it is from a uniformly densesection of the mammogram. (b) IW process-ing based on the best results from the earlierUNC study of IW (20). (c) HIW processingwith lower IW value set to 20%. (d) HIW pro-cessing with lower IW value set to 35%.(e) HIW processing with lower IW value set to50%. (f) HIW processing with lower IW valueset to 65%.
HEMMINGER ET AL Academic Radiology, Vol 8, No 9, September 2001
848
were determined through a separate pilot study. Theywere chosen to provide equal spacing on a logarithmicscale, covering the range of 30% detectable (just above25% chance in a four-alternative forced-choice experi-mental paradigm) to 90% detectable (just above the 88%shoulder point on the probit curve) according to the pre-dicted probit curves. The calculation for the HIW pro-cessing was based on the entire mammogram and thenapplied to the 512 � 512 pixel background with the masstarget inserted.
Originally, there were 22 observers in the study, in-cluding 20 students and two radiologists from UNC. Be-cause of concerns about differences in performance be-tween radiologists and students, three radiologist observ-ers were added after completion of the original study toverify the prior assumption of similar increases or de-creases in performance for radiologists and nonradiolo-gists (22). Because the inclusion of radiologists was notplanned from the outset, there was the possibility of lackof power due to the imbalance between the two groups.Nevertheless, nonsignificant results for comparing radiolo-gists and students would reinforce the assumption of par-allel increases or decreases in performance for the twogroups (22).
The digital images were printed onto standard 14 �17-inch single-emulsion film (3M HNC laser film; 3M, StPaul, Minn) with a film printer (Lumicam; Lumisys).Each original 50-�m pixel was printed at a spot size of80 �m, which produced film images of 4 � 4 cm (�1.6enlargement). The background and target are magnifiedtogether. The radiologist observers in previous experi-ments with this same paradigm have reported that thepresentation maintained the realistic appearance of thelesions and the mammographic backgrounds (18,22).Forty images were printed per sheet of film. The imageswere randomly ordered into an eight-by-five grid on eachsheet of film. Both the film digitizer and film printer werecalibrated, and the relationship between optical density onfilm and digital units on the computer was measured togenerate transfer functions describing the digitizer and thefilm printer. To maintain a linear relationship between theoptical densities on the original analog film and the digi-tally printed film, we calculated a standardization functionthat provided a linear matching between the digitizer andprinter transfer functions (24). This standardization func-tion was applied when the films were printed, to maintainconsistency between the original optical densities of theoriginal mammography film and those reproduced on thedigitally printed films. The film printer produces films
with a constant relationship between an optical densityrange of 3.35–0.13, corresponding to a digital input rangeof 0–4,095.
The order of the presentation of the stimuli was coun-terbalanced to eliminate any systematic effect of unimpor-tant variables. Each observer scored 720 images, that is,30 independent trials for each combination of 24 settings(six processing selections times four contrast levels). Theexperiments were conducted in our experimental labora-tory, which is controlled for light, sound, and other dis-tractions. The ambient light in the room was 4 lux. Filmimages were displayed on a standard mammography viewbox that was masked to exclude excess light. Observerswere free to move and could use a standard mammogra-phy magnifying glass, if desired. The average viewingdistance was 38 cm. Observers were dark adapted to thelight levels of the experiment for 5 minutes before anyreadings. Observers were instructed to take breaks aftereach block of stimuli and more often if necessary. Notime limits were imposed on the observers when theywere viewing the test images.
CLAHE Study Materials and MethodsThe CLAHE study used the same experimental setup,
except for the following differences. There were 20 ob-servers (all students). Ten processing settings were evalu-ated: unprocessed and nine CLAHE parameter selections(three-by-three grid). As with the HIW experiment, thecalculation for the CLAHE processing was based on theentire image, with the result applied to the 512 � 512-pixel background image. The nine CLAHE settings wereclip levels of 2, 4, and 16 combined with region sizes of32 � 32, 64 � 64, and 128 � 128 pixels. Smaller cliplevels result in less contrast enhancement, and larger val-ues produce more enhancement (17). In this earlier exper-iment, the contrast of the mass stimulus was set to one offour fixed levels (60, 90, 135, and 200), defined in termsof digital driving level values of the display system in-stead of contrast to the underlying background, as in theHIW experiment. The display system was perceptuallystandardized so that the digital driving levels of the dis-play corresponded to fractions of a just-noticeable differ-ence. As in the HIW experiment, a pilot experiment wasused to determine the four contrast levels. There were 10processing choices combined with four contrast levelsmultiplied by 32 trials, resulting in 1,280 observations foreach observer. The observers viewed 32 films of 40 im-ages each.
Academic Radiology, Vol 8, No 9, September 2001 IMPROVING MAMMOGRAPHIC DETECTION OF MASSES
849
Data Analysis for HIW StudyThe relationship between log10 (contrast) and the prob-
ability that the observer will correctly identify the quad-rant containing the mass can be described with a probitmodel. Fitting such a model requires the assumption thatthe relationship between log10 (contrast) and the probabil-ity of a correct response can be described by the cumula-tive Gaussian distribution. The location parameter, �ij, isthe mean of the corresponding Gaussian distribution forthe ith subject and jth processing condition. Processingconditions that improve detection will cause this parame-ter to be smaller, thus shifting the probit curve to the left.To make all values positive, we have added a value of 2to the estimated values of �ij. Note that this is equivalentto multiplying the original contrast values by 100, whichis consistent with the values used in the pilot study; thisfactor will cancel out when calculating differences of the� values for two processing conditions. We assume acommon spread parameter, �i, for all processing condi-tions on the same subject. The assumption of a commonspread parameter makes sense, as it corresponds to anequal change in log10 (contrast) producing an equalchange in perception, which is true for the display rangeof this experiment. Smaller values of �i correspond tosteeper slopes, or greater increases in detection rates perunit change in log10 (contrast).
The model to be fit may be summarized as follows:
Pr�correct� � 1⁄4 � �1 � 1⁄4����xij � �ij��i�1.
The formula gives the probability that a subject gets thecorrect answer. Here, i indexes subjects, and j indexesenhancements with x representing the log10 (contrast).The probit analysis will summarize the relationship be-tween log10 (contrast) and proportion correct for each sub-ject by processing condition. For comparisons among pro-cessing conditions, further analysis is required. For eachobserver and processing condition, �ij � �ij �i corre-sponds to that value of log10 (contrast) on the estimatedcurve for which the ith subject viewing the jth processingcondition will achieve an 88% probability of giving acorrect response. The difference between each subject’sperformance with unprocessed and processed images maybe defined as follows:
�ij � �iu � �ij � �iu � �ij,
with larger (more positive) values of �ij indicating betterperformance under the processed condition. The differ-
ence scores for the five processing conditions were usedas the outcomes in a repeated-measures analysis of vari-ance with processing condition a between-subject factor.There were four hypothesis tests of primary interest:(a) test of no difference between the average differencesacross HIW conditions, (b) test for trend over HIW con-ditions compared with the unprocessed condition, (c) testof difference between each processed condition and theunprocessed condition (five tests), and (d) test of differ-ences between the processed conditions (10 tests).
Each of the tests was conducted by using the univari-ate approach to repeated measures with the Geisser-Greenhouse test. To maintain an overall type I error rateof 0.10 for the experiment, the first two hypotheses wereeach tested at the 0.04 level. The five tests in the third setof hypotheses were tested at the 0.002 (0.01/5) level.Similarly, the 10 tests in the fourth set of hypotheseswere tested at the 0.001 (0.01/10) level.
The study was not originally designed to include radi-ologists as observers. After the study was begun we de-cided to include radiologists to investigate the interactionbetween observer training (radiologists vs nonradiologists)and processing conditions. The motivation was to confirmour earlier results (21), which suggest that there is nointeraction. To assess the effect of differences betweenradiologists and nonradiologists, the analysis plan wasmodified to include a test of interaction for each set ofhypotheses. None of the tests showed significant differ-ences, confirming that nonradiologist observers may beused as surrogates for radiologist observers in this andsimilar laboratory experimental paradigms. For this rea-son, results for radiologist and nonradiologist observersare not reported separately but are combined as a singleobserver pool for the remaining hypotheses.
Data Analysis for CLAHE StudyThe CLAHE study used essentially the same methods of
analysis to test a slightly different set of hypotheses: (a) testof interaction between CLAHE parameters of region sizeand clip level, (b) test of effect of region size on featuredetection rate, (c) test of effect of clip level on feature detec-tion rate, and (d) test of no difference in detection rate be-tween CLAHE-processed and unprocessed images.
RESULTS
HIW Experiment
HIW hypothesis 1.—Our first hypothesis was that theaverage difference between unprocessed and processed
HEMMINGER ET AL Academic Radiology, Vol 8, No 9, September 2001
850
conditions did not differ across HIW conditions. Table 1displays the results from these tests. The test of averagedifference between processed HIW conditions and theunprocessed condition was significant at the .04 level(P � .002). Thus, observer detection performance waschanged by the use of HIW processing.
HIW hypothesis 2.—This was a test for trend overHIW lower percentile values as compared with unpro-cessed images. We want to estimate which percentageranges are most likely associated with best observer per-formance in feature detection. Results of an overall testfor a trend associated with increasing levels of lower per-centiles in HIW processing were significant (P � .001).Hence, a series of step-down tests was implemented toexplore the trend further. Results of step-down tests forthe linear, quadratic, and cubic trends were significant
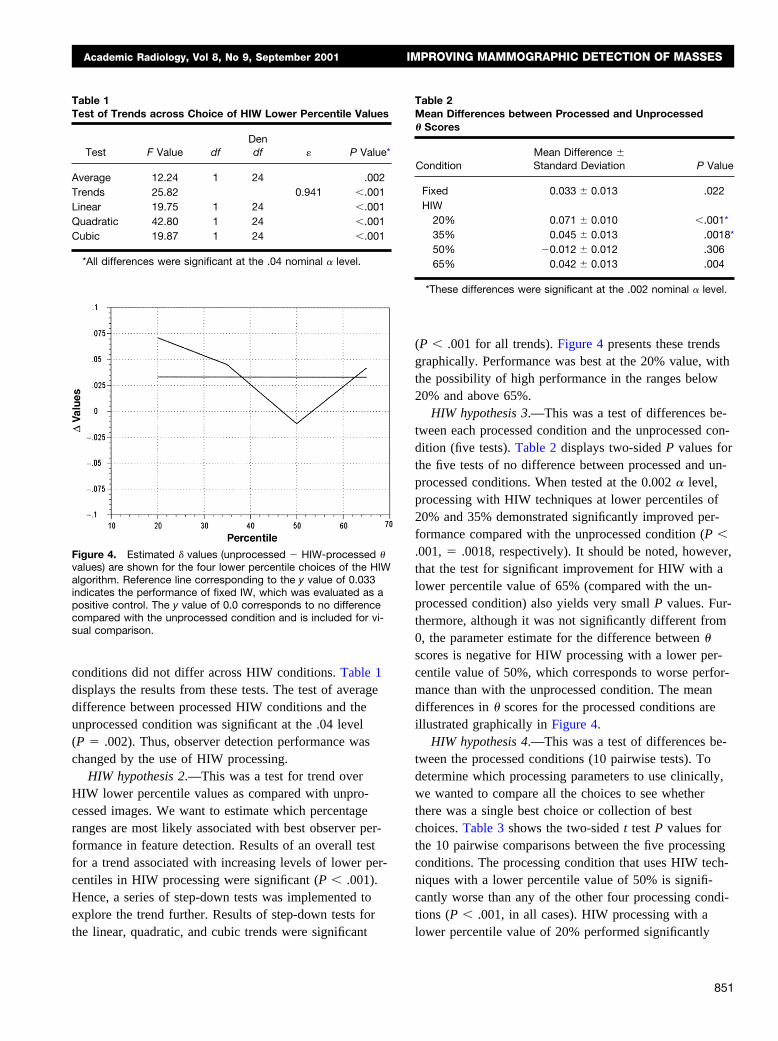
(P � .001 for all trends). Figure 4 presents these trendsgraphically. Performance was best at the 20% value, withthe possibility of high performance in the ranges below20% and above 65%.
HIW hypothesis 3.—This was a test of differences be-tween each processed condition and the unprocessed con-dition (five tests). Table 2 displays two-sided P values forthe five tests of no difference between processed and un-processed conditions. When tested at the 0.002 � level,processing with HIW techniques at lower percentiles of20% and 35% demonstrated significantly improved per-formance compared with the unprocessed condition (P �.001, � .0018, respectively). It should be noted, however,that the test for significant improvement for HIW with alower percentile value of 65% (compared with the un-processed condition) also yields very small P values. Fur-thermore, although it was not significantly different from0, the parameter estimate for the difference between �
scores is negative for HIW processing with a lower per-centile value of 50%, which corresponds to worse perfor-mance than with the unprocessed condition. The meandifferences in � scores for the processed conditions areillustrated graphically in Figure 4.
HIW hypothesis 4.—This was a test of differences be-tween the processed conditions (10 pairwise tests). Todetermine which processing parameters to use clinically,we wanted to compare all the choices to see whetherthere was a single best choice or collection of bestchoices. Table 3 shows the two-sided t test P values forthe 10 pairwise comparisons between the five processingconditions. The processing condition that uses HIW tech-niques with a lower percentile value of 50% is signifi-cantly worse than any of the other four processing condi-tions (P � .001, in all cases). HIW processing with alower percentile value of 20% performed significantly
Figure 4. Estimated � values (unprocessed � HIW-processed �values) are shown for the four lower percentile choices of the HIWalgorithm. Reference line corresponding to the y value of 0.033indicates the performance of fixed IW, which was evaluated as apositive control. The y value of 0.0 corresponds to no differencecompared with the unprocessed condition and is included for vi-sual comparison.
Table 1Test of Trends across Choice of HIW Lower Percentile Values
Test F Value dfDendf P Value*
Average 12.24 1 24 .002Trends 25.82 0.941 �.001Linear 19.75 1 24 �.001Quadratic 42.80 1 24 �.001Cubic 19.87 1 24 �.001
*All differences were significant at the .04 nominal � level.
Table 2Mean Differences between Processed and Unprocessed� Scores
ConditionMean Difference �Standard Deviation P Value
Fixed 0.033 � 0.013 .022HIW
20% 0.071 � 0.010 �.001*35% 0.045 � 0.013 .0018*50% �0.012 � 0.012 .30665% 0.042 � 0.013 .004
*These differences were significant at the .002 nominal � level.
Academic Radiology, Vol 8, No 9, September 2001 IMPROVING MAMMOGRAPHIC DETECTION OF MASSES
851
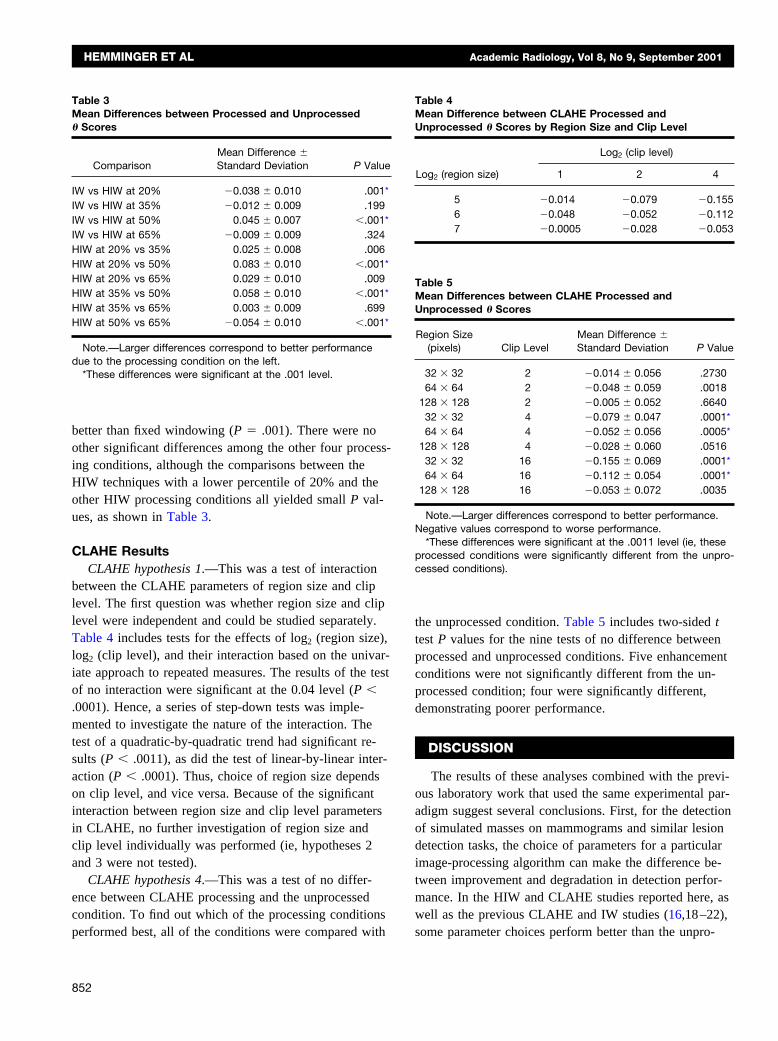
better than fixed windowing (P � .001). There were noother significant differences among the other four process-ing conditions, although the comparisons between theHIW techniques with a lower percentile of 20% and theother HIW processing conditions all yielded small P val-ues, as shown in Table 3.
CLAHE ResultsCLAHE hypothesis 1.—This was a test of interaction
between the CLAHE parameters of region size and cliplevel. The first question was whether region size and cliplevel were independent and could be studied separately.Table 4 includes tests for the effects of log2 (region size),log2 (clip level), and their interaction based on the univar-iate approach to repeated measures. The results of the testof no interaction were significant at the 0.04 level (P �.0001). Hence, a series of step-down tests was imple-mented to investigate the nature of the interaction. Thetest of a quadratic-by-quadratic trend had significant re-sults (P � .0011), as did the test of linear-by-linear inter-action (P � .0001). Thus, choice of region size dependson clip level, and vice versa. Because of the significantinteraction between region size and clip level parametersin CLAHE, no further investigation of region size andclip level individually was performed (ie, hypotheses 2and 3 were not tested).
CLAHE hypothesis 4.—This was a test of no differ-ence between CLAHE processing and the unprocessedcondition. To find out which of the processing conditionsperformed best, all of the conditions were compared with
the unprocessed condition. Table 5 includes two-sided ttest P values for the nine tests of no difference betweenprocessed and unprocessed conditions. Five enhancementconditions were not significantly different from the un-processed condition; four were significantly different,demonstrating poorer performance.
DISCUSSION
The results of these analyses combined with the previ-ous laboratory work that used the same experimental par-adigm suggest several conclusions. First, for the detectionof simulated masses on mammograms and similar lesiondetection tasks, the choice of parameters for a particularimage-processing algorithm can make the difference be-tween improvement and degradation in detection perfor-mance. In the HIW and CLAHE studies reported here, aswell as the previous CLAHE and IW studies (16,18–22),some parameter choices perform better than the unpro-
Table 5Mean Differences between CLAHE Processed andUnprocessed � Scores
Region Size(pixels) Clip Level
Mean Difference �Standard Deviation P Value
32 � 32 2 �0.014 � 0.056 .273064 � 64 2 �0.048 � 0.059 .0018
128 � 128 2 �0.005 � 0.052 .664032 � 32 4 �0.079 � 0.047 .0001*64 � 64 4 �0.052 � 0.056 .0005*
128 � 128 4 �0.028 � 0.060 .051632 � 32 16 �0.155 � 0.069 .0001*64 � 64 16 �0.112 � 0.054 .0001*
128 � 128 16 �0.053 � 0.072 .0035
Note.—Larger differences correspond to better performance.Negative values correspond to worse performance.
*These differences were significant at the .0011 level (ie, theseprocessed conditions were significantly different from the unpro-cessed conditions).
Table 3Mean Differences between Processed and Unprocessed� Scores
ComparisonMean Difference �Standard Deviation P Value
IW vs HIW at 20% �0.038 � 0.010 .001*IW vs HIW at 35% �0.012 � 0.009 .199IW vs HIW at 50% 0.045 � 0.007 �.001*IW vs HIW at 65% �0.009 � 0.009 .324HIW at 20% vs 35% 0.025 � 0.008 .006HIW at 20% vs 50% 0.083 � 0.010 �.001*HIW at 20% vs 65% 0.029 � 0.010 .009HIW at 35% vs 50% 0.058 � 0.010 �.001*HIW at 35% vs 65% 0.003 � 0.009 .699HIW at 50% vs 65% �0.054 � 0.010 �.001*
Note.—Larger differences correspond to better performancedue to the processing condition on the left.
*These differences were significant at the .001 level.
Table 4Mean Difference between CLAHE Processed andUnprocessed � Scores by Region Size and Clip Level
Log2 (region size)
Log2 (clip level)
1 2 4
5 �0.014 �0.079 �0.1556 �0.048 �0.052 �0.1127 �0.0005 �0.028 �0.053
HEMMINGER ET AL Academic Radiology, Vol 8, No 9, September 2001
852
cessed condition for each processing method, while othersperform worse. These evaluations are of the “best” pa-rameter choices, that is, many less desirable ones havealready been discarded through comparison in pilot stud-ies. Thus, it is very important to verify the proper choiceof parameters for image-processing algorithms applied tomedical images.
Second, we considered which algorithm of those testedperforms best in the detection of simulated masses onmammograms. Some results were consistent across thecurrent HIW and CLAHE experiments, our previous IWexperiments (19–21), and the prior CLAHE experiment(22). The best results from each of the processing meth-ods, suggest the following relationship:
HIW IW � unprocessed � CLAHE.
In the prior CLAHE study, the best CLAHE perfor-mance was the same as that for unprocessed images whenthe images were displayed on video (one parameter com-bination was slightly better but not significantly so). Inthis study, which used film image display, results weresimilar, with five parameter settings performing the sameas the unprocessed condition and four performing worse.In the prior IW study we found IW to be significantlybetter than unprocessed images (20). In the current study,in which we used an improved definition of contrast, weagain found IW to perform better, but not significantlybetter. We did find an HIW condition that performed sig-nificantly better than both IW and unprocessed imaging.
The results of these studies suggest that processingtechniques such as HIW have the greatest potential toimprove detection rates, but as with all image-processingtechniques, the benefit of HIW is not uniform and isstrongly dependent on the choice of the lower percentilevalue. These results suggest that the benefits of this HIWtechnique are at a minimum somewhere in the middle ofthe conditions considered here (ie, around the 50% per-centile choice for the low end of the intensity windowrange). The best results were observed with the 20%lower percentile for the low end of the intensity windowrange. The trend analysis found trends through cubic or-der in these data, suggesting the possibility of furthermaximums at the extreme values (close to 0% and 100%)for the low-end percentile. Our practical experience andthe pilot work for this experiment suggest that a maxi-mum benefit occurs around 20%–40%, with minimumbenefit at the extremes (0% and 100%). We have found
that low-end percentile values near 0% caused a flatter,lower-contrast image, while low-end percentile valuesnear 100% result in a black-and-white image with little tono contrast in the midrange. Therefore, while the datafrom this experiment suggest that choices of percentilevalues below 20% or above 65% could further improvedetection ability, on the basis of the pilot work and ourother experiences with HIW, we do not expect much im-provement in those areas.
We also found no statistically significant interactionbetween observer type (radiologists vs nonradiologists)and laboratory feature detection, under any of the pro-cessing conditions, individually or as a whole. This fur-ther confirms a result previously described by Puff et al(22). The conclusion is strengthened by the fact that wereached the same results with a different display medium(film vs video) and a different processing method (HIWvs CLAHE). This finding is important because the use ofradiologist observers is a limiting factor in many medicalimaging studies. The ability to use nonradiologist observ-ers as surrogates for radiologist observers in laboratoryfeature detection experiments considerably expands thescope of possible experiments. An especially importantapplication of nonradiologist observers is to reduce alarge set of processing methods and parameters choices toa small set as the preliminary step for a clinical evalua-tion with radiologists.
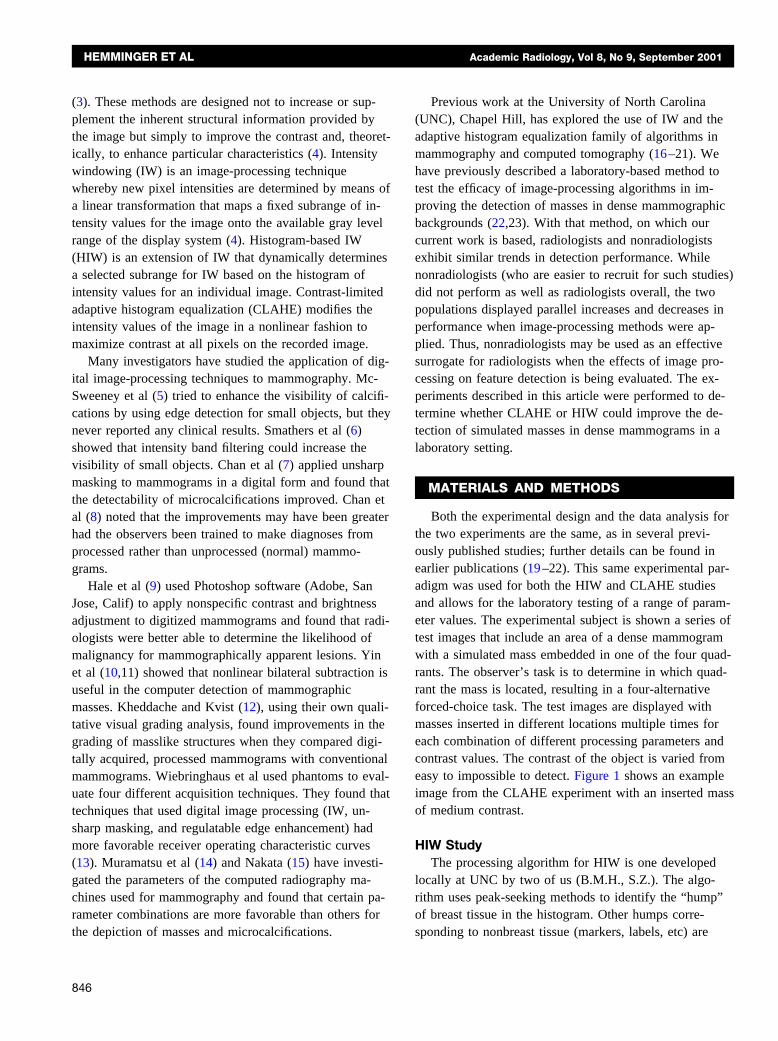
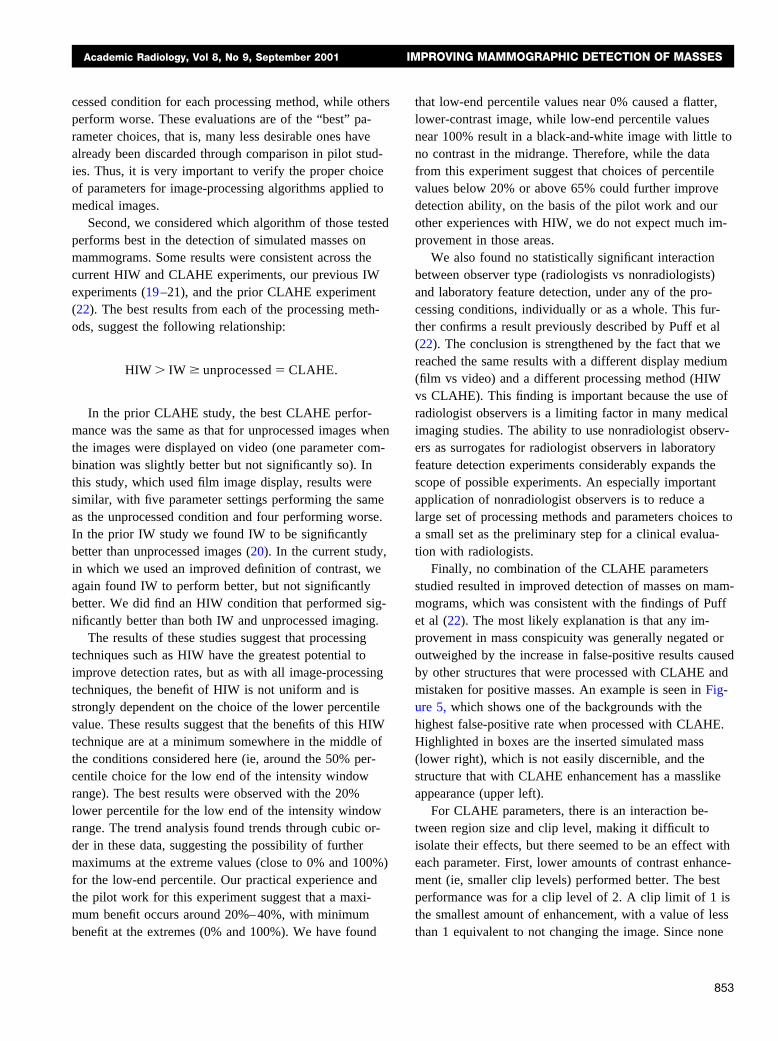
Finally, no combination of the CLAHE parametersstudied resulted in improved detection of masses on mam-mograms, which was consistent with the findings of Puffet al (22). The most likely explanation is that any im-provement in mass conspicuity was generally negated oroutweighed by the increase in false-positive results causedby other structures that were processed with CLAHE andmistaken for positive masses. An example is seen in Fig-ure 5, which shows one of the backgrounds with thehighest false-positive rate when processed with CLAHE.Highlighted in boxes are the inserted simulated mass(lower right), which is not easily discernible, and thestructure that with CLAHE enhancement has a masslikeappearance (upper left).
For CLAHE parameters, there is an interaction be-tween region size and clip level, making it difficult toisolate their effects, but there seemed to be an effect witheach parameter. First, lower amounts of contrast enhance-ment (ie, smaller clip levels) performed better. The bestperformance was for a clip level of 2. A clip limit of 1 isthe smallest amount of enhancement, with a value of lessthan 1 equivalent to not changing the image. Since none
Academic Radiology, Vol 8, No 9, September 2001 IMPROVING MAMMOGRAPHIC DETECTION OF MASSES
853
of the CLAHE processing combinations outperformed theunprocessed condition and since the best-performing com-binations were with a clip level of 2, it may be that de-tection with the CLAHE-processed images was generallyinferior and was only close in performance when the cliplevel was set so low that the processed image was mini-mally different from the unprocessed image.
For region size, it was expected that smaller regions,approaching the size of the mass, would narrowly encom-pass the mass and optimize the enhancement of the massfeature against its background. The best-performing re-gion sizes, however, were the largest evaluated (128 �128 pixels), suggesting that larger regions were more ap-propriate, perhaps because the smaller regions did notenclose the masses and immediate surround well, or (aswith clip level) because the observers performed betterwhen the CLAHE-processed images were most similar tothe unprocessed images (as region size increases inCLAHE the difference between processed and unpro-cessed images decreases).
In conclusion, we believe that of the techniques com-pared (HIW, IW, CLAHE), HIW would be the most valu-able for the mass detection task in mammography andshould be tested clinically to determine whether its useimproves radiologists’ diagnostic performance. The bestparameter choices for our HIW implementation are thepercentile values of 20% for the low end and 100% forthe high end of the intensity window (calculated just overthe breast tissue portion of the histogram). Recent workin our laboratory has evaluated HIW in clinical settings,with use of the best-performing parameter settings identi-fied in this study. A multicenter clinical trial found thatHIW had the best overall performance of the nine pro-cessing methods tested with digital mammograms for ra-
diologist preference and performance evaluations, whenaveraged across scanner type and feature type (25,26).These results suggest that HIW may be effective for pre-senting other mammographic features (microcalcificationsand spiculations) and that it may be as effective for digi-tal mammograms as it is for digitized screen-film mam-mograms. In the HIW experiment, no significant interac-tion was found between observer type (radiologist or non-radiologist) and feature detection performance, confirmingour earlier result that nonradiologist observers can beused as surrogates for radiologist observers in laboratoryfeature detection tasks. With CLAHE processing, the de-tection of masses on mammograms was not improved; thebest results were achieved with low amounts of enhance-ment (small clip levels) and larger regions, both of whichmake the processed image more similar to the originalunprocessed image. Further clinical study of CLAHE pro-cessing was not indicated.
REFERENCES
1. Rosenman J, Roe CA, Cromartie R, et al. Portal film enhancement:technique and clinical utility. Int J Radiat Oncol Biol Physics 1993; 25:333–338.
2. Homer MJ. Mammographic interpretation: a practical approach. NewYork, NY: McGraw-Hill, 1991; 4–5.
3. Pizer SM. Psychovisual issues in the display of medical images. In:Hoehne KH, ed. Pictorial information systems in medicine. Berlin,Germany: Springer-Verlag, 1985; 211–234.
4. Jain AK. Fundamentals of digital image processing. Englewood Cliff,NJ: Prentice Hall, 1989.
5. McSweeney MB, Sprawls P, Egan RL. Enhanced image mammogra-phy. AJR Am J Roentgenol 1983; 140:9–14.
6. Smathers RL, Bush E, Drace J, et al. Mammographic microcalcifications:detection with xerography, screen-film, and digitized film display. Radiol-ogy 1986; 159:673–677.
7. Chan HP, Doi K, Galhorta S, et al. Image feature analysis and com-puter-aided diagnosis in digital radiography. I. Automated detection ofmicrocalcifications in mammography. Med Phys 1987; 14:538–547.
Figure 5. (a, b) Images from the CLAHEstudy. Boxes at upper left contain the “false-positive” structure that was commonly mis-taken for a mass. Boxes at lower right con-tain the real mass target at the lowest level ofcontrast. (a) Unprocessed image. (b) CLAHE-processed image (clip level � 4, regionsize � 8 � 8 pixels).
HEMMINGER ET AL Academic Radiology, Vol 8, No 9, September 2001
854
8. Chan HP, Vyborny CJ, MacMahon H, et al. Digital mammographyROC studies of the effects of pixel size and unsharp-mask filtering onthe detection of subtle microcalcifications. Invest Radiol 1987; 22:581–589.
9. Hale DA, Cook JF, Baniqued Z, et al. Selective digital enhancement ofconventional film mammography. J Surg Oncol 1994; 55:42–46.
10. Yin F, Giger ML, Vyborny CJ, et al. Comparison of bilateral-subtrac-tion and single-image processing techniques in the computerized de-tection of mammographic masses. Invest Radiol 1993; 28:473–481.
11. Yin F, Giger M, Doi K, et al. Computerized detection of masses in dig-ital mammograms: analysis of bilateral subtraction images. Med Phys1991; 18:955–963.
12. Kheddache S, Kvist H. Digital mammography using storage phosphorplate technique-optimizing image processing parameters for visibilityof lesions and anatomy. Eur J Radiol 1997; 24:237–244.
13. Wiebringhaus R, John V, Muller RD, Hirche H, Voss M, Callies R. ROCanalysis of image quality in digital luminescence radiography in com-parison with current film-screen systems in mammography. AktuelleRadiologie 1995; 5:263–267.
14. Muramatsu Y, Nawano S, Anan M, et al. A study of image processingin CR mammography; gradation processing. Jpn J Clin Radiol 1990;23:271–276.
15. Nakata M. A study of image processing condition of mammographyusing FCR. Nippon Acta Radiol 1989; 49:454–467.
16. Hemminger BM, Johnston RE, Muller KE, et al. Comparison of clinicalfindings between intensity-windowed versus CLAHE presentation ofchest CT images. SPIE Medical Imaging VI: Image Capture, Format-ting, and Display 1992; 1653:164–175.
17. Pizer SM, Zimmerman JB, Staab EV. Adaptive grey level assignmentin CT scan display. J Comput Assist Tomogr 1984; 8:300–305.
18. Puff DT, Cromartie R, Pisano ED. Evaluation and optimization of con-trast enhancement methods for medical images. Proc SPIE Visualiza-tion in Biomedical Computing Conference 1992; 1808:336–346.
19. Pisano ED, Zong S, Hemminger BM, et al. Contrast limited adaptivehistogram equalization image processing to improve the detection ofsimulated spiculations in dense mammograms. J Digit Imaging 1998;1:193–200.
20. Pisano ED, Chandramouli J, Hemminger BM, et al. The effect of inten-sity windowing on the detection of simulated masses embedded indense portions of digitized mammograms in a laboratory setting. JDigit Imaging 1997; 10:174–182.
21. Pisano ED, Chandramouli J, Hemminger BM, et al. Does intensity win-dowing improve the detection of simulated calcifications in densemammograms? J Digit Imaging 1997; 10:79–84.
22. Puff DT, Pisano ED, Muller KE, et al. A method for determination ofoptimal image enhancement for the detection of mammographic ab-normalities. J Digit Imaging 1994; 7:161–171.
23. Hemminger BM, Dillon AW, Johnston RE, et al. Effect of display lumi-nance on the feature detection rates of masses in mammograms. MedPhys 1999; 26:2266–2272.
24. Hemminger, BM, Johnston RE, Rolland JR, Muller KE. Introduction toperceptual linearization for video display systems for medical imagepresentation. J Digit Imaging 1995; 8:21–34.
25. Pisano ED, Cole EB, Hemminger BM, Yaffe MJ, et al. Image process-ing algorithms for digital mammography. RadioGraphics 2000; 20:1479–1491.
26. Pisano ED, Cole EB, Major S, et al. Radiologists’ references for digitalmammographic display. Radiology 2000; 216:820–830.
Academic Radiology, Vol 8, No 9, September 2001 IMPROVING MAMMOGRAPHIC DETECTION OF MASSES
855