Embed Size (px)
Citation preview
Pectoral muscle detection in mammograms based onpolar coordinates and the shortest path
Jaime S. Cardoso, Member, IEEE, Ines Domingues, Student Member, IEEE, Igor Amaral,Ines Moreira, Pedro Passarinho, Joao Santa Comba, Ricardo Correia, Maria J. Cardoso
Abstract— The automatic detection and segmentation of thepectoral muscle in the medio-lateral oblique view of mammo-grams is essential for further analysis of breast anormalies.However, it is still a very difficult task since the sizes, shapesand intensity contrasts of pectoral muscles change greatly fromimage to image. In this paper, an algorithm based on theshortest path on a graph is proposed to automatically detectthe pectoral muscle contour. To overcome the difficulties ofsearching for the path between a lateral and the top marginsof the image, this is first transformed, using polar coordinates.In the transformed image, the muscle boundary in amongstthe shortest paths between the top and the bottom rows.A comprehensive comparison with manually-drawn contoursreveals the strength of the proposed method.
I. INTRODUCTION
In spite of the progresses in other breast imaging modali-ties (magnetic resonance imaging, etc.), mammography is theonly screening modality proven to detect early stage breastcancer.
The pectoral muscle represents a predominant densityregion in most medio-lateral oblique (MLO) views of mam-mograms, and can affect the results of image processingmethods. Intensity-based methods, for example, can presentpoor performance when applied to differentiate dense struc-tures such as the fibro-glandular disc or small suspiciousmasses, since the pectoral muscle appears at approximatelythe same density as the dense tissues of interest in the image.The inclusion of the pectoral muscle in the image data beingprocessed could also bias the detection procedures. Anotherimportant need to identify the pectoral muscle lies in thepossibility that the local information of its edge, along withan internal analysis of its region, may be used to identify thepresence of abnormal axillary lymph nodes, which may bethe only manifestation of occult breast carcinoma. [1]
The current image evaluation criteria for the mammo-graphic presentation of the pectoral muscle on the MLOview of the breast recommends that the inferior aspect ofthe pectoral muscle reaches the level of the nipple. However,many MLO mammograms fail this quality criterion of theimage evaluation systems; in [2] it was observed that 75.5%
This work was developed under the “Semantic PACS” project, a QRENinitiative, funded by the European Regional Development Fund, through theOperational Programme COMPETE. J. S. Cardoso, I. Domingues and I. Amaralare with INESC Porto, Faculdade de Engenharia, Universidade do Porto, [email protected], [email protected],[email protected]
I. Moreira, R. Correia and M. J. Cardoso are with Faculdade deMedicina, Universidade do Porto, Portugal. [email protected],[email protected], [email protected]
P. Passarinho, J. Santa Comba are with Emılio Azevedo Campos, Portugal.pedro.passarinho, [email protected]
of the mammograms failed the criterion. In some mammo-grams the pectoral muscle is not present at all. This widevariability in the position of the muscle contour, togetherwith the similarity between muscle and breast tissues makethe detection a difficult task.
A. Related works
One of the most used pectoral muscle segmentation algo-rithms is the method proposed by Ferrari et al. [3] based onthe Hough transform. The main problem with this approachis that the pectoral muscle is approximated by a line. Thesemethods give poor results when the pectoral muscle contouris a curve. For this reason, the same team proposed anothermethod [1] based on Gabor wavelets. In [4], the pectoralmuscle was once again approximated by a straight line, butthis line was further adjusted through surface smoothing andedge detection.
Ma et al. [5] described two image segmentation methods:one based on adaptive pyramids and other based on minimumspanning trees. The article [6] chose the longest straightline in Radon-domain as an approximation to the pectoralmuscle localization. The problem with this work is two-fold: the simplification of using a line and the use of aprivate database, so the results cannot be compared withother publications. Camilus and co-workers [7] used a graphcut method followed by Bezier curve smoothing. Recently,an isocontour map methodology was proposed [8]. Finally,a discrete time Markov chain and an active contour modelwere adopted in [9] for muscle detection.
Although the long list of related works, almost noneaddresses the problem of deciding if the muscle contour ispresent or not in the mammogram. Moreover, some worksassume user input, either in the form of a region of interest oras a set of points in the contour. Finally, with the increaseduse of digital mammograms, and with its inherent higherquality, simpler approaches could be more adequate.
II. PECTORAL MUSCLE DETECTION BY SHORTEST PATH
Since in the proposed method the image grid is consideredas a graph with pixels as nodes and edges connectingneighbouring pixels, we start by introducing some graphconcepts.
A. Background knowledge
A graph G = (V,A) is composed of two sets V and A.V is the set of nodes, and A the set of arcs (p, q), p, q ∈ V .The graph is weighted if a weight w(p, q) is associated to

each arc. The weight of each arc, w(p, q), is a function ofpixels values and pixels relative positions. A path from vertex(pixel) v1 to vertex (pixel) vn is a list of unique verticesv1, v2, . . . , vn, with vi−1 and vi corresponding to neighbourpixels. The total cost of a path is the sum of each arc weightin the path
∑ni=2 w(vi−1, vi).
A path from a source vertex v to a target vertex u is saidto be the shortest path if its total cost is minimum amongall v-to-u paths. The distance between a source vertex v anda target vertex u on a graph, d(v, u), is the total cost of theshortest path between v and u.
A path from a source vertex v to a sub-graph Ω is saidto be the shortest path between v and Ω if its total cost isminimum among all v-to-u ∈ Ω paths. The distance froma node v to a sub-graph Ω, d(v,Ω), is the total cost of theshortest path between v and Ω:
d(v,Ω) = minu∈Ω
d(v, u). (1)
A path from a sub-graph Ω1 to a sub-graph Ω2 is said tobe the shortest path between Ω1 and Ω2 if its total cost isminimum among all v ∈ Ω1-to-u ∈ Ω2 paths. The distancefrom a sub-graph Ω1 to a sub-graph Ω2, d(Ω1,Ω2), is thetotal cost of the shortest path between Ω1 and Ω2:
d(Ω1,Ω2) = minv∈Ω1,u∈Ω2
d(v, u). (2)
In graph theory, the shortest-path problem seeks theshortest path connecting two nodes; efficient algorithms areavailable to solve this problem, such as the well-knownDijkstra algorithm [10].
B. Base Algorithm for Pectoral Muscle Detection
We will assume in the following that the image of theMLO mammogram has already been mirrored, if necessary,using information from the DICOM header or with a trivialhistogram analysis (by comparing the average intensity levelof the right half with the left half), so that the muscleboundary, if present, goes from the top margin to the leftmargin of the image.
Intuitively, the muscle boundary manifests itself as achange in the gray-level values of the pixels, giving origin toan edge in the resulting image. Therefore, we can argue thatthe muscle boundary corresponds to a path through edgepixels. If paths through edges pixels are favored with theappropriate weight in the graph, the muscle boundary is alow-cost path between the left and the top margins.
A difficulty with searching for the shortest paths (shortestin the sense on minimizing the cost of the path) between thetop row and left column is that small paths, near the top-leftcorner are naturally favoured. To overcome this challenge,we propose to pre-process the image, adopting the polarcoordinates, see Fig. 1. We assume that the origin of thecoordinates is in the top-left corner. Note that the left columnis mapped to the bottom row (corresponding to an angle ofπ/2 rads) and the top row stays in the same position. Inthis new coordinate-system, the path to search for is nowbetween the top and bottom rows.
(a) Original image. (b) Image after polar transforma-tion. The horizontal axis representsthe radius and the vertical axis theangle, from 0 to 90 degrees.
Fig. 1. Mammogram pre-processing.
In the transformed image, one may assume the simplifyingassumption that the vertical paths do not zigzag back andforth, up and down. Therefore, the search may be restrictedamong connected paths containing one, and only one, pixelin each row between the two end-rows. Formally, let I be anN1 × N2 image (after polar coordinate transform) with N1
columns and N2 rows; define a vertical path to be
s = (x(y), y)Ω2
y=Ω1, s.t. ∀y |x(y)− x(y − 1)| ≤ 1,
where x is a mapping x : [Ω1, · · · ,Ω2]→ [1, · · · , N1]. Thatis, a vertical path is an 8-connected path of pixels in theimage from Ω1 to Ω2, containing one, and only one, pixelin each row of the image.
The optimal vertical path that minimizes this cost canbe found using dynamic programming (instead of resortingto a more complex algorithm for the generic shortest pathproblem) [11], [12]. The first step is to traverse the imagefrom the first to the last row and compute the cumulativeminimum cost C for each entry (i, j):
C(i, j) = min
C(i− 1, j − 1) + w(pi−1,j−1; pi,j)
C(i, j − 1) + w(pi,j−1; pi,j)
C(i+ 1, j − 1) + w(pi+1,j−1; pi,j)
,
where w(pi,j ; pl,m) represents the weight of the arc incidentwith pixels at positions (i, j) and (l,m). At the end of thisprocess,
mini∈1,··· ,N1
C(i,N2)
indicates the end of the minimal connected path. Hence, inthe second step, one backtracks from this minimum entry onC to find the optimal vertical path.
C. Proposed Algorithm
The proposed algorithm1 can be implemented as a se-quence of a few high-level operations, as presented inListing 1.
The main processing encompasses:
1The Matlab source code is available upon request to the authors.

Pre-Processing:-mirror the image if left half
is darker than right half-transform to polar coordinates
Main-Processing:-compute the weighted graph-compute muscle contour as the
shortest path between top and bottom rows
Post-Processing:-transform contour to cartesian coordinates-reject contour if it is not valid
Listing 1: Main operations of the proposed method.
• A gradient computation of the original image. In abroader view, this can be replaced by any featureextraction process that emphasizes the pixels we areseeking for (pixels on the pectoral muscle boundary).
• Consider the gradient image as a weighted graph withpixels as nodes and edges connecting neighbouringpixels. Assign to an arc an weight w determined bythe gradient values of the two incident pixels.
In this work, the weight of the arc connecting 4-neighbourpixels p and q was expressed as an exponential law:
f(g) = f` + (fh − f`)exp(β (255− g))− 1
exp(β 255)− 1, (3)
with f`, fh, β ∈ R and g is the minimum of the gradientcomputed on the two incident pixels. For 8-neighbour pixelsthe weight was set to
√2 times that value. The parameters
f` and fh were fixed at f` = 2 and fh = 32; β wasexperimentally tuned using a grid search method, yieldingβ = 0.025.
The gradient model adopted in the experiments reportedshortly is based on the Prewitt operator. The Prewitt operatoris applied on the x and y directions; from the computed val-ues, Gx and Gy , the magnitude of the gradient is estimatedas g =
√G2
x +G2y .
Since the pectoral muscle may not be present in someMLO images and the main processing step of our approachalways outputs a predicted boundary, it is necessary tovalidate if the detected path should be accepted or not asa muscle boundary.
The validation rule, in the cartesian coordinate represen-tation, assumes that a muscle boundary runs ‘more or lessmonotonously’ from the top margin to the left margin. Inparticular it is not expected that the path deviates a lot tothe right of the end point on the top row; likewise, thepath should also not go a lot below the endpoint on theleft margin. Therefore, if the column of rightmost point inthe contour is more than k times the column of the end pointon the top row or the row of the lowest point is more than ktimes the row of the end point on the left column, the contouris rejected and the mammogram is assumed to be without amuscle boundary. In the experimental setup, k was set at 1.2.
III. RESULTSThe methodology proposed in this paper was assessed
on a set of 150 mammograms. One hundred mammograms
were collected at Hospital S. Joao (HSJ), Porto, Portugal.These mammograms are Full Field Digital Mammography(FFDM), already preprocessed by the acquisition equipmentfor display purposes. Our detection algorithm was also testedon 50 images from the Digital Database for ScreeningMammography (DDSM) (University of South Florida, 2001).In order to evaluate the performance of the proposed method,an experienced radiologist was asked to manually mark thecontours on the 150 mammograms. For evaluation purposes,when no contour was present in the mammogram, thereference contains only a single point at position (0, 0).
Independently of the original size, the image in polarcoordinates was kept at a constant 1024 × 1024 size. Thisimproves the computational performance of the implemen-tation of the software, without degrading the quality of thefinal result.
To evaluate the quality of the muscle boundary detectionalgorithm we conducted a complete objective evaluation,based on the hausdorff and the average distances to comparetwo contours. The hausdorff distance is defined as
H(A,B) = max(h(A,B), h(B,A)),
where A and B represent the sets of the pixels in thereference muscle contour and the segmented muscle contourrespectively, and
h(A,B) = maxa∈A
minb∈B||a− b||
and ||.|| is the Euclidean distance. The motivation for usingthis metric is that is represents the “worst case scenario”.
Fig. 2 shows the evolution of the error when estimatingthe position of the muscle contour. The error in pixels (inthe cartesian coordinate system) was normalized by the sizeof the diagonal of the original image. Table I summarizesthe results.
Fig. 2. Error (normalized by the diagonal of the image) in the position ofthe muscle boundary of the proposed method as measured by the averagedistance over 50 DDSM mammograms and 100 HSJ mammograms.
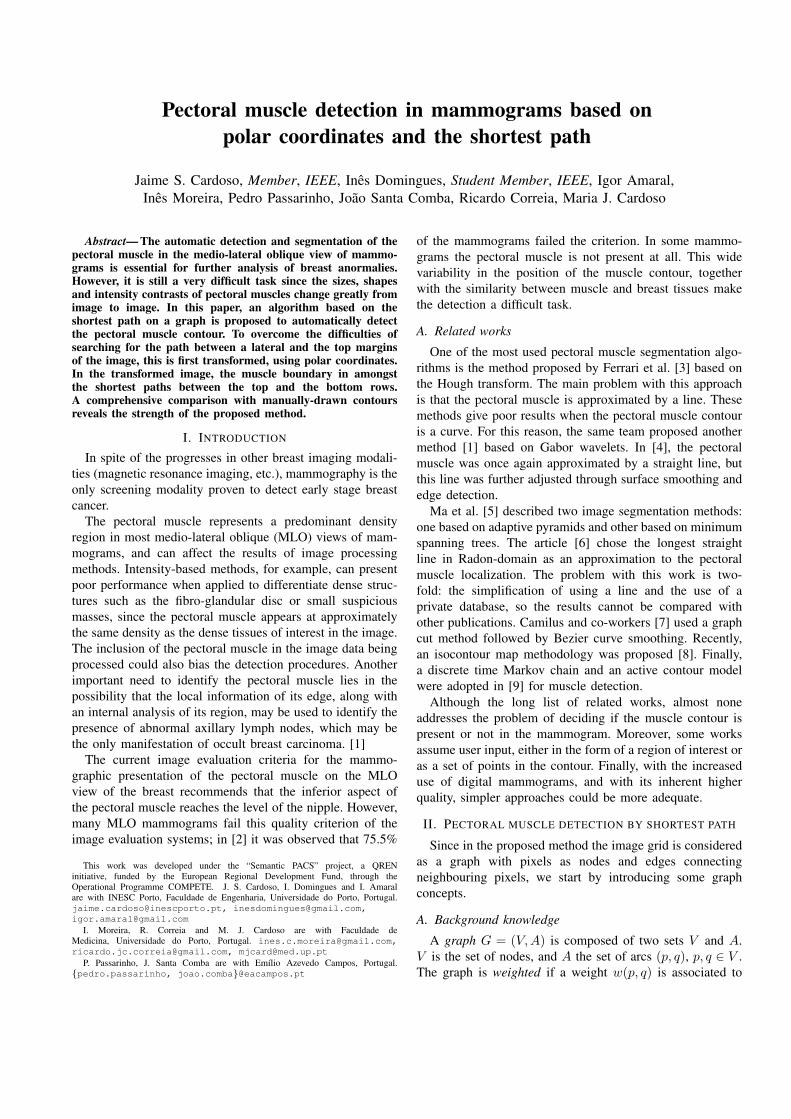
Fig. 3 shows some of the images in which the algorithmworked satisfactorily. Some of the unsuccessful cases, dis-played in Fig. 4, bring to light the limitations of the currentstate of the proposed approach.
We observed a propensity to miss the part of the contournext to the left margin, where the boundary is usually more
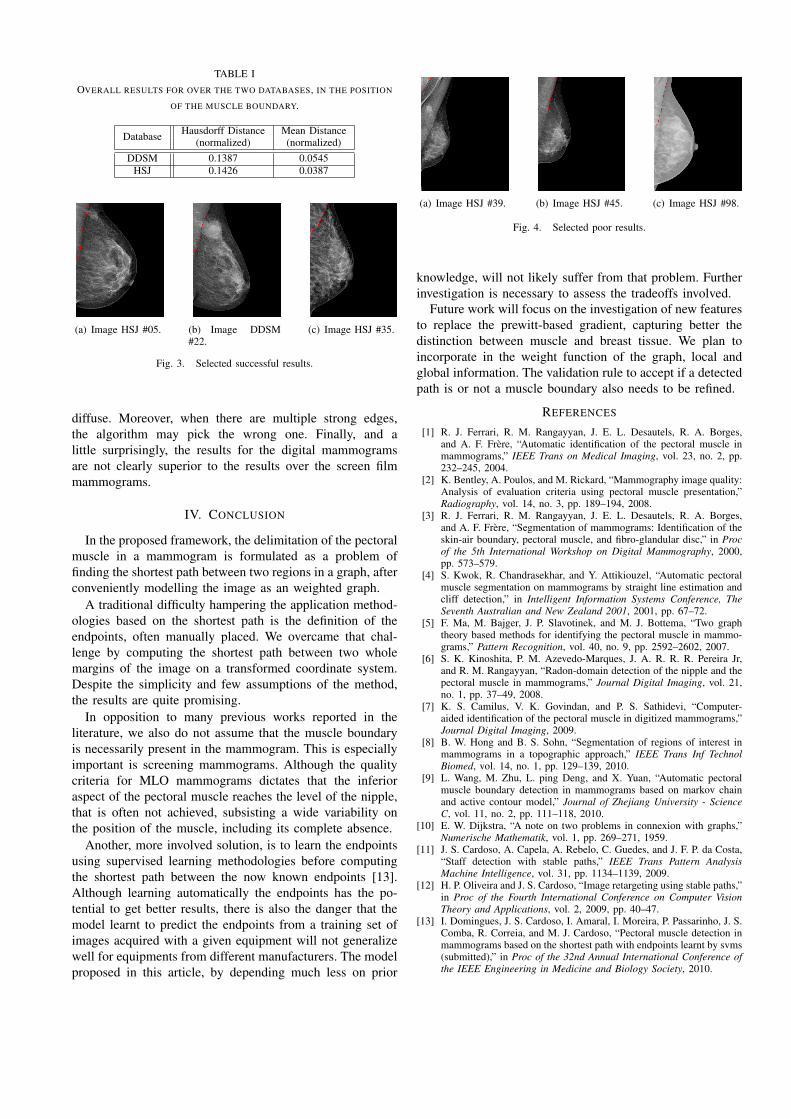
TABLE IOVERALL RESULTS FOR OVER THE TWO DATABASES, IN THE POSITION
OF THE MUSCLE BOUNDARY.
Database Hausdorff Distance Mean Distance(normalized) (normalized)
DDSM 0.1387 0.0545HSJ 0.1426 0.0387
(a) Image HSJ #05. (b) Image DDSM#22.
(c) Image HSJ #35.
Fig. 3. Selected successful results.
diffuse. Moreover, when there are multiple strong edges,the algorithm may pick the wrong one. Finally, and alittle surprisingly, the results for the digital mammogramsare not clearly superior to the results over the screen filmmammograms.
IV. CONCLUSION
In the proposed framework, the delimitation of the pectoralmuscle in a mammogram is formulated as a problem offinding the shortest path between two regions in a graph, afterconveniently modelling the image as an weighted graph.
A traditional difficulty hampering the application method-ologies based on the shortest path is the definition of theendpoints, often manually placed. We overcame that chal-lenge by computing the shortest path between two wholemargins of the image on a transformed coordinate system.Despite the simplicity and few assumptions of the method,the results are quite promising.
In opposition to many previous works reported in theliterature, we also do not assume that the muscle boundaryis necessarily present in the mammogram. This is especiallyimportant is screening mammograms. Although the qualitycriteria for MLO mammograms dictates that the inferioraspect of the pectoral muscle reaches the level of the nipple,that is often not achieved, subsisting a wide variability onthe position of the muscle, including its complete absence.
Another, more involved solution, is to learn the endpointsusing supervised learning methodologies before computingthe shortest path between the now known endpoints [13].Although learning automatically the endpoints has the po-tential to get better results, there is also the danger that themodel learnt to predict the endpoints from a training set ofimages acquired with a given equipment will not generalizewell for equipments from different manufacturers. The modelproposed in this article, by depending much less on prior
(a) Image HSJ #39. (b) Image HSJ #45. (c) Image HSJ #98.
Fig. 4. Selected poor results.
knowledge, will not likely suffer from that problem. Furtherinvestigation is necessary to assess the tradeoffs involved.
Future work will focus on the investigation of new featuresto replace the prewitt-based gradient, capturing better thedistinction between muscle and breast tissue. We plan toincorporate in the weight function of the graph, local andglobal information. The validation rule to accept if a detectedpath is or not a muscle boundary also needs to be refined.
REFERENCES
[1] R. J. Ferrari, R. M. Rangayyan, J. E. L. Desautels, R. A. Borges,and A. F. Frere, “Automatic identification of the pectoral muscle inmammograms,” IEEE Trans on Medical Imaging, vol. 23, no. 2, pp.232–245, 2004.
[2] K. Bentley, A. Poulos, and M. Rickard, “Mammography image quality:Analysis of evaluation criteria using pectoral muscle presentation,”Radiography, vol. 14, no. 3, pp. 189–194, 2008.
[3] R. J. Ferrari, R. M. Rangayyan, J. E. L. Desautels, R. A. Borges,and A. F. Frere, “Segmentation of mammograms: Identification of theskin-air boundary, pectoral muscle, and fibro-glandular disc,” in Procof the 5th International Workshop on Digital Mammography, 2000,pp. 573–579.
[4] S. Kwok, R. Chandrasekhar, and Y. Attikiouzel, “Automatic pectoralmuscle segmentation on mammograms by straight line estimation andcliff detection,” in Intelligent Information Systems Conference, TheSeventh Australian and New Zealand 2001, 2001, pp. 67–72.
[5] F. Ma, M. Bajger, J. P. Slavotinek, and M. J. Bottema, “Two graphtheory based methods for identifying the pectoral muscle in mammo-grams,” Pattern Recognition, vol. 40, no. 9, pp. 2592–2602, 2007.
[6] S. K. Kinoshita, P. M. Azevedo-Marques, J. A. R. R. R. Pereira Jr,and R. M. Rangayyan, “Radon-domain detection of the nipple and thepectoral muscle in mammograms,” Journal Digital Imaging, vol. 21,no. 1, pp. 37–49, 2008.
[7] K. S. Camilus, V. K. Govindan, and P. S. Sathidevi, “Computer-aided identification of the pectoral muscle in digitized mammograms,”Journal Digital Imaging, 2009.
[8] B. W. Hong and B. S. Sohn, “Segmentation of regions of interest inmammograms in a topographic approach,” IEEE Trans Inf TechnolBiomed, vol. 14, no. 1, pp. 129–139, 2010.
[9] L. Wang, M. Zhu, L. ping Deng, and X. Yuan, “Automatic pectoralmuscle boundary detection in mammograms based on markov chainand active contour model,” Journal of Zhejiang University - ScienceC, vol. 11, no. 2, pp. 111–118, 2010.
[10] E. W. Dijkstra, “A note on two problems in connexion with graphs,”Numerische Mathematik, vol. 1, pp. 269–271, 1959.
[11] J. S. Cardoso, A. Capela, A. Rebelo, C. Guedes, and J. F. P. da Costa,“Staff detection with stable paths,” IEEE Trans Pattern AnalysisMachine Intelligence, vol. 31, pp. 1134–1139, 2009.
[12] H. P. Oliveira and J. S. Cardoso, “Image retargeting using stable paths,”in Proc of the Fourth International Conference on Computer VisionTheory and Applications, vol. 2, 2009, pp. 40–47.
[13] I. Domingues, J. S. Cardoso, I. Amaral, I. Moreira, P. Passarinho, J. S.Comba, R. Correia, and M. J. Cardoso, “Pectoral muscle detection inmammograms based on the shortest path with endpoints learnt by svms(submitted),” in Proc of the 32nd Annual International Conference ofthe IEEE Engineering in Medicine and Biology Society, 2010.
![[PPT]Appendicular Skeleton Pectoral Girdle and Upper … · Web viewAPPENDICULAR SKELETON PECTORAL GIRDLE AND UPPER LIMB PECTORAL GIRDLE scapula humerus clavicle CLAVICLE sternal](https://img.pdfslide.us/doc/110x75/5b1c49a87f8b9a2d258f98c3/pptappendicular-skeleton-pectoral-girdle-and-upper-web-viewappendicular-skeleton.jpg)