Embed Size (px)
Citation preview

REVIEW
IMPROVING LIVES THROUGHAGRICULTURAL RESEARCH
Issue 13, April 2013
HQ/001/13


Foreword
New information for New Agriculture in Trinidad and TobagoAuthor - Sarah Persad-MaharajMinistry of Food Production, Research Division Library (MFP/RDL)Central Experiment Station, Centeno, Trinidad & Tobago
Evaluation of soil substitutes and protected structure covering material on the performance of tomatoes under a Protected Agriculture System (PAS)Authors - Dorian Etienne 1, Sharon Jones 1 and Trevonne Douglas 2
1Caribbean Agricultural Research and Development Institute (CARDI), Commonwealth of Dominica2 Division of Agriculture, Ministry of Agriculture & Forestry, Commonwealth of Dominica
An examination of temperature and rainfall trends in Trinidad and Tobago from 1970 to 2011Authors - F.B. Lauckner and M. JonesCaribbean Agricultural Research and Development Institute, Trinidad and Tobago
Editorial Guidelines
Instructions for Authors
Sample Layout
Table of ConTenTs
Page
2
3
14
21
33
34
38

foreword
This is the first issue of CARDI Review for sometime. The problem seems to be that the busier people are, the less time becomes available for the very important task of writing up the results for a scientific audience. In a sense that may seem to be contradictory as scientists who are not busy will probably have little to write about.
This issue contains articles on two of the topics which are keeping CARDI scientists very busy and an invited article from the very experienced information specialist at the Research Division of the Trinidad and Tobago Ministry of Food Production. The specialist, Mrs Persad – Maharaj carried out a survey on the information needs for the “New” Agriculture and we are very happy that she has shared the findings with us. The two articles by CARDI authors deal with emerging issues identified under the “New” Agriculture paradigm. These issues are Protected Agriculture (PA) and Climate Change; issues which require a lot of work to improve our knowledge and which are certainly helping to keep our scientists more than occupied.The experiences in Dominica in the search for low cost, easily available PA inputs are outlined. These experiences include some frustrations due to climatic difficulties (climate change?). However, it is very important to record positive and negative experiences which is what is done in the article.
Climate Change is here. Or is it? There are still a number of scientists who query this, including some distinguished names in the Caribbean. The article in this issue of CARDI Review examines weather records in Trinidad and in Tobago for the last 40 years. This is not the first time that a similar examination has been carried out, but in this study there is an attempt to read between the lines. Has there been any climate change in Trinidad and Tobago? The conclusion is “yes”, but perhaps not as much as some might claim. The debate is still open.
F B LaucknerEditor, CARDI Review
Page 2

new informaTion for new agriCulTure in Trinidad and Tobago
Sarah Persad-Maharaj
Systems Librarian, Ministry of Food Production, Research Division Library (MFP/RDL)Central Experiment Station, Centeno, Trinidad & Tobago
Email: [email protected]
ABSTRACT
The Research Division Library (RDL) is the main knowledge centre in the Ministry of Food Production, Trinidad and Tobago. It began its digitisation programme in 2011 which required some baseline information on knowledge access, usage, relevance and institutional capacity. The most recent qualitative report undertaken by FAO in 2008 noted that most public domain agricultural information was not yet widely accessible. Inadequate information was further cited as a recurrent challenge to agricultural development. A user survey of 101 random stakeholders was undertaken to provide both quantitative and qualitative parameters for informing the design of an appropriate knowledge transfer model for local agriculture. These indicators are useful in determining the profile and needs of the New Agriculture. Recent shift towards a knowledge based economy has highlighted the importance of knowledge resources as a key competitive asset. The value proposition of leveraging knowledge through a new transfer model presents a strategic option for exploiting agricultural knowledge at the right time, to the right person and in the right format. The underlying assumption is based on strategic positioning of the knowledge asset for a sustainable and profitable sector. Keywords: knowledge transfer, agricultural information, Trinidad and Tobago
Page 3

INTRODUCTION
The convergence and confluence of new knowledge and Information Communication and Technologies (ICTs) have had a profound impact on the life and work of the agricultural community. In an era of rapid socio-economic changes, lifelong learning skills are necessary for enhancing knowledge access for competitive gains. There is a paradigm shift from informing people towards a knowledge based society of active collaboration in the democratic processes of Trinidad and Tobago. The social dialogue itself is changing. The awareness and assertion of the once marginal farmers’ groups and users are becoming significantly vociferous. Traditional constraints of literacy, age, time and space are collapsing.
There is an established association in developed countries between effective information transfer and high agricultural productivity. This paper seeks to explore the proposition that a combination of traditional and technology driven platforms can reduce communication barriers and reach varying abilities, ages and skills. It is suggested that leveraging agricultural knowledge through a new model can position the sector for sustainable and profitable development. Libraries and knowledge centres can assist in this transformation process.
AGRICULTURE INFORMATION PERSPECTIVES
“... knowledge is always embodied in a person, carried out by a person; created, augmented and improved by a person; applied by a person; taught and passed on by a person; used or misused by a person.” (Drucker, 1993: 210)
The Trinidad and Tobago agriculture sector at present is characterised by a weak information infrastructure, fragmented farms and involvement of numerous intermediaries (Zwart 2008). Several farmers are resource poor and face many challenges including diseconomies of scale (Seepersad 2003). Efficient knowledge transfer can improve both productivity, value chains and marketing by communicating best practices, timely and appropriate information (Munyua, Adera and Jensen 2009). Knowledge can play a key role in ensuring food security (Zwart 2008). Strategic use of ICTs can facilitate a model for shared learning, information intensive farming and ‘precision agriculture’ which may be the next farming revolution (Srinivasan 2006).
Drucker (1965) has argued that knowledge would effectively replace land, labour and capital as the key input to production and productivity. Researchers note that sustainable and increased future production is dependent on integrated knowledge applications such as organic farming, effective irrigation management, soil testing and preparation as well as greater use of biotechnology (Malhan and Rao 2008). This implies an increasing demand for multidisciplinary information and accurate knowledge transfer at all levels.
The issue of effective agricultural knowledge transfer has arisen from varied views expressed by the decision makers, farming community, consultants and extension officers regarding Trinidad and Tobago. Consultants have reported that “most public domain agricultural information is not yet widely accessible” (Zwart 2008). Weak linkages between agricultural research and extension farmer services further limit the contribution of information to agricultural development (Ganpat 2010).
In the emerging environment there is opportunity to review the role of agricultural libraries in knowledge transfer and their contribution to the national sector. The current knowledge model is mainly linear and
Page 4

information reach is limited by personal contact, printed documents and limited technology. The complexity of knowledge needs within the Ministry of Food Production makes it vulnerable to knowledge stickiness, rapidly changing ICTs and increasing demands for multidisciplinary information as a competitive resource. The proposed model suggests an expanded knowledge flow to incorporate ICTs and sharing of best practices from one person or department to benefit all stakeholders.
From an institutional perspective, the Research Division Library (RDL) has an established role in managing explicit knowledge and is well positioned to assist in leveraging this knowledge resource. The adoption of a knowledge management approach has the potential to bridge the knowledge gap, cluster all value chain participants and reduce duplication costs of business operations. The RDL is thus embedded in a complex and dynamic environment which places considerable emphasis on knowledge and its multiplier effects. An appropriate framework is necessary to shape a new model for data, information and knowledge capture, creation and dissemination.
The research proposes that leveraging the knowledge resources in agriculture can significantly reduce unique local challenges and facilitate efficient agricultural production. Expected benefits include knowledgeable farmers and stakeholders, application of creative ideas and informed technologies as well as development of agricultural intellectual capital. Findings of this study are significant in shaping the rationale and direction for improving agricultural development in Trinidad and Tobago and the Caribbean.
METHODOLOGY
The methodology was informed by a literature search, user questionnaire and structured interviews. The literature survey was thorough in relation to the concept of knowledge management and its relevance to agricultural services today. The structure of the user questionnaire was guided by the stated proposition. Interviews were conducted with decision makers to determine ministerial policy and strategic directions for managing agricultural information. The choice of study allowed analysis of data from a wide cross section with comparatively small investments of time and cost.
The user questionnaire was administered through face to face contact by the researcher and two trained extension officers. Follow up telephone calls were used for clarification and random testing of validity of information. The intention was to find correlations between agricultural information access, applications, knowledge participation and productivity.
The population sample considered random agricultural information users, farmers and stakeholders who were citizens of Trinidad and Tobago aged 17 and above. Convenience sampling was restricted to persons associated with agricultural sector. All Trinidad ethnicities were used as well as both males and females. Baseline data recorded age, sex and user profile. Resource and access preferences, skills and awareness, as well as active participation in knowledge networks were recorded. In addition information access skills and internet access options were noted. Using the stated criteria, 101 records were compiled, analysed and evaluated.
Data analysis converted the quantitative statistical data into useful qualitative information. The degree of linear relationship between agricultural information access and agricultural productivity was calculated for positive or negative values. The Statistical Package for the Social Sciences (IBM SPSS) was used for
Page 5

descriptive and inferential analysis of data collected in this study. Data was analysed to evaluate current access to agricultural information and to determine extent of association between use of agricultural information and productivity in the sector.
PRESENTATION OF RESULTS AND ANALYSIS
New profile of respondents
It was interesting to note that a higher percentage of respondents (57%) were females. This concurs with the Inter-American Institute for Cooperation on Agriculture’s (IICA) most recent assertion that ‘Women are the backbone of small farms’ (Francis 2010) which is the type of farming predominant in the local sector. The literacy levels were higher than expected with only 4.1% registering primary school level and 100% indicating no interest in basic literacy training. A cumulative 96% attained secondary / vocational certification and above. Of this number, 73.2% had attained or enrolled at university (Figure 1).
Page 6
Figure 1 Level of education (percentage)

This is a significant change in perception of literacy among rural farmers. On the one hand, it may suggest an element of random bias. On the other hand, it may signify the need for further profiling whether educated persons are being attracted into agriculture through government incentives, the Ministry of Food Production’s apprenticeship programme (APDP) or the downturn in the petroleum sector. The renewed interest in agriculture may also be parallel to developments in the 1980’s when the local economy was not buoyant and food security was threatened. If so, then the thrust to develop an effective knowledge channel is quite timely and relevant.
Relevance of agricultural knowledge
The relevance of knowledge improvement to an agricultural career was endorsed by 98% of respondents (Figure 2). A cumulative 92.6% rated jobs in agriculture as average or above. Of this number, 47.3% considered employment in the sector as either good or very good. This could be interpreted as either financially rewarding or holistically fulfilling. Whether these jobs were part time, self employed, civil servant contracted or otherwise could be further explored. Dissatisfaction was expressed by a mere 7.4% who possibly reflect low productivity or the traditional stigma attached to farming. Access to learning opportunities reflected a similar response.
Page 7
Figure 2 Relevance of knowledge improvement to agricultural career
There were fluctuating concerns about the environment. There was less enthusiasm by 66.7% about the general environment. However, a total of 95.9% was either concerned or very concerned about a healthy environment. This may signify room for improving levels of corporate social responsibility through public awareness in the sector.

Page 8
Figure 3 Confidence about willingness to try new methods
Reluctance to try new methods may have further implications when correlated with the preference of respondents for free information. While knowledge access is currently a free service and maintained by the central government, the need to develop a business-like knowledge channel may have to consider future charges for sustainability and continuous improvements. In addition, there are financial requirements to be maintained with regard to copyright, intellectual property and patents legislation.
A thirst for further education via distance education was endorsed by 76.8% with 44.8% interested in computer literacy. A recurrent 66.7% were confident in accessing information with a higher capture of 73.4% knowing where to find information when needed. It may be inferred that those knowing where to find information when needed probably belong to active knowledge networks and are correlated to the 73.2% who possessed university level of education. Again, the higher level of education has implications for staffing provisions and training to serve this clientele.
Respondents were asked to name one or more sources of preference for knowledge, the highest number of 73.5% preferred to use the electronic media, followed by 67.3% retaining preference for print. Radio/television attracted 23.4% and those willing to adopt cell phone SMS texts to share information dropped to 19.4%. This may be correlated to literacy levels of respondents and contrasts sharply with emerging global trends where cell phones are gaining acceptance as a preferred knowledge channel in rural Africa, India and some areas in the Caribbean.
There was a similar tendency when asked about their willingness to try new methods or new technologies (Figure 3). A total of 66.7% were both willing and confident to try new methods as against a higher percentage of 93.8% who were willing to try new technologies. Reluctance to try new methods may be correlated with the same 66.7% who were just confident in accessing knowledge and who probably had lower risk profiles. This was also reflected in the relatively low percentage of 13.3% involved in agribusiness. When correlated with the age groups, those oriented to new technologies were positively skewed to the younger age groups.

Sharing the knowledge asset
A cumulative 81.2% were willing to share their success stories of which 66.7% expressed confidence in their ability to do so. This may suggest another opportunity for the agricultural knowledge conduit to develop a forum for seminars, discussions and knowledge cafes to strengthen sharing of the tacit assets. At the same time, academic researchers accounted for 3% of the total random population sample where 73.2% possessed university level of education. This has high significance in terms of customer services such as sharing knowledge, extension services, networking and ability to implement research. The high level of literacy captured is unusual for a small developing nation.
A high degree and variety of knowledge outputs from the respondents could be placed into three broad groups (Figure 4). In the first grouping, 86.2% shared their success stories through personal contact and 53.8% used power point presentations. This factor of personal contact resonated with the subsequent preference of respondents for knowledge from the library in preference to extension officers. At present, the library has a highly personalised customer service which may need to be retained in any new channel.
Page 9
In the second group, 31.9% contributed to pamphlets, 25.5% to technical reports and 24.5% in theses. In the third grouping, 17% shared electronically, 14.9% wrote newspaper articles and 5.3% contributed to a chapter of a technical or scientific book. Overall, personal and print contacts were the preferred mode of sharing knowledge.
Figure 4 Knowledge sharing outputs

Knowledge sources
The library as an agricultural knowledge source ranked second to the internet but higher than the extension officers, radio/television and newspapers (Figure 5). When other farmers were compared as a knowledge source, the library ranked first but other farmers displaced the extension officers. Factors surrounding this result can be matched by an earlier response for personal contact preference.
Page 10
Figure 5 Knowledge source preferences
CONCLUSION
At present value in the proposed model (Figure 6), it is suggested that a combination of tacit and explicit elements of knowledge underpin transfer. In the process, the more knowledge resources are used, the more the present value appreciates. This is in significant contrast to usage of other agricultural assets which tend to depreciate with use over time.
At increased value, adoption of ICT can improve access and storage while reducing duplication, loss and disintegration risks. The software used in digitisation allows searching for information by natural language terms. This means that locating information within documents will become easier, faster and more reliable to all levels of users.
At the same time, creation of a digital library will facilitate compatibility with and network readiness to

Page 11
take advantage of the free but vast knowledge resources available globally. Existing archives of paper have many shortcomings. Many are rare works and only accessible to a small population of researchers and academia at a specific geographic location. A single act of destruction at RDL can destroy an entire era of research. Digital technology can improve safety of local agricultural research significantly.
At the maximum value, the knowledge resources can spiral to encourage innovation, earn revenue through royalties, improved productivity and application of new technologies. As we enter the 21st century, the implementation of a new knowledge transfer model can exploit agricultural knowledge for the right price, at the right time, to the right person and in the right format.

Figure 6 Library knowledge transfer model
Page 12

REFERENCES
Drucker P. F. 1965. The effective executive. New York: Harper & Row
Francis D (ed). 2010. Agriculture in the Caribbean: situation and outlook. St. Augustine, Trinidad and Tobago: CaRAPN/CTA/IICA
Ganpat W and de Freitas C. 2010. ICTs for extension in the English speaking Caribbean. In: Saravanan R (ed.) ICTs for agricultural extension: global experiments, innovations and experiences . New Delhi: New India Publishing Agency, Chapter 2
Malhan I V and Rao S I (eds). 2008. Perspectives on knowledge management. Lanham, Maryland: Scarecrow Press
Munyua H, Adera E and Jensen M. 2009. Emerging ICTs and their potential in revitalizing small- scale agriculture in Africa. Agricultural Information Worldwide 2:3-9
Seepersad J. 2003. Case study in ICTs for agricultural extension in Trinidad and Tobago. A paper prepared for CTA’s ICT Observatory 2003 “ICTs—transforming agricultural extension”,Wageningen, 23-25 September 2003 <http://db.natlaw.com/interam/tr/ec/sp/sptrag00001.pdf > (accessed 13 November 2012)
Srinivasan A (ed). 2006. Handbook of precision agriculture: principles and applications. New York: Food Products Press
Zwart R P. 2008. FAO approaches in agricultural information management. Port of Spain: FAO/MALMR
Page 13

evaluaTion of soil subsTiTuTes and proTeCTed sTruCTure Covering maTerial on The performanCe of TomaToes under a
proTeCTed agriCulTure sysTem (pas)Dorian Etienne 1, Sharon Jones 1 and Trevonne Douglas 2
1Caribbean Agricultural Research and Development Institute (CARDI)Valley Rd, Roseau, Commonwealth of Dominica
2 Division of Agriculture, Ministry of Agriculture & Forestry, Botanic Gardens, Roseau, Commonwealth of Dominica
Email: [email protected]
ABSTRACT
Tomato (Lycopersicon esculentum) is the most popular protected agriculture cultivated crop in Dominica. Production is however characterised by low yields and an increasing incidence /severity of bacterial wilt (Ralstonia solanacearum). A trial was conducted to evaluate the suitability of four locally available media to exclude the disease and make production cost effective. The media were promix, coconut coir, partially decomposed plant residue from the bay oil extraction process and a locally produced organic compost. Soil was used as a control media. TX54, the most commonly grown tomato variety, was selected for the trial. All plants were subjected to the same fertiliser regime and other management practices. The trial was conducted in two protected agriculture structures, one with blue plastic covering and the other with reinforced clear plastic cover. The highest yields were obtained from the organic compost and from the bay oil residue. Plants grown in the organic compost were shorter than those grown in the bay oil residue. Plants grown under the reinforced clear plastic were taller than those grown under the blue plastic. The types of cover did not affect fruit yield, neither structure cover nor potting mix type had any effect on plant width.
Keywords: Protected agriculture systems, tomatoes, soilless potting media, coconut coir, bay leaf industrial waste, organic compost, promix, Dominica
Page 14

Page 15
INTRODUCTION
In Dominica there has been a high economic investment in protected agricultural system (PAS) technology. Crops are usually grown in ground bed soil and micro climates are generally hot, humid and wind-free, ideal for the development of pests and diseases, ever increasing in subsequent production cycles.
Tomato is one of the most important crops but bacterial wilt (Ralstonia solanacearum) has become a major production challenge within the greenhouse where ground bed soil is the preferred media for production (Jarvis 1997). Soilless pot culture with nutrient addition is the preferred strategy that farmers have adopted to manage the disease.
In Dominica, compost and other non-soil media from the coconut and bay oil industries are readily available. This research evaluated the effects of these media under two different PAS on plant growth, yield and disease control.
MATERIALS AND METHODS
The trial was conducted in the north west of Dominica at the One Mile Agriculture Station in Portsmouth. Two PAS of identical design (ridge arched, 4.80 m high to the apex, 30.48 m long and 9.14 m wide) were used to conduct the trial. The design was chosen based on recommendations by project consultant Mohyuddin Mirza to allow for dissipation of hot air and to encourage air flow. The structures were adjacently located, had an east-west orientation and were parallel to the prevailing winds.
Each PAS had a different plastic covering, to vary the quality of light available under the structure (Plates 1 and 2). One of the structures was covered with blue plastic (0.1mm thick) that allows light transmission of 80% and the other with Griffolyn Tx1200 reinforced clear plastic (0.25 mm) with single seams transmitting 80% diffused light. The irrigation system (Plate 3) was an auto regulating 10 cm drip that emitted 2.5 L/hr. Black blow mould pots (1000 cc) served as containers to hold the potting media
Plate 1 Protected agriculture structure with blue plastic covering
Plate 2 Protected agriculture with clear reinforced plastic covering

The floor of each PAS was covered with construction plastic to prevent ground water and soil from coming into contact with the roots of the plants. The construction plastic was overlain with black ground covering to prevent weed growth.
Tomato cultivar TX54 was used in the trials. The seeds were sown on 25 February 2011 and seedlings were transplanted 3 weeks later on 21 March 2011. The pots were spaced 30 cm apart along rows spaced 60 cm apart. Standard agronomic practices as needed for tomato production were used (Snyder 2003).
An Integrated Pest Management approach was used to control the aphids, mites, tomato horn worm, leaf mold, powdery mildew, and phytopthora root rot that needed attention. No symptoms of bacterial wilt were observed.
A randomised block design was used in each of the two PAS. Each randomised block had three replicates of five potting media, namely bay leaf industrial waste, Bellevue organic compost, promix, coconut coir and soil.
Slow release 15-9-12 fertiliser was incorporated into the media at planting at a rate of 9.6 g per plant. Potassium Nitrate, which has an NPK rating of 13-0-44, was also applied biweekly throughout the crop cycle through fertigation at a rate of 300 ppm. Water was applied to meet plant needs using drip irrigation.
The plant height and width, number of flowers per cluster, number of marble-sized and table tennis-size berries per cluster, weight of harvested berries per plant, disease and pest incidences were recorded.
Page 16
Plate 3 Irrigation lines placed on top blow mould pots

Page 17
Blue plastic cover Reinforced clear plastic cover
In both PAS 50% flowering and fruiting were observed in plants grown in Bellevue compost in excess of 1 week before those in other media, however, fruits reached maturity faster in the structure with the blue plastic cover. This is shown in Table 1 by the largest number of fruits harvested in the first picking being from plants grown in Bellevue compost in PAS1.
RESULTS AND DISCUSSION
At the time of transplanting, 21 March 2011, the average plant height for all media in the PAS were the same (15 cm). By the end of the growing season, plants grown in the greenhouse covered with Griffolyn Tx1200 reinforced clear plastic were significantly taller (P ≤ 0.05) than the plants grown in the greenhouse covered with blue plastic (Figure 1).
Plants grown in bay leaf industrial waste, coconut coir, promix and soil were similar in plant height within each greenhouse. However, in both greenhouses plants grown in Bellevue compost were consistently shorter than plants grown in the other media.
There were no significant differences (P> 0.05) in plant width between coverings and among media.
Figure 1 Growth pattern of tomato plants in five potting media in the two protected agriculture structures

Page 18
Bellevue compost produced the highest total weight of ripe and turning berries (Figure 2). The total berry weight from plants grown in coconut coir and soil in both PAS were significantly lower than the berry weights from plants grown in Bellevue compost and bay leaf industrial waste (P≤ 0.05).
PAS1: Structure with blue plastic coverPAS2: Structure with reinforced clear plastic cover
Figure 2 Total weight (kg) of harvested berries for the first four pickings of tomatoes grown in different potting media under PAS with blue plastic cover (PAS1) and reinforced clear plastic cover (PAS2)
Table 1 Mean number of tomato fruits harvested for the first four pickings under different potting media in two protected agriculture structures

The collection of yield data was terminated after four pickings. The primary contributing factor was the frequent and extended disruptions of the irrigation cycle following heavy rains which either washed away the streambed intake or filled it with stones and debris that subsequently clogged sections of the irrigation system (Plate 4). While some hand watering was done during those periods, wilting, desiccation of plants and flower abortion were frequently observed.
Page 19
Plate 4 Effects of disruption of irrigation cycle.
CONCLUSION
The experiment was established in an area with a high incidence and severity of bacteria in the neighbouring greenhouses. Despite symptoms of the disease not being observed even in plants grown in unsterilised soil as the control medium, the experiment did generate useful information for greenhouse tomato farmers who use pot culture as a management strategy for the disease.
The results of the experiment showed that greenhouse covering type significantly influenced plant height and fruiting pattern during the period from March to June when the days are long and nights are short. The type of planting medium also influenced these crop performance parameters. The experiment also generated data that supports the farmer observation that the waste of bay processing is a high yielding planting medium for short term crops. While Bellevue compost recorded the highest overall yields these were not significantly different from the much cheaper bay leaf industrial waste. Both soilless potting media outperformed imported coconut coir and Promix.

Page 20
ACKNOWLEDGEMENTS
The Caribbean Agricultural Research and Development Institute (CARDI) wishes to express many thanks to the Governments of the Region and the Inter-American Institute for Cooperation on Agriculture (IICA) for funding this research effort.
Special thanks also to our many stakeholders and collaborators especially the National Association of Youth in Agriculture (NAYA), the Division of Agriculture of the Ministry of Agriculture and Forestry in Dominica for their continued contributions and support, and the staff of the Portsmouth Agricultural Station.
REFERENCES
Jarvis W R. 1997. Managing diseases in greenhouse crops. St. Paul, Minnesota: APS Press
Snyder R. 2003. Greenhouse tomato handbook. Mississippi: Mississippi State University Extension Service. Publication no. P1828

an examinaTion of TemperaTure and rainfall Trends in Trinidad and Tobago from 1970 To 2011
F.B. Lauckner and M. Jones
Caribbean Agricultural Research and Development Institute, P.O. Bag 212, Frederick Hardy BuildingUniversity of the West Indies, St. Augustine Campus, St. Augustine, Trinidad and Tobago W.I.
Email: [email protected]
ABSTRACT
Temperature and rainfall data were examined from two sites: Piarco, Trinidad (10°37’N; 61°21’W) and Crown Point, Tobago (11°09’N; 60°51’W). The Trinidad data cover the period January 1 1971 to December 31 2010 where data of maximum and minimum temperatures and rainfall were recorded daily. The Tobago data cover the period January 1 1970 to December 31 2011 with two gaps in the temperature data of 5 months and just under 2.5 months respectively and also some other days without data. The rainfall data for Tobago had three gaps in recordings of 1 month each and two further gaps of 9 and 7 months respectively. Linear regression models suggest average annual rises at Piarco of maximum and minimum temperatures of 0.04894°C and 0.04551°C respectively. At Crown Point similar models suggest average annual rises of maximum and minimum temperatures of 0.01332°C and 0.03468°C respectively. No rainfall trends could be discerned at Piarco. At Crown Point there is some evidence to suggest that rainfall is increasing in May and decreasing in October, no rainfall trends could be discerned for the other 10 months or on an annual basis.
Keywords: climate change, maximum temperature, minimum temperature, rainfall, Trinidad and Tobago
Page 21

INTRODUCTION
According to the USA National Research Council (2010), climate change is occurring and human activities are responsible. This supports an earlier position of the World Meteorological Organization (UNEP 1997)The International Panel on Climate Change (IPCC) have examined climate models and estimated that global surface temperature will rise between 1.8°C and 4.0°C by 2099 depending on the concentration of CO2 and other greenhouse gases (IPCC 2007). In the Caribbean, CARICOM has stated that efforts should be made to limit temperature rise in the Caribbean to 2.0°C or less by the end of the century.It is not clear whether these predictions and guidelines include the possibility that there has already been some rise in global temperatures. According to the UK Met Office (2012), all the warmest years on record in a series dating back to 1850 have occurred since 1990. Although 2011 was a “cooler” year because of a very strong La Nina it was still the 11th warmest on record and 0.36° C above the 1961-1990 global average.
MATERIALS AND METHODS
We examined daily meteorological data collected at two sites in Trinidad and Tobago (i) Piarco International Airport, Trinidad (10° 37´ N; 61° 21´ W) (ii) Arthur N. R. Robinson Airport, formerly Crown Point International Airport, Tobago (11° 09´ N; 60° 51´ W). The Trinidad site data was for the 40-year period from 1 January 1971 to 31 December 2010 and the Tobago site data were for the 42-year period from 1 January 1970 to 31 December 2011. The three data variables examined were:• Maximum temperature (°C)• Minimum temperature (°C)• Rainfall (mm)
Using the daily data, average daily maximum and minimum temperatures were calculated for each month during the 40-year and 42-year periods as well as the monthly rainfall totals for each month. Also calculated were the average daily maximum and minimum temperatures for each year of the 40-year and 42-year periods and the annual rainfall totals. The rainfall data were further examined to identify days with no rain and days with over 10 mm of rain. From this the total number of dry days and wet days for each month and for each year were calculated. All the above calculations were done using Instat (2008). Finally the first, second and third wettest days for each were year determined. Annex 1 shows the annual summaries for Piarco, Trinidad and Annex 2 shows the annual summaries for Crown Point, Tobago.The annual and monthly values were then exported to Excel and then imported into GenStat (VSN International 2011) for the statistical analyses described below.
RESULTS – TRINIDAD SITE
There were no gaps in the Trinidad data; the three variables were recorded every day for the 40-year period. For each month and also the annual data, 40 year time series for all the temperature and rainfall parameters were plotted. The 26 temperature time series (12 months and annual for average maximum and minimum temperatures) all appeared to show strong linear trends, so linear regression models were fitted for the 26 calculated variables against time in years (1971 to 2010). The 39 rainfall time series (12 months and annual for total rainfall, number of wet days and number of dry days) all appeared to show random scatters around the 40 year means. Nevertheless linear regression models were also fitted for these 39 calculated values against time in years (1971 to 2010). The time series fits of the amounts of rain on the first, second and third wettest days of the year and the total of these three days also failed to show anything other than a random scatter.
Page 22

Maximum temperature
Table 1 shows the estimated linear regression coefficients and standard errors of the following models fitted for each month and for the year yi = axi+ ԑi (1)where y is the average daily maximum temperature (°C) at Piarco, Trinidad, x the year (i = 1971, 1972, 1973 …..2010), a is the linear regression coefficient and ϵ is the random error. The linear regression coefficients are an estimate of the annual temperature rise and the final column in Table 1 is obtained from multiplying the linear regression coefficients by 40 and is thus an estimate of the maximum temperature rises over the 40-year period from 1971 to 2010. Note that as the regressions were fitted over 40 years, there were 38 residual degrees of freedom. All the t values (coefficient/standard error) were very highly significant (P < 0.001).
Page 23
Table 1 Linear regression coefficients with standard errors of average daily maximum temperatures (°C) at Piarco, Trinidad fitted against year from 1971 to 2010
Minimum temperature
The procedure described above for maximum temperature was repeated for minimum temperature and Table 2 shows the estimated linear regression coefficients and standard errors of models similar to (1) above, but for minimum temperatures.
The final column is Table 2 was similarly obtained from multiplying the linear regression coefficients by 40 and is thus an estimate of the minimum temperature rises over the 40-year period from 1971 to 2010. Once again all the t values (coefficient/standard error) with 38 degrees of freedom were very highly significant (P < 0.001).

Page 24
Table 2 Linear regression coefficients with standard errors of average daily minimum temperatures (°C) at Piarco, Trinidad fitted against year from 1971 to 2010
Rainfall
As described above three different linear model types were fitted for monthly and annual rainfall. These were:
• Total monthly or annual rainfall• Number of days with no rain recorded• Number of days with more than 10 mm of rain.
Once again linear models similar to (1) above were fitted for these three independent (x) variables for each month and also for the annual data. Table 3 shows the linear regression coefficients and standard errors for the 39 models fitted. In all 39 models there were no significant t tests (P > 0.05). In each of the 39 cases the scatter diagrams for the 39 independent x values against the year did not suggest anything other than a random distribution around the mean values for the 40 years. There also did not appear to be any time series relationship of the rainfall amounts on the first, second and third wettest days of the year, and the total of these three days.

Page 25
Table 3 Means and standard errors of linear regression coefficients of rainfall observations at Piarco, Trinidad fitted against year from 1971 to 2010
RESULTS – TOBAGO SITE
Temperature
There were two gaps in the Tobago temperature data. During the following periods there were no data available December 19 1984 – February 28 1985 June 1 2001 – October 31 2001
In addition to the above major data gaps, there were several occasions throughout the 42-year period when single days were without a data recording.
Because of these gaps in the data the monthly and annual time series did not include the following data: January: 1985 February: 1985 June: 2001 July: 2001 August: 2001 September: 2001 October: 2001 December: 1984 Annual: 1984, 1985, 2001
The annual temperature summaries shown in Annex 2 are missing 13 days of data for 1984; 28 for 1985 and 153 for 2001.
Thus the regressions fits for January, February, June, July, August, September, October and December were for 41 years; for March, April, May and November June and July the regression fits were for 42 years data.

If any month was missing during a calendar year the averages and totals for those years were considered to be biased according to whether the missing months were during the hotter or cooler times of year or during the wetter and drier times of year. So the annual data used was for 39 years.
The 26 temperature time series (12 months and annual for average maximum and minimum temperatures) plotted against year of data usually showed clear linear trends; some appeared to be random scatters. There was no evidence of any trends other than linear.
Maximum temperature
Table 4 shows the estimated linear regression coefficients and standard errors of models similar to (1) but for maximum temperature (°C) at Crown Point, Tobago for the years 1970 to 2011, but with certain years omitted as described above. The t value (coefficient/standard error) for January was significant (P = 0.026), 39 degrees of freedom. For the months February to June the t values were not significant (P > 0.05, in fact all P > 0.20), 39 or 40 degrees of freedom. For all months from July to November the t values were very highly significant (P < 0.001), 39 or 40 degrees of freedom. For December the t value was highly significant (P = 0.003), 39 degrees of freedom. For the annual data the t value was highly significant (P = 0.004), 37 degrees of freedom. The column in Table 4 estimates the total temperature rise or fall over a 40 year period. This has been calculated for 40 years, and not 42 years the length of the data series, so that a direct comparison can be made with the Trinidad analysis. In Tobago the fits indicate maximum temperature rises peaking in September; there do not appear to be any rising maximum temperature trends during most of the dry season (February to May).
Table 4 Linear regression coefficients with standard errors of average daily maximum temperatures (°C) at Crown Point, Tobago fitted against year from 1970 to 2011 with certain years omitted as shown
Page 26
Minimum temperature
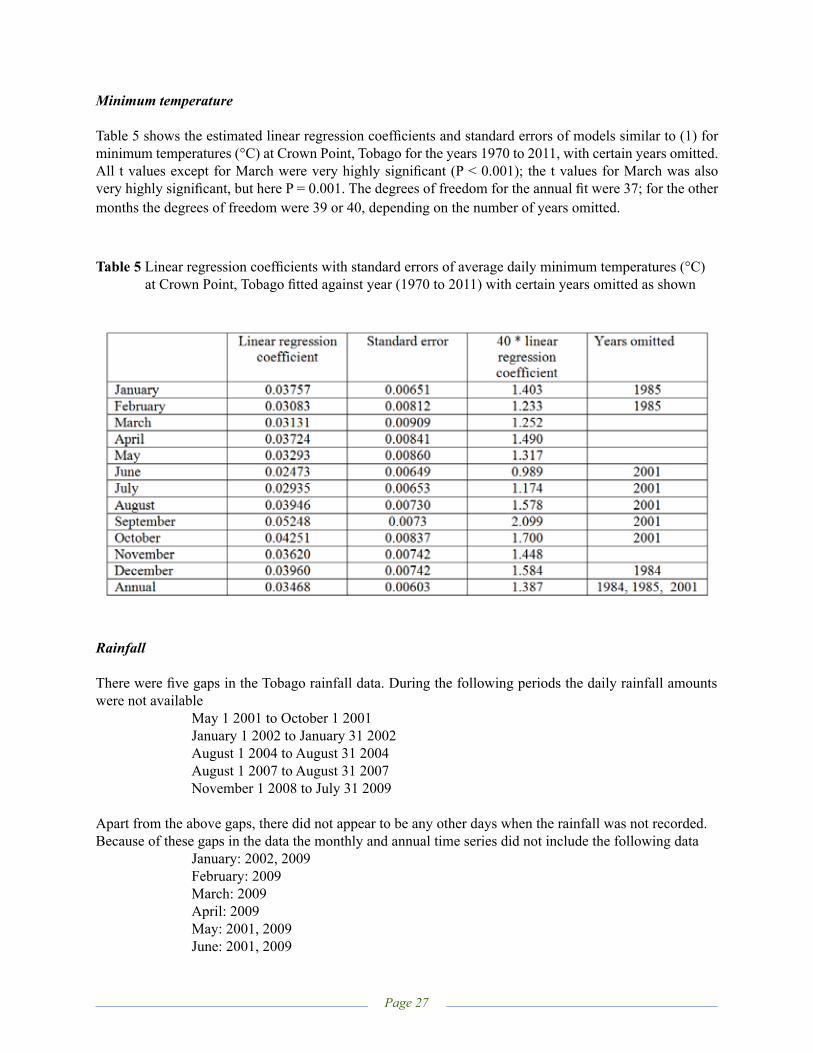
Table 5 shows the estimated linear regression coefficients and standard errors of models similar to (1) for minimum temperatures (°C) at Crown Point, Tobago for the years 1970 to 2011, with certain years omitted. All t values except for March were very highly significant (P < 0.001); the t values for March was also very highly significant, but here P = 0.001. The degrees of freedom for the annual fit were 37; for the other months the degrees of freedom were 39 or 40, depending on the number of years omitted.
Table 5 Linear regression coefficients with standard errors of average daily minimum temperatures (°C) at Crown Point, Tobago fitted against year (1970 to 2011) with certain years omitted as shown
Rainfall
There were five gaps in the Tobago rainfall data. During the following periods the daily rainfall amounts were not available May 1 2001 to October 1 2001 January 1 2002 to January 31 2002 August 1 2004 to August 31 2004 August 1 2007 to August 31 2007 November 1 2008 to July 31 2009
Apart from the above gaps, there did not appear to be any other days when the rainfall was not recorded.Because of these gaps in the data the monthly and annual time series did not include the following data January: 2002, 2009 February: 2009 March: 2009 April: 2009 May: 2001, 2009 June: 2001, 2009
Page 27

July: 2001, 2009 August: 2001, 2004, 2007 September: 2001 October: 2001 November: 2008 December: 2008 Annual: 2001, 2002, 2007, 2008, 2009
The footnotes for Annex 2 indicate which of the above years are not included for the annual rainfall data and which of the above years contain some missing records.
Thus the regression fits for February, March, April, September, October, November and December were for 41 years; For May, June and July the regression fits were for 40 years and for August there were 39 years. Because of the missing months the annual data did not include any of the years with missing months (i.e. 2001, 2002, 2007, 2008 and 2009); thus the annual data regression fits were for 37 years.
The number of wet days per year and the number of dry days were not examined as it was thought that the single day data gaps might cause these counts to be biased.
Table 6 shows the estimated linear regression coefficients and standard errors of models similar to (1) for rainfall observations for the years 1970 to 2011, with the indicated years omitted. Most of the t values for total rainfall were not significant (P > 0.05), but there were a few exceptions; the coefficient suggesting increased rainfall in May was significant (P = 0.017) and the coefficient suggesting decreased rainfall in October was also significant (P = 0.047). The coefficient suggesting increased rainfall in January was not quite significant at P < 0.05, (P = 0.056). Only one of the regression coefficients for days with more than 10mm of rain was significant i.e. May, P = 0.041. For the other eleven months and the annual fit all P > 0.1. As in Trinidad, there was no time series relationships of the rainfall amounts on the first, second and third wettest days of the year and the total of these three days.
Table 6 Means and standard errors of linear regression coefficients of rainfall observations at Crown Point, Tobago fitted against year from 1970 to 2011 with certain years omitted
Page 28

DISCUSSION
These results appear to confirm that Trinidad and Tobago is experiencing the same phenomenon of warming as is being reported elsewhere in the World. At first glance the Trinidad data seem to be somewhat alarming as they suggest a rise of nearly 2°C over the 40-year period from 1971 to 2010. However, Stone (2008) showed that there were two abrupt rises in 1977 and 1987 of 0.4°C and 0.5°C respectively. These rises would account for around 50% of the temperature change suggested by the models. In Tobago the patterns suggest that minimum temperatures are rising faster than maximum temperatures, with the latter not increasing at all during the dry season. This may confirm assessments of warming affecting nighttime more than daytime temperature conditions (Solomon et al 2007) and also renews fears of poor fruiting in crops which require relatively cool nights.
The results do not appear to support any of the claims about changing rainfall patterns. This situation may not have changed since Stone (2001) came to similar conclusions.
ACKNOWLEDGEMENTS
We wish to thank the Director, Trinidad and Tobago Meteorological Services for making the meteorological data available.
REFERENCES
Instat. 2008. Instat +™ - an interactive statistical package. UK: Statistical Services Centre, University of Reading
IPCC. 2007. Climate change 2007: synthesis report. [Core Writing Team, Pachauri R K and Reisignger A. (eds)]. Geneva, Switzerland: IPCC <http://www.ipcc.ch/publications_and_data/ publications_ipcc_fourth_assessment_report_synthesis_report.htm>
United Kingdom Met Office. 2012. Met Office 2012 annual global temperature forecast. United Kingdom: Meterological Office <http://www.metoffice.gov.uk/news/releases/archive/2011/2012- global-temperature-forecast > accessed 13 January 2012
National Research Council. 2010. Advancing the science of climate change. Washington, D.C.: The National Academies Press
Solomon S, Qin D, Manning M, Chin Z, Marquis M, Averyt K B and Miller H L (eds). 2007. Contribution of Working Group I to the Fourth Assessment Report of the Intergovernmental Panel on Climate Change, 2007. Cambridge University Press: Cambridge and New York
Stone R J. 2001. Changing seasonal rainfall patterns in Trinidad: myth or reality? West Indian Journal of Engineering 23: 9-16
Stone R J. 2008. The alleged surface air temperature rise in Trinidad: climate change or thermometer change? The 16th Biennial Conference on Science and Technology: Vehicles for Sustainable Economic Development in the Caribbean; 11-13 October 2008, 296-301
UNEP. 1997. Are human activities contributing to climate change? United Nations Environment Programme – World Meteorological Organization. < http://www.gcrio.org/ipcc/qa/03.html>
VSN International. 2011. GenStat 14th Edition. Hemel Hempstead, UK: VSN International Limited.
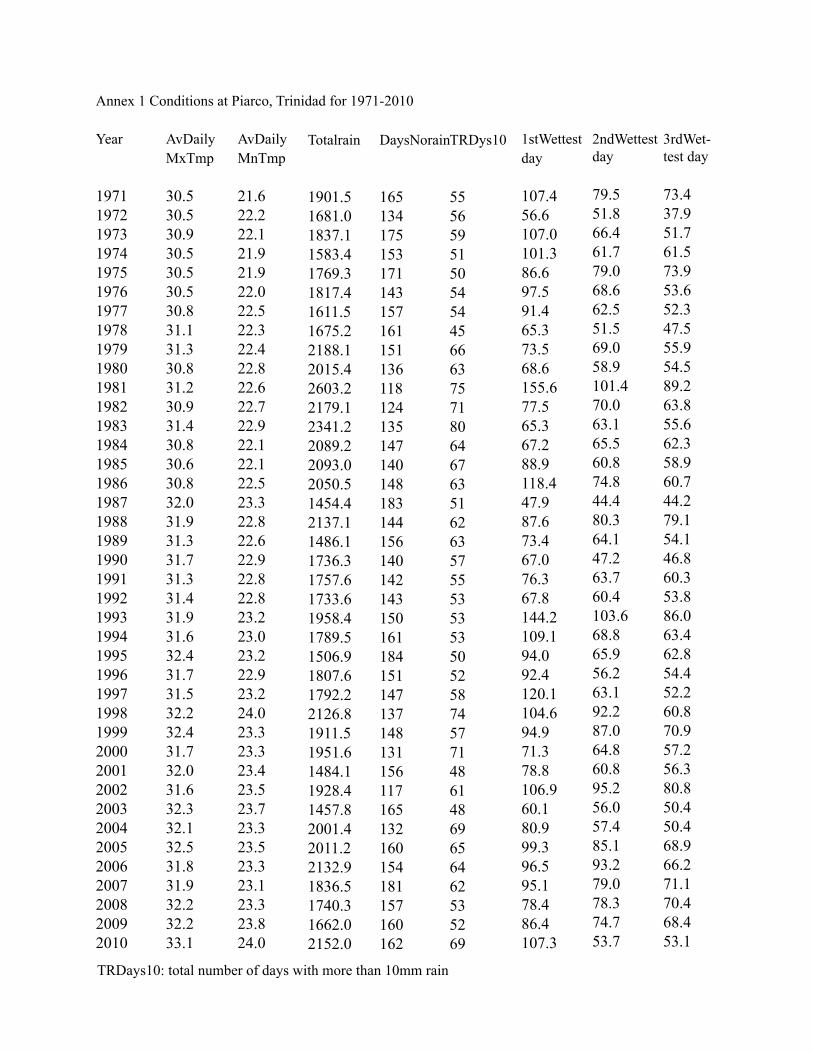
Annex 1 Conditions at Piarco, Trinidad for 1971-2010
Year
1971197219731974197519761977197819791980198119821983198419851986198719881989199019911992199319941995199619971998199920002001200220032004200520062007200820092010
AvDailyMxTmp
30.530.530.930.530.530.530.831.131.330.831.230.931.430.830.630.832.031.931.331.731.331.431.931.632.431.731.532.232.431.732.031.632.332.132.531.831.932.232.233.1
AvDailyMnTmp
21.622.222.121.921.922.022.522.322.422.822.622.722.922.122.122.523.322.822.622.922.822.823.223.023.222.923.224.023.323.323.423.523.723.323.523.323.123.323.824.0
Totalrain
1901.51681.01837.11583.41769.31817.41611.51675.22188.12015.42603.22179.12341.22089.22093.02050.51454.42137.11486.11736.31757.61733.61958.41789.51506.91807.61792.22126.81911.51951.61484.11928.41457.82001.42011.22132.91836.51740.31662.02152.0
DaysNorain
165134175153171143157161151136118124135147140148183144156140142143150161184151147137148131156117165132160154181157160162
TRDys10
55565951505454456663757180646763516263575553535350525874577148614869656462535269
1stWettest day
107.456.6107.0101.386.697.591.465.373.568.6155.677.565.367.288.9118.447.987.673.467.076.367.8144.2109.194.092.4120.1104.694.971.378.8106.960.180.999.396.595.178.486.4107.3
2ndWettest day
79.551.866.461.779.068.662.551.569.058.9101.470.063.165.560.874.844.480.364.147.263.760.4103.668.865.956.263.192.287.064.860.895.256.057.485.193.279.078.374.753.7
3rdWet-test day
73.437.951.761.573.953.652.347.555.954.589.263.855.662.358.960.744.279.154.146.860.353.886.063.462.854.452.260.870.957.256.380.850.450.468.966.271.170.468.453.1
TRDays10: total number of days with more than 10mm rain

Annex 2. Conditions at Crowne Point, Tobago for 1970-2011
Year
197019711972197319741975197619771978197919801981198219831984198519861987198819891990199119921993199419951996199719981999200020012002200320042005200620072008200920102011
AvDaily MxTmp
30.530.130.330.429.730.129.830.430.430.630.730.730.330.530.330.030.231.231.130.630.530.730.630.830.831.130.830.831.330.730.430.630.831.130.831.130.430.330.230.431.030.7
AvDailyMnTmp
23.322.223.023.823.623.623.523.723.923.923.623.222.523.023.623.423.524.124.023.623.623.523.723.924.324.824.224.425.124.424.224.224.224.924.725.024.224.224.023.824.724.0
Totalrain
1538.11527.81392.41599.11343.01532.71354.61132.91435.51787.01624.9835.61533.81390.31109.51743.81386.61344.81637.21392.71722.91272.21543.81263.21219.31219.01613.31371.71612.11431.91571.2*1194.5ᵻ1362.4*1759.1ᵻ1801.51562.51394.4ᵻ1150.7ᵻ*1878.81531.7
DaysNorain
150187157193168175172182180154157160168149159158160186162173159141155167185201177150181154170*130 ᵻ174140ᵻ165143172ᵻ161ᵻ*191144
TRDys10
48474442394135273752492745423149464555405141444130355345474044*31ᵻ4148ᵻ555239ᵻ31ᵻ*4747
1stWettest day
56.487.9103.4100.157.780.582.0161.589.265.094.250.0113.760.656.0140.155.267.1105.768.275.352.095.747.173.9111.460.561.992.467.078.9*75.7ᵻ126.1223.5ᵻ93.8107.572.3ᵻ146.3ᵻ*127.775.4
2ndWettest day
54.668.365.587.154.663.380.055.182.864.351.835.683.048.351.969.354.647.852.865.753.749.660.335.067.168.458.653.672.665.776.4*48.5ᵻ77.674.9ᵻ77.845.871.4ᵻ59.6ᵻ*124.249.0
3rdWet-test day
49.564.364.855.149.360.763.539.969.958.945.729.768.045.141.063.847.542.544.262.945.840.455.434.657.654.357.753.170.759.261.9*40.5ᵻ54.142.3ᵻ76.843.567.6ᵻ50.6ᵻ*7645.6
TRDays10: total number of days with more than 10mm rain

Page 32
*: 5 months rainfall missing in 2001; 7 months rainfall missing in 2009. Data points from these years and months were omitted from the regression models fitted.
ᵻ: January 2002, August 2004, August 2007, November 2008, December 2008 rainfall all missing. Data points from these years and months were omitted from the regression models fitted.
There were also gaps in the temperatures data see text. The means shown do not include missing data. Data points from years and months with gaps were omitted from the regression models fitted.

ediTorial guidelines
The aim of CARDI Review is to highlight quality research by scientists working or collaborating with CARDI, or any other scientist, who wish to publish quality work done in the CARICOM region.
CARDI Review publishes research and review papers on production, pest and diseases, germplasm (development, characterisation, production), post-harvest, marketing and agri-business. Papers dealing with the following commodities are especially welcomed:
• Cereals and grain legumes• Small ruminants: goat, sheep• Roots and tubers: cassava, sweet potato, yam, dasheen• Fruits and vegetables
CARDI has a number of particular thematic focal areas namely, protected agriculture; organic agriculture; invasive species; biotechnology in agriculture; climate change and Caribbean agriculture; soil and water management.
Articles are subject to full scientific scrutiny before they are published. All manuscripts should be submitted in Microsoft Word. It is expected that most articles that are published will be between 6 and 20 pages in length; abstracts will be between 100 and 300 words; the title will be informative but not lengthy and there will be between 2 and 5 keywords. Tables are numbered serially and figures are also numbered serially. Table titles appear above the table to which they refer and figure captions appear below the figure. Manuscripts should be sent with double spacing.
Authors should refer to the CARDI Review: Instructions for Authors and the Sample layout of CARDI Review paper which are included in these editorial guidelines.
The following publications also provide more detailed rules and procedures for preparing a paper for the CARDI Review:
• Walmsley D (ed.). 1996. Style guide for technical editors. St. Augustine, Trinidad and Tobago: Caribbean Agricultural Research and Development Institute. (CARDI Communications Guide No.1) http://www.cardi.org/images/public/resources/publications/Style_guide_for_technical_editors.pdf
• Walmsley D (ed.). 1996. Guide for technical writers. St. Augustine, Trinidad and Tobago: Caribbean Agricultural Research and Development Institute. (CARDI Communications Guide No. 2) http://www.cardi.org/images/public/resources/publications/Guide_for_technical_writers.pdf
These CARDI Communications Guides and CARDI Review issues are available on the CARDI website www.cardi.org under the CARDI Publications tab, or from the Information Centre, CARDI, P.O. Bag 212, University Campus, St. Augustine, Trinidad and Tobago. Email: [email protected].
Prospective authors who require more information or detail may request this from the editor.
Email your manuscripts and queries to:Editor, CARDI Review ℅ Secretary, Publications and Seminars Committee (PSC)Email: [email protected]
Page 33

insTruCTions for auThors
ELECTRONIC FORMAT
• All manuscripts should be submitted in Microsoft Word
MARGINS
• Left and Right: 1.25in
• Top and Bottom: 1in
LINE SPACING
• Double (for manuscript)• Single for final version
FONT
• Generally: Times New Roman, size 11, Normal. E.g. Text in the body of the paper sections.
• Title of Paper: Times New Roman, size 18, small caps, bold, center
• Author: Times New Roman size 11, italics, center
• Affiliation: Times New Roman size 10, center
• Keywords:
• Keywords heading Font: Times New Roman size 10, bold, italics• Keywords text Font: Times New Roman size 10. (exception: italics are used for scientific
names of genus, species, subspecies and variety
• Headings (e.g. Abstract, Introduction, Materials and Methods, Conclusions, etc.): Times New Roman size 12, bold, Capitals
• Sub-headings: Times New Roman, size 11, Normal, bold, italics
Page 34

STRUCTURE OF PAPER
• Title informative but not lengthy
• Author Full Name
• Affiliation Organisation’s name and address. Author(s) Email address.
• Abstract: Between 100 and 300 words. Indented 2 ins
• Keywords 2- 5 keywords
• Introduction:1-2 paragraphs of historical and other background information. Purpose and scope of the paper
• MaterialsandMethodsInformation on everything concerned in setting up the work should be included here. Review papers will detail the review methodology
• Results Factual statement of what was observed, supported by any statistics, tables or graphs derived from analysis of the data recorded
• Discussion An objective consideration of the results and should lead naturally to the main conclusions
• Conclusions View(s) taken by the writer as a consequence of what has been discovered.
• Acknowledgements
• References Guidelines for the styling for the reference list are given in: Walmsley D (ed.). 1996. Style guide for technical editors. St. Augustine, Trinidad and Tobago:
Caribbean Agricultural Research and Development Institute. (CARDI Communications Guide No. 1), pp. 17-19; 24-26
http://www.cardi.org/images/public/resources/publications/Style_guide_for_technical_editors.pdf
In each citation indent any lines after the first one.
• Appendix
Page 35

IN TExT REFERENCES
• Harvardorname-and-yearsystemused
• Example:
Adams and Seaton (1992) have suggested… As already reported (Adams and Seaton 1991; Charles 1992)…
• Additional examples and guidelines are given in Walmsley D (ed.). 1996. Style guide for technical editors. St. Augustine, Trinidad and Tobago:
Caribbean Agricultural Research and Development Institute. (CARDI Communications Guide No. 1), pp. 16-17
http://www.cardi.org/images/public/resources/publications/Style_guide_for_technical_editors.pdf
Walmsley D (ed.). 1996. Guide for technical writers. St. Augustine, Trinidad and Tobago: Caribbean Agricultural Research and Development Institute. (CARDI Communications Guide No. 2), pp. 26 http://www.cardi.org/images/public/resources/publications/Guide_for_technical_writers.pdf
ILLUSTRATIONS (TABLES, FIGURES, MAPS)
• In digital format
• Do not embed illustrations in the paper.
• Please submit separately from text. Indicate in paper where the particular illustration should be placed.
• For guidelines on layout, please refer to Walmsley D (ed.). 1996. Style guide for technical editors. St. Augustine, Trinidad and Tobago: Caribbean Agricultural Research and Development Institute. (CARDI Communications Guide No. 1), pp. 21-22http://www.cardi.org/images/public/resources/publications/Style_guide_for_technical_editors.pdf
Walmsley D (ed.). 1996. Guide for technical writers. St. Augustine, Trinidad and Tobago: Caribbean Agricultural Research and Development Institute. (CARDI Communications Guide No. 2), pp. 27-38http://www.cardi.org/images/public/resources/publications/Guide_for_technical_writers.pdf
Page 36

PHOTOGRAPHS
• In digital format: JPEG, high resolution (300dpi)
• When taking photographs, set the digital camera to a high resolution (300dpi minimum)
• High resolution photographs should be scanned and sent as JPEG files.
• Photographs taken at lower resolutions should not to be scanned, but sent “AS IS” and saved as JPEG files.
• Do not embed photographs in the paper.
• Please submit separately from text. Indicate in paper where the photograph should be placed.
Prospective authors may also study previous issues of CARDI Review for style & layout guidance. Issues of CARDI Review are available on the CARDI website www.cardi.org under the CARDI Publications tab.
Page 37

sample layouT of Cardi review paper
TiTle uses fonT Times new roman, size 18, bold, small Caps, CenTer
Author: Full Name. Font: Times New Roman size 11, italics, center
Affiliation: Organisation’s name and address. Author(s) Email address. Font: Times New Roman size 10, center
ABSTRACT
Abstract is between 100 and 300 words. Section is indented 3.3ins. Abstract heading is written in font: Times New Roman size 12, bold, Capitals. Abstract text written in Font: Times New Roman, size 11.
INTRODUCTION
Introduction is 1-2 paragraphs of historical and other background information. Also includes the purpose and scope of the paper. Heading uses font: Times New Roman size 12, bold, Capitals. Text written in font: Times New Roman size 11
MATERIALS AND METHODS
Information on everything concerned in setting up the trials should be included here, e.g. climate and soil characteristics, plant cultivars, breed of livestock, fertilisers and other agro-chemicals used, cultivation practices, feeds and pasture types, experimental design, treatments, parameters measured, methods of measurement, analytical methods, methods of assessing the results.
Heading uses font: Times New Roman size 12, bold, Capitals. Text written in font: Times New Roman size 11
__________________________________________________Keywords: CARDI Review, Style guide
Page 38


P.O. Bag 212University of the West IndiesSt. Augustine Campus, St. AugustineTrinidad and Tobago
Email: [email protected]: www.cardi.orgFax:1-868-645-1208Tel:1-868-645-1205/8120
HEADQUARTERS CONTACT INFORMATION