Embed Size (px)
Citation preview
AU2621_book.fm Page 91 Wednesday, January 12, 2005 2:44 PM
Copyright 2005
Chapter 4
Aligning IT to Organizational Strategy
Seven deadly sins of the IT scorecard:1. An IT-centric view of IT performance2. Measures that don’t matter3. Lack of standard metrics definitions4. Over-reliance on tools5. Lack of drill-down capability hindering interpretation6. Too many metrics7. No individual impact
—Working Council for ChiefInformation Officers (2003)
In the late 1980s, the deficiency in measuring IT using purely financialmeasures was addressed by Parker, Benson, and Trainor (1988) in theirbook on information economics.
Information economics assigns numerical scores to value and riskcategories by a joint committee of end users and IT staff. For example,a value category of “0” would signify “no positive contribution” while a“5” would indicate a “large positive contribution.” In the same vein, inthe risk category, a “0” would mean no risk and a “5” would indicate a“large risk.” Each of the categories is assigned a weight. By summing theweighted scores of the value categories and subtracting the weighted
91
by Taylor & Francis Group
92
�
Implementing the IT Balanced Scorecard
AU2621_book.fm Page 92 Wednesday, January 12, 2005 2:44 PM
Copyright 2005
scores of the risk categories, one can calculate the total score of eachproject. Value linking incorporates the benefits and cost in other functionalareas, while value restructuring refers to the efficiency and effectivenessof employees (e.g., does the new system free up employee time so thatthey can do their own jobs more effectively?). The balanced scorecard(BSC) extends the information economics theory into a set of constructsunderstandable and immediately usable throughout the organization.
This chapter discusses how the balanced scorecard can be used withinthe IT department to assess its own performance as well as to integrateitself to the organization as a whole. One quickly discovers that there area variety of approaches to implementing an IT scorecard.
The IT Balanced ScorecardOver the past decade, many CIOs have realized that it is not sufficient tomanage merely the IT end of the business. The integration of IT strategyto business strategy must be managed as well. The tool chosen for thistask is the balanced scorecard.
The Working Council for Chief Information Officers (2003) did anextensive review of IT scorecards and found that the most advancedscorecards shared the following six structural attributes:
1. Simplicity of presentation. The very best scorecards are limited toa single page of from 10 to 20 metrics written in nontechnicallanguage.
2. Explicit links to IT strategy. The scorecard should be tightly coupledto the IT strategic planning process and assist in tracking progressagainst IT’s key goals and objectives.
3. Broad executive commitment. Both senior IT as well as seniorbusiness managers should be involved in the scorecard process —both creation and ongoing.
4. Enterprise-standard metrics definitions. Consensus should bequickly achieved on metrics definitions. The review meetingsshould focus on decisions rather than debate over metrics.
5. Drill-down capability and available context. The high-level ITscorecard should allow for detailed review of trends or varianceby providing more granularity on component elements.
6. Individual manager compensation should be linked to scorecardperformance.
Progressive scorecard practitioners track metrics in five key categories:
by Taylor & Francis Group
Aligning IT to Organizational Strategy
�
93
AU2621_book.fm Page 93 Wednesday, January 12, 2005 2:44 PM
Copyright 2005
1. Financial performance. IT spending in the content of service levels,project progress, etc. Sample metrics include cost of data commu-nications per seat and relative spending per portfolio category.
2. Project performance. Sample metrics include percentage of newdevelopment investment resulting in new revenue streams and per-centage of IT R&D investment leading to IT service improvements.
3. Operational performance. Instead of concentrating measurementefforts on day-to-day measures, best-in-class practitioners seek toprovide an aggregate, customer-focused view of IT operations.Sample metrics include peak time availability and critical processuptime.
4. Talent management. This category of metrics seeks to manage IThuman capital. Measures include staff satisfaction and retention aswell as attractiveness of the IT department to external job seekers.Metrics include retention of high-potential staff and external cita-tions of IT achievement.
5. User satisfaction. Sample metrics include focused executive feed-back and user perspective.
The Working Council also found that best-of-breed practitionersincluded two additional metric categories:
1. Information security. These metrics monitor remediation efforts forknown vulnerabilities and track proactive policy and certificationefforts. (Also see Appendix K for a discussion of E-business audit-ing.) Sample metrics include percentage of staff receiving securitytraining and percentage of external partners in compliance withsecurity standards.
2. Enterprise initiatives. Best-of-breed practitioners also use the score-card to highlight IT’s contributions to initiatives of corporate stra-tegic importance. Sample metrics include percentage of acquiredcompany systems integrated in the Merger and Acquisition categoryand the number of business process steps enabled by technologyin the Process Reengineering category.
Bowne & Co. (www.bowne.com), a New York City-based documentsmanagement company, initiated an IT balanced scorecard in 1997. Theirprocess consisted of seven steps:
1. Kick-off training for IT staff.2. Ongoing strategy mapping. The annual IT strategy, like most com-
panies, is derived from the corporate strategy.
by Taylor & Francis Group
94
�
Implementing the IT Balanced Scorecard
AU2621_book.fm Page 94 Wednesday, January 12, 2005 2:44 PM
Copyright 2005
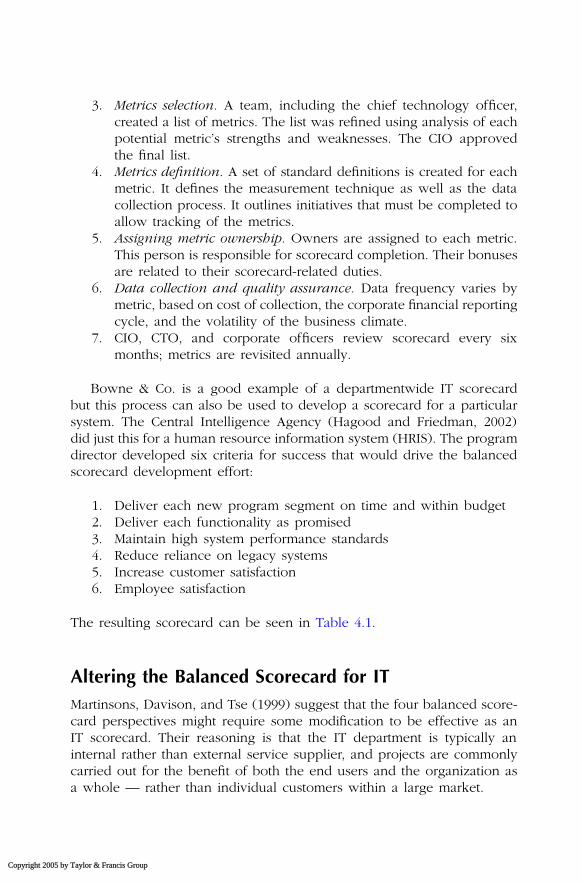
3. Metrics selection. A team, including the chief technology officer,created a list of metrics. The list was refined using analysis of eachpotential metric’s strengths and weaknesses. The CIO approvedthe final list.
4. Metrics definition. A set of standard definitions is created for eachmetric. It defines the measurement technique as well as the datacollection process. It outlines initiatives that must be completed toallow tracking of the metrics.
5. Assigning metric ownership. Owners are assigned to each metric.This person is responsible for scorecard completion. Their bonusesare related to their scorecard-related duties.
6. Data collection and quality assurance. Data frequency varies bymetric, based on cost of collection, the corporate financial reportingcycle, and the volatility of the business climate.
7. CIO, CTO, and corporate officers review scorecard every sixmonths; metrics are revisited annually.
Bowne & Co. is a good example of a departmentwide IT scorecardbut this process can also be used to develop a scorecard for a particularsystem. The Central Intelligence Agency (Hagood and Friedman, 2002)did just this for a human resource information system (HRIS). The programdirector developed six criteria for success that would drive the balancedscorecard development effort:
1. Deliver each new program segment on time and within budget2. Deliver each functionality as promised3. Maintain high system performance standards4. Reduce reliance on legacy systems5. Increase customer satisfaction6. Employee satisfaction
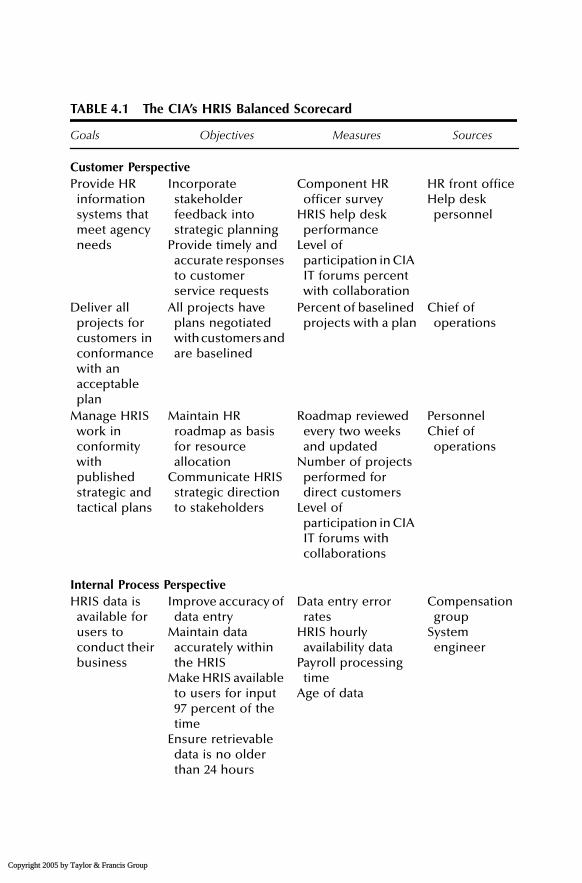
The resulting scorecard can be seen in Table 4.1.
Altering the Balanced Scorecard for ITMartinsons, Davison, and Tse (1999) suggest that the four balanced score-card perspectives might require some modification to be effective as anIT scorecard. Their reasoning is that the IT department is typically aninternal rather than external service supplier, and projects are commonlycarried out for the benefit of both the end users and the organization asa whole — rather than individual customers within a large market.
by Taylor & Francis Group
Aligning IT to Organizational Strategy
�
95
AU2621_book.fm Page 95 Wednesday, January 12, 2005 2:44 PM
Copyright 2005
TABLE 4.1 The CIA’s HRIS Balanced Scorecard
Goals Objectives Measures Sources
Customer PerspectiveProvide HR
information systems that meet agency needs
Incorporate stakeholder feedback into strategic planning
Provide timely and accurate responses to customer service requests
Component HR officer survey
HRIS help desk performance
Level of participation in CIA IT forums percent with collaboration
HR front officeHelp desk
personnel
Deliver all projects for customers in conformance with an acceptable plan
All projects have plans negotiated with customers and are baselined
Percent of baselined projects with a plan
Chief of operations
Manage HRIS work in conformity with published strategic and tactical plans
Maintain HR roadmap as basis for resource allocation
Communicate HRIS strategic direction to stakeholders
Roadmap reviewed every two weeks and updated
Number of projects performed for direct customers
Level of participation in CIA IT forums with collaborations
PersonnelChief of
operations
Internal Process PerspectiveHRIS data is
available for users to conduct their business
Improve accuracy of data entry
Maintain data accurately within the HRIS
Make HRIS available to users for input 97 percent of the time
Ensure retrievable data is no older than 24 hours
Data entry error rates
HRIS hourly availability data
Payroll processing time
Age of data
Compensation group
System engineer
by Taylor & Francis Group
96
�
Implementing the IT Balanced Scorecard
AU2621_book.fm Page 96 Wednesday, January 12, 2005 2:44 PM
Copyright 2005
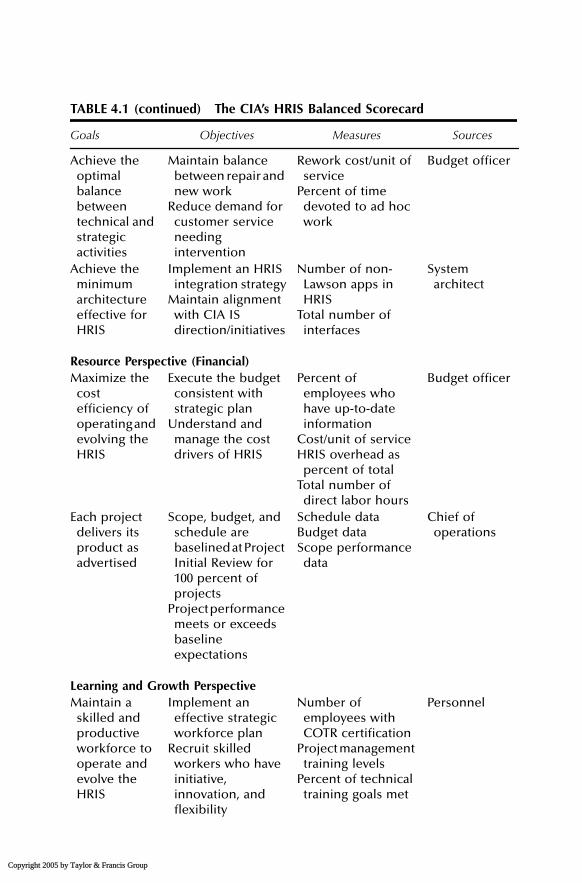
TABLE 4.1 (continued) The CIA’s HRIS Balanced Scorecard
Goals Objectives Measures Sources
Achieve the optimal balance between technical and strategic activities
Maintain balance between repair and new work
Reduce demand for customer service needing intervention
Rework cost/unit of service
Percent of time devoted to ad hoc work
Budget officer
Achieve the minimum architecture effective for HRIS
Implement an HRIS integration strategy
Maintain alignment with CIA IS direction/initiatives
Number of non-Lawson apps in HRIS
Total number of interfaces
System architect
Resource Perspective (Financial)Maximize the
cost efficiency of operating and evolving the HRIS
Execute the budget consistent with strategic plan
Understand and manage the cost drivers of HRIS
Percent of employees who have up-to-date information
Cost/unit of serviceHRIS overhead as
percent of totalTotal number of
direct labor hours
Budget officer
Each project delivers its product as advertised
Scope, budget, and schedule are baselined at Project Initial Review for 100 percent of projects
Project performance meets or exceeds baseline expectations
Schedule dataBudget dataScope performance
data
Chief of operations
Learning and Growth PerspectiveMaintain a
skilled and productive workforce to operate and evolve the HRIS
Implement an effective strategic workforce plan
Recruit skilled workers who have initiative, innovation, and flexibility
Number of employees with COTR certification
Project management training levels
Percent of technical training goals met
Personnel
by Taylor & Francis Group
Aligning IT to Organizational Strategy
�
97
AU2621_book.fm Page 97 Wednesday, January 12, 2005 2:44 PM
Copyright 2005
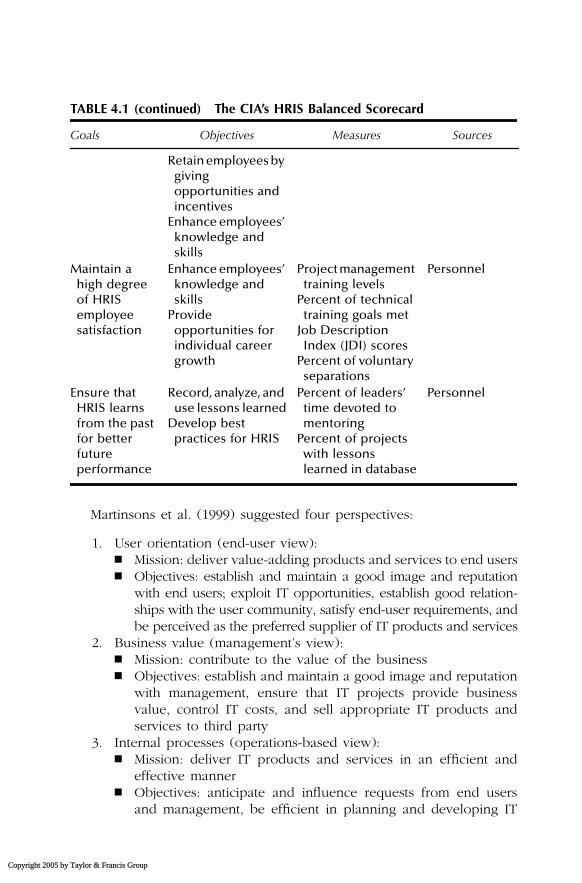
Martinsons et al. (1999) suggested four perspectives:
1. User orientation (end-user view):� Mission: deliver value-adding products and services to end users� Objectives: establish and maintain a good image and reputation
with end users; exploit IT opportunities, establish good relation-ships with the user community, satisfy end-user requirements, andbe perceived as the preferred supplier of IT products and services
2. Business value (management’s view):� Mission: contribute to the value of the business� Objectives: establish and maintain a good image and reputation
with management, ensure that IT projects provide businessvalue, control IT costs, and sell appropriate IT products andservices to third party
3. Internal processes (operations-based view):� Mission: deliver IT products and services in an efficient and
effective manner� Objectives: anticipate and influence requests from end users
and management, be efficient in planning and developing IT
TABLE 4.1 (continued) The CIA’s HRIS Balanced Scorecard
Goals Objectives Measures Sources
Retain employees by giving opportunities and incentives
Enhance employees’ knowledge and skills
Maintain a high degree of HRIS employee satisfaction
Enhance employees’ knowledge and skills
Provide opportunities for individual career growth
Project management training levels
Percent of technical training goals met
Job Description Index (JDI) scores
Percent of voluntary separations
Personnel
Ensure that HRIS learns from the past for better future performance
Record, analyze, and use lessons learned
Develop best practices for HRIS
Percent of leaders’ time devoted to mentoring
Percent of projects with lessons learned in database
Personnel
by Taylor & Francis Group
98
�
Implementing the IT Balanced Scorecard
AU2621_book.fm Page 98 Wednesday, January 12, 2005 2:44 PM
Copyright 2005
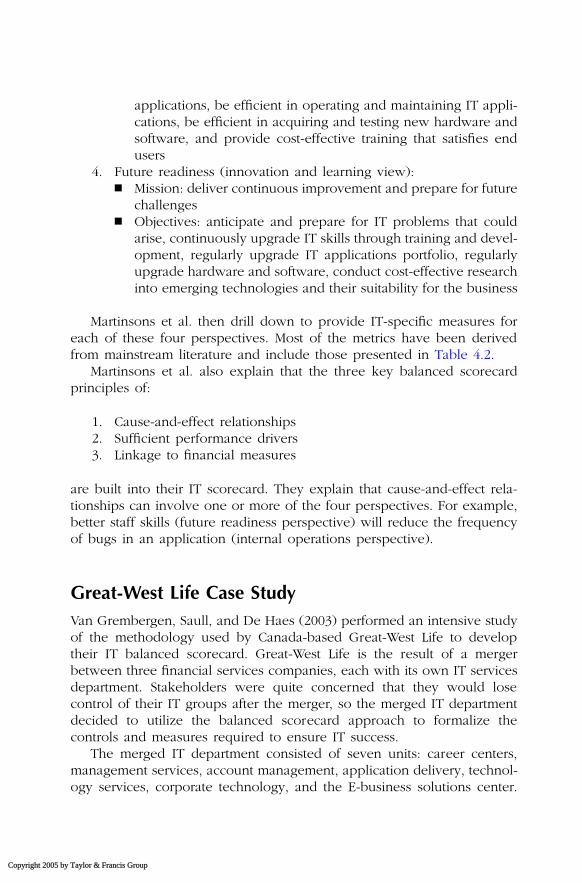
applications, be efficient in operating and maintaining IT appli-cations, be efficient in acquiring and testing new hardware andsoftware, and provide cost-effective training that satisfies endusers
4. Future readiness (innovation and learning view):� Mission: deliver continuous improvement and prepare for future
challenges� Objectives: anticipate and prepare for IT problems that could
arise, continuously upgrade IT skills through training and devel-opment, regularly upgrade IT applications portfolio, regularlyupgrade hardware and software, conduct cost-effective researchinto emerging technologies and their suitability for the business
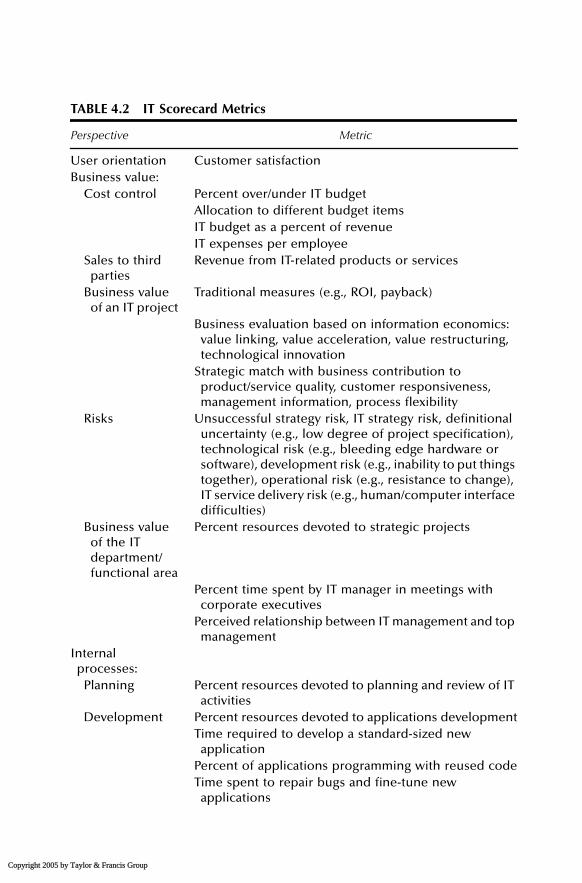
Martinsons et al. then drill down to provide IT-specific measures foreach of these four perspectives. Most of the metrics have been derivedfrom mainstream literature and include those presented in Table 4.2.
Martinsons et al. also explain that the three key balanced scorecardprinciples of:
1. Cause-and-effect relationships2. Sufficient performance drivers3. Linkage to financial measures
are built into their IT scorecard. They explain that cause-and-effect rela-tionships can involve one or more of the four perspectives. For example,better staff skills (future readiness perspective) will reduce the frequencyof bugs in an application (internal operations perspective).
Great-West Life Case StudyVan Grembergen, Saull, and De Haes (2003) performed an intensive studyof the methodology used by Canada-based Great-West Life to developtheir IT balanced scorecard. Great-West Life is the result of a mergerbetween three financial services companies, each with its own IT servicesdepartment. Stakeholders were quite concerned that they would losecontrol of their IT groups after the merger, so the merged IT departmentdecided to utilize the balanced scorecard approach to formalize thecontrols and measures required to ensure IT success.
The merged IT department consisted of seven units: career centers,management services, account management, application delivery, technol-ogy services, corporate technology, and the E-business solutions center.
by Taylor & Francis Group
Aligning IT to Organizational Strategy
�
99
AU2621_book.fm Page 99 Wednesday, January 12, 2005 2:44 PM
Copyright 2005
TABLE 4.2 IT Scorecard Metrics
Perspective Metric
User orientation Customer satisfactionBusiness value:
Cost control Percent over/under IT budgetAllocation to different budget itemsIT budget as a percent of revenueIT expenses per employee
Sales to third parties
Revenue from IT-related products or services
Business value of an IT project
Traditional measures (e.g., ROI, payback)
Business evaluation based on information economics: value linking, value acceleration, value restructuring, technological innovation
Strategic match with business contribution to product/service quality, customer responsiveness, management information, process flexibility
Risks Unsuccessful strategy risk, IT strategy risk, definitional uncertainty (e.g., low degree of project specification), technological risk (e.g., bleeding edge hardware or software), development risk (e.g., inability to put things together), operational risk (e.g., resistance to change), IT service delivery risk (e.g., human/computer interface difficulties)
Business value of the IT department/functional area
Percent resources devoted to strategic projects
Percent time spent by IT manager in meetings with corporate executives
Perceived relationship between IT management and top management
Internal processes:
Planning Percent resources devoted to planning and review of IT activities
Development Percent resources devoted to applications developmentTime required to develop a standard-sized new
applicationPercent of applications programming with reused codeTime spent to repair bugs and fine-tune new
applications
by Taylor & Francis Group
100
�
Implementing the IT Balanced Scorecard
AU2621_book.fm Page 100 Wednesday, January 12, 2005 2:44 PM
Copyright 2005
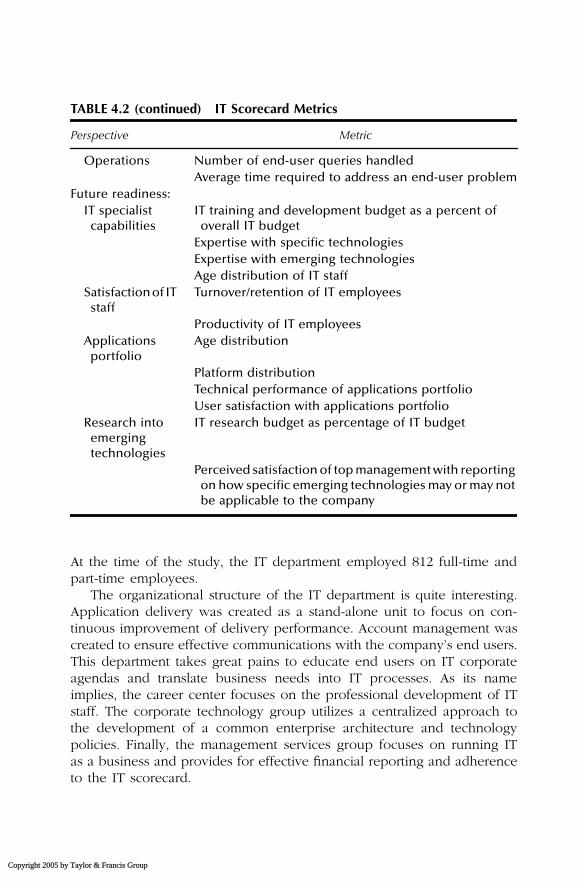
At the time of the study, the IT department employed 812 full-time andpart-time employees.
The organizational structure of the IT department is quite interesting.Application delivery was created as a stand-alone unit to focus on con-tinuous improvement of delivery performance. Account management wascreated to ensure effective communications with the company’s end users.This department takes great pains to educate end users on IT corporateagendas and translate business needs into IT processes. As its nameimplies, the career center focuses on the professional development of ITstaff. The corporate technology group utilizes a centralized approach tothe development of a common enterprise architecture and technologypolicies. Finally, the management services group focuses on running ITas a business and provides for effective financial reporting and adherenceto the IT scorecard.
TABLE 4.2 (continued) IT Scorecard Metrics
Perspective Metric
Operations Number of end-user queries handledAverage time required to address an end-user problem
Future readiness:IT specialist
capabilitiesIT training and development budget as a percent of
overall IT budgetExpertise with specific technologiesExpertise with emerging technologiesAge distribution of IT staff
Satisfaction of IT staff
Turnover/retention of IT employees
Productivity of IT employeesApplications
portfolioAge distribution
Platform distributionTechnical performance of applications portfolioUser satisfaction with applications portfolio
Research into emerging technologies
IT research budget as percentage of IT budget
Perceived satisfaction of top management with reporting on how specific emerging technologies may or may not be applicable to the company
by Taylor & Francis Group
Aligning IT to Organizational Strategy
�
101
AU2621_book.fm Page 101 Wednesday, January 12, 2005 2:44 PM
Copyright 2005
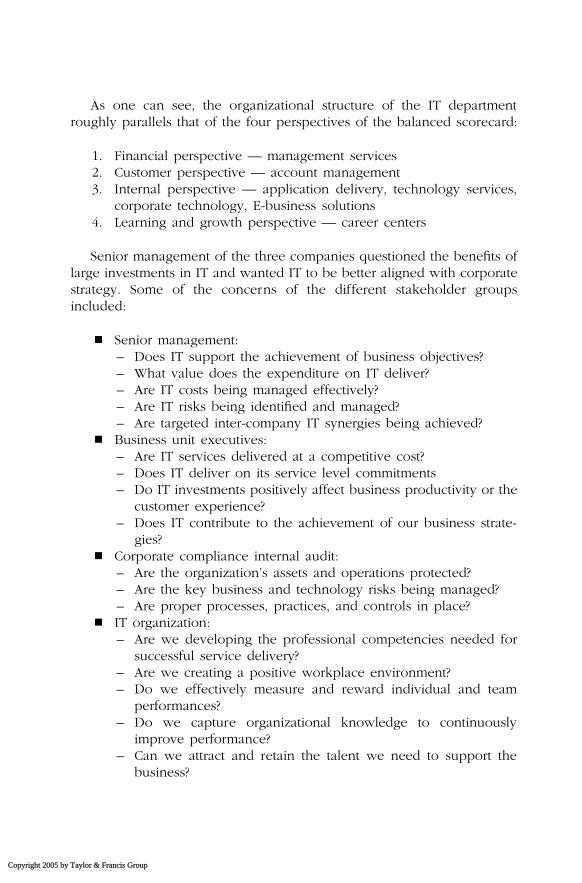
As one can see, the organizational structure of the IT departmentroughly parallels that of the four perspectives of the balanced scorecard:
1. Financial perspective — management services2. Customer perspective — account management3. Internal perspective — application delivery, technology services,
corporate technology, E-business solutions4. Learning and growth perspective — career centers
Senior management of the three companies questioned the benefits oflarge investments in IT and wanted IT to be better aligned with corporatestrategy. Some of the concerns of the different stakeholder groupsincluded:
� Senior management:– Does IT support the achievement of business objectives?– What value does the expenditure on IT deliver?– Are IT costs being managed effectively?– Are IT risks being identified and managed?– Are targeted inter-company IT synergies being achieved?
� Business unit executives:– Are IT services delivered at a competitive cost?– Does IT deliver on its service level commitments– Do IT investments positively affect business productivity or the
customer experience?– Does IT contribute to the achievement of our business strate-
gies?� Corporate compliance internal audit:
– Are the organization’s assets and operations protected?– Are the key business and technology risks being managed?– Are proper processes, practices, and controls in place?
� IT organization:– Are we developing the professional competencies needed for
successful service delivery?– Are we creating a positive workplace environment?– Do we effectively measure and reward individual and team
performances?– Do we capture organizational knowledge to continuously
improve performance?– Can we attract and retain the talent we need to support the
business?
by Taylor & Francis Group
102
�
Implementing the IT Balanced Scorecard
AU2621_book.fm Page 102 Wednesday, January 12, 2005 2:44 PM
Copyright 2005
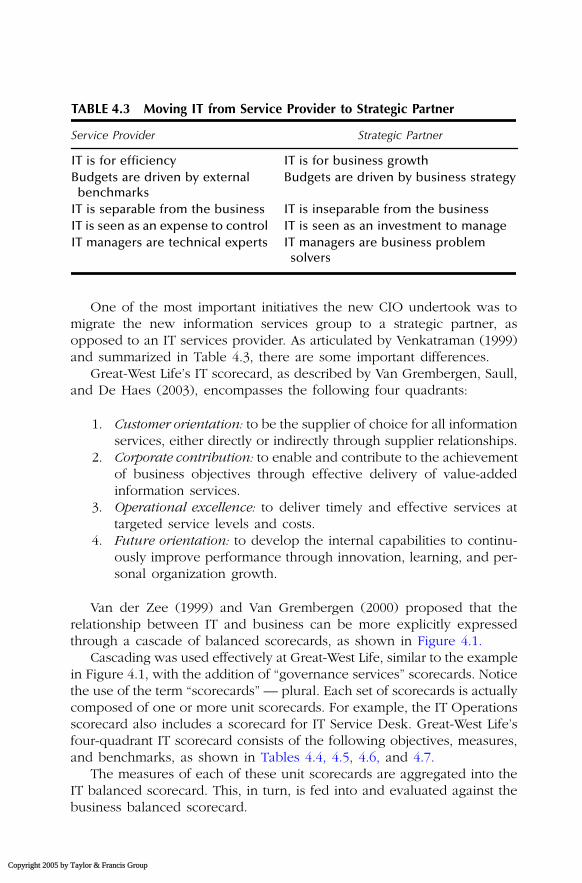
One of the most important initiatives the new CIO undertook was tomigrate the new information services group to a strategic partner, asopposed to an IT services provider. As articulated by Venkatraman (1999)and summarized in Table 4.3, there are some important differences.
Great-West Life’s IT scorecard, as described by Van Grembergen, Saull,and De Haes (2003), encompasses the following four quadrants:
1. Customer orientation: to be the supplier of choice for all informationservices, either directly or indirectly through supplier relationships.
2. Corporate contribution: to enable and contribute to the achievementof business objectives through effective delivery of value-addedinformation services.
3. Operational excellence: to deliver timely and effective services attargeted service levels and costs.
4. Future orientation: to develop the internal capabilities to continu-ously improve performance through innovation, learning, and per-sonal organization growth.
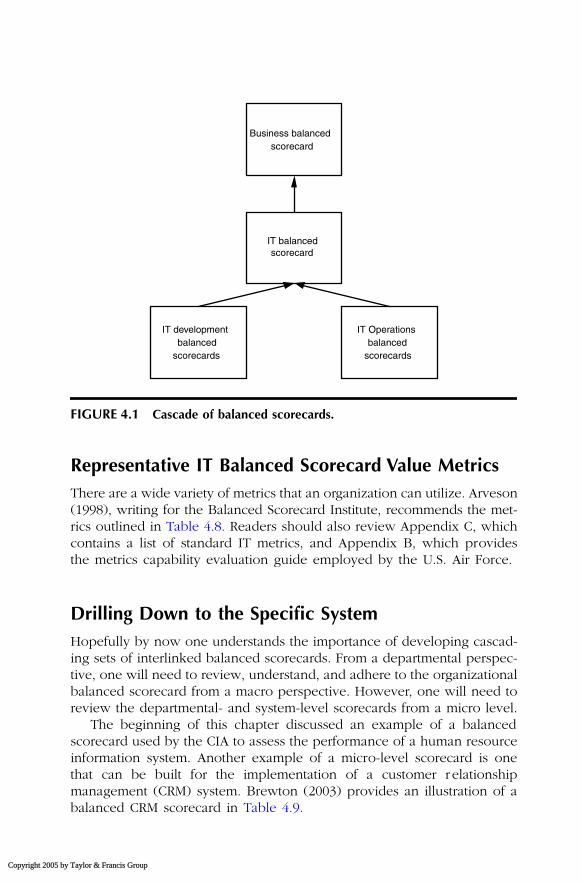
Van der Zee (1999) and Van Grembergen (2000) proposed that therelationship between IT and business can be more explicitly expressedthrough a cascade of balanced scorecards, as shown in Figure 4.1.
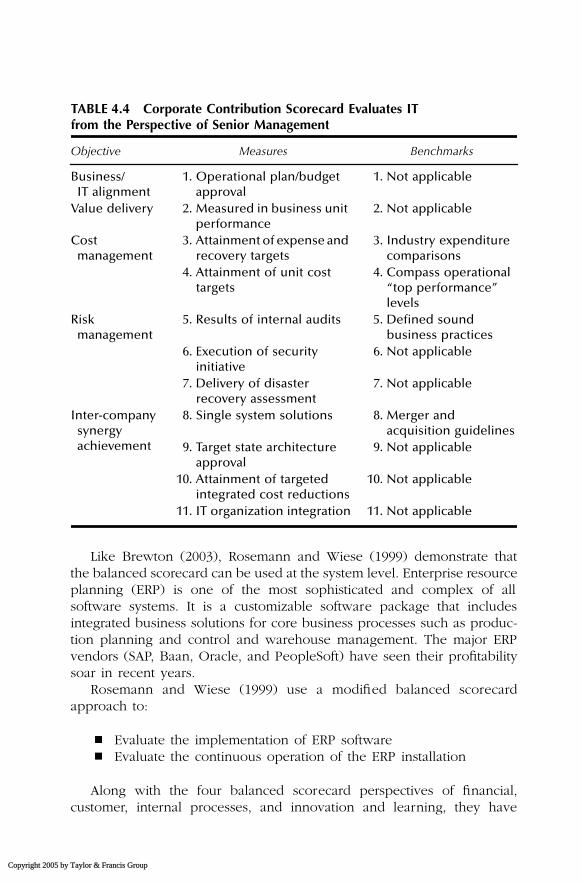
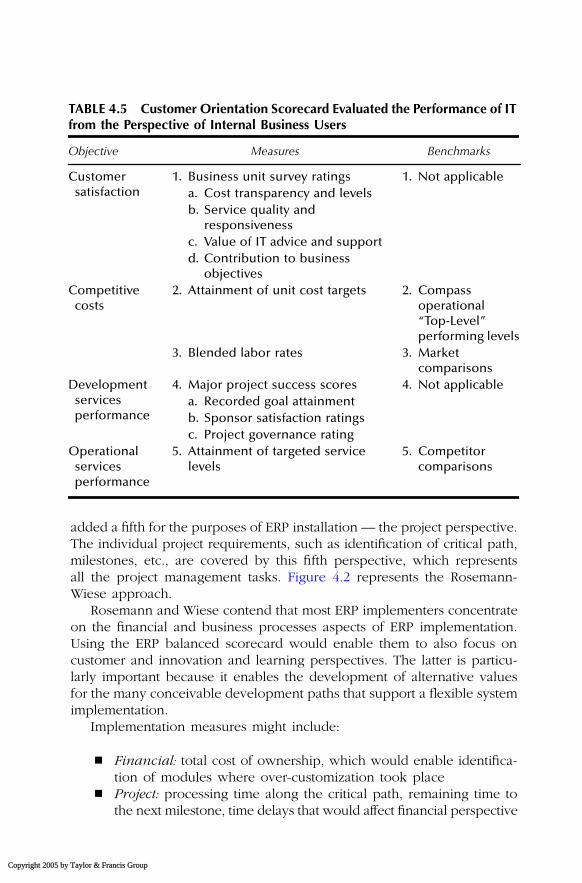
Cascading was used effectively at Great-West Life, similar to the examplein Figure 4.1, with the addition of “governance services” scorecards. Noticethe use of the term “scorecards” — plural. Each set of scorecards is actuallycomposed of one or more unit scorecards. For example, the IT Operationsscorecard also includes a scorecard for IT Service Desk. Great-West Life’sfour-quadrant IT scorecard consists of the following objectives, measures,and benchmarks, as shown in Tables 4.4, 4.5, 4.6, and 4.7.
The measures of each of these unit scorecards are aggregated into theIT balanced scorecard. This, in turn, is fed into and evaluated against thebusiness balanced scorecard.
TABLE 4.3 Moving IT from Service Provider to Strategic Partner
Service Provider Strategic Partner
IT is for efficiency IT is for business growthBudgets are driven by external
benchmarksBudgets are driven by business strategy
IT is separable from the business IT is inseparable from the businessIT is seen as an expense to control IT is seen as an investment to manageIT managers are technical experts IT managers are business problem
solvers
by Taylor & Francis Group
Aligning IT to Organizational Strategy
�
103
AU2621_book.fm Page 103 Wednesday, January 12, 2005 2:44 PM
Copyright 2005
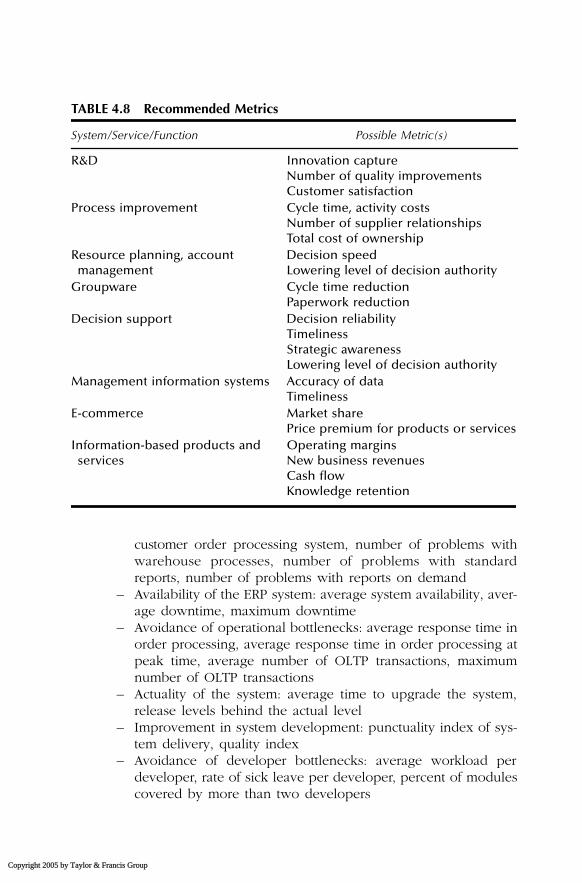
Representative IT Balanced Scorecard Value MetricsThere are a wide variety of metrics that an organization can utilize. Arveson(1998), writing for the Balanced Scorecard Institute, recommends the met-rics outlined in Table 4.8. Readers should also review Appendix C, whichcontains a list of standard IT metrics, and Appendix B, which providesthe metrics capability evaluation guide employed by the U.S. Air Force.
Drilling Down to the Specific SystemHopefully by now one understands the importance of developing cascad-ing sets of interlinked balanced scorecards. From a departmental perspec-tive, one will need to review, understand, and adhere to the organizationalbalanced scorecard from a macro perspective. However, one will need toreview the departmental- and system-level scorecards from a micro level.
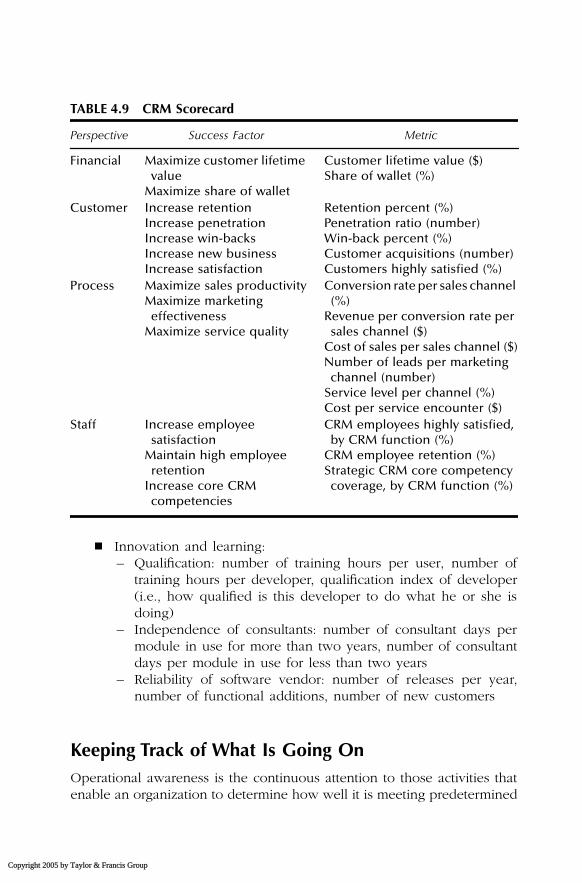
The beginning of this chapter discussed an example of a balancedscorecard used by the CIA to assess the performance of a human resourceinformation system. Another example of a micro-level scorecard is onethat can be built for the implementation of a customer r elationshipmanagement (CRM) system. Brewton (2003) provides an illustration of abalanced CRM scorecard in Table 4.9.
FIGURE 4.1 Cascade of balanced scorecards.
Business balancedscorecard
IT balancedscorecard
IT developmentbalanced
scorecards
IT Operationsbalanced
scorecards
by Taylor & Francis Group
104
�
Implementing the IT Balanced Scorecard
AU2621_book.fm Page 104 Wednesday, January 12, 2005 2:44 PM
Copyright 2005
Like Brewton (2003), Rosemann and Wiese (1999) demonstrate thatthe balanced scorecard can be used at the system level. Enterprise resourceplanning (ERP) is one of the most sophisticated and complex of allsoftware systems. It is a customizable software package that includesintegrated business solutions for core business processes such as produc-tion planning and control and warehouse management. The major ERPvendors (SAP, Baan, Oracle, and PeopleSoft) have seen their profitabilitysoar in recent years.
Rosemann and Wiese (1999) use a modified balanced scorecardapproach to:
� Evaluate the implementation of ERP software� Evaluate the continuous operation of the ERP installation
Along with the four balanced scorecard perspectives of financial,customer, internal processes, and innovation and learning, they have
TABLE 4.4 Corporate Contribution Scorecard Evaluates IT from the Perspective of Senior Management
Objective Measures Benchmarks
Business/IT alignment
1. Operational plan/budget approval
1. Not applicable
Value delivery 2. Measured in business unit performance
2. Not applicable
Cost management
3. Attainment of expense and recovery targets
3. Industry expenditure comparisons
4. Attainment of unit cost targets
4. Compass operational “top performance” levels
Risk management
5. Results of internal audits 5. Defined sound business practices
6. Execution of security initiative
6. Not applicable
7. Delivery of disaster recovery assessment
7. Not applicable
Inter-company synergy achievement
8. Single system solutions 8. Merger and acquisition guidelines
9. Target state architecture approval
9. Not applicable
10. Attainment of targeted integrated cost reductions
10. Not applicable
11. IT organization integration 11. Not applicable
by Taylor & Francis Group
Aligning IT to Organizational Strategy
�
105
AU2621_book.fm Page 105 Wednesday, January 12, 2005 2:44 PM
Copyright 2005
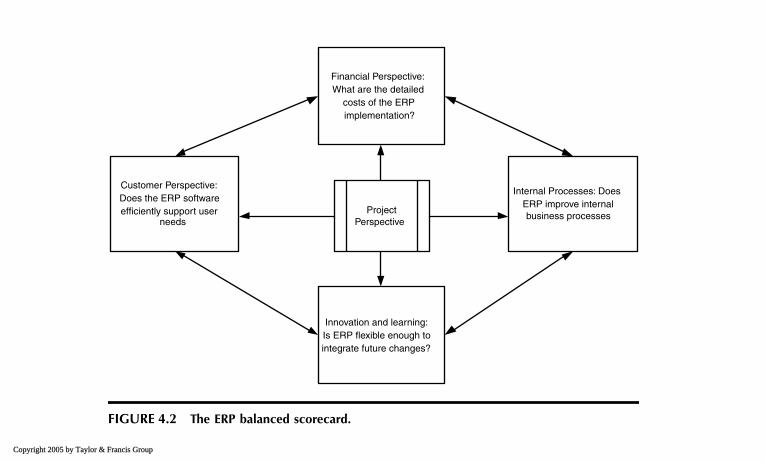
added a fifth for the purposes of ERP installation — the project perspective.The individual project requirements, such as identification of critical path,milestones, etc., are covered by this fifth perspective, which representsall the project management tasks. Figure 4.2 represents the Rosemann-Wiese approach.
Rosemann and Wiese contend that most ERP implementers concentrateon the financial and business processes aspects of ERP implementation.Using the ERP balanced scorecard would enable them to also focus oncustomer and innovation and learning perspectives. The latter is particu-larly important because it enables the development of alternative valuesfor the many conceivable development paths that support a flexible systemimplementation.
Implementation measures might include:
� Financial: total cost of ownership, which would enable identifica-tion of modules where over-customization took place
� Project: processing time along the critical path, remaining time tothe next milestone, time delays that would affect financial perspective
TABLE 4.5 Customer Orientation Scorecard Evaluated the Performance of IT from the Perspective of Internal Business Users
Objective Measures Benchmarks
Customer satisfaction
1. Business unit survey ratings 1. Not applicablea. Cost transparency and levelsb. Service quality and
responsivenessc. Value of IT advice and supportd. Contribution to business
objectivesCompetitive
costs2. Attainment of unit cost targets 2. Compass
operational “Top-Level” performing levels
3. Blended labor rates 3. Market comparisons
Development services performance
4. Major project success scores 4. Not applicablea. Recorded goal attainmentb. Sponsor satisfaction ratingsc. Project governance rating
Operational services performance
5. Attainment of targeted service levels
5. Competitor comparisons
by Taylor & Francis Group
106 � Implementing the IT Balanced Scorecard
AU2621_book.fm Page 106 Wednesday, January 12, 2005 2:44 PM
Copyright 2005
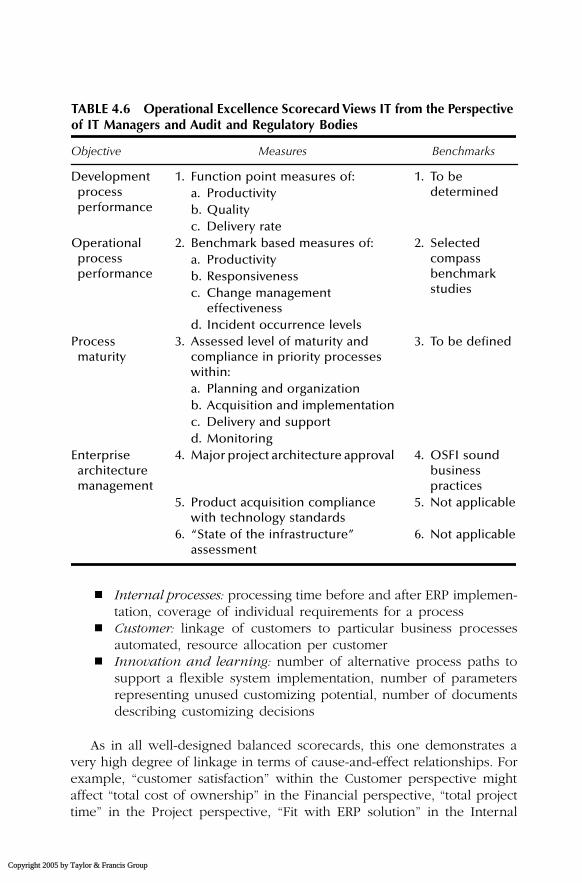
� Internal processes: processing time before and after ERP implemen-tation, coverage of individual requirements for a process
� Customer: linkage of customers to particular business processesautomated, resource allocation per customer
� Innovation and learning: number of alternative process paths tosupport a flexible system implementation, number of parametersrepresenting unused customizing potential, number of documentsdescribing customizing decisions
As in all well-designed balanced scorecards, this one demonstrates avery high degree of linkage in terms of cause-and-effect relationships. Forexample, “customer satisfaction” within the Customer perspective mightaffect “total cost of ownership” in the Financial perspective, “total projecttime” in the Project perspective, “Fit with ERP solution” in the Internal
TABLE 4.6 Operational Excellence Scorecard Views IT from the Perspective of IT Managers and Audit and Regulatory Bodies
Objective Measures Benchmarks
Development process performance
1. Function point measures of: 1. To be determineda. Productivity
b. Qualityc. Delivery rate
Operational process performance
2. Benchmark based measures of: 2. Selected compass benchmark studies
a. Productivityb. Responsivenessc. Change management
effectivenessd. Incident occurrence levels
Process maturity
3. Assessed level of maturity and compliance in priority processes within:
3. To be defined
a. Planning and organizationb. Acquisition and implementationc. Delivery and supportd. Monitoring
Enterprise architecture management
4. Major project architecture approval 4. OSFI sound business practices
5. Product acquisition compliance with technology standards
5. Not applicable
6. “State of the infrastructure” assessment
6. Not applicable
by Taylor & Francis Group
Aligning IT to Organizational Strategy � 107
AU2621_book.fm Page 107 Wednesday, January 12, 2005 2:44 PM
Copyright 2005
Process perspective, and “User suggestions” in the Innovation and Learningperspective.
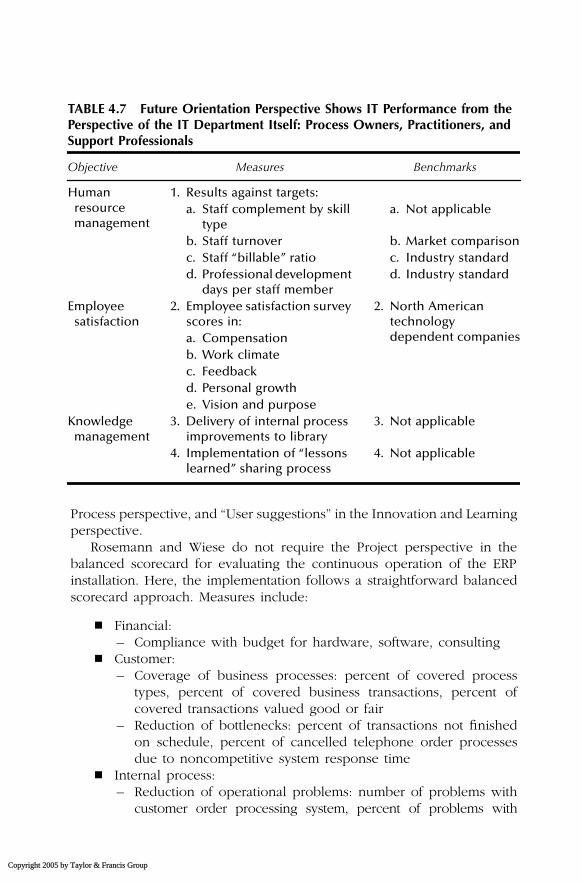
Rosemann and Wiese do not require the Project perspective in thebalanced scorecard for evaluating the continuous operation of the ERPinstallation. Here, the implementation follows a straightforward balancedscorecard approach. Measures include:
� Financial:– Compliance with budget for hardware, software, consulting
� Customer:– Coverage of business processes: percent of covered process
types, percent of covered business transactions, percent ofcovered transactions valued good or fair
– Reduction of bottlenecks: percent of transactions not finishedon schedule, percent of cancelled telephone order processesdue to noncompetitive system response time
� Internal process:– Reduction of operational problems: number of problems with
customer order processing system, percent of problems with
TABLE 4.7 Future Orientation Perspective Shows IT Performance from the Perspective of the IT Department Itself: Process Owners, Practitioners, and Support Professionals
Objective Measures Benchmarks
Human resource management
1. Results against targets:a. Staff complement by skill
typea. Not applicable
b. Staff turnover b. Market comparisonc. Staff “billable” ratio c. Industry standardd. Professional development
days per staff memberd. Industry standard
Employee satisfaction
2. Employee satisfaction survey scores in:
2. North American technology dependent companiesa. Compensation
b. Work climatec. Feedbackd. Personal growthe. Vision and purpose
Knowledge management
3. Delivery of internal process improvements to library
3. Not applicable
4. Implementation of “lessons learned” sharing process
4. Not applicable
by Taylor & Francis Group
108 � Implementing the IT Balanced Scorecard
AU2621_book.fm Page 108 Wednesday, January 12, 2005 2:44 PM
Copyright 2005
customer order processing system, number of problems withwarehouse processes, number of problems with standardreports, number of problems with reports on demand
– Availability of the ERP system: average system availability, aver-age downtime, maximum downtime
– Avoidance of operational bottlenecks: average response time inorder processing, average response time in order processing atpeak time, average number of OLTP transactions, maximumnumber of OLTP transactions
– Actuality of the system: average time to upgrade the system,release levels behind the actual level
– Improvement in system development: punctuality index of sys-tem delivery, quality index
– Avoidance of developer bottlenecks: average workload perdeveloper, rate of sick leave per developer, percent of modulescovered by more than two developers
TABLE 4.8 Recommended Metrics
System/Service/Function Possible Metric(s)
R&D Innovation captureNumber of quality improvementsCustomer satisfaction
Process improvement Cycle time, activity costsNumber of supplier relationshipsTotal cost of ownership
Resource planning, account management
Decision speedLowering level of decision authority
Groupware Cycle time reductionPaperwork reduction
Decision support Decision reliabilityTimelinessStrategic awarenessLowering level of decision authority
Management information systems Accuracy of dataTimeliness
E-commerce Market sharePrice premium for products or services
Information-based products and services
Operating marginsNew business revenuesCash flowKnowledge retention
by Taylor & Francis Group
Aligning IT to Organizational Strategy � 109
AU2621_book.fm Page 109 Wednesday, January 12, 2005 2:44 PM
Copyright 2005
� Innovation and learning:– Qualification: number of training hours per user, number of
training hours per developer, qualification index of developer(i.e., how qualified is this developer to do what he or she isdoing)
– Independence of consultants: number of consultant days permodule in use for more than two years, number of consultantdays per module in use for less than two years
– Reliability of software vendor: number of releases per year,number of functional additions, number of new customers
Keeping Track of What Is Going OnOperational awareness is the continuous attention to those activities thatenable an organization to determine how well it is meeting predetermined
TABLE 4.9 CRM Scorecard
Perspective Success Factor Metric
Financial Maximize customer lifetime value
Maximize share of wallet
Customer lifetime value ($)Share of wallet (%)
Customer Increase retentionIncrease penetrationIncrease win-backsIncrease new businessIncrease satisfaction
Retention percent (%)Penetration ratio (number)Win-back percent (%)Customer acquisitions (number)Customers highly satisfied (%)
Process Maximize sales productivityMaximize marketing
effectivenessMaximize service quality
Conversion rate per sales channel (%)
Revenue per conversion rate per sales channel ($)
Cost of sales per sales channel ($)Number of leads per marketing
channel (number)Service level per channel (%)Cost per service encounter ($)
Staff Increase employee satisfaction
Maintain high employee retention
Increase core CRM competencies
CRM employees highly satisfied, by CRM function (%)
CRM employee retention (%)Strategic CRM core competency
coverage, by CRM function (%)
by Taylor & Francis Group
110�
Imp
lemen
ting th
e IT Balan
ced Sco
recard
Internal Processes: DoesERP improve internalbusiness processes
AU
2621_book.fm Page 110 W
ednesday, January 12, 2005 2:44 PM
Copyr
FIGURE 4.2 The ERP balanced scorecard.
Financial Perspective:What are the detailed
costs of the ERPimplementation?
Customer Perspective:Does the ERP softwareefficiently support user
needs
Innovation and learning:Is ERP flexible enough tointegrate future changes?
ProjectPerspective
ight 2005 by Taylor & Francis Group
Aligning IT to Organizational Strategy � 111
AU2621_book.fm Page 111 Wednesday, January 12, 2005 2:44 PM
Copyright 2005
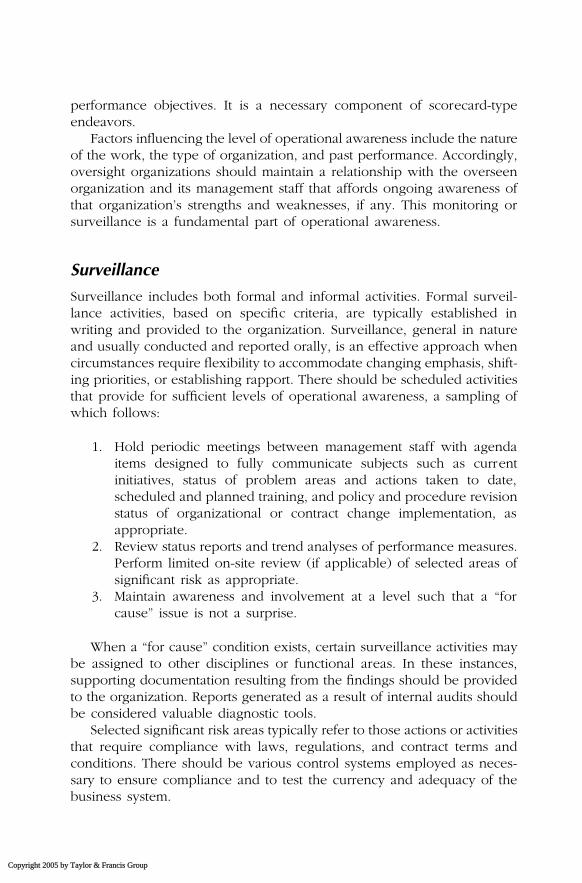
performance objectives. It is a necessary component of scorecard-typeendeavors.
Factors influencing the level of operational awareness include the natureof the work, the type of organization, and past performance. Accordingly,oversight organizations should maintain a relationship with the overseenorganization and its management staff that affords ongoing awareness ofthat organization’s strengths and weaknesses, if any. This monitoring orsurveillance is a fundamental part of operational awareness.
Surveillance
Surveillance includes both formal and informal activities. Formal surveil-lance activities, based on specific criteria, are typically established inwriting and provided to the organization. Surveillance, general in natureand usually conducted and reported orally, is an effective approach whencircumstances require flexibility to accommodate changing emphasis, shift-ing priorities, or establishing rapport. There should be scheduled activitiesthat provide for sufficient levels of operational awareness, a sampling ofwhich follows:
1. Hold periodic meetings between management staff with agendaitems designed to fully communicate subjects such as currentinitiatives, status of problem areas and actions taken to date,scheduled and planned training, and policy and procedure revisionstatus of organizational or contract change implementation, asappropriate.
2. Review status reports and trend analyses of performance measures.Perform limited on-site review (if applicable) of selected areas ofsignificant risk as appropriate.
3. Maintain awareness and involvement at a level such that a “forcause” issue is not a surprise.
When a “for cause” condition exists, certain surveillance activities maybe assigned to other disciplines or functional areas. In these instances,supporting documentation resulting from the findings should be providedto the organization. Reports generated as a result of internal audits shouldbe considered valuable diagnostic tools.
Selected significant risk areas typically refer to those actions or activitiesthat require compliance with laws, regulations, and contract terms andconditions. There should be various control systems employed as neces-sary to ensure compliance and to test the currency and adequacy of thebusiness system.
by Taylor & Francis Group
112 � Implementing the IT Balanced Scorecard
AU2621_book.fm Page 112 Wednesday, January 12, 2005 2:44 PM
Copyright 2005
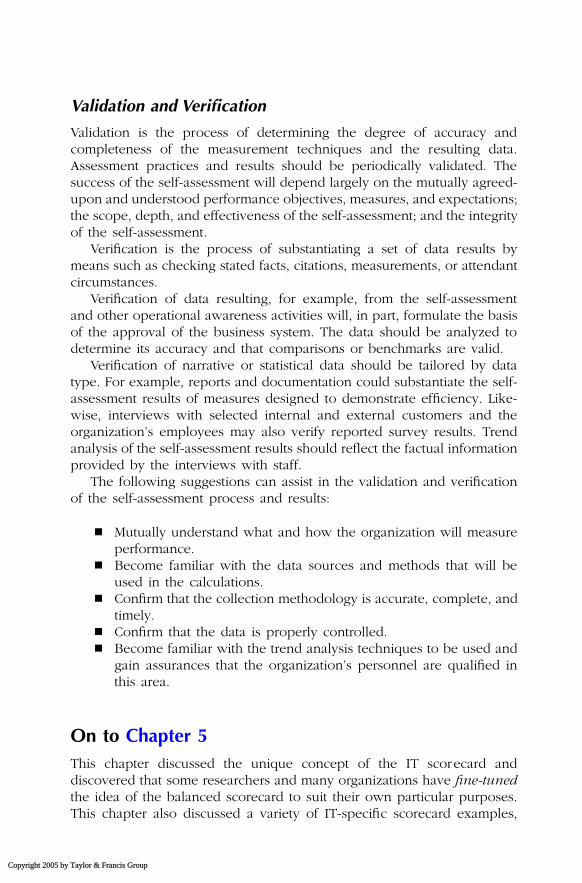
Validation and Verification
Validation is the process of determining the degree of accuracy andcompleteness of the measurement techniques and the resulting data.Assessment practices and results should be periodically validated. Thesuccess of the self-assessment will depend largely on the mutually agreed-upon and understood performance objectives, measures, and expectations;the scope, depth, and effectiveness of the self-assessment; and the integrityof the self-assessment.
Verification is the process of substantiating a set of data results bymeans such as checking stated facts, citations, measurements, or attendantcircumstances.
Verification of data resulting, for example, from the self-assessmentand other operational awareness activities will, in part, formulate the basisof the approval of the business system. The data should be analyzed todetermine its accuracy and that comparisons or benchmarks are valid.
Verification of narrative or statistical data should be tailored by datatype. For example, reports and documentation could substantiate the self-assessment results of measures designed to demonstrate efficiency. Like-wise, interviews with selected internal and external customers and theorganization’s employees may also verify reported survey results. Trendanalysis of the self-assessment results should reflect the factual informationprovided by the interviews with staff.
The following suggestions can assist in the validation and verificationof the self-assessment process and results:
� Mutually understand what and how the organization will measureperformance.
� Become familiar with the data sources and methods that will beused in the calculations.
� Confirm that the collection methodology is accurate, complete, andtimely.
� Confirm that the data is properly controlled.� Become familiar with the trend analysis techniques to be used and
gain assurances that the organization’s personnel are qualified inthis area.
On to Chapter 5This chapter discussed the unique concept of the IT scorecard anddiscovered that some researchers and many organizations have fine-tunedthe idea of the balanced scorecard to suit their own particular purposes.This chapter also discussed a variety of IT-specific scorecard examples,
by Taylor & Francis Group
Aligning IT to Organizational Strategy � 113
AU2621_book.fm Page 113 Wednesday, January 12, 2005 2:44 PM
Copyright 2005
along with their associated metrics. Hopefully, one is now becoming alot more comfortable with the topic — as well as the process — and isgetting ready to embark on a balanced scorecard project of one’s own.
Chapters 5 through 8 embark on very specific discussions of eachscorecard perspective. Chapter 5 specifically delves into the financialperspective of the balanced scorecard.
ReferencesArveson, P. (1998). The Value of Corporate IT Initiatives. http://www.balanced-
scorecard.org/bscit/value_add.html.Brewton, J. (2003, December 15). How Can We Use a Scorecard to Maximize Our
CRM Performance. CRM Magazine. http://www.destinationcrm.com/articles/default.asp?ArticleID=3689&KeyWords=balanced.
Hagood, W. and L. Friedman. (2002, Winter). Using the Balanced Scorecard toMeasure the Performance of Your HR Information System. Public PersonnelManagement, Vol. 31, No. 4.
Martinsons, M., R. Davison, and D. Tse. (1999, February). The Balanced Scorecard:A Foundation for the Strategic Management of Information Systems. Deci-sion Support Systems, 25(1), 71–88.
Parker, M., R. Benson, and H. Trainor. (1988). Information Economics: LinkingBusiness Performance to Information Technology. Englewood Cliffs, NJ:Prentice Hall.
Rosemann, M. and J. Wiese. (1999). Measuring the Performance of ERP Software —A Balanced Scorecard Approach. Proceedings of the 10th AustralasianConference on Information Systems. http://www2.vuw.ac.nz/acis99/Papers/PaperRosemannWiese-089.pdf.
Van der Zee, J. (1999, March). Alignment Is Not Enough: Integrating Business andIT Management with the Balanced Scorecard. Proceedings of the 1st Con-ference on the IT Balanced Scorecard, pp. 1–21.
Van Grembergen, W., R. Saull, and S. De Haes. (2003). Linking the IT BalancedScorecard to the Business Objectives at a Major Canadian Financial Group.Journal of Information Technology Cases and Application, Vol. 5, No. 1.
Van Grembergen, W. (2000). The balanced scorecard and IT governance. Infor-mation Systems Control Journal, 2, 40–43.
Venkatraman, N. (1999). Valuing the IS contribution to the business. ComputerSciences Corporation Report.
Working Council for Chief Information Officers. (2003). IT Balanced Scorecards.http://www.cio.executiveboard.com/Images/CIO/PDF/CIO73748.pdf.
by Taylor & Francis Group