Embed Size (px)
Citation preview

Impacts of Streamlining Construction Approval Processes in Ontario
A Socioeconomic Analysis
September 2020
Page | 2
About the Canadian Centre for Economic
Analysis
About the Report
The Canadian Centre for Economic Analysis
(CANCEA) is a socio-economic research and data
firm. CANCEA provides objective, independent
and evidence-based analysis and is dedicated to
a comprehensive, collaborative, and
quantitative understanding of the short- and
long-term risks and returns behind market
changes, policy decisions and economic
behaviour.
CANCEA uses modern techniques in data
science, including agent-based modelling, for
econometric analysis, risk management
assessments, demographic forecasts and
epidemiology. CANCEA’s work includes market
analysis, policy evaluation and risk
management, business model optimization,
cost effectiveness and rate of return analysis,
macroeconomic analysis, insurance risk
evaluation, land use and infrastructure
planning, logistics, and labour market analysis.
CANCEA also provides comprehensive Canadian
data services.
At the centre of CANCEA’s analytical capabilities
is an agent-based platform called Prosperity at
Risk® that is an extensive, data-driven model of
56,000 locations across Canada. Given the
systems focus behind all of CANCEA’s work,
CANCEA has a one model approach to its
analysis which allows various disciplines and
stakeholders to be incorporated into a single
analysis.
CANCEA does not accept any research funding
or client engagements that require a pre-
determined result or policy stance, or otherwise
inhibits its independence.
In keeping with CANCEA’s guidelines for funded
research, the design and method of research, as
well as the content of this study, were
determined solely by CANCEA.
This information is not intended as specific
investment, accounting, legal or tax advice.
©2020 Canadian Centre for Economic Analysis
Printed in Canada • All rights reserved
ISBN: 978-1-989077-26-9
Page | 3
TABLE OF CONTENTS Table of Contents .......................................................................................................................................... 3 List of Figures ................................................................................................................................................ 4 Findings at a glance ....................................................................................................................................... 5 1.0 Introduction ...................................................................................................................................... 6
1.1 Background ................................................................................................................................... 6 1.2 Objectives...................................................................................................................................... 7
2.0 Analysis ............................................................................................................................................. 8 2.1 Methodology ................................................................................................................................. 8 2.2 Results ......................................................................................................................................... 10
3.0 Conclusions ..................................................................................................................................... 12 A. Additional Figures ............................................................................................................................... 13
A.1. Reading the Results ..................................................................................................................... 13 A.2. Housing Stock and Population .................................................................................................... 14 A.3. Economic Impact ......................................................................................................................... 15
B. References .......................................................................................................................................... 16
Page | 4
LIST OF FIGURES
Figure 1 Impact of reducing delays in the construction pipeline ........................................................... 8
Figure 2 Impact of increased investment in the housing market ........................................................... 9
Figure 3 Example of reading the sensitivity result figures .................................................................... 13
Figure 4 Sensitivity of additional dwelling units by 2025 (left) and 2040 (right) .................................. 14
Figure 5 Additional population which could be housed by 2025 (left) and 2040 (right ....................... 14
Figure 6 Additional annual GDP by 2025 (left) and 2040 (right)........................................................... 15
Figure 7 Additional annual jobs by 2025 (left) and 2040 (right) ........................................................... 15
Page | 5
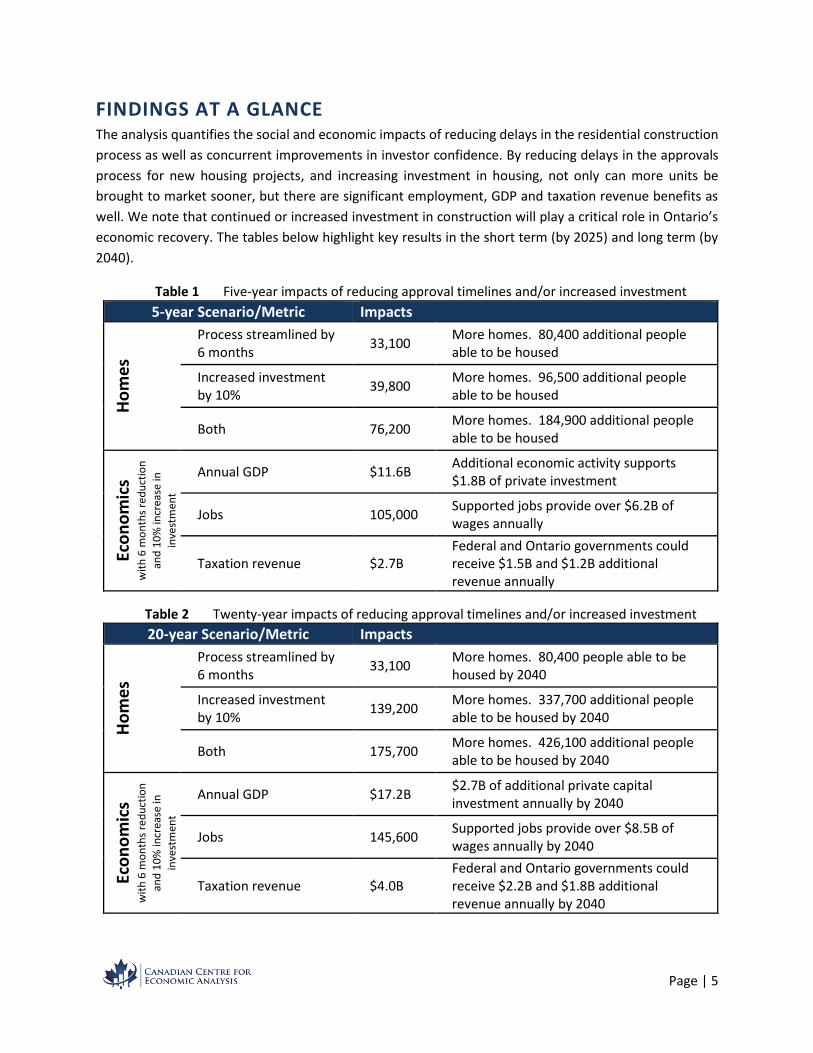
FINDINGS AT A GLANCE The analysis quantifies the social and economic impacts of reducing delays in the residential construction
process as well as concurrent improvements in investor confidence. By reducing delays in the approvals
process for new housing projects, and increasing investment in housing, not only can more units be
brought to market sooner, but there are significant employment, GDP and taxation revenue benefits as
well. We note that continued or increased investment in construction will play a critical role in Ontario’s
economic recovery. The tables below highlight key results in the short term (by 2025) and long term (by
2040).
Table 1 Five-year impacts of reducing approval timelines and/or increased investment
5-year Scenario/Metric Impacts
Ho
me
s
Process streamlined by 6 months
33,100 More homes. 80,400 additional people able to be housed
Increased investment by 10%
39,800 More homes. 96,500 additional people able to be housed
Both 76,200 More homes. 184,900 additional people able to be housed
Eco
no
mic
s w
ith
6 m
on
ths
red
uct
ion
and
10
% in
crea
se in
inve
stm
ent
Annual GDP $11.6B Additional economic activity supports $1.8B of private investment
Jobs 105,000 Supported jobs provide over $6.2B of wages annually
Taxation revenue $2.7B Federal and Ontario governments could receive $1.5B and $1.2B additional revenue annually
Table 2 Twenty-year impacts of reducing approval timelines and/or increased investment
20-year Scenario/Metric Impacts
Ho
me
s
Process streamlined by 6 months
33,100 More homes. 80,400 people able to be housed by 2040
Increased investment by 10%
139,200 More homes. 337,700 additional people able to be housed by 2040
Both 175,700 More homes. 426,100 additional people able to be housed by 2040
Eco
no
mic
s w
ith
6 m
on
ths
red
uct
ion
and
10
% in
crea
se in
inve
stm
ent
Annual GDP $17.2B $2.7B of additional private capital investment annually by 2040
Jobs 145,600 Supported jobs provide over $8.5B of wages annually by 2040
Taxation revenue $4.0B Federal and Ontario governments could receive $2.2B and $1.8B additional revenue annually by 2040
Page | 6
1.0 INTRODUCTION
1.1 BACKGROUND
Residential construction plays a crucial role in the Ontario economy through the direct economic activity
generated by the construction industry and additional housing stock that is built. From an economic point
of view, it directly contributes three per cent of the provincial GDP and almost twice that when suppliers
and the economic activity of employees are considered. From a housing point of view, it is critical to
providing homes for the 270,000 new people in Ontario every year. However, across the province
residential construction is highly dependent upon the policies and procedures of both the Ontario
government and 444 municipal governments. Despite efforts over the years to streamline approval
processes for the residential construction industry, the system remains complex and Byzantine in nature.
Uncertainty about submission requirements due to varying jurisdictional rules and timelines has led to
higher operational costs to develop properties and resulted in delayed or cancelled projects. This has
contributed to the well-documented housing crisis that Ontario now faces (CANCEA, 2017).
A recent McKinsey & Company report (McKinsey & Company, 2020) on COVID-19 infrastructure recovery
pointed to the need to support modernizing operations to create efficiencies – a policy embraced in many
parts of the world. The government of Germany, for example, has allocated $56 billion for modernizing
and digitizing industries to recover stronger and better.
Construction will play a major role in our economic recovery given the strong demand for housing.
However, government entities and regulatory bodies are a critical link in the complex housing supply chain
process. While various efforts have begun to streamline and digitize the process, Canada still lags behind
other advanced jurisdictions (64th globally) for dealing with construction permits (World Bank, 2020).
With an expanding population and many regions beset with a chronic and worsening housing crisis, the
need to increase housing supply has never been greater. Yet, the inability to manage approvals efficiently
dissuades investment and hampers economic recovery and growth.
Ontario’s existing development and approval processes, largely administered by municipal and regional
governments, has contributed to a significant project backlog, higher development costs and project risks,
resulting in lower housing production relative to demand. It can take more than three years to get the
necessary approvals in some GTA municipalities. Consequently, many recent studies and reports point to
the importance of streamlining approval processes while also proposing solutions (de Lint, 2018; Ontario,
2017; Duong & Amborski, 2017; McCabe, et al., 2019; McCabe, et al., 2017; KPMG, 2019). At the provincial
level, some of these proposals have been adopted through the More Homes, More Choice Act, 2019, and
the COVID-19 Economic Recovery Act, 2020. A few municipalities have made headway in modernizing the
approval process, but the practice of fully digitizing the system is still not well understood or adopted.
Municipalities that have adopted these practices have demonstrated the benefits of a more efficient
process for both design and review work. A province-wide system and platform able to accommodate
competitive service providers could facilitate the efficient management of approvals.
Page | 7
A collaborative initiative called One Ontario is underway to engage municipal and provincial governments,
architecture, engineering and construction companies, software providers and academics in order to
develop a streamlined approval process to deliver substantial economic benefits. According to AECO
Innovation Lab’s One Ontario report, Unifying Information Exchange (OneOntario, 2020), the notable
possible benefits of an innovative province-wide system for government, industry and ultimately
consumers include:
Municipalities & Provincial Agencies:
Increased supply of housing due to fewer postponed or abandoned projects and more
investment
Lower costs and improved efficiencies can be achieved through automated data exchange
and comprehensive e-permitting solutions
More complete, professional applications will be supported by an improved and predictable
regulatory process
Prevent loss of municipal revenue from delays in approval and construction processes (post-
development tax revenues much higher than pre-development)
Industry:
Faster development and building
More consistent permitting and approval processes across Ontario
Lower costs and less risk due to stalled projects thanks to faster and more certain approval
processes
Consumers:
Additional housing supply to meet demographic needs and support immigration, which is
crucial to Ontario’s economic growth
Better metrics derived from e-permitting data can inform strategic planning that impact all
Ontarians
Given the expected population growth in the province and the significant contribution that the residential
construction industry makes to the provincial economy, understanding the benefits of modernizing the
system is critical to the successful implementation and adoption of new technologies and processes.
1.2 OBJECTIVES
In order to better understand the economic risks and rewards associated with streamlining construction
approval processes in Ontario, the objectives of this study are to:
Quantify the impact of the delays in the construction process on housing supply
Investigate the sensitivity of future housing stock to approval times and certainty around the
approvals system
Evaluate the economic effects of reducing delays and increasing certainty on GDP and
employment
Page | 8
2.0 ANALYSIS
The analysis aims to quantify the key social and economic impacts of reducing delays in the construction
process, from project initiation to completion, and of increasing investor confidence. Since the correlation
between the reduction in delays and increases in investment is difficult to quantity, both variables are
modelled independently. Section 2.1 outlines the methodology used in the analysis and Section 2.2
presents the results.
2.1 METHODOLOGY
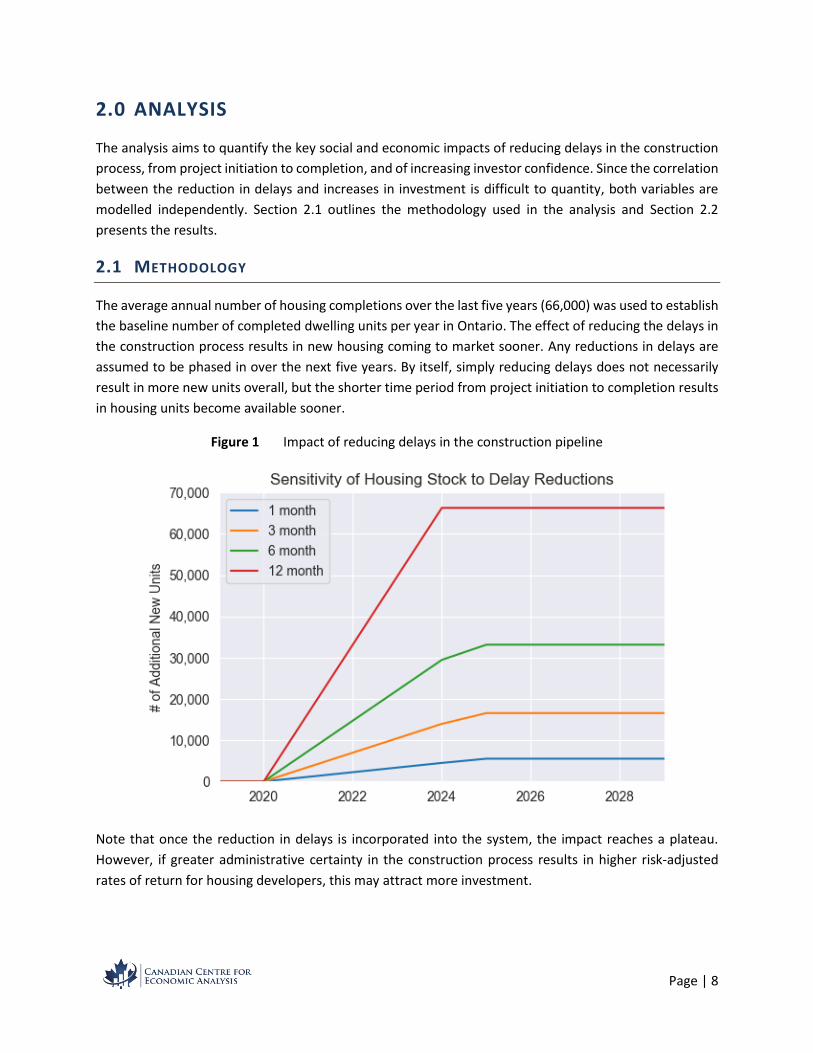
The average annual number of housing completions over the last five years (66,000) was used to establish
the baseline number of completed dwelling units per year in Ontario. The effect of reducing the delays in
the construction process results in new housing coming to market sooner. Any reductions in delays are
assumed to be phased in over the next five years. By itself, simply reducing delays does not necessarily
result in more new units overall, but the shorter time period from project initiation to completion results
in housing units become available sooner.
Figure 1 Impact of reducing delays in the construction pipeline
Note that once the reduction in delays is incorporated into the system, the impact reaches a plateau.
However, if greater administrative certainty in the construction process results in higher risk-adjusted
rates of return for housing developers, this may attract more investment.
Page | 9
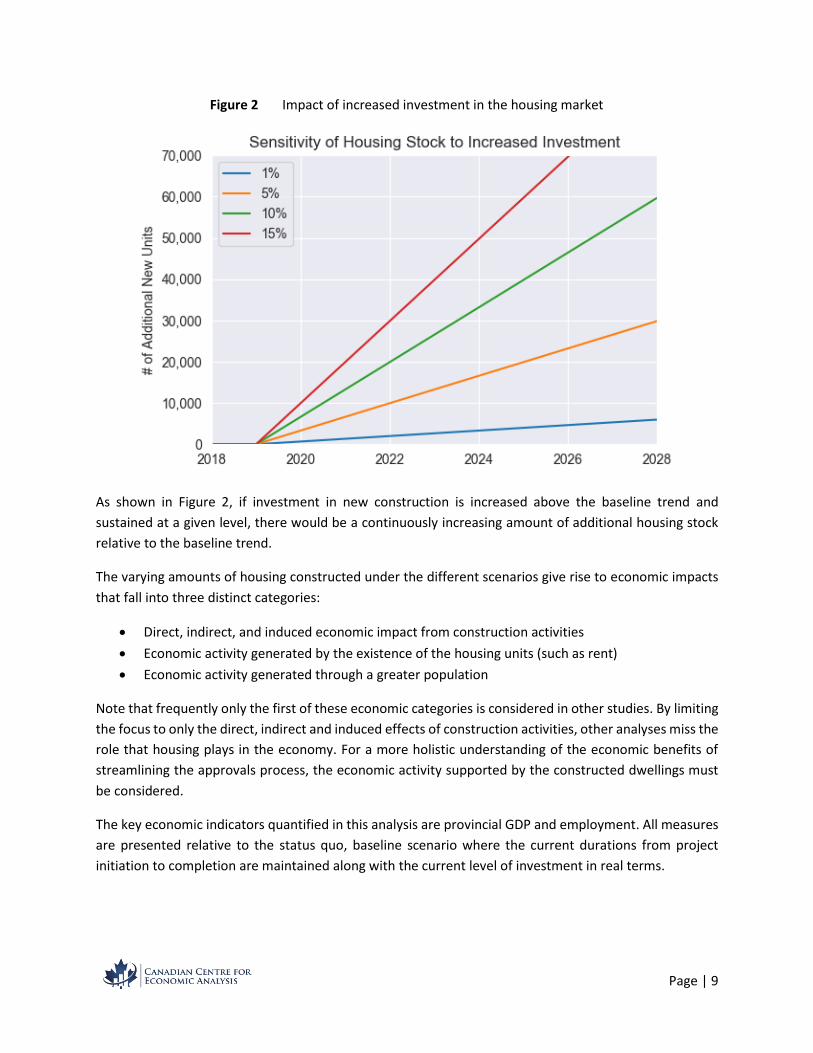
Figure 2 Impact of increased investment in the housing market
As shown in Figure 2, if investment in new construction is increased above the baseline trend and
sustained at a given level, there would be a continuously increasing amount of additional housing stock
relative to the baseline trend.
The varying amounts of housing constructed under the different scenarios give rise to economic impacts
that fall into three distinct categories:
Direct, indirect, and induced economic impact from construction activities
Economic activity generated by the existence of the housing units (such as rent)
Economic activity generated through a greater population
Note that frequently only the first of these economic categories is considered in other studies. By limiting
the focus to only the direct, indirect and induced effects of construction activities, other analyses miss the
role that housing plays in the economy. For a more holistic understanding of the economic benefits of
streamlining the approvals process, the economic activity supported by the constructed dwellings must
be considered.
The key economic indicators quantified in this analysis are provincial GDP and employment. All measures
are presented relative to the status quo, baseline scenario where the current durations from project
initiation to completion are maintained along with the current level of investment in real terms.
Page | 10
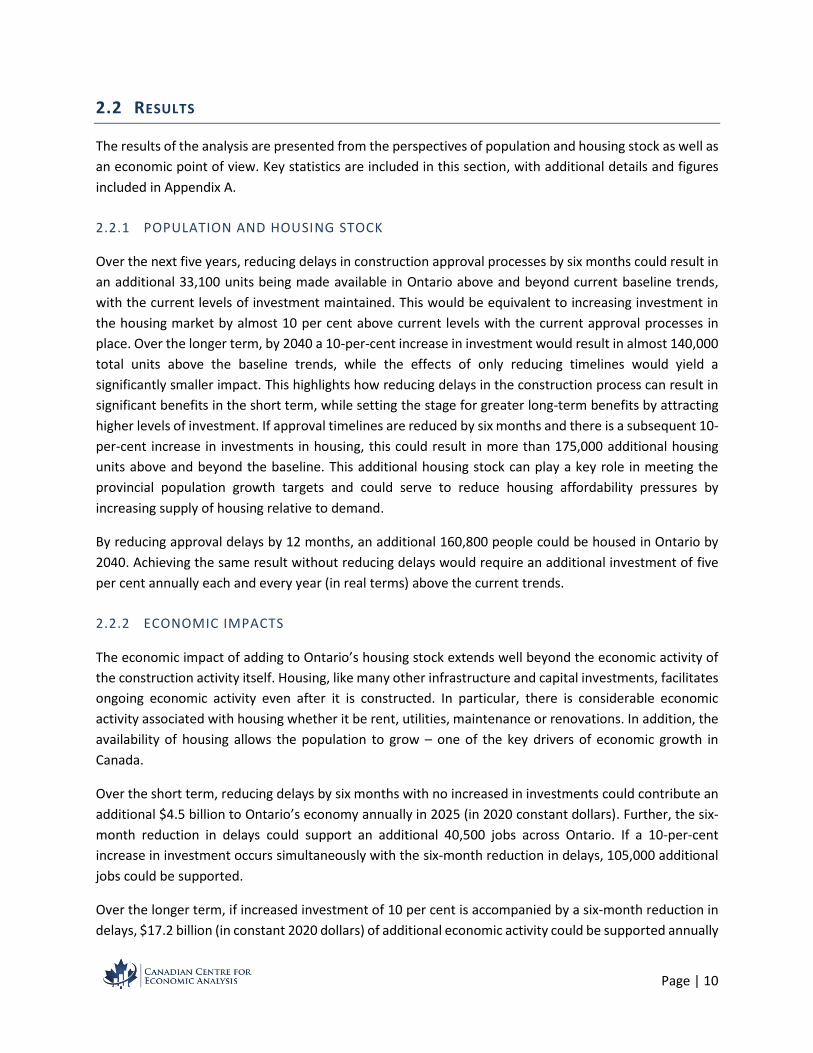
2.2 RESULTS
The results of the analysis are presented from the perspectives of population and housing stock as well as
an economic point of view. Key statistics are included in this section, with additional details and figures
included in Appendix A.
2.2.1 POPULATION AND HOUSING STOCK
Over the next five years, reducing delays in construction approval processes by six months could result in
an additional 33,100 units being made available in Ontario above and beyond current baseline trends,
with the current levels of investment maintained. This would be equivalent to increasing investment in
the housing market by almost 10 per cent above current levels with the current approval processes in
place. Over the longer term, by 2040 a 10-per-cent increase in investment would result in almost 140,000
total units above the baseline trends, while the effects of only reducing timelines would yield a
significantly smaller impact. This highlights how reducing delays in the construction process can result in
significant benefits in the short term, while setting the stage for greater long-term benefits by attracting
higher levels of investment. If approval timelines are reduced by six months and there is a subsequent 10-
per-cent increase in investments in housing, this could result in more than 175,000 additional housing
units above and beyond the baseline. This additional housing stock can play a key role in meeting the
provincial population growth targets and could serve to reduce housing affordability pressures by
increasing supply of housing relative to demand.
By reducing approval delays by 12 months, an additional 160,800 people could be housed in Ontario by
2040. Achieving the same result without reducing delays would require an additional investment of five
per cent annually each and every year (in real terms) above the current trends.
2.2.2 ECONOMIC IMPACTS
The economic impact of adding to Ontario’s housing stock extends well beyond the economic activity of
the construction activity itself. Housing, like many other infrastructure and capital investments, facilitates
ongoing economic activity even after it is constructed. In particular, there is considerable economic
activity associated with housing whether it be rent, utilities, maintenance or renovations. In addition, the
availability of housing allows the population to grow – one of the key drivers of economic growth in
Canada.
Over the short term, reducing delays by six months with no increased in investments could contribute an
additional $4.5 billion to Ontario’s economy annually in 2025 (in 2020 constant dollars). Further, the six-
month reduction in delays could support an additional 40,500 jobs across Ontario. If a 10-per-cent
increase in investment occurs simultaneously with the six-month reduction in delays, 105,000 additional
jobs could be supported.
Over the longer term, if increased investment of 10 per cent is accompanied by a six-month reduction in
delays, $17.2 billion (in constant 2020 dollars) of additional economic activity could be supported annually

Page | 11
by 2040. This arises not only from the additional construction activity, but the economic growth of the
greater population and economic activity from the additional housing stock. This would support an
additional 145,600 jobs and $8.5 billion in employment income.
The additional economic activity would also drive more government revenue through income and
corporate taxes. By 2040, the federal government could be receiving an additional $2.2 billion annually,
with the Ontario government receiving $1.8 billion annually (in constant 2020 dollars).
Page | 12
3.0 CONCLUSIONS
In the short term, the reduction of delays in the construction process from proposal to completion can
achieve an increase in housing supply equivalent to a moderate increase in investment in housing. This is
a particularly important factor in the current broader economic environment where investors may be
more reluctant to make new investments but continued growth in housing is required to meet the
demand of demographic growth and help reduce affordability pressures. Any additional housing that can
support population growth and its associated economic growth can play a key role in recovering from the
current economic crisis.
Even moderate improvements can have a significant effect. If a more streamlined approval process
reduced delays by three months, and led to increased investment in housing construction by five per cent,
it could support an additional 56,000 jobs in the short term, growing to more than 72,000 by 2040.
As the COVID-19 pandemic has shown, established processes can be radically changed when required. A
large body of research, briefly touched upon in Section 1.1, has been conducted, examining the
opportunities, solutions and technologies to streamline the approvals process. These ideas and
technologies can be leveraged to realize the social and economic benefits of an improved approval
process.
Page | 13
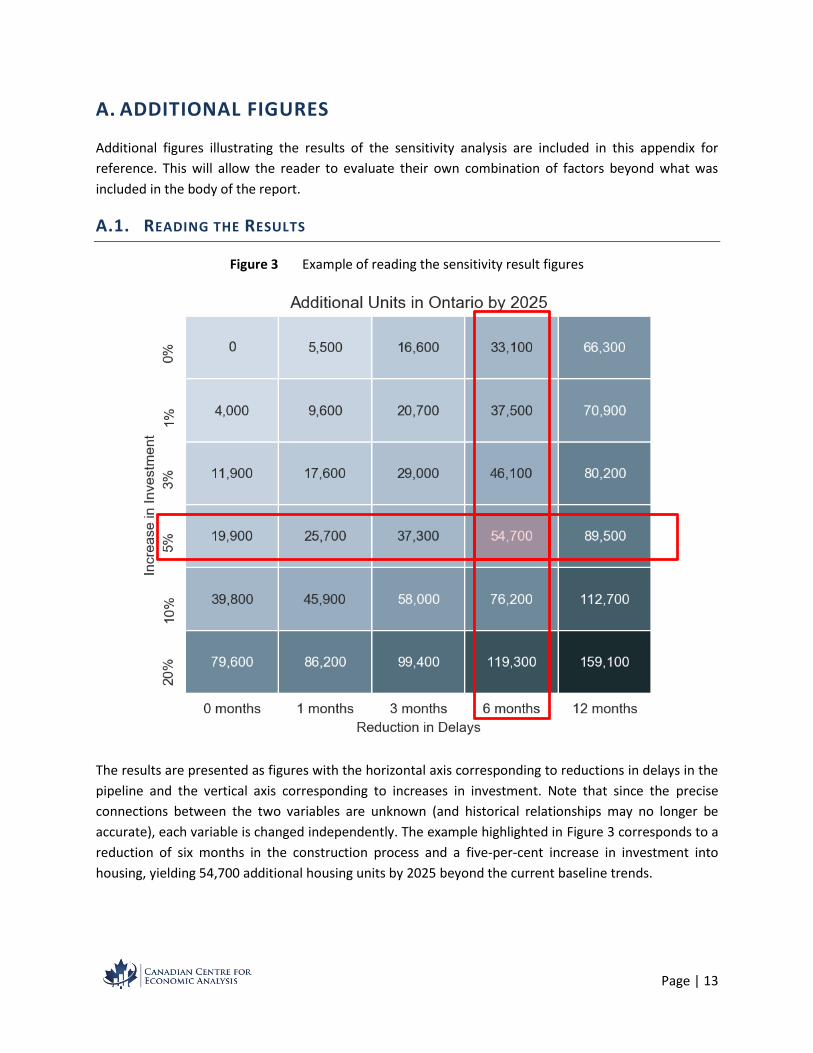
A. ADDITIONAL FIGURES
Additional figures illustrating the results of the sensitivity analysis are included in this appendix for
reference. This will allow the reader to evaluate their own combination of factors beyond what was
included in the body of the report.
A.1. READING THE RESULTS
Figure 3 Example of reading the sensitivity result figures
The results are presented as figures with the horizontal axis corresponding to reductions in delays in the
pipeline and the vertical axis corresponding to increases in investment. Note that since the precise
connections between the two variables are unknown (and historical relationships may no longer be
accurate), each variable is changed independently. The example highlighted in Figure 3 corresponds to a
reduction of six months in the construction process and a five-per-cent increase in investment into
housing, yielding 54,700 additional housing units by 2025 beyond the current baseline trends.
Page | 14
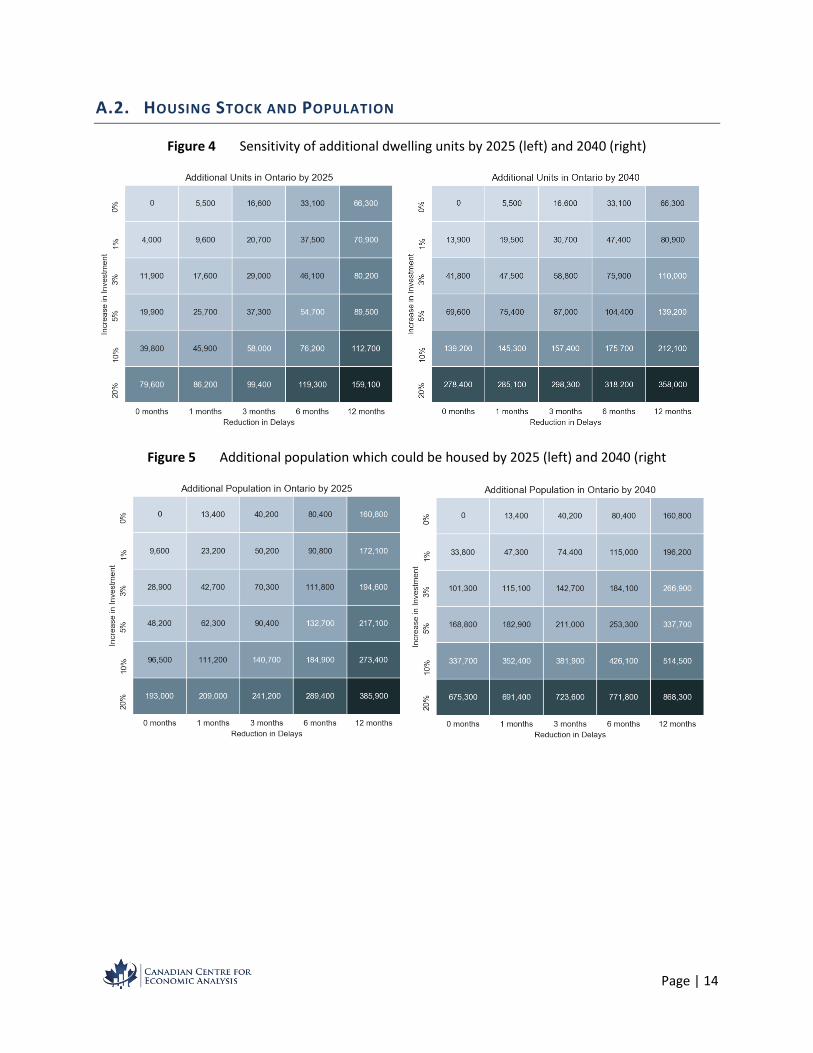
A.2. HOUSING STOCK AND POPULATION
Figure 4 Sensitivity of additional dwelling units by 2025 (left) and 2040 (right)
Figure 5 Additional population which could be housed by 2025 (left) and 2040 (right
Page | 15
A.3. ECONOMIC IMPACT
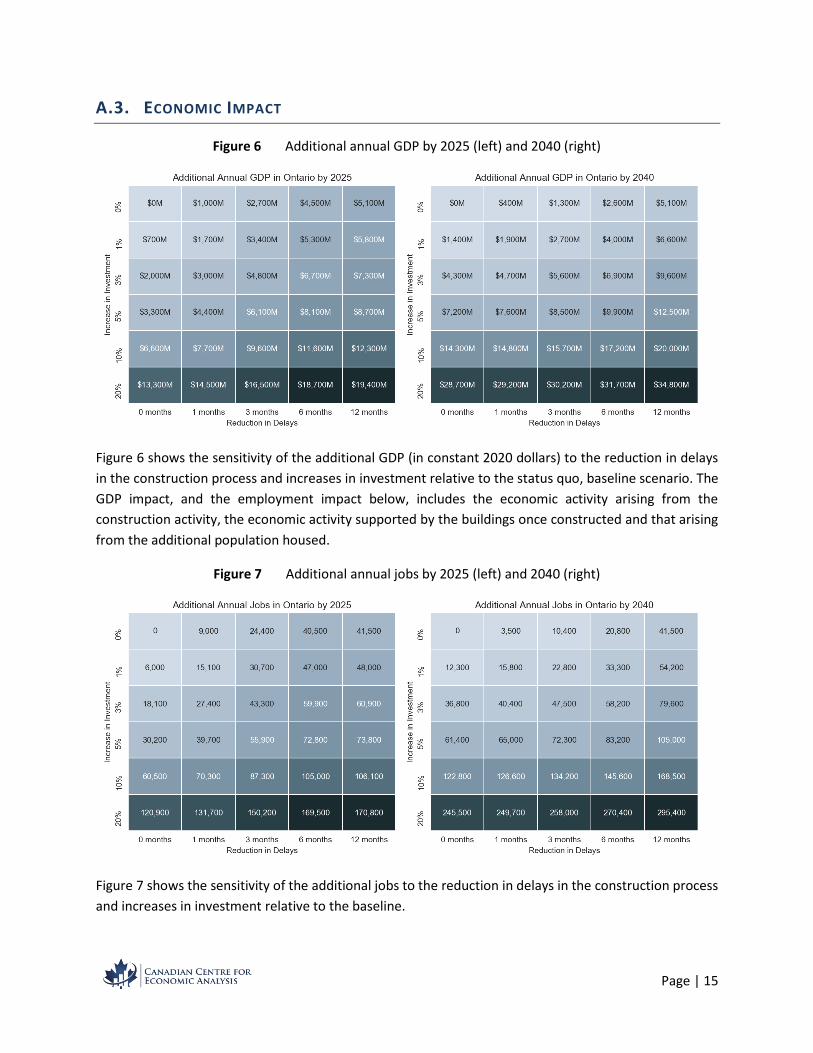
Figure 6 Additional annual GDP by 2025 (left) and 2040 (right)
Figure 6 shows the sensitivity of the additional GDP (in constant 2020 dollars) to the reduction in delays
in the construction process and increases in investment relative to the status quo, baseline scenario. The
GDP impact, and the employment impact below, includes the economic activity arising from the
construction activity, the economic activity supported by the buildings once constructed and that arising
from the additional population housed.
Figure 7 Additional annual jobs by 2025 (left) and 2040 (right)
Figure 7 shows the sensitivity of the additional jobs to the reduction in delays in the construction process
and increases in investment relative to the baseline.
Page | 16
B. REFERENCES
CANCEA, 2017. Understanding the forces driving the shelter affordability issue: A linked-path assessment
of housing markiet dynamics in Ontario and the GTHA, s.l.: The Canadian Centre for Economic Analysis.
Duong, L. & Amborski, D., 2017. Modernizing Building Approvals in Ontario: Catching Up with Advanced
Jurisdictions, Toronto: s.n.
KPMG, 2019. End-to-End Review of the Development Review Process, Toronto: s.n.
McCabe, B., Shahi, A. & Zhang, L. H., 2017. 1st Annual BIM Report: For the Greater Toronto Area, s.l.: s.n.
McCabe, B. et al., 2019. 2nd Annual BIM Report: Canada Wide Survey, s.l.: s.n.
McKinsey & Company, 2020. Voices on Infrastructure: Resetting amid COVID-19, s.l.: s.n.
OneOntario, 2020. Unifying information exchange, s.l.: s.n.
Ontario, 2017. Development Approcal Roundtable Action Plan, Toronto: Government of Ontario.
RESCON, 2018. Streamlinging the Development and Building Approvals Process in Ontario: Good practice
concepts and a guide to action, Toronto: RESCON.
World Bank, 2020. Dealing with Construction Permits. [Online]
Available at: https://www.doingbusiness.org/en/data/exploretopics/dealing-with-construction-permits
[Accessed 01 Septemver 2020].