Embed Size (px)
Citation preview
Impacts of cyclones over the Impacts of cyclones over the Argentinean coastArgentinean coast
Claudia M. CampetellaClaudia M. Campetella
Departamento de Ciencias de la Atmósfera y los Océanos
Universidad de Buenos Aires
Argentina
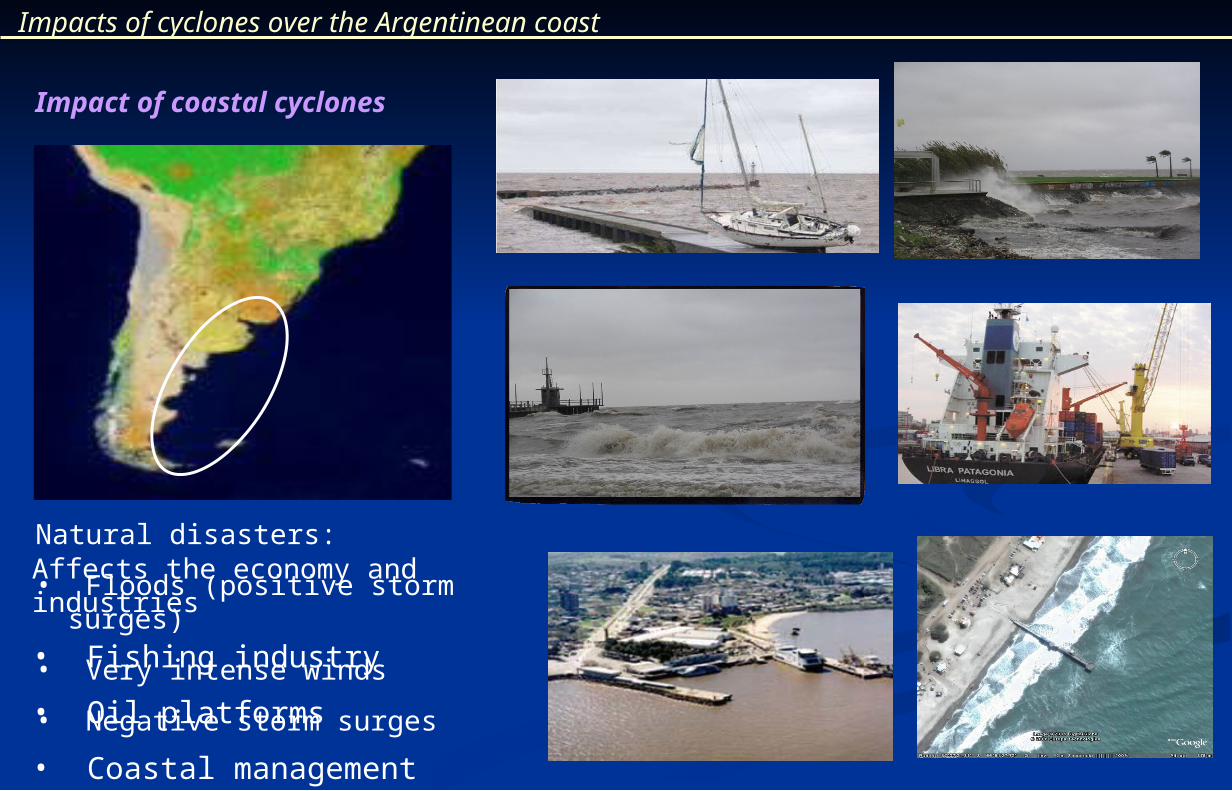
Impacts of cyclones over the Argentinean coast
Impact of coastal cyclones
Natural disasters:
• Floods (positive storm surges)
• Very intense winds
• Negative storm surges
Affects the economy and industries
• Fishing industry
• Oil platforms
• Coastal management
Explosive cyclones over Explosive cyclones over
the South Atlantic Oceanthe South Atlantic Ocean
-75 -70 -65 -60 -55 -50 -45 -40 -35 -30
-60
-55
-50
-45
-40
-35
-30
-25
-20
00 UTC
-75 -70 -65 -60 -55 -50 -45 -40 -35 -30
-60
-55
-50
-45
-40
-35
-30
-25
-20
12 UTC
Explosive cyclones Possia, PhD Dissertation
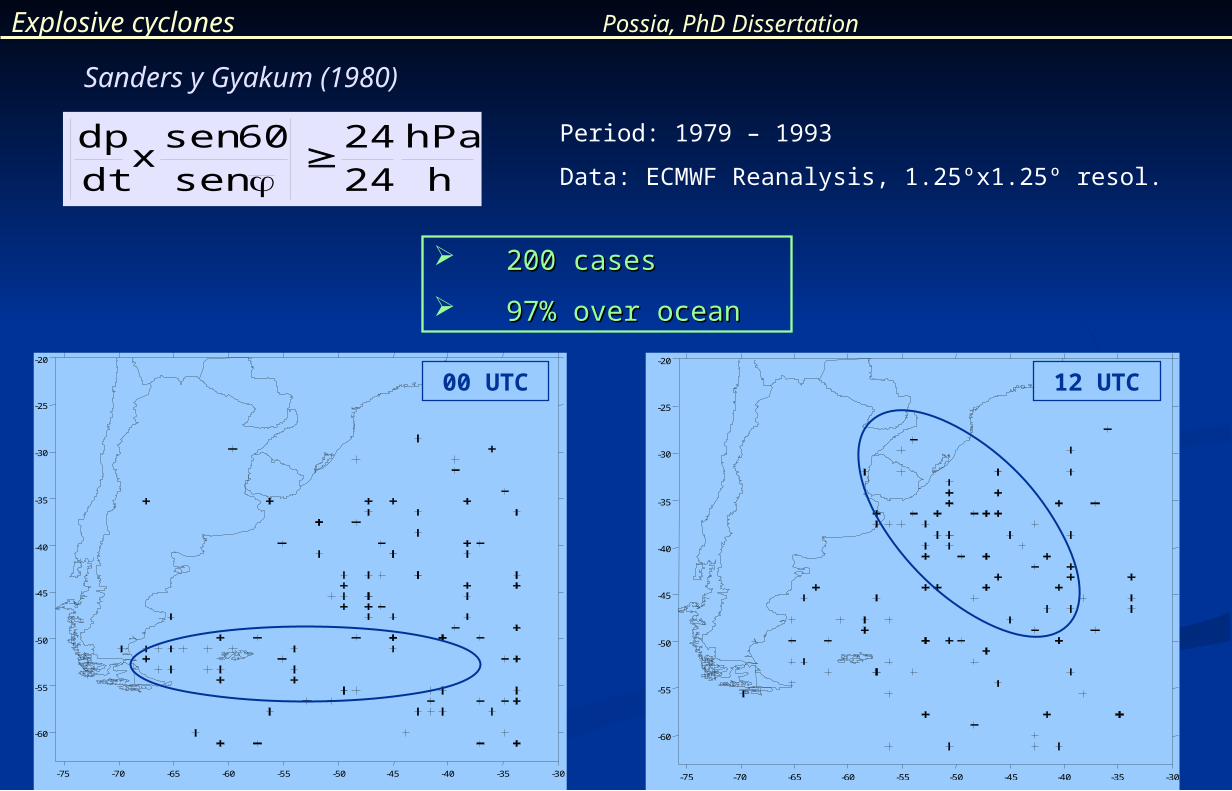
200 cases200 cases
97% over ocean97% over ocean
hhPa
xdtdp
2424
sen60sen
Sanders y Gyakum (1980)
Period: 1979 – 1993
Data: ECMWF Reanalysis, 1.25ºx1.25º resol.
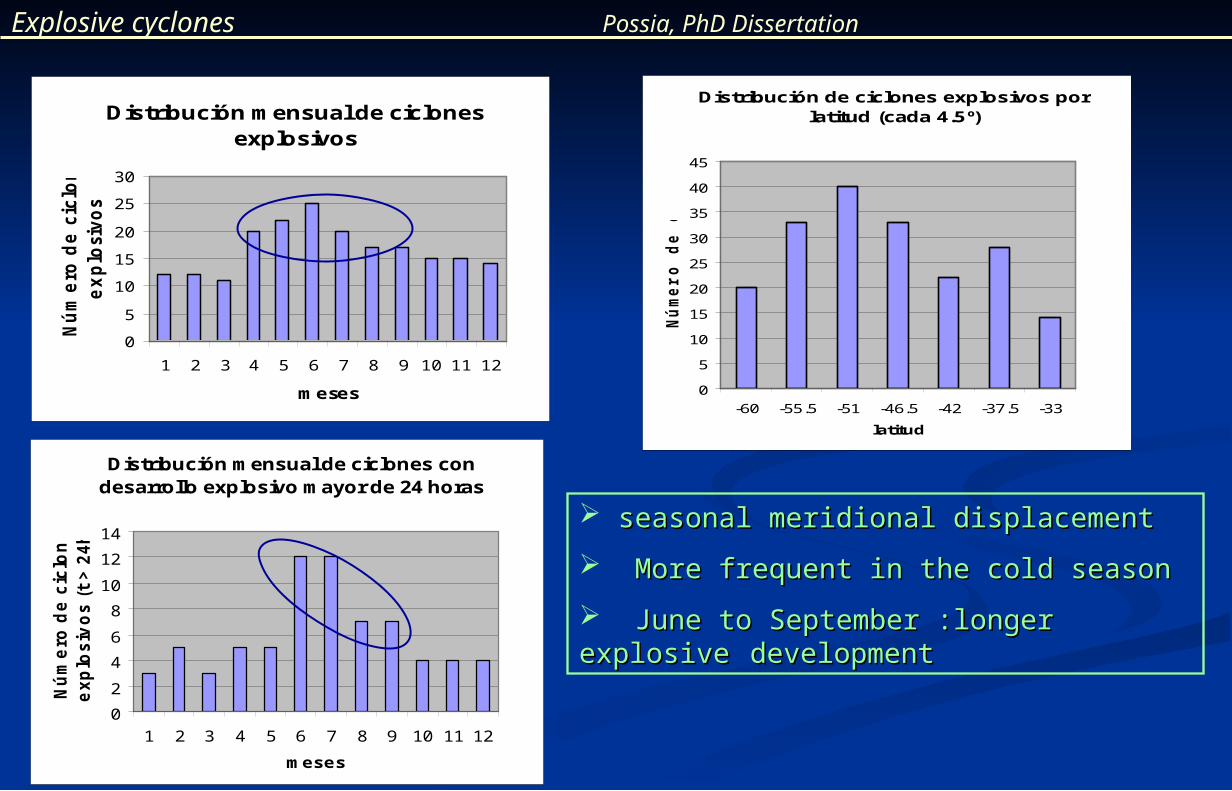
Distribución de ciclones explosivos por latitud (cada 4.5º)
0
5
10
15
20
25
30
35
40
45
-60 -55.5 -51 -46.5 -42 -37.5 -33
latitud
Nú
mero
de c
aso
s
seasonal meridional displacementseasonal meridional displacement
More frequent in the cold seasonMore frequent in the cold season
June to September :longer explosive June to September :longer explosive development development
Distribución mensual de ciclones explosivos
0
5
10
15
20
25
30
1 2 3 4 5 6 7 8 9 10 11 12
meses
Nú
me
ro d
e c
iclo
ne
s
ex
plo
siv
os
Distribución mensual de ciclones con desarrollo explosivo mayor de 24 horas
0
2
4
6
8
10
12
14
1 2 3 4 5 6 7 8 9 10 11 12
meses
Nú
me
ro d
e c
iclo
ne
s
ex
plo
siv
os
(t
> 2
4h
s)
Explosive cyclones Possia, PhD Dissertation
Explosive cyclones Possia, PhD Dissertation
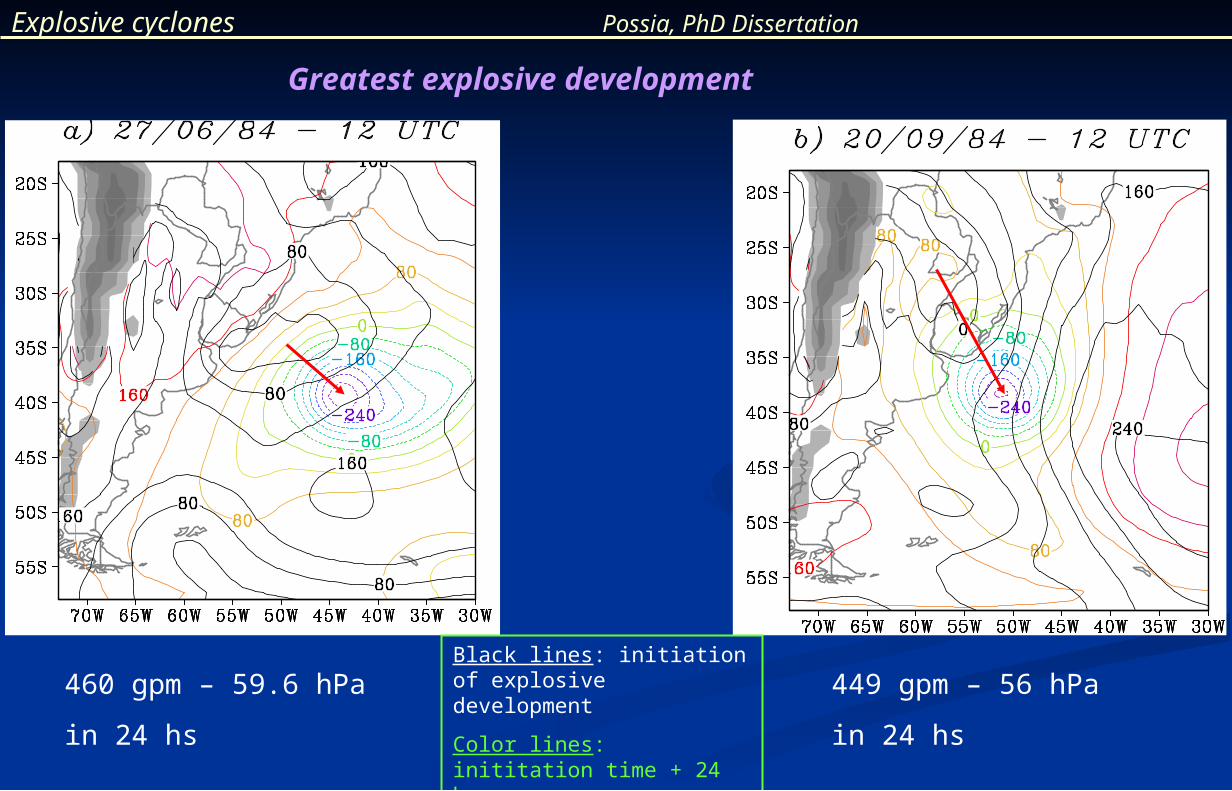
Greatest explosive development
460 gpm – 59.6 hPa
in 24 hs
449 gpm – 56 hPa
in 24 hs
Black lines: initiation of explosive development
Color lines: inititation time + 24 hs
Explosive cyclones Possia, PhD Dissertation
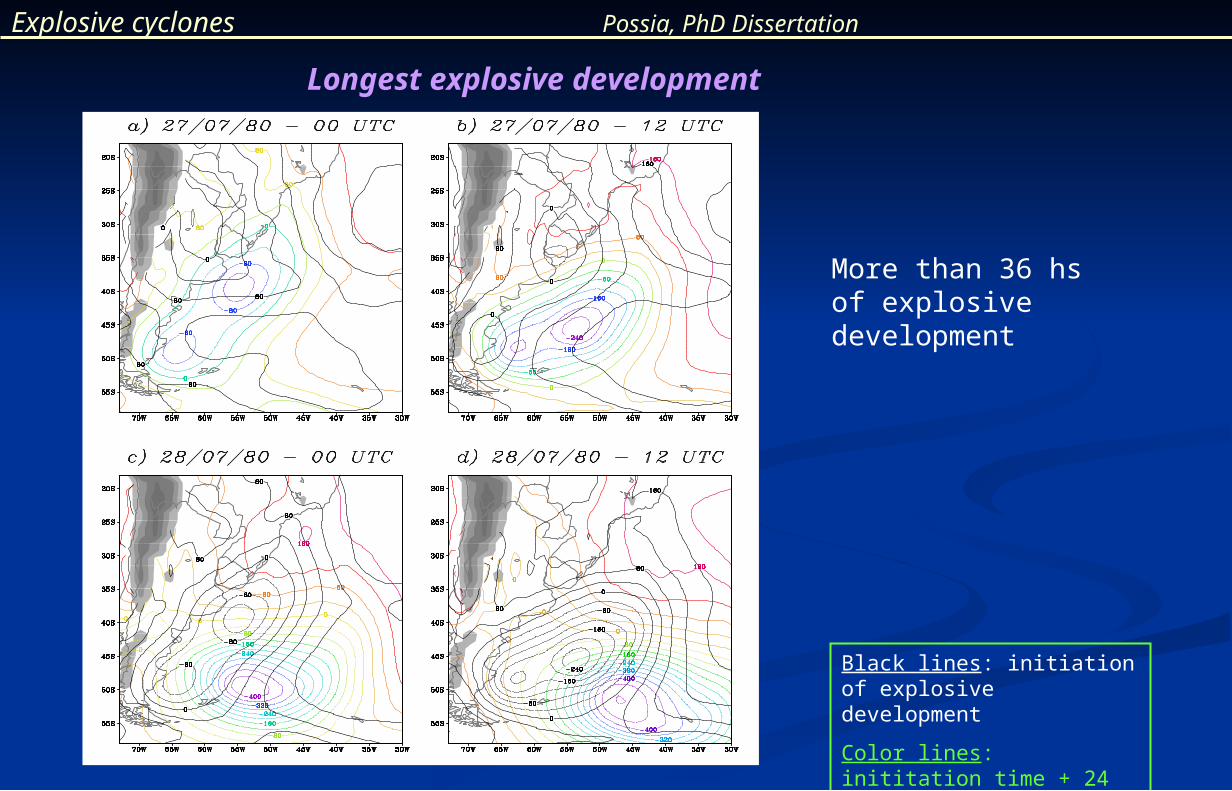
Longest explosive development
Black lines: initiation of explosive development
Color lines: inititation time + 24 hs
More than 36 hs of explosive development
Explosive cyclones Possia, PhD Dissertation
The extreme cases of explosive cyclones as greatest explosive and longest development occur close the Argentinean coast.
They produce different impacts over the coastline and offshore.
It depends of the position of the cyclone center and its track
Negative storm surges in theNegative storm surges in the
Port of Buenos AiresPort of Buenos Aires
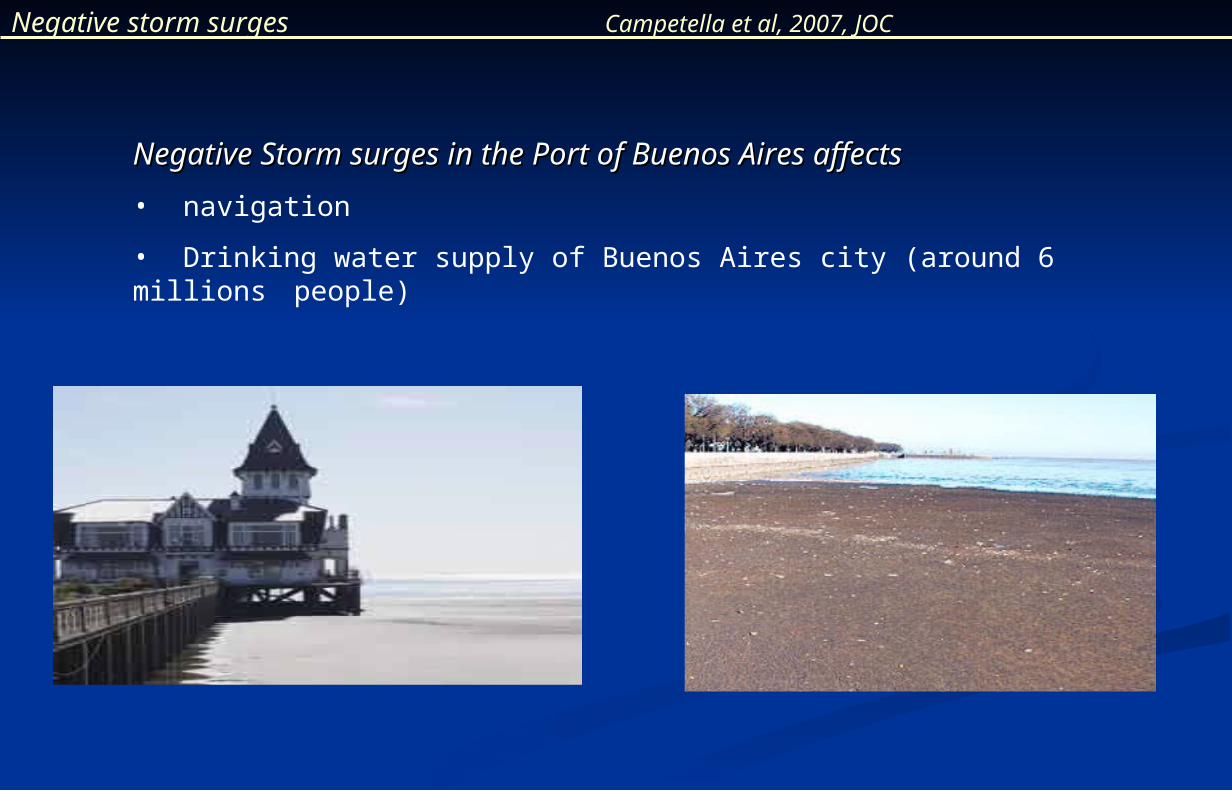
Negative Storm surges in the Port of Buenos Aires affectsNegative Storm surges in the Port of Buenos Aires affects
• navigation
• Drinking water supply of Buenos Aires city (around 6 millions people)
Negative storm surges Campetella et al, 2007, JOC
Negative storm surges Campetella et al, 2007, JOC
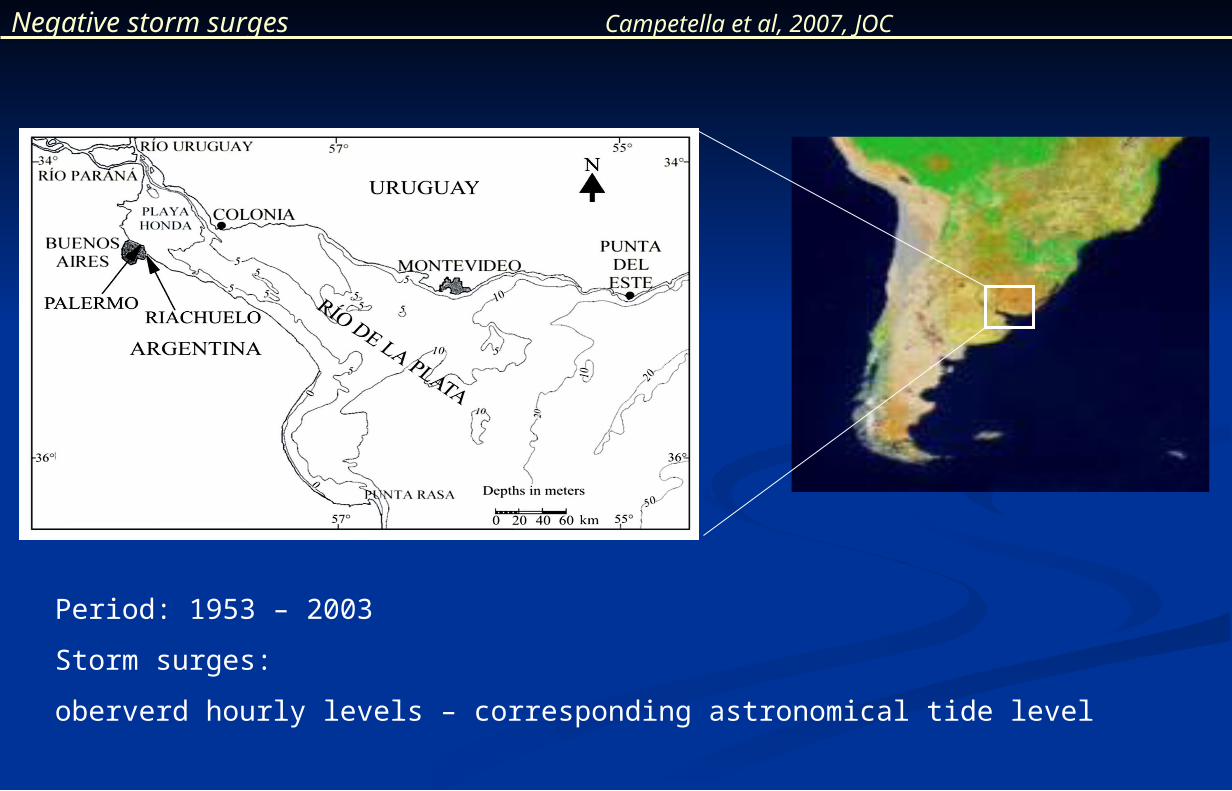
Period: 1953 – 2003
Storm surges:
oberverd hourly levels – corresponding astronomical tide level
Negative storm surges Campetella et al, 2007, JOC
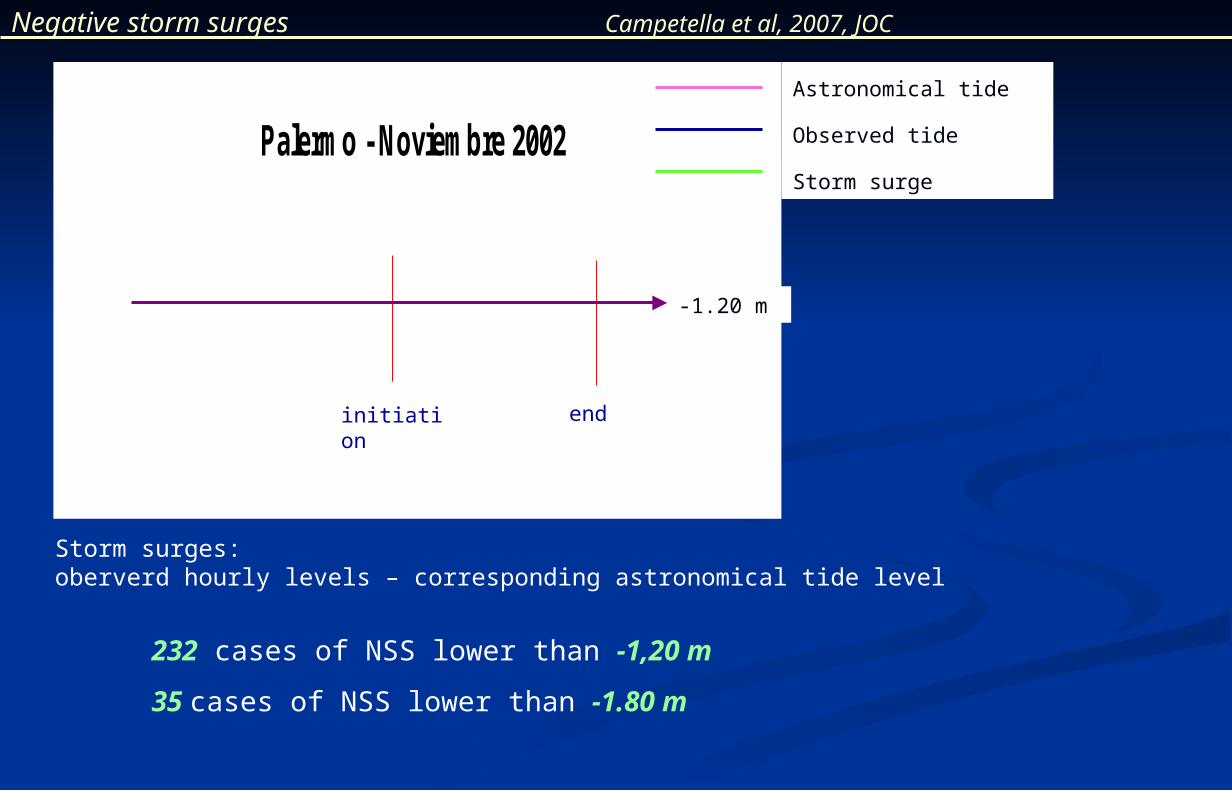
Palermo - Noviembre 2002
Marea Observada Marea Astronómica ODT_neg -30cm
initiation end
Astronomical tide
Observed tide
Storm surge
232 cases of NSS lower than -1,20 m
35 cases of NSS lower than -1.80 m
-1.20 m
Storm surges:oberverd hourly levels – corresponding astronomical tide level
Negative storm surges Campetella et al, 2007, JOC
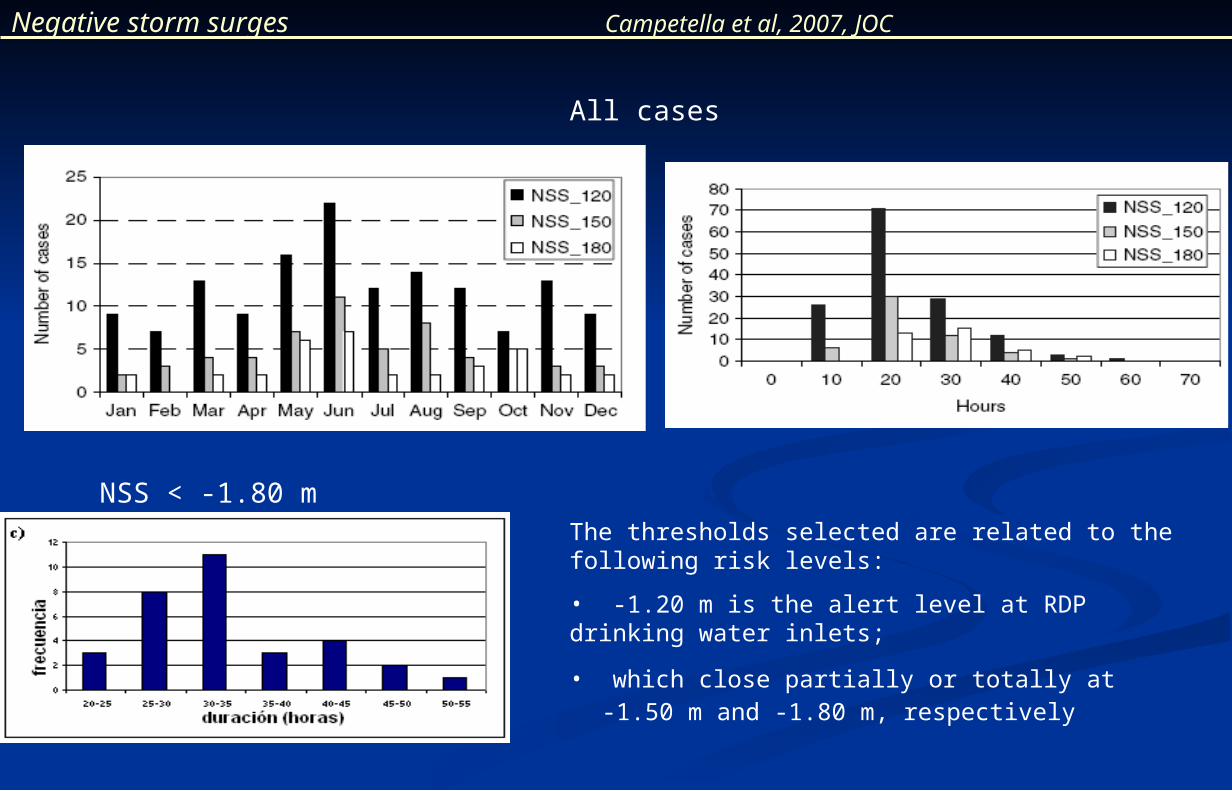
All cases
NSS < -1.80 mThe thresholds selected are related to the following risk levels:
• -1.20 m is the alert level at RDP drinking water inlets;
• which close partially or totally at -1.50 m and -1.80 m, respectively
Palermo - Noviembre 2002
Marea Observada Marea Astronómica ODT_neg -30cm
initiation end
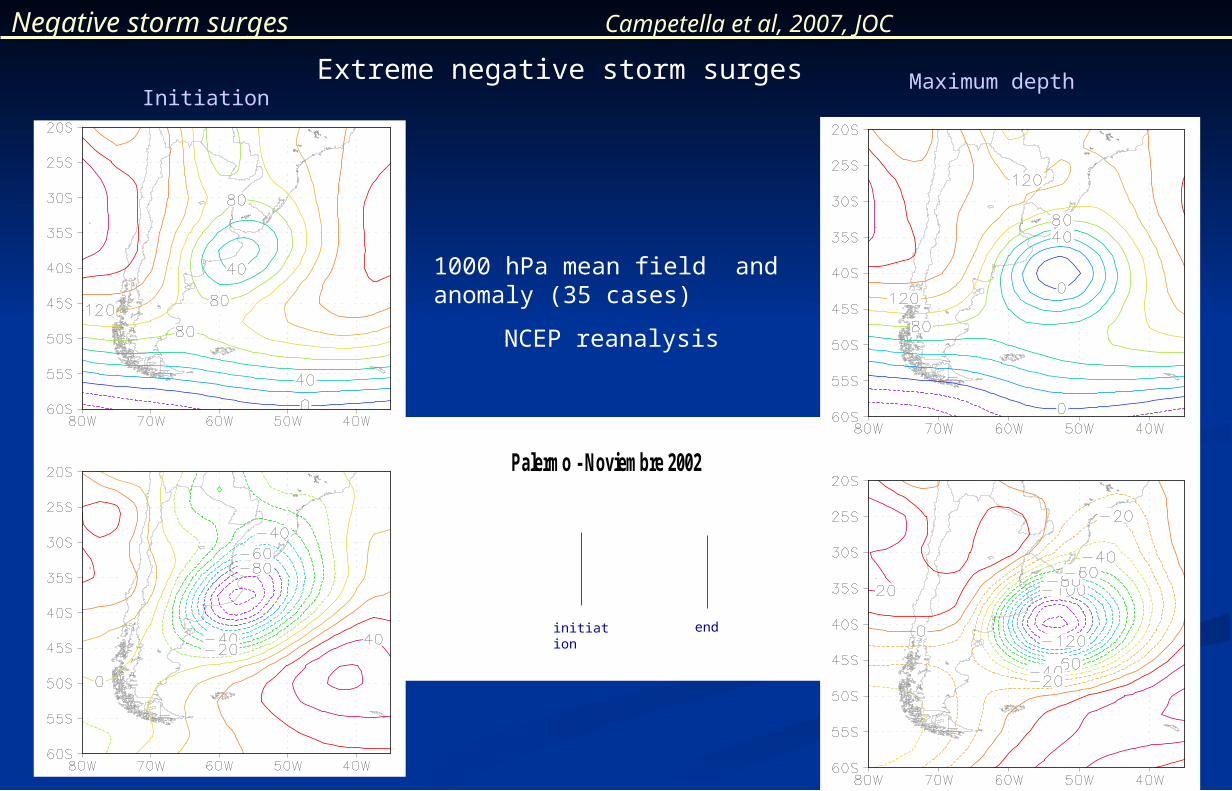
Negative storm surges Campetella et al, 2007, JOC
1000 hPa mean field and anomaly (35 cases)
NCEP reanalysis
InitiationMaximum depthExtreme negative storm surges
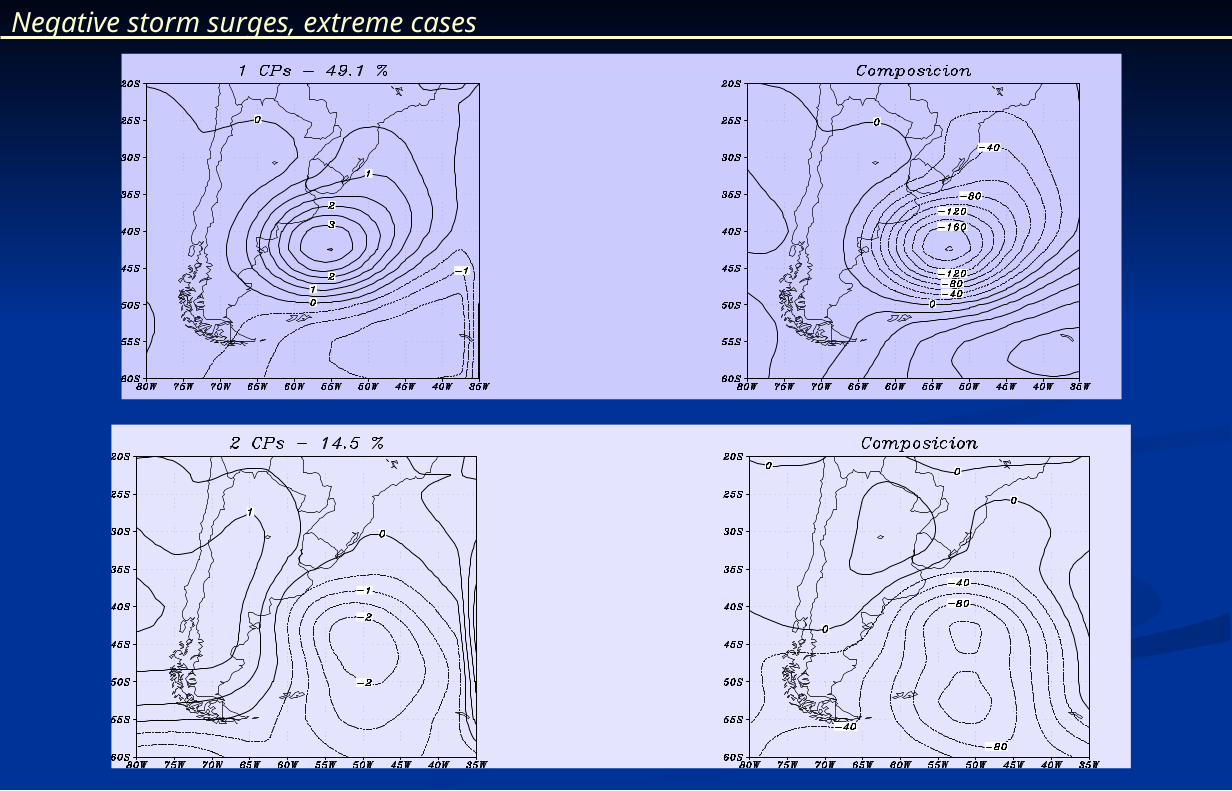
Negative storm surges, extreme cases
Negative storm surges
Extreme negative storm surge cases reveal a well defined pattern:
A low pressure system over the east of Buenos Aires province
The associated winds direction facilities the outflow from the estuary
The type of storm surge (negative or positive) strongly depends on the cyclone location.
If the cyclone is placed to the north, it causes a river level rise (“Sudestada”).
It’s essential a good forecast of the cyclone track and intensity
Cyclones and extreme waves near the Cyclones and extreme waves near the coastcoast
Cyclones and extreme waves Campos et al, 2007 – Martin et al, 2007
Servicio de Hidrografía Naval (SHN)
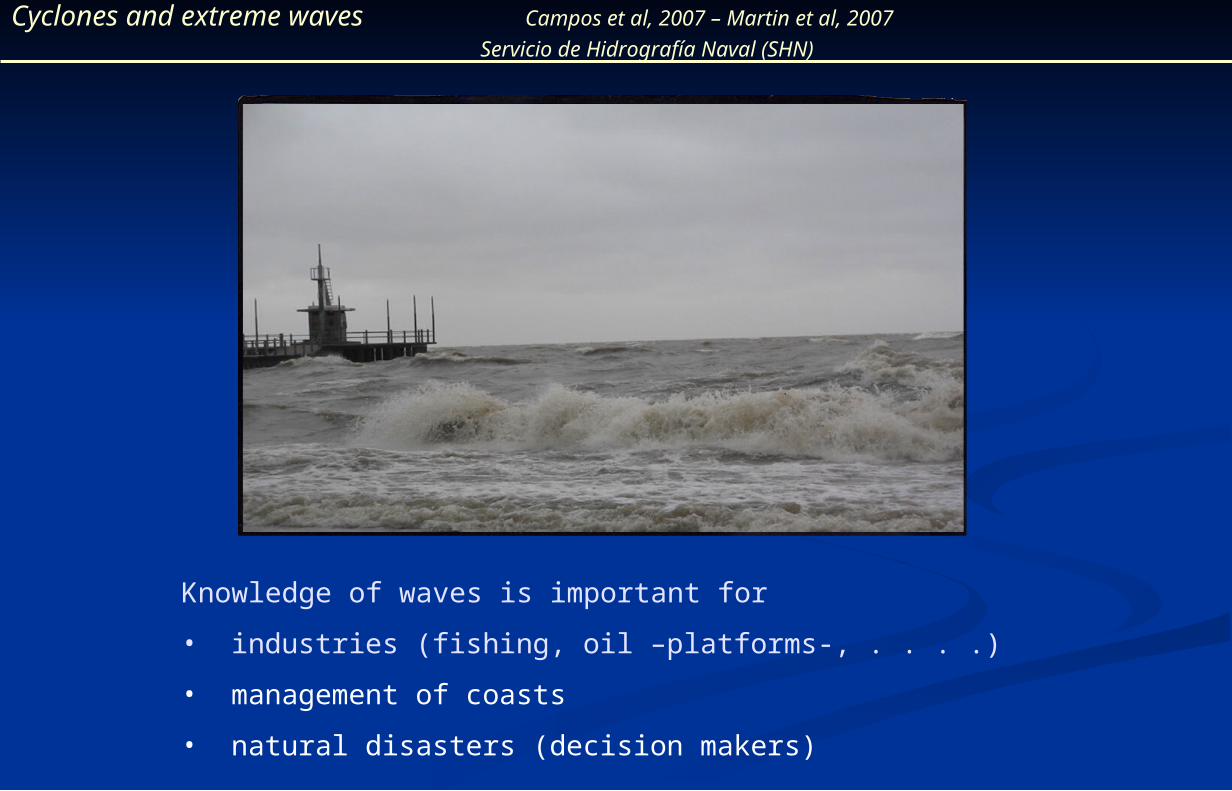
Knowledge of waves is important for
• industries (fishing, oil –platforms-, . . . .)
• management of coasts
• natural disasters (decision makers)
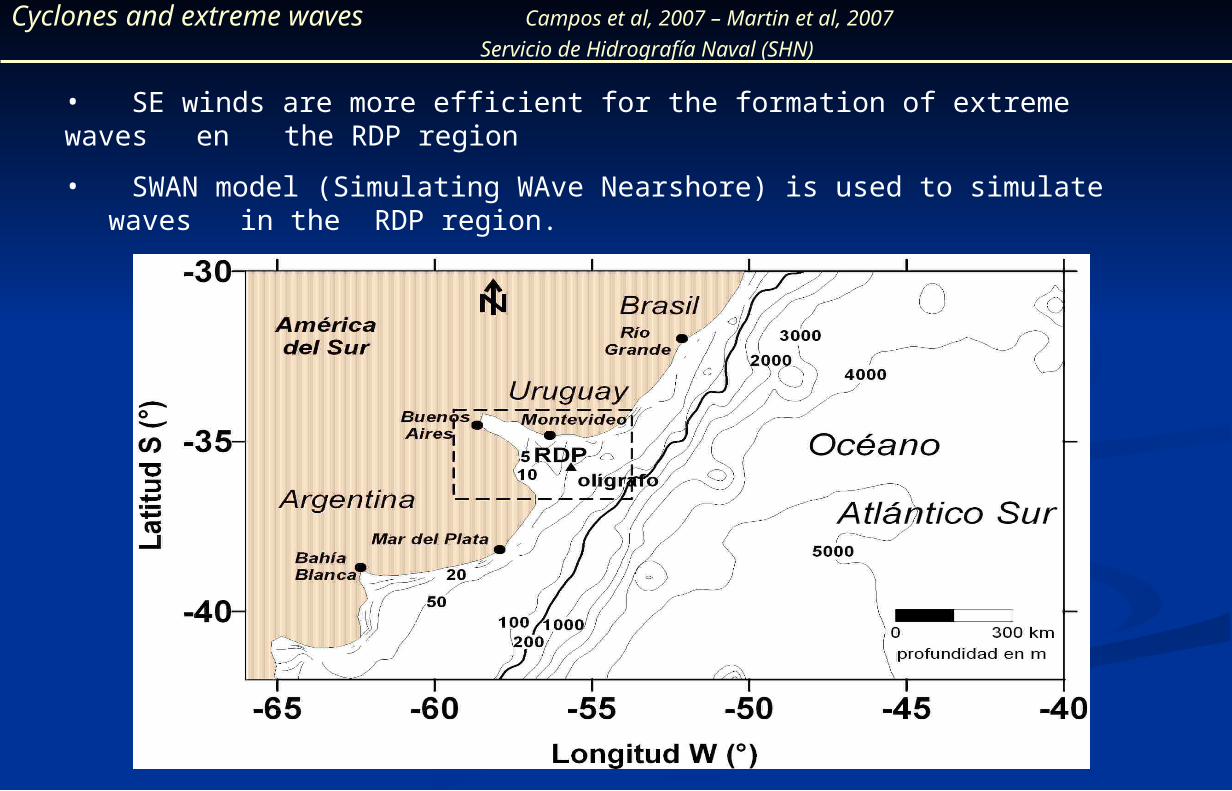
• SE winds are more efficient for the formation of extreme waves en the RDP region
• SWAN model (Simulating WAve Nearshore) is used to simulate waves in the RDP region.
Cyclones and extreme waves Campos et al, 2007 – Martin et al, 2007
Servicio de Hidrografía Naval (SHN)
Cyclones and extreme waves Campos et al, 2007 – Martin et al, 2007
Servicio de Hidrografía Naval (SHN)
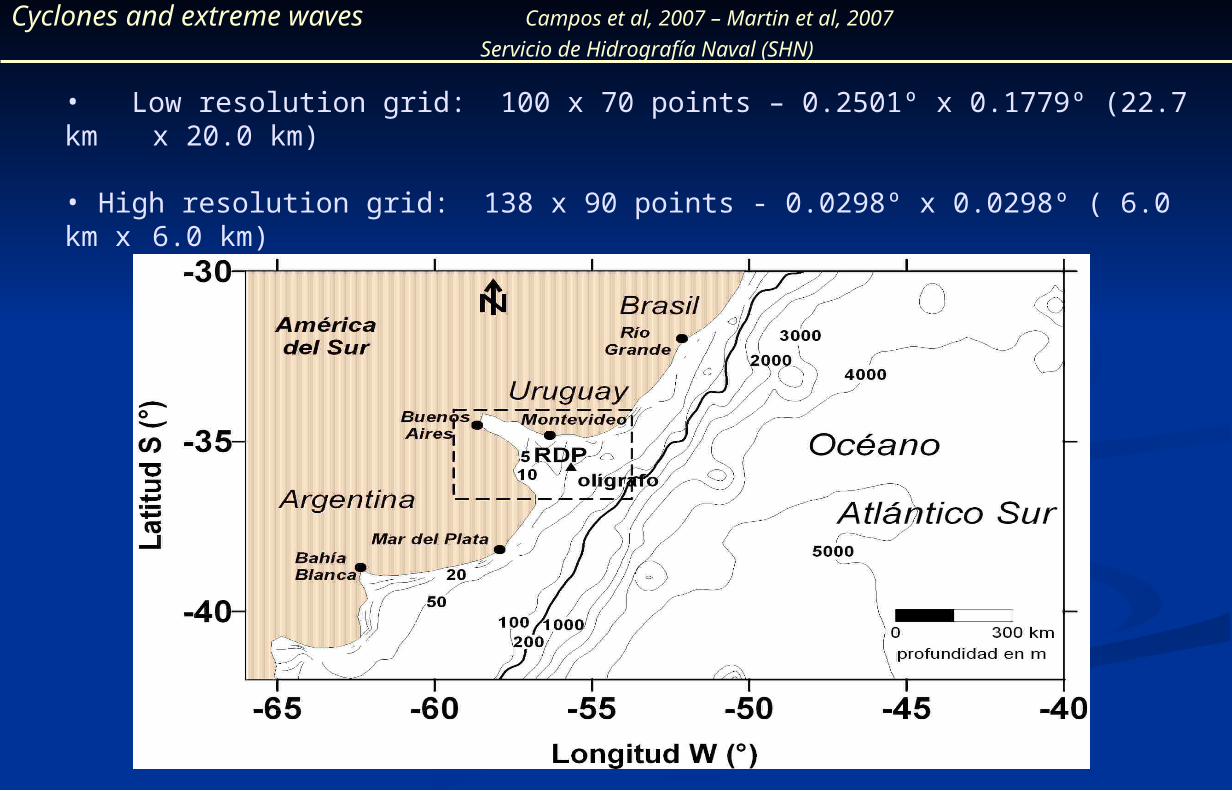
• Low resolution grid: 100 x 70 points – 0.2501º x 0.1779º (22.7 km x 20.0 km)
• High resolution grid: 138 x 90 points - 0.0298º x 0.0298º ( 6.0 km x 6.0 km)
Cyclones and extreme waves Campos et al, 2007 – Martin et al, 2007
Servicio de Hidrografía Naval (SHN)
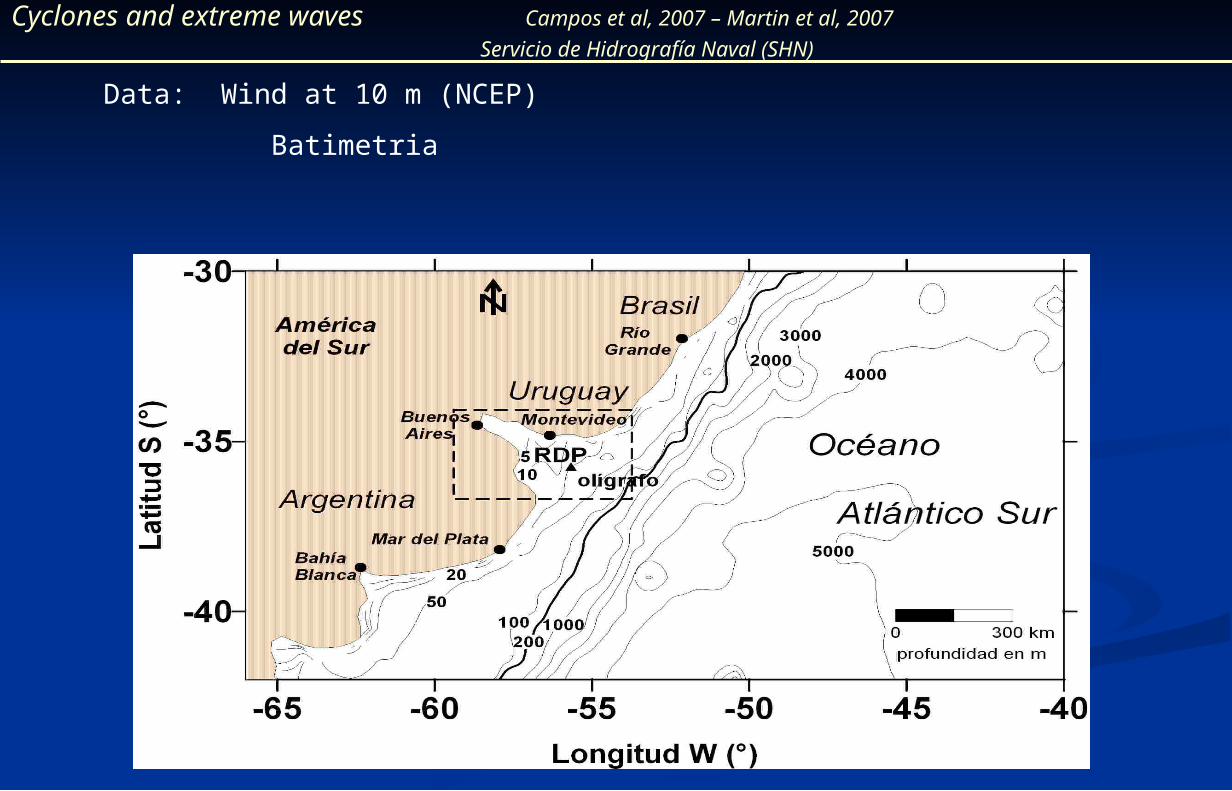
Data: Wind at 10 m (NCEP)
Batimetria
Cyclones and extreme waves Campos et al, 2007 – Martin et al, 2007
Servicio de Hidrografía Naval (SHN)
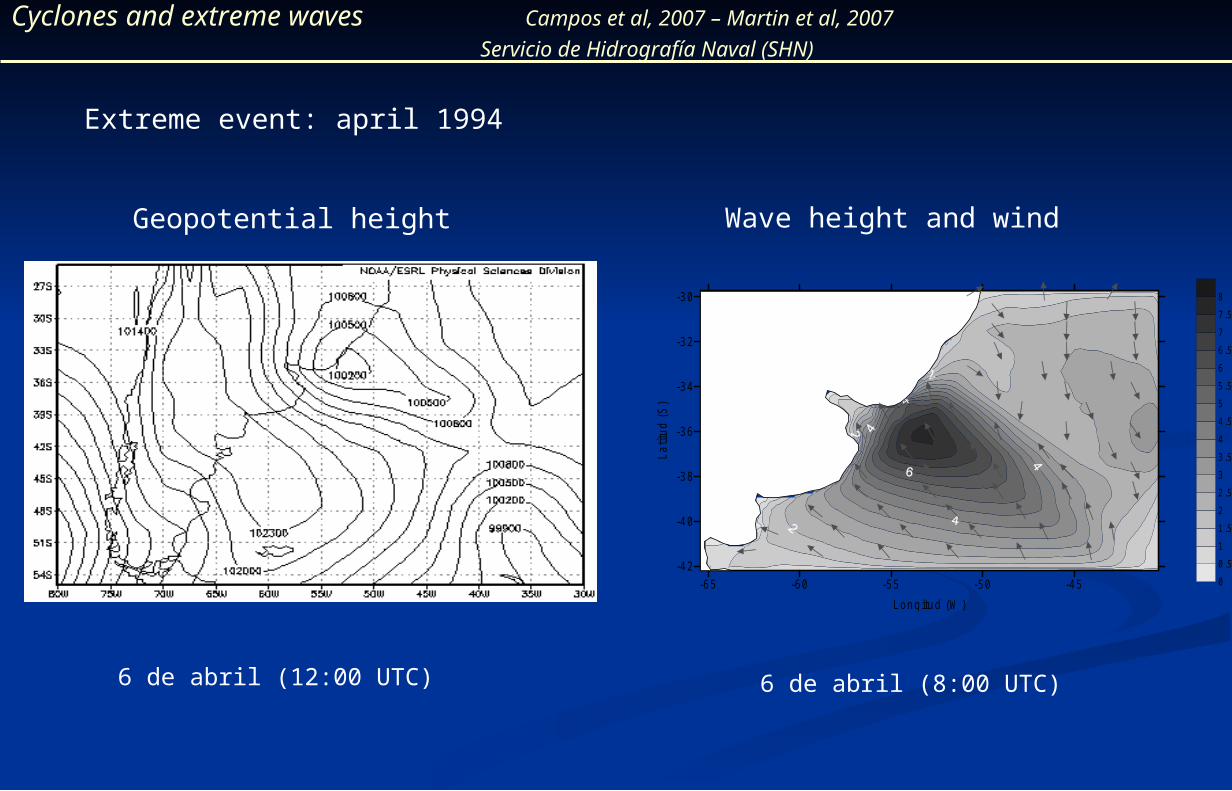
Extreme event: april 1994
Geopotential height
6 de abril (12:00 UTC)
-65 -60 -55 -50 -45
Longitud (W )
-42
-40
-38
-36
-34
-32
-30
Latit
ud (
S)
0
0.5
1
1.5
2
2.5
3
3.5
4
4.5
5
5.5
6
6.5
7
7.5
8
6 de abril (8:00 UTC)
Wave height and wind
Cyclones and extreme waves Campos et al, 2007 – Martin et al, 2007
Servicio de Hidrografía Naval (SHN)
-65 -60 -55 -50 -45
Longitud (W )
-42
-40
-38
-36
-34
-32
-30
Lat
itud
(S
)
0
0.5
1
1.5
2
2.5
3
3.5
4
4.5
5
5.5
6
6.5
7
7.5
8
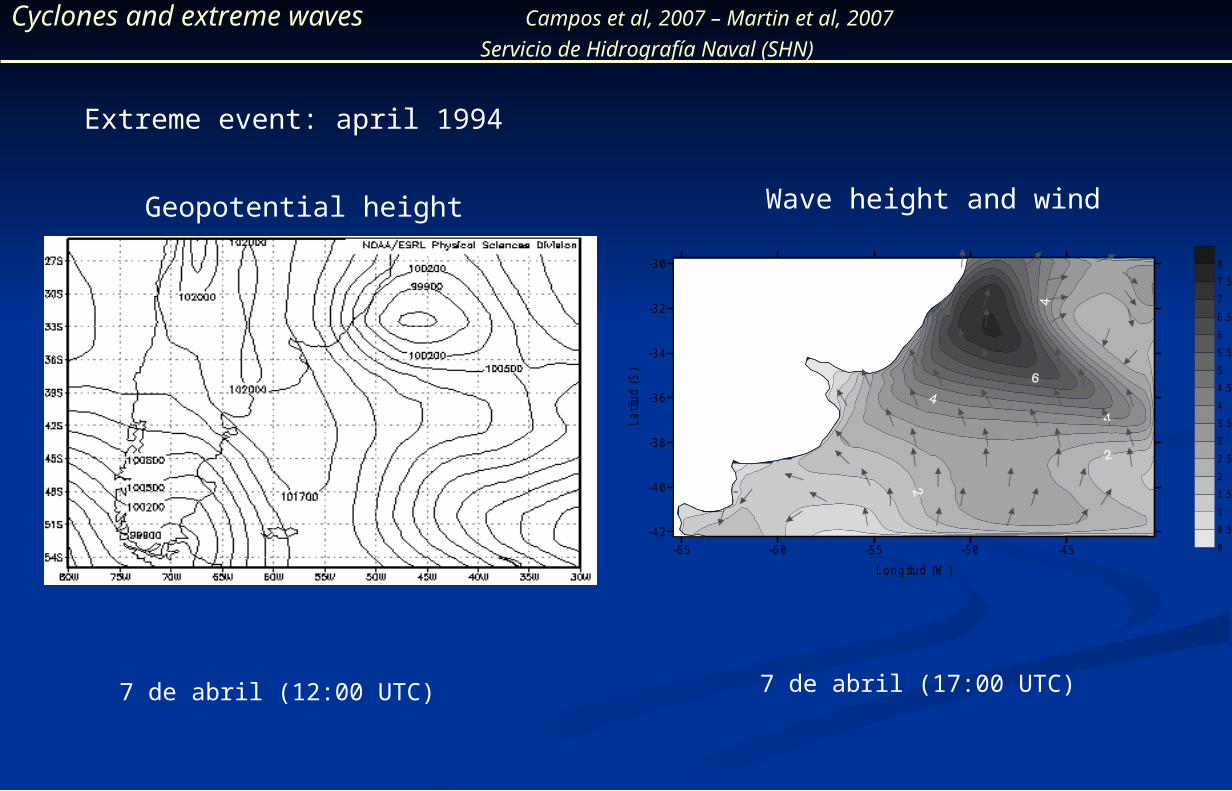
Extreme event: april 1994
7 de abril (12:00 UTC) 7 de abril (17:00 UTC)
Wave height and windGeopotential height
Cyclones and extreme waves Campos et al, 2007 – Martin et al, 2007
Servicio de Hidrografía Naval (SHN)
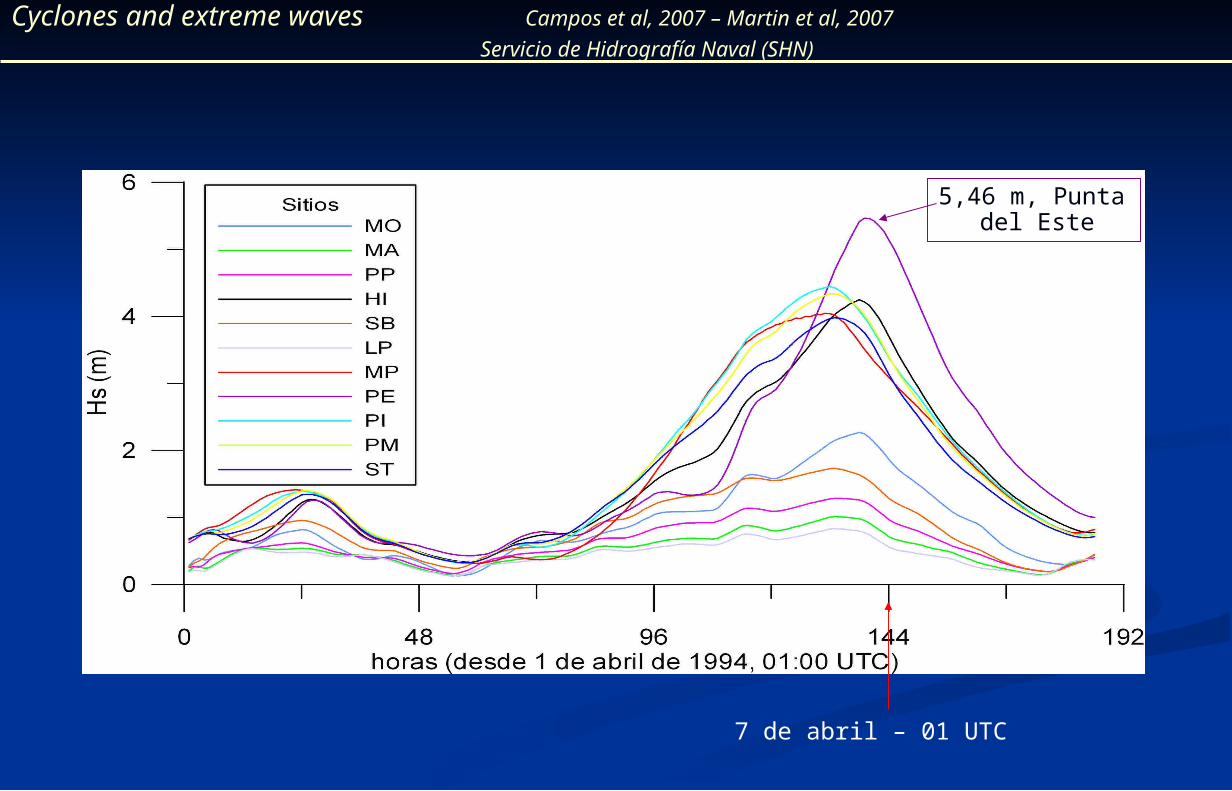
7 de abril – 01 UTC
5,46 m, Punta del Este
Cyclones and extreme waves Campos et al, 2007 – Martin et al, 2007
Servicio de Hidrografía Naval (SHN)
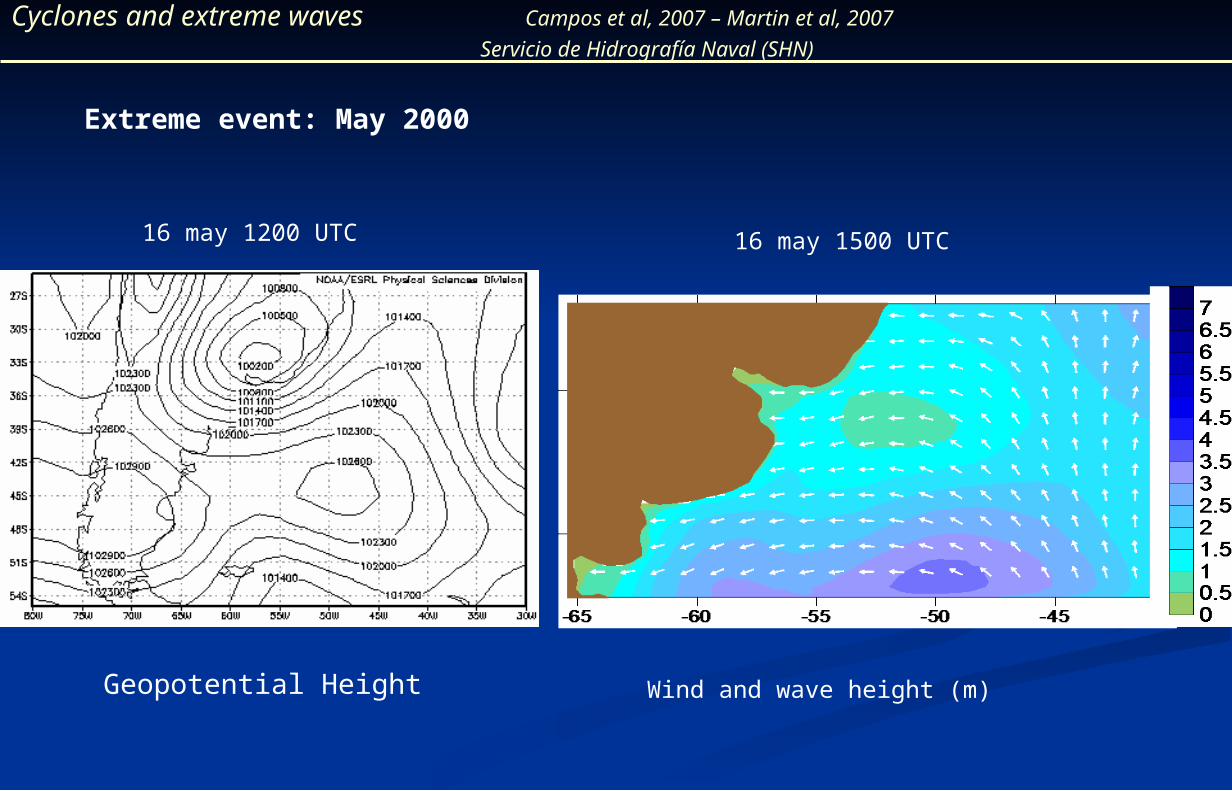
Extreme event: May 2000
Wind and wave height (m)
16 may 1500 UTC16 may 1200 UTC
Geopotential Height
Cyclones and extreme waves Campos et al, 2007 – Martin et al, 2007
Servicio de Hidrografía Naval (SHN)
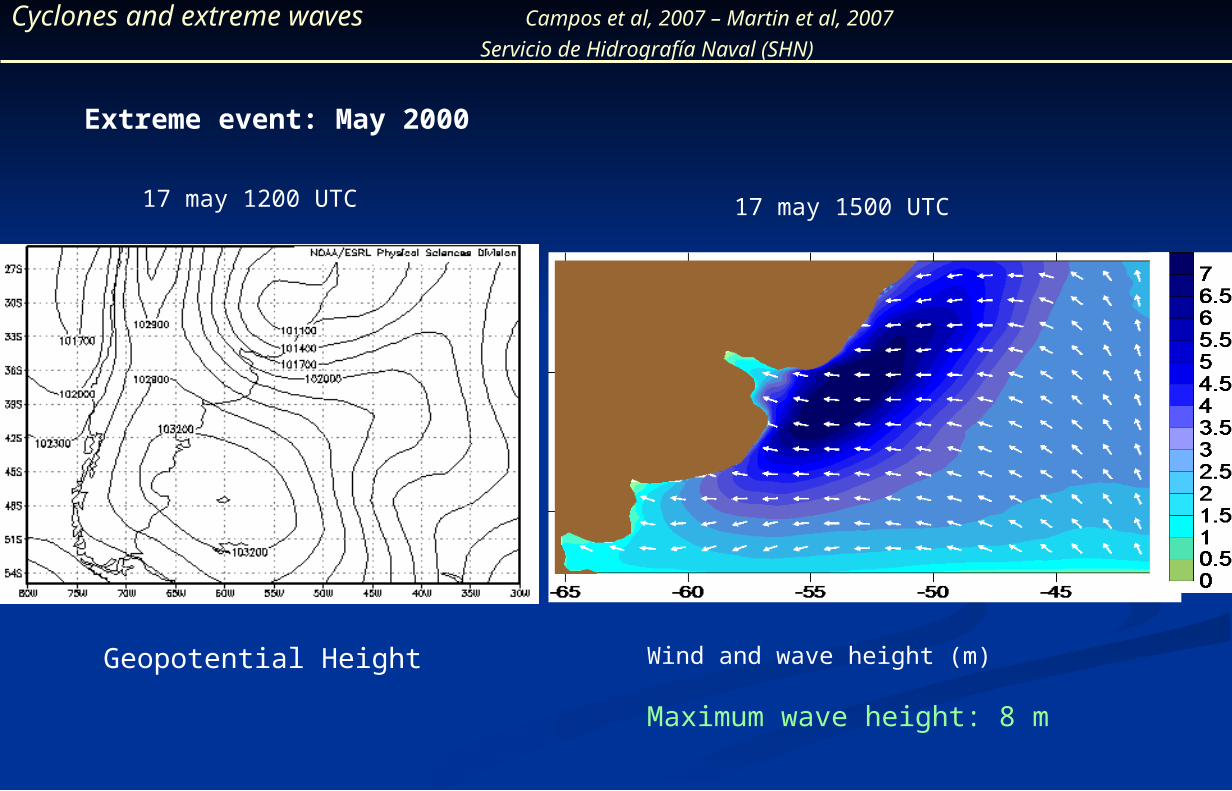
Wind and wave height (m)
17 may 1500 UTC17 may 1200 UTC
Maximum wave height: 8 m
Geopotential Height
Extreme event: May 2000
Cyclones and extreme waves Campos et al, 2007 – Martin et al, 2007
Servicio de Hidrografía Naval (SHN)
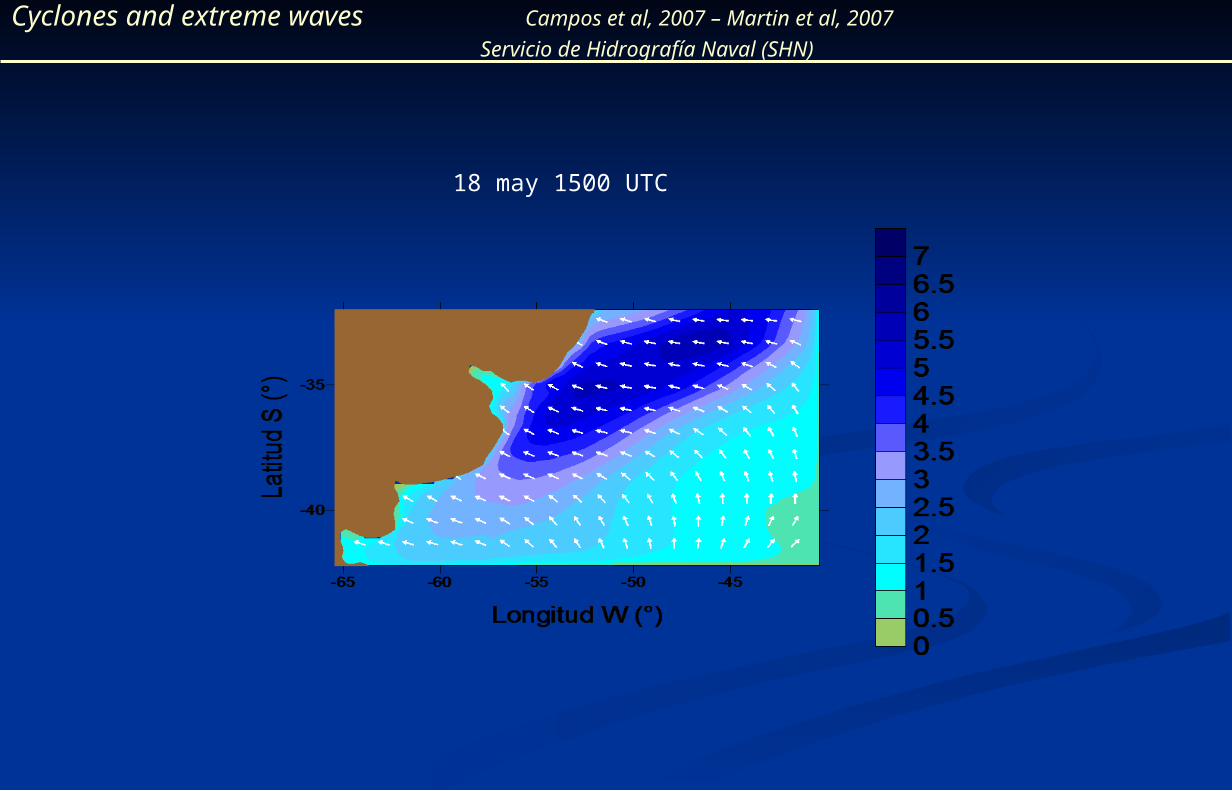
18 may 1500 UTC
Cyclones and extreme waves Campos et al, 2007 – Martin et al, 2007
Servicio de Hidrografía Naval (SHN)
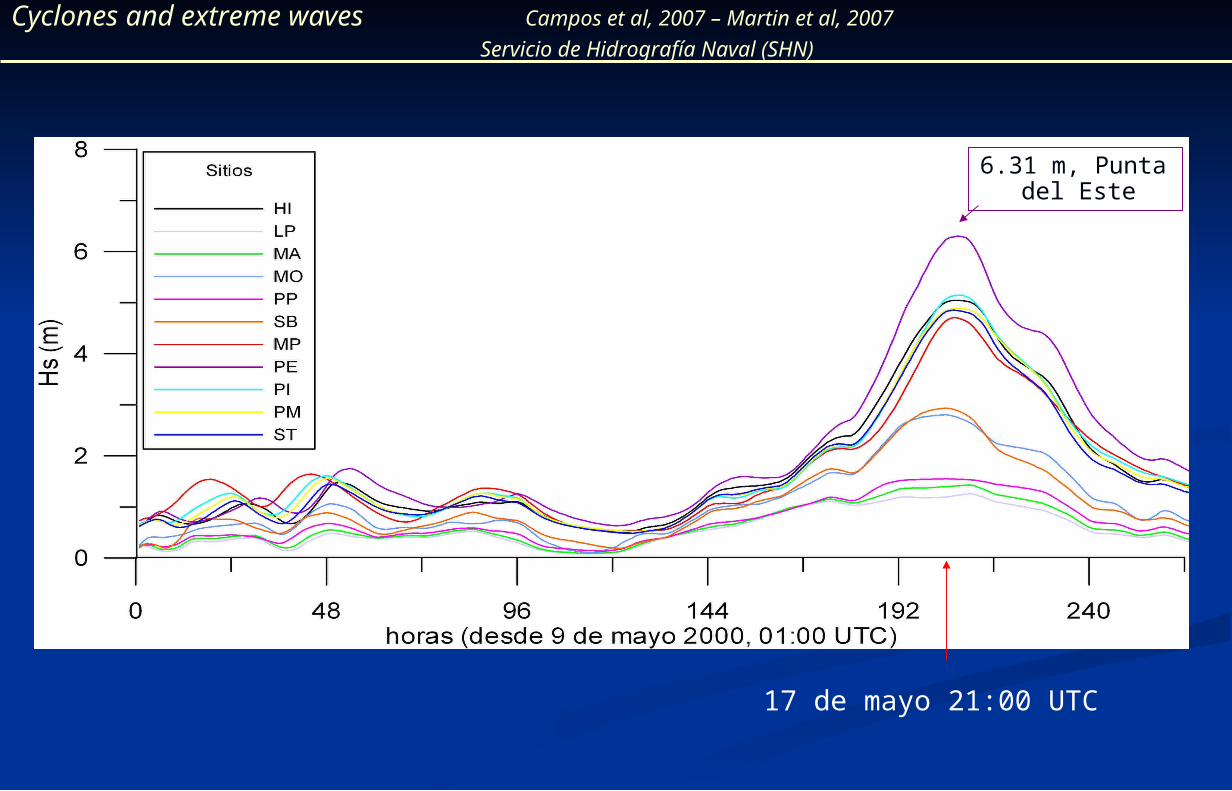
6.31 m, Punta del Este
17 de mayo 21:00 UTC
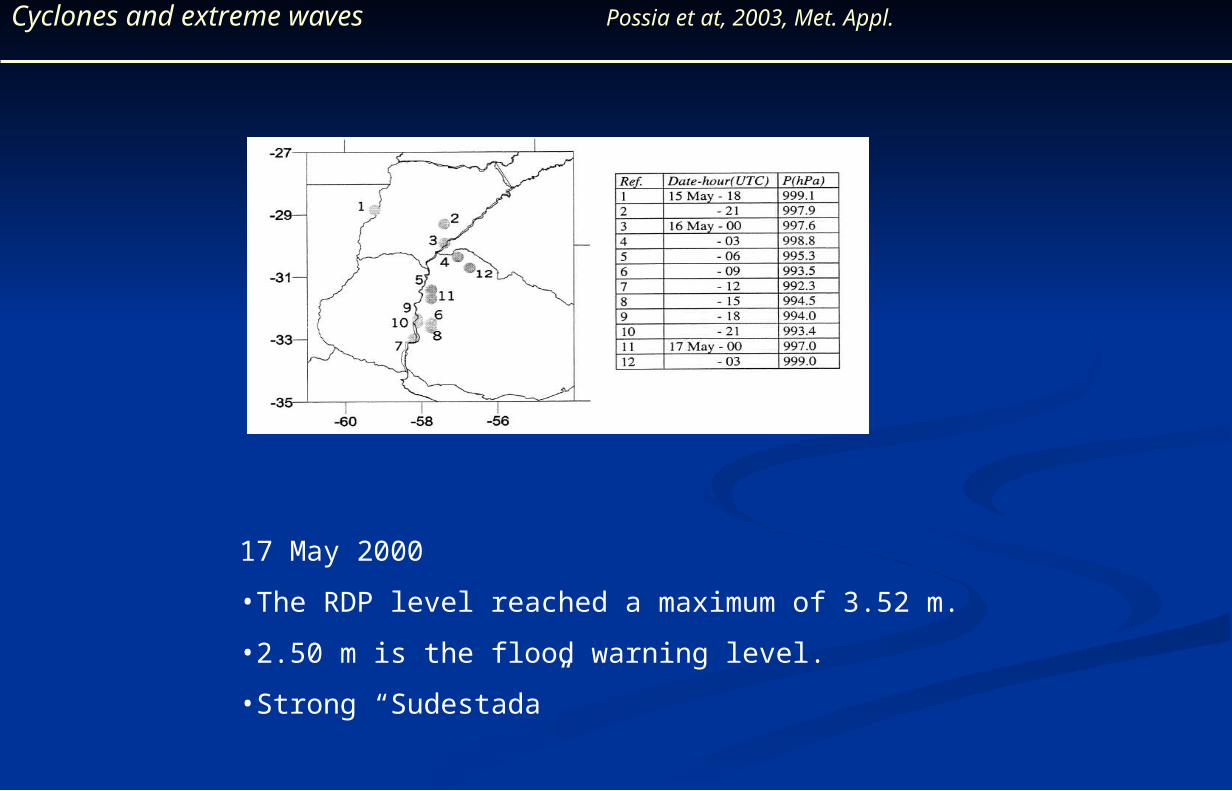
Cyclones and extreme waves Possia et at, 2003, Met. Appl.
17 May 2000
•The RDP level reached a maximum of 3.52 m.
•2.50 m is the flood warning level.
•Strong “Sudestada”
SummarySummary
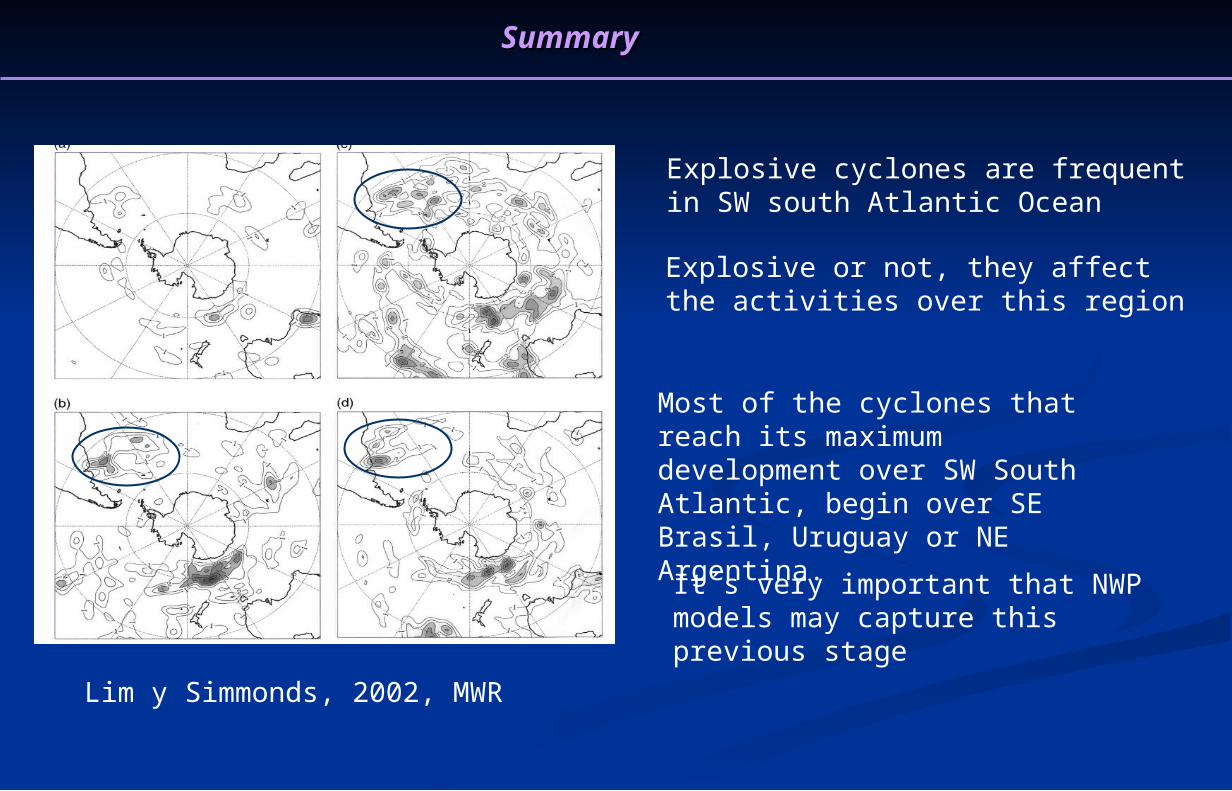
Lim y Simmonds, 2002, MWR
Explosive cyclones are frequent in SW south Atlantic Ocean
Explosive or not, they affect the activities over this region
Most of the cyclones that reach its maximum development over SW South Atlantic, begin over SE Brasil, Uruguay or NE Argentina.
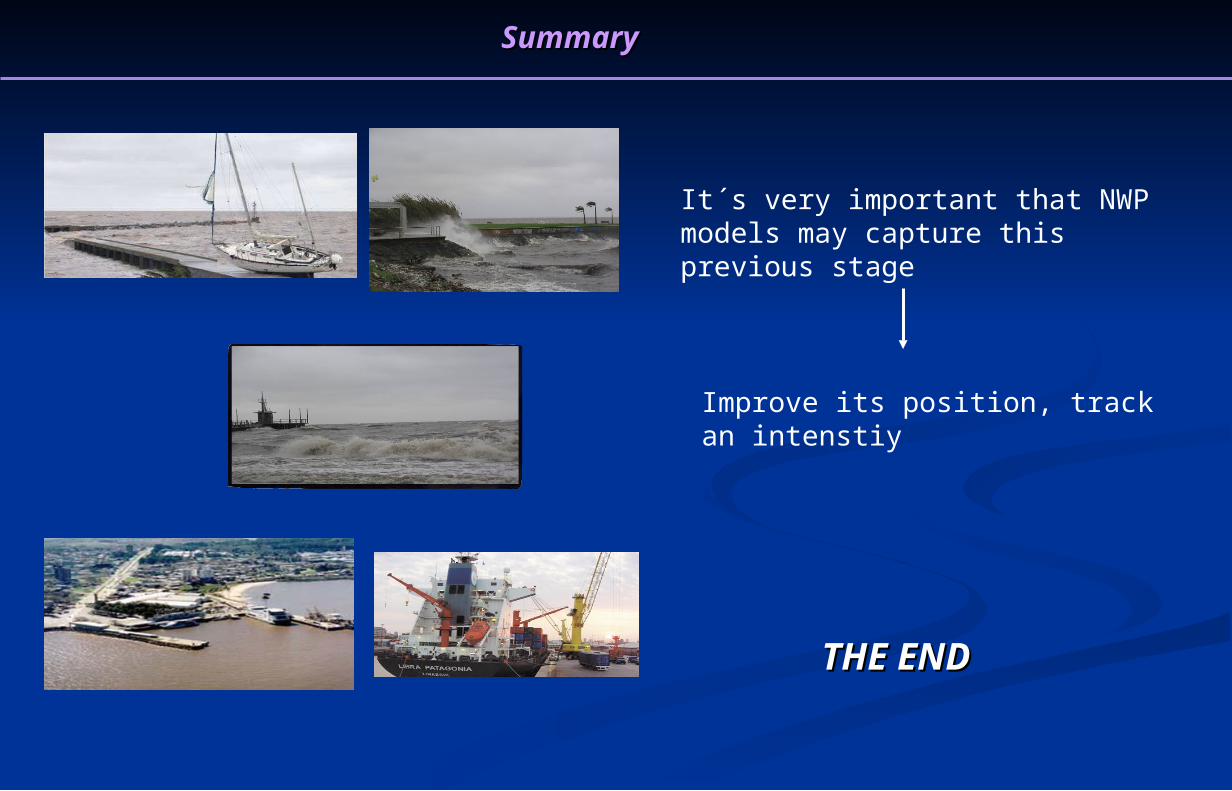
It´s very important that NWP models may capture this previous stage
SummarySummary
THE ENDTHE END
Improve its position, track an intenstiy
It´s very important that NWP models may capture this previous stage