Embed Size (px)
Citation preview
IMPACT OF SUPERCONDUCTING DEVICES ON IMAGING IN NEUROSCIENCE
Gian Luca Romani
Institute for Advanced Biomedical Technologies (ITAB), and Department of Neuroscience and Imaging
University “G. D’Annunzio” of Chieti
“EUCAS 2013”
Genova, September 15-19, 2013 1
IEEE/CSC & ESAS SUPERCONDUCTIVITY NEWS FORUM (global edition), No. 27, January 2014;
Plenary presentation 2PL02 at EUCAS 2013

Outline • Forty years of magnetoencephalography
– the origins – early years
• MEG as a functional imaging technique – physiological basis – modelling
• Basics of instrumentation – detectors – large scale systems – hybrid systems
• Multimodal integration with fMRI – respective advantages and limitations
• MEG contribution to basic and clinical neuroscience – source identification – hierarchic organization (picture naming)
• Functional connectivity 2
IEEE/CSC & ESAS SUPERCONDUCTIVITY NEWS FORUM (global edition), No. 27, January 2014;
Plenary presentation 2PL02 at EUCAS 2013
Outline • Forty years of magnetoencephalography
– the origins – early years
• MEG as a functional imaging technique – physiological basis – modelling
• Basics of instrumentation – detectors – large scale systems – hybrid systems
• Multimodal integration with fMRI – respective advantages and limitations
• MEG contribution to basic and clinical neuroscience – source identification – hierarchic organization (picture naming)
• Functional connectivity 3
IEEE/CSC & ESAS SUPERCONDUCTIVITY NEWS FORUM (global edition), No. 27, January 2014;
Plenary presentation 2PL02 at EUCAS 2013

Late XVIII century
Luigi Galvani and his experiments on “animal electricity”…….
4
IEEE/CSC & ESAS SUPERCONDUCTIVITY NEWS FORUM (global edition), No. 27, January 2014;
Plenary presentation 2PL02 at EUCAS 2013

The origins • As a consequence of Galvani experiments on
animal electricity, also the existence of an animal magnetism was hypothesised by F. A. Mesmer, who tried to associate “mysterious” magnetic fields with a deep influence on human behaviour
• Mesmer theories were examined by a committee of scientists - including Benjamin Franklin - nominated by King Louis XVI, and were declared totally absurd. Nevertheless, mesmerism continued to widespread across Europe and to be practiced in the so-called Mesmer “saloons” for at least other 50 years
• Only when the deep connections existing between electric currents and magnetic fields were fully understood mesmerism definitively disappeared
5 IEEE/CSC & ESAS SUPERCONDUCTIVITY NEWS FORUM (global edition), No. 27, January 2014;
Plenary presentation 2PL02 at EUCAS 2013

At the beginning of the XX century electric signals associated with cardiac and cerebral activity were recorded for the first time: – electrocardiogram (ECG) - (Einthoven, 1903) – electroencephalogram (EEG) - (Berger, 1929)
However, it was only at the beginning of the sixties that the magnetic signals associated with cardiac currents were first detected, namely the magnetocardiogram (MCG) (resistive coils, Baule&McFee, 1963)
The origins (II)
Finally, a MCG was measured for the first time using the rfSQUID developed by Jim Zimmerman by Edelsack, Cohen, and Zimmerman at MIT (Cohen et al., Science 1970)
6
IEEE/CSC & ESAS SUPERCONDUCTIVITY NEWS FORUM (global edition), No. 27, January 2014;
Plenary presentation 2PL02 at EUCAS 2013

In 1971 David Cohen measured the spontaneous alpha rhythm using a SQUID, and the expression magnetoencephalography (MEG) was introduced
Cohen, Science 1972
The magnetic field due to electric currents flowing inside the brain was first recorded in 1968 by David Cohen using resistive coils
Cohen, Science 1968
eyes open eyes closed The origins (III)
7
IEEE/CSC & ESAS SUPERCONDUCTIVITY NEWS FORUM (global edition), No. 27, January 2014;
Plenary presentation 2PL02 at EUCAS 2013

Outline • Forty years of magnetoencephalography
– the origins – early years
• MEG as a functional imaging technique – physiological basis – modelling
• Basics of instrumentation – detectors – large scale systems – hybrid systems
• Multimodal integration with fMRI – respective advantages and limitations
• MEG contribution to basic and clinical neuroscience – source identification – hierarchic organization (picture naming)
• Functional connectivity 8
IEEE/CSC & ESAS SUPERCONDUCTIVITY NEWS FORUM (global edition), No. 27, January 2014;
Plenary presentation 2PL02 at EUCAS 2013

Magnetoencephalography: Physiological basis MEG measures magnetic fields generated by the bioelectric activity of excitable cells in the brain (neurons)
9
IEEE/CSC & ESAS SUPERCONDUCTIVITY NEWS FORUM (global edition), No. 27, January 2014;
Plenary presentation 2PL02 at EUCAS 2013
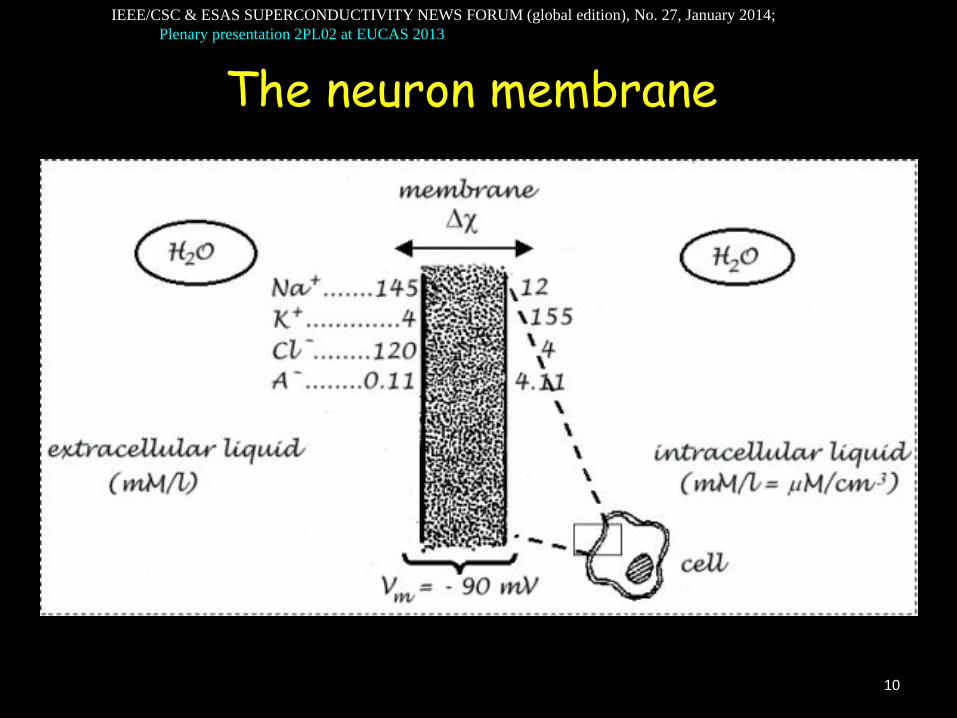
The neuron membrane
10
IEEE/CSC & ESAS SUPERCONDUCTIVITY NEWS FORUM (global edition), No. 27, January 2014;
Plenary presentation 2PL02 at EUCAS 2013
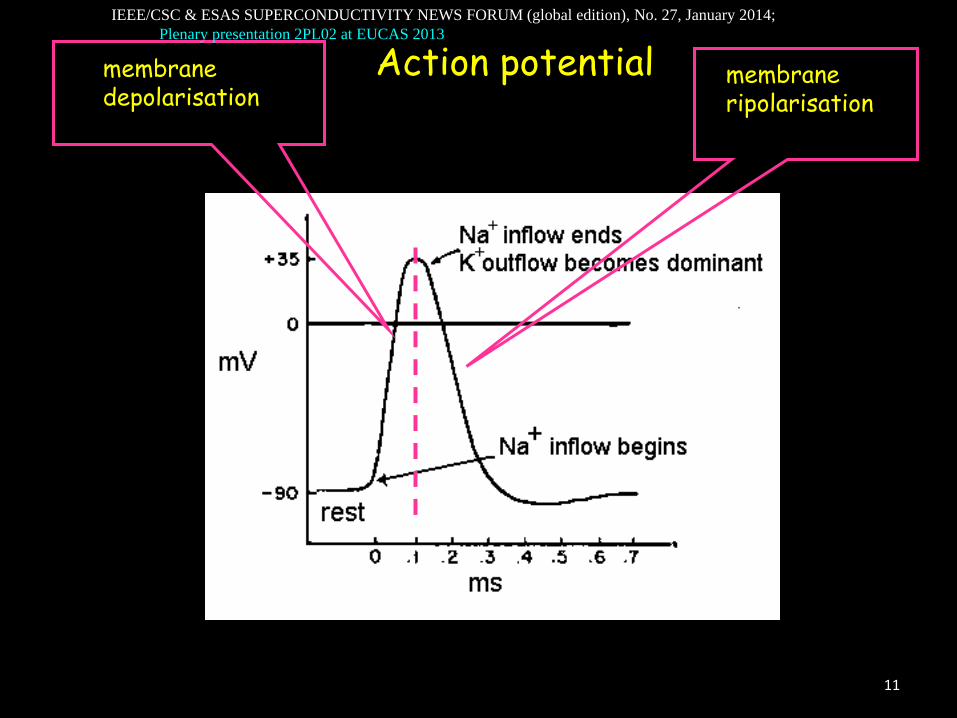
membrane depolarisation
membrane ripolarisation
Action potential
11
IEEE/CSC & ESAS SUPERCONDUCTIVITY NEWS FORUM (global edition), No. 27, January 2014;
Plenary presentation 2PL02 at EUCAS 2013

Schematic of the current pattern associated with membrane depolarisation
• The synaptic activity induces an intra-cellular current toward the nucleus of the neuron
• At the same time a return current flows in the extra-cellular space (charge conservation)
12 IEEE/CSC & ESAS SUPERCONDUCTIVITY NEWS FORUM (global edition), No. 27, January 2014;
Plenary presentation 2PL02 at EUCAS 2013

The simplest model: the current dipole
Q = i L Units: Am (ampère meter)
To complete the modeling we need to put the current dipole inside a conducting medium with appropriate geometry
13 IEEE/CSC & ESAS SUPERCONDUCTIVITY NEWS FORUM (global edition), No. 27, January 2014;
Plenary presentation 2PL02 at EUCAS 2013
Field of a single neuron • In an infinite, homogeneously conducting medium
• Typical value for an apical dendrite of a pyramidal cell: • Q ~ 2 10-13 A.m
(Murakami and Okada, J Physiol 2006)
• In the most favorable position B = 0Q / 4R2 where R is the distance from the dipole, with Q = 2 × 10-13 A.m and
R = 4 cm, a typical sensor distance, B ~ 1 × 10-17 T = 0.01 fT • In comparison the typical amplitude of evoked magnetic fields
is about 200-400 fT MEG monitors the coherent activity of a large population of neurons (about 50,000) and this is possible since the apical dendrites of pyramidal neurons are mostly aligned parallel to the cerebral cortex and often feature a synchronous activation. In this sense we speak of an Equivalent Current Dipole (ECD) that accounts for the measured magnetic field distribution
0 ( r – r0 ) B (r) = Q 4 r – r0
3 (Biot-Savart law)
14
IEEE/CSC & ESAS SUPERCONDUCTIVITY NEWS FORUM (global edition), No. 27, January 2014;
Plenary presentation 2PL02 at EUCAS 2013

Current dipole in a homogeneously conducting sphere
• The simplest and most convenient approach
but • tends to oversimplify the
problem in some regions of the head
• a dipole radially oriented with respect to the sphere produces no measurable field
• distributed current models associated with a linear inverse estimation inside a realistic head model provide more accurate results
detectable magnetic field
undetectable magnetic field
15
IEEE/CSC & ESAS SUPERCONDUCTIVITY NEWS FORUM (global edition), No. 27, January 2014;
Plenary presentation 2PL02 at EUCAS 2013

Outline • Forty years of magnetoencephalography
– the origins – early years
• MEG as a functional imaging technique – physiological basis – modelling
• Basics of instrumentation – detectors – large scale systems – hybrid systems
• Multimodal integration with fMRI – respective advantages and limitations
• MEG contribution to basic and clinical neuroscience – source identification – hierarchic organization (picture naming)
• Functional connectivity 16
IEEE/CSC & ESAS SUPERCONDUCTIVITY NEWS FORUM (global edition), No. 27, January 2014;
Plenary presentation 2PL02 at EUCAS 2013
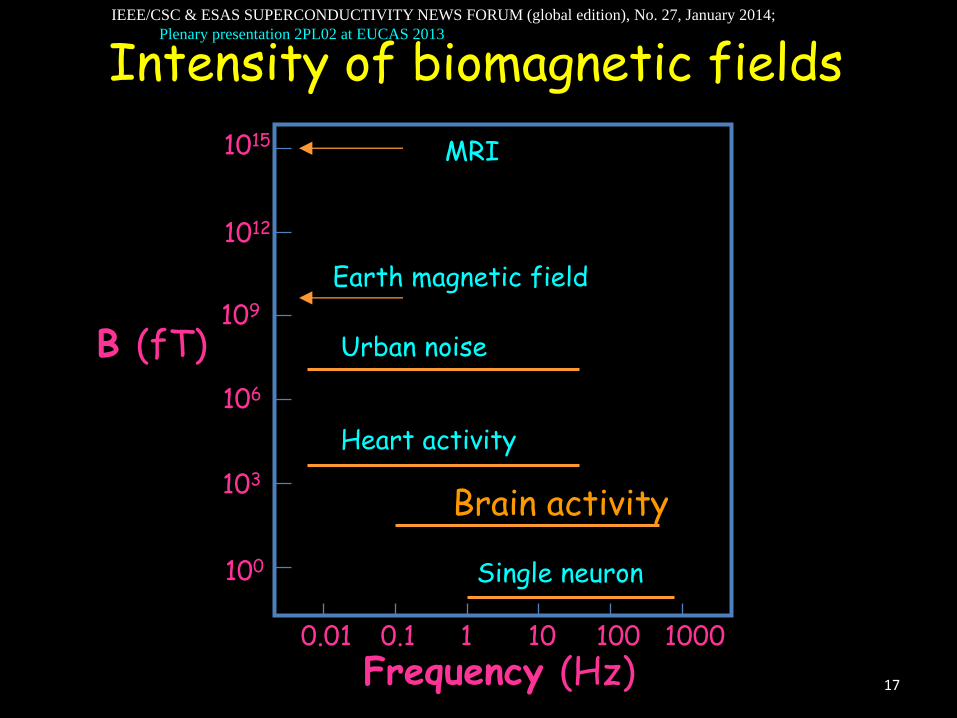
Intensity of biomagnetic fields
Frequency (Hz)
B (fT)
0.01 0.1 1 10 100 1000
100
MRI
Earth magnetic field
Urban noise
Brain activity
Heart activity
Single neuron
103
106
1012
109
1015
17
IEEE/CSC & ESAS SUPERCONDUCTIVITY NEWS FORUM (global edition), No. 27, January 2014;
Plenary presentation 2PL02 at EUCAS 2013

Very weak signals in a noisy background • Extremely sensitive detectors: Superconducting
Quantum Interference Devices (SQUIDs) – operated at 4.2 K - to be integrated in multichannel systems – sensitivity of about 10-15 T/Hz
•Thermal noise of the subject 10-16 T/Hz • Brain noise 10-14 T/Hz (DC-1000 Hz)
– Low crosstalk 1%
• Cryogenics – Cryostat noise 10-15 T/Hz
• Noise reduction techniques (hardware and software gradiometers, magnetically shielded rooms) – It must be able to operate in unfriendly environments
(hospital).
Instrumentation challenges
18
IEEE/CSC & ESAS SUPERCONDUCTIVITY NEWS FORUM (global edition), No. 27, January 2014;
Plenary presentation 2PL02 at EUCAS 2013
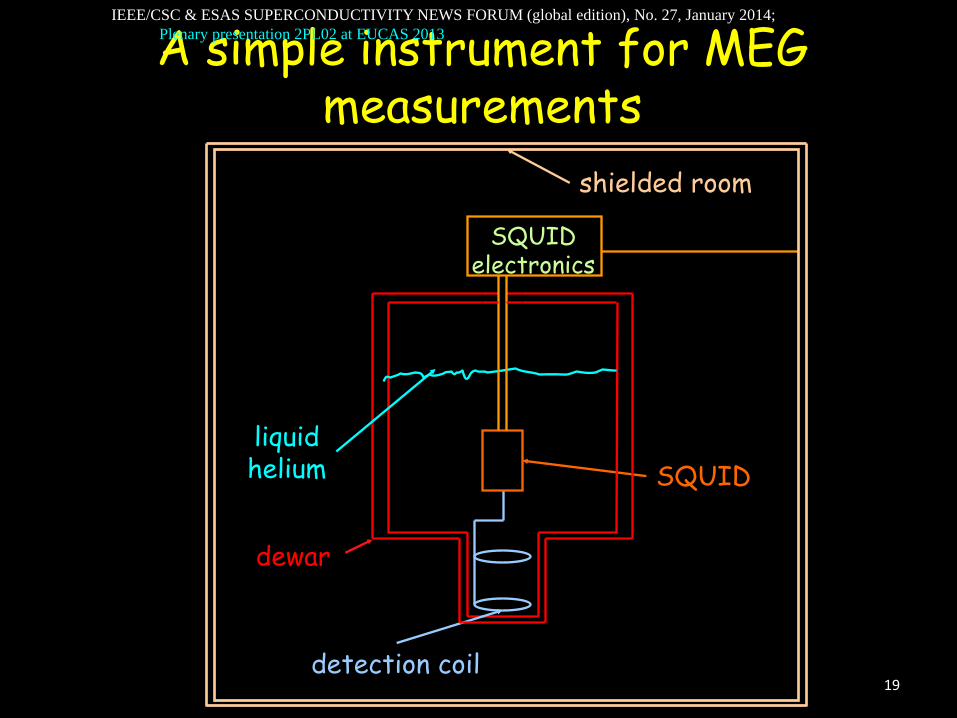
A simple instrument for MEG measurements
SQUID electronics
detection coil
SQUID
dewar
liquid helium
shielded room
19
IEEE/CSC & ESAS SUPERCONDUCTIVITY NEWS FORUM (global edition), No. 27, January 2014;
Plenary presentation 2PL02 at EUCAS 2013

Dewars for biomagnetism
the distance of the detection coil from the head should be as small as possible (less than 20 mm)
the noise of the dewar should be smaller than the noise of the sensors (less than 1 fT/Hz½)
liquid helium reservoir should last as long as possible
The dewar used in biomagnetic instruments must satisfy severe requirements:
Usually fiberglass is used to build the dewar. Fiberglass has excellent magnetic properties but does not provide any shield against radiation, therefore radiation shielding and 50-100 layers of mylar are added. The total helium capacity is typically 50-80 liters. Mechanical cryocoolers are cheap, safe, and require moderate maintenance, but the magnetic noise is still too high 20
IEEE/CSC & ESAS SUPERCONDUCTIVITY NEWS FORUM (global edition), No. 27, January 2014;
Plenary presentation 2PL02 at EUCAS 2013

Detection coils Since the SQUID inductance should be as small as possible, the SQUID loop cannot be used to detect the biomagnetic field. Additional use of an external coil of suitable shape is useful to reject environmental noise.
The flux transformer is a superconducting loop and “transfers” the flux to the SQUID loop. To maximize flux transfer (once the SQUID parameters are fixed) Lp must satisfy the matching condition: Lp ≈ Lin
detection coil Lp
SQUID input coil Lin
I M
21
IEEE/CSC & ESAS SUPERCONDUCTIVITY NEWS FORUM (global edition), No. 27, January 2014;
Plenary presentation 2PL02 at EUCAS 2013
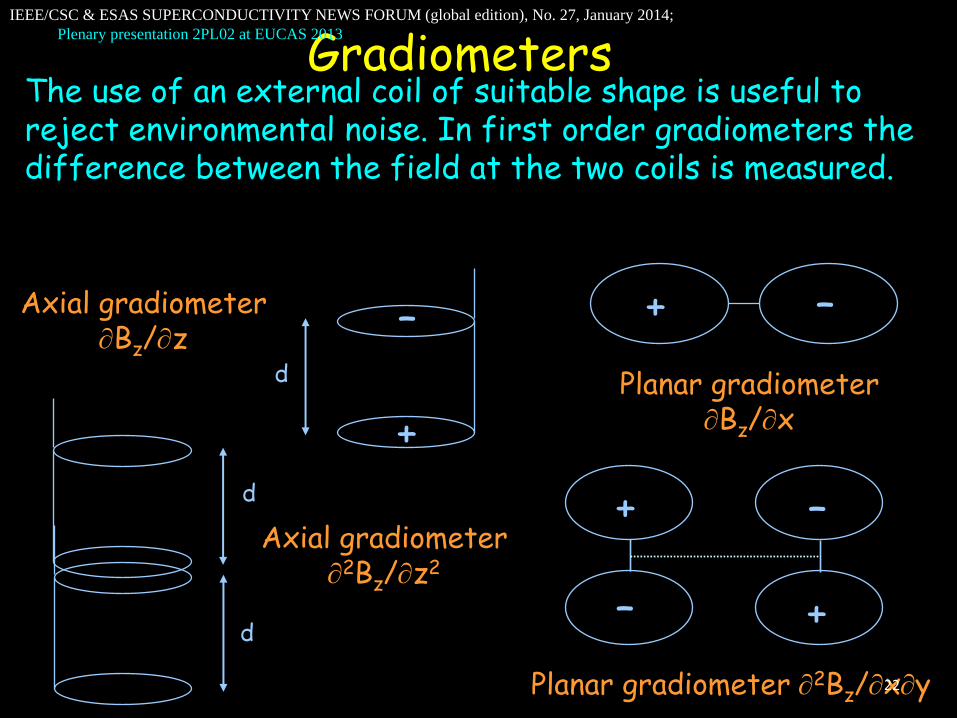
Gradiometers The use of an external coil of suitable shape is useful to reject environmental noise. In first order gradiometers the difference between the field at the two coils is measured.
Axial gradiometer Bz/z
Planar gradiometer Bz/x
+ –
+
– d
+
+
–
–
Planar gradiometer 2Bz/xy
Axial gradiometer 2Bz/z
2
d
d
22
IEEE/CSC & ESAS SUPERCONDUCTIVITY NEWS FORUM (global edition), No. 27, January 2014;
Plenary presentation 2PL02 at EUCAS 2013
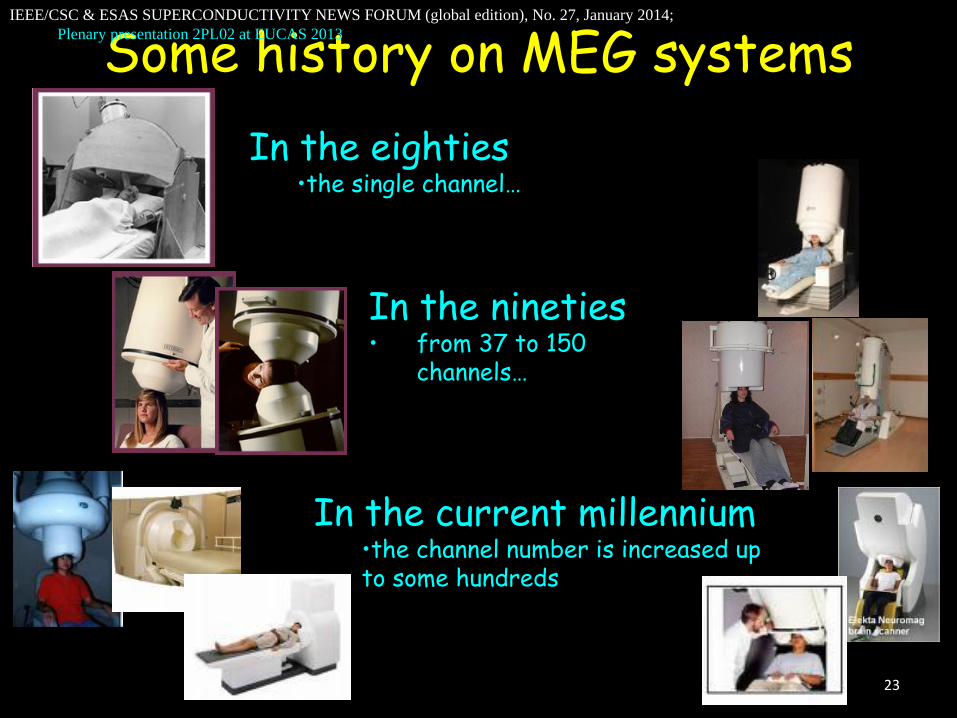
Some history on MEG systems
In the eighties •the single channel…
In the nineties • from 37 to 150
channels…
In the current millennium •the channel number is increased up to some hundreds
23
IEEE/CSC & ESAS SUPERCONDUCTIVITY NEWS FORUM (global edition), No. 27, January 2014;
Plenary presentation 2PL02 at EUCAS 2013

MEG systems
Presently there are almost 200 MEG systems installed worldwide. Several are operating inside clinical environments
• Whole head coverage • 100300 detection points consisting of one to three
channels • Stable and reliable LTcS SQUIDs • Easy and friendly operation • Easy set-up and maintenance • Cost-effective design • Seated and/or supine measurement position
13 installations 9 installations 6 installations
24
IEEE/CSC & ESAS SUPERCONDUCTIVITY NEWS FORUM (global edition), No. 27, January 2014;
Plenary presentation 2PL02 at EUCAS 2013
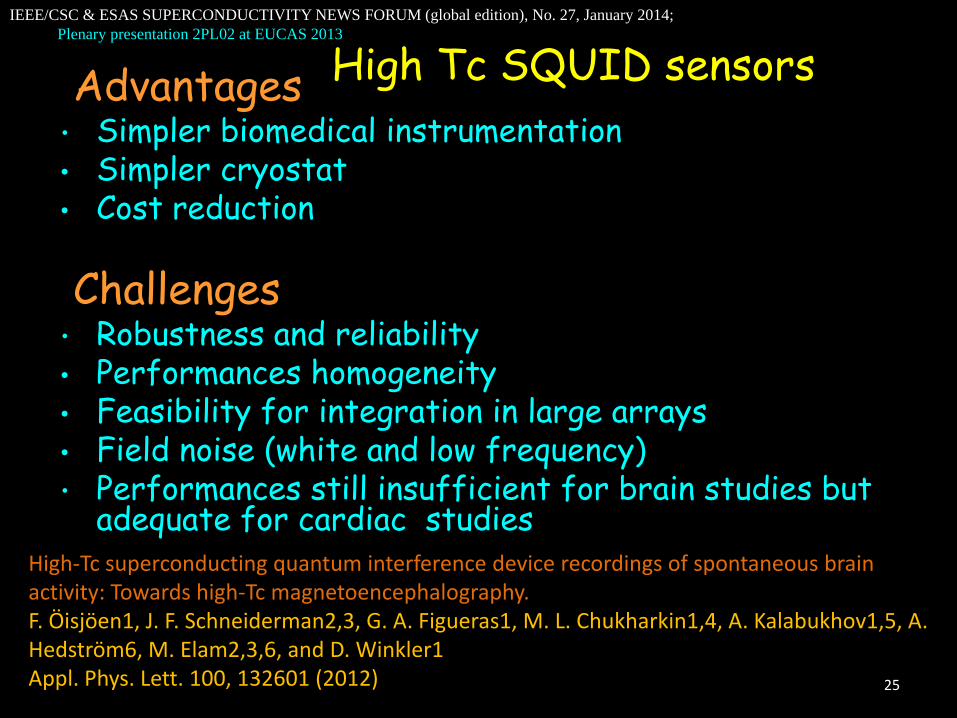
High Tc SQUID sensors Advantages • Simpler biomedical instrumentation • Simpler cryostat • Cost reduction
Challenges • Robustness and reliability • Performances homogeneity • Feasibility for integration in large arrays • Field noise (white and low frequency) • Performances still insufficient for brain studies but
adequate for cardiac studies High-Tc superconducting quantum interference device recordings of spontaneous brain activity: Towards high-Tc magnetoencephalography. F. Öisjöen1, J. F. Schneiderman2,3, G. A. Figueras1, M. L. Chukharkin1,4, A. Kalabukhov1,5, A. Hedström6, M. Elam2,3,6, and D. Winkler1 Appl. Phys. Lett. 100, 132601 (2012) 25
IEEE/CSC & ESAS SUPERCONDUCTIVITY NEWS FORUM (global edition), No. 27, January 2014;
Plenary presentation 2PL02 at EUCAS 2013

Other SQUID-based biomedical instrumentation for brain studies
• ultra-low field MRI • hybrid systems
26
IEEE/CSC & ESAS SUPERCONDUCTIVITY NEWS FORUM (global edition), No. 27, January 2014;
Plenary presentation 2PL02 at EUCAS 2013
Ultra-low field MRI (J. Clarke)
• SQUID-based sensors measure the magnetic field directly, as opposed to its time derivative: then the signal-to-noise ratio (SNR) of the measurement for untuned sensors is independent of the Larmor frequency and thus the field strength after the prepolarization.
• MRI can be performed using a prepolarization pulse in the 10-100mT range, and an operating field B0 in the 10-100 µT range.
• A significant advantage of such a low B0 is that T1 differentiates between normal and cancer tissues for B0 < 1 mT (magnetic biopsy)
27
IEEE/CSC & ESAS SUPERCONDUCTIVITY NEWS FORUM (global edition), No. 27, January 2014;
Plenary presentation 2PL02 at EUCAS 2013
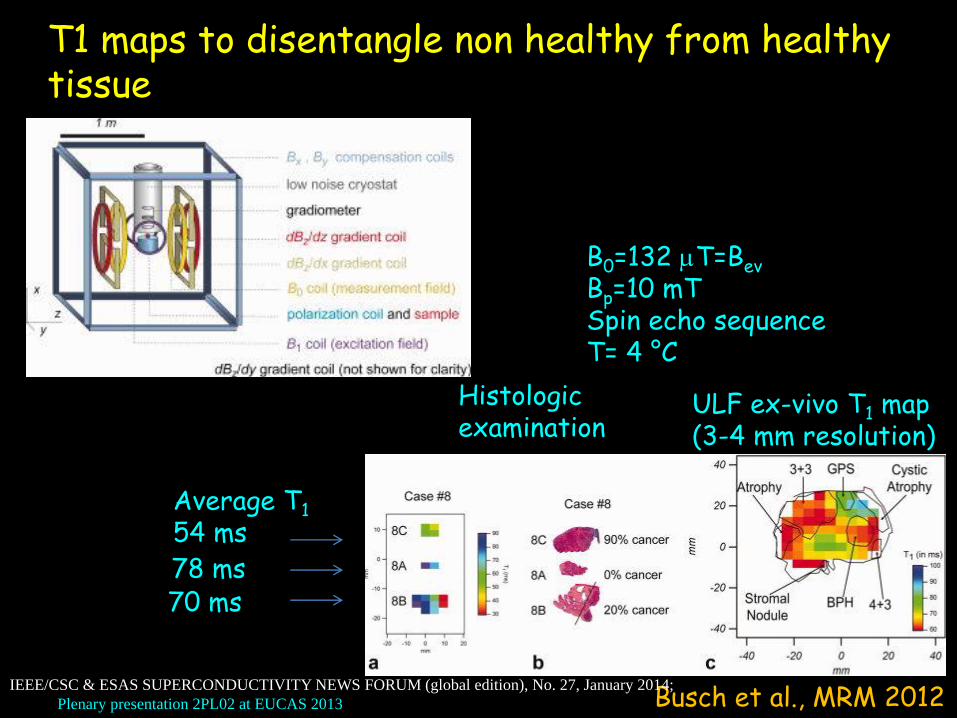
Busch et al., MRM 2012
ULF ex-vivo T1 map (3-4 mm resolution)
Average T1
54 ms 78 ms 70 ms
Histologic examination
B0=132 T=Bev
Bp=10 mT Spin echo sequence T= 4 °C
T1 maps to disentangle non healthy from healthy tissue
IEEE/CSC & ESAS SUPERCONDUCTIVITY NEWS FORUM (global edition), No. 27, January 2014;
Plenary presentation 2PL02 at EUCAS 2013
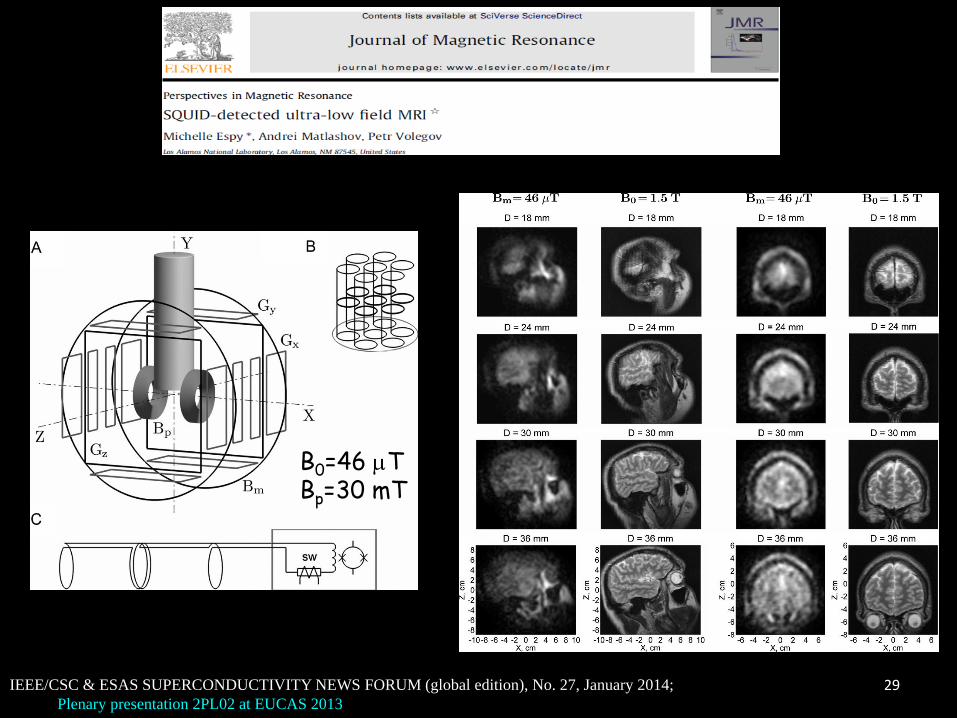
B0=46 T
Bp=30 mT
29 IEEE/CSC & ESAS SUPERCONDUCTIVITY NEWS FORUM (global edition), No. 27, January 2014;
Plenary presentation 2PL02 at EUCAS 2013

1. Helsinki University of Technology - Finland (coordinator)
2. Valtion teknillinen tutkimuskeskus (VTT)- Finland
3. Hospital District of Helsinki and Uusimaa -Finland
4. Elekta AB - Finland
5. Aivon Oy - Finland
6. Commissariat à l’energie atomique - France
7. CEDRAT Technologies SA – France
8. Chalmers Tekniska Hoegskola Aktiebolag – Sweden
9. PTB – Germany
10. University of Parma – Italy
11. ITAB – Unversity of Chieti - Italy
12. Associazione Fatebenefratelli per la Ricerca (AFaR)- Italy
13. Imaging Technology Abruzzo – Italy
EU-FP7 MEGMRI Project (2009-2012) Mission of the project: development of a hybrid system for simultaneous ultra-low field MRI and MEG recordings in humans
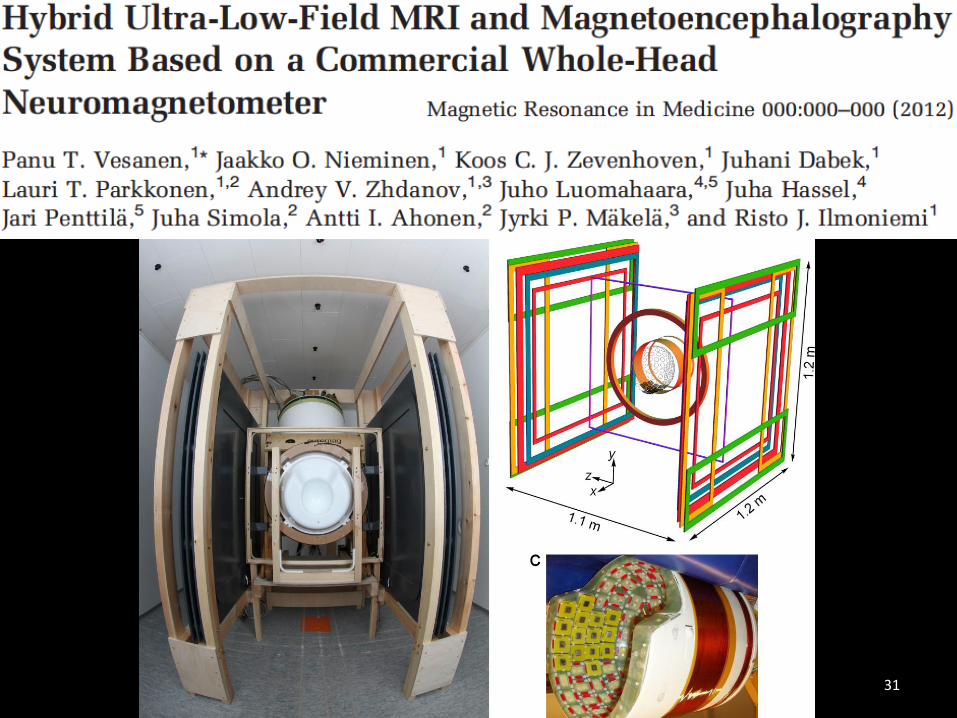
RESULTS
31
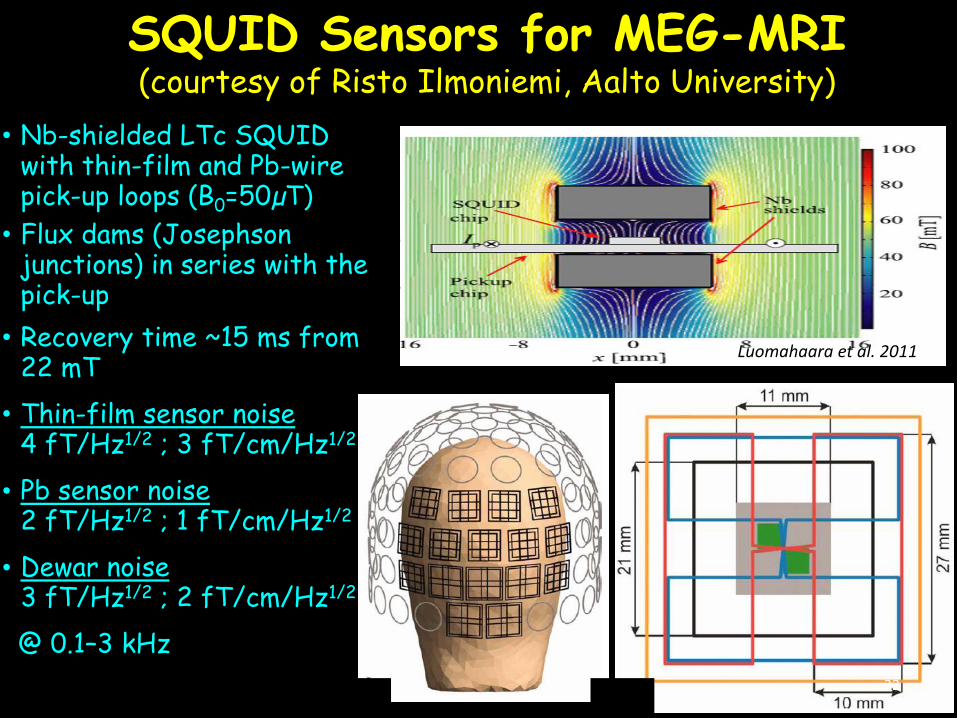
Luomahaara et al. 2011
SQUID Sensors for MEG-MRI (courtesy of Risto Ilmoniemi, Aalto University)
• Nb-shielded LTc SQUID with thin-film and Pb-wire pick-up loops (B0=50µT)
• Flux dams (Josephson junctions) in series with the pick-up
• Recovery time ~15 ms from 22 mT
• Thin-film sensor noise 4 fT/Hz1/2 ; 3 fT/cm/Hz1/2
• Pb sensor noise 2 fT/Hz1/2 ; 1 fT/cm/Hz1/2
• Dewar noise 3 fT/Hz1/2 ; 2 fT/cm/Hz1/2
@ 0.1–3 kHz
32

MRI Prototype vs. Commercial 3-tesla System (courtesy of Risto Ilmoniemi, Aalto University)
Vesanen et al. 2012 33 IEEE/CSC & ESAS SUPERCONDUCTIVITY NEWS FORUM (global edition), No. 27, January 2014;
Plenary presentation 2PL02 at EUCAS 2013

MEG signals obtained with the prototype
34
IEEE/CSC & ESAS SUPERCONDUCTIVITY NEWS FORUM (global edition), No. 27, January 2014;
Plenary presentation 2PL02 at EUCAS 2013

MRI pick-up coils (diameter 40 mm)
SQUID pick-up coils (side 8 mm )
Design of MEG/ULF MRI system at LANL
Other future developments in the field expected by the Korean Center of Excellence KRISS
IEEE/CSC & ESAS SUPERCONDUCTIVITY NEWS FORUM (global edition), No. 27, January 2014;
Plenary presentation 2PL02 at EUCAS 2013

Outline • Forty years of magnetoencephalography
– the origins – early years
• MEG as a functional imaging technique – physiological basis – modelling
• Basics of instrumentation – detectors – large scale systems – hybrid systems
• Multimodal integration with fMRI – respective advantages and limitations
• MEG contribution to basic and clinical neuroscience – source identification – hierarchic organization (picture naming)
• Functional connectivity 36
IEEE/CSC & ESAS SUPERCONDUCTIVITY NEWS FORUM (global edition), No. 27, January 2014;
Plenary presentation 2PL02 at EUCAS 2013
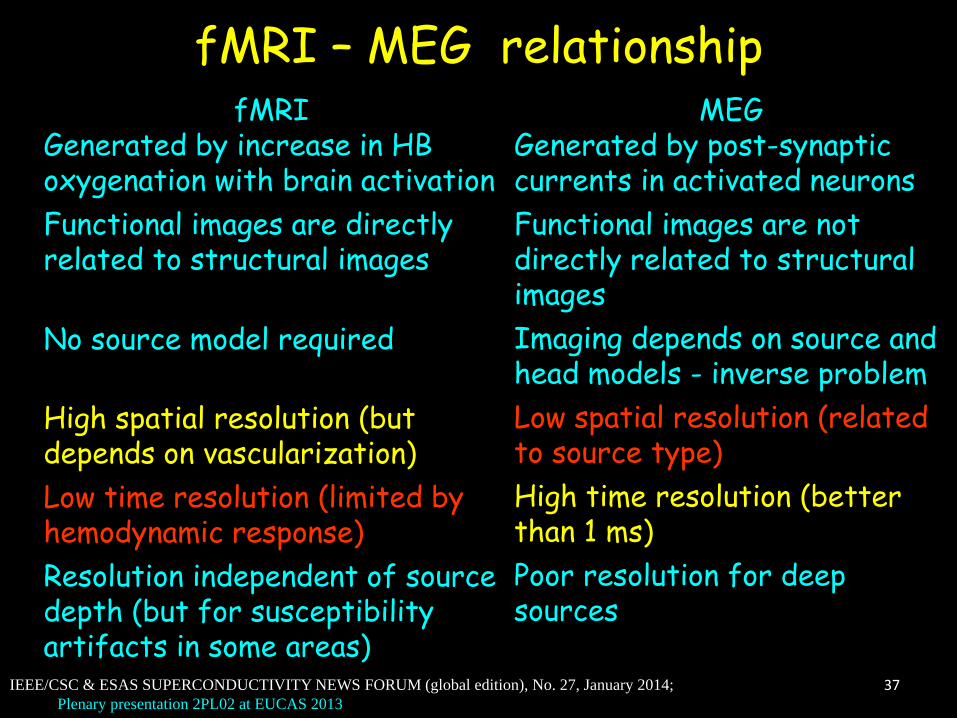
fMRI – MEG relationship fMRI
Generated by increase in HB oxygenation with brain activation
Functional images are directly related to structural images
No source model required
High spatial resolution (but depends on vascularization)
Low time resolution (limited by hemodynamic response)
Resolution independent of source depth (but for susceptibility artifacts in some areas)
MEG Generated by post-synaptic currents in activated neurons
Functional images are not directly related to structural images
Imaging depends on source and head models - inverse problem
Low spatial resolution (related to source type)
High time resolution (better than 1 ms)
Poor resolution for deep sources
37 IEEE/CSC & ESAS SUPERCONDUCTIVITY NEWS FORUM (global edition), No. 27, January 2014;
Plenary presentation 2PL02 at EUCAS 2013

Outline • Forty years of magnetoencephalography
– the origins – early years
• MEG as a functional imaging technique – physiological basis – modelling
• Basics of instrumentation – detectors – large scale systems – hybrid systems
• Multimodal integration with fMRI – respective advantages and limitations
• MEG contribution to basic and clinical neuroscience – source identification – hierarchic organization (picture naming)
• Functional connectivity 38
IEEE/CSC & ESAS SUPERCONDUCTIVITY NEWS FORUM (global edition), No. 27, January 2014;
Plenary presentation 2PL02 at EUCAS 2013

The 165-channel MEG system at ITAB • 153 measurement channels spaced
3.2 cm on average • 4 triplets of 3 orthogonal
reference channels • 32 EEG channels • Somatosensory, visual, acoustic
stimulation apparatus
1 mm
Magnetometers with 8 mm side integrated on the same chip with the SQUID Noise better than 2 fT/√Hz
System assembled in collaboration of ATB, Pescara SQUIDs fabricated at Istituto di Cibernetica – CNR, Pozzuoli (NA)
Granata et al., IEEE Trans. Appl. Super., 2001
39
IEEE/CSC & ESAS SUPERCONDUCTIVITY NEWS FORUM (global edition), No. 27, January 2014;
Plenary presentation 2PL02 at EUCAS 2013

MEG source localization right median nerve stimulation
40 IEEE/CSC & ESAS SUPERCONDUCTIVITY NEWS FORUM (global edition), No. 27, January 2014;
Plenary presentation 2PL02 at EUCAS 2013
Run the video MEG_fMRI from here,view in a separate window, return
manually to slide 41.
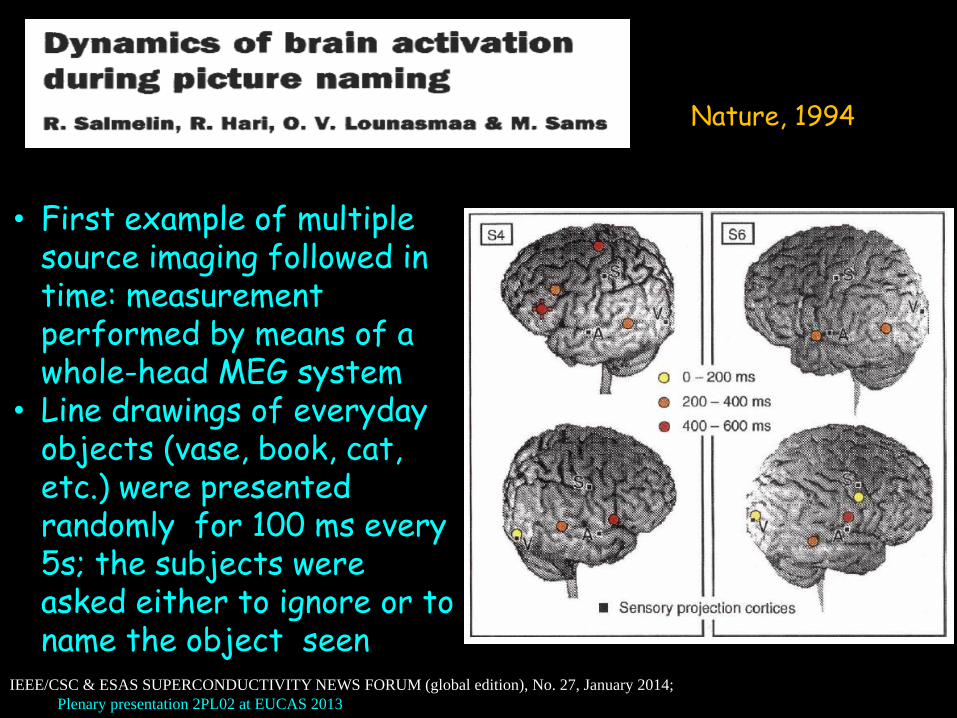
Nature, 1994
• First example of multiple source imaging followed in time: measurement performed by means of a whole-head MEG system
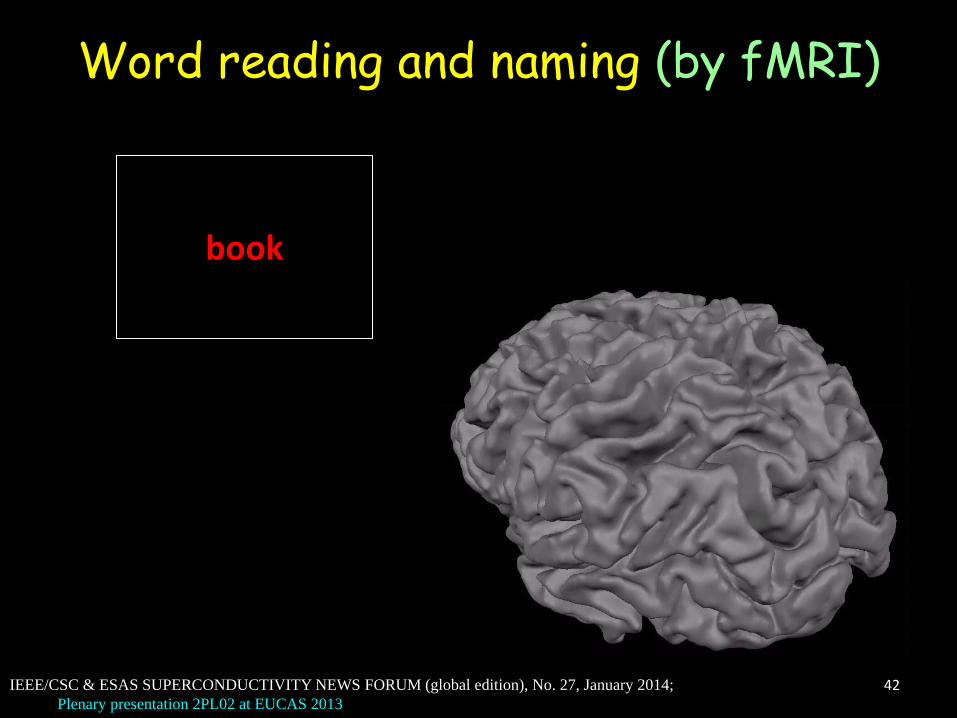
• Line drawings of everyday objects (vase, book, cat, etc.) were presented randomly for 100 ms every 5s; the subjects were asked either to ignore or to name the object seen
IEEE/CSC & ESAS SUPERCONDUCTIVITY NEWS FORUM (global edition), No. 27, January 2014;
Plenary presentation 2PL02 at EUCAS 2013
violin bike car hammer violin knife scissors bike ball book hammer bike car hammer violin knife scissors car ball book
Word reading and naming (by fMRI)
42 IEEE/CSC & ESAS SUPERCONDUCTIVITY NEWS FORUM (global edition), No. 27, January 2014;
Plenary presentation 2PL02 at EUCAS 2013

– fMRI activations for picture naming
– sub-cortical fibers
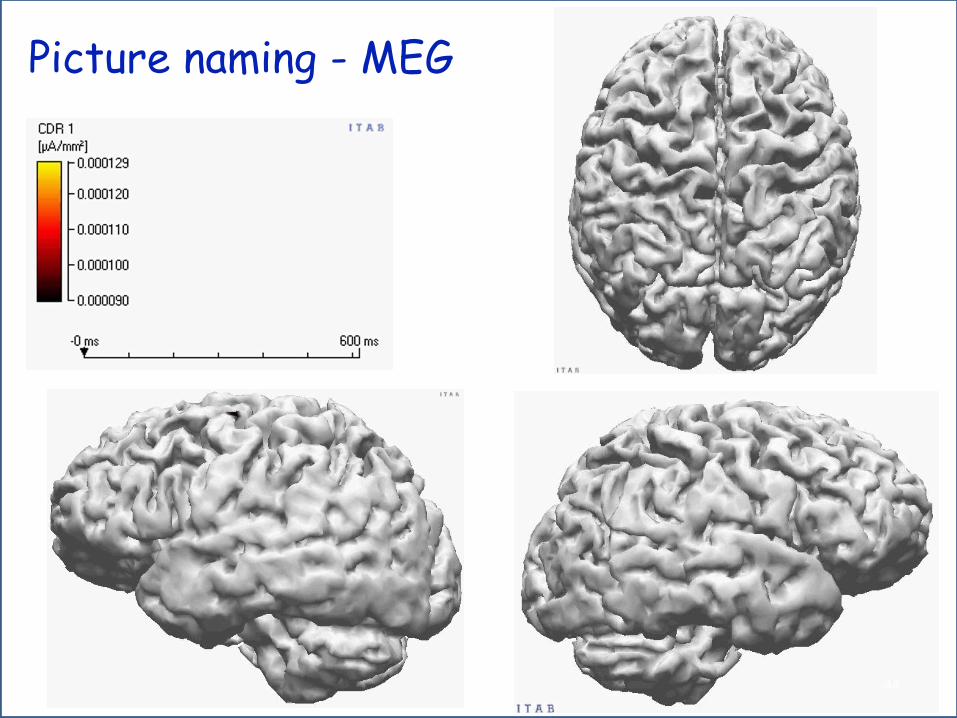
Picture naming - MEG
44

Outline • Forty years of magnetoencephalography
– the origins – early years
• MEG as a functional imaging technique – physiological basis – modelling
• Basics of instrumentation – detectors – large scale systems – hybrid systems
• Multimodal integration with fMRI – respective advantages and limitations
• MEG contribution to basic and clinical neuroscience – source identification – hierarchic organization (picture naming)
• Functional connectivity 45
IEEE/CSC & ESAS SUPERCONDUCTIVITY NEWS FORUM (global edition), No. 27, January 2014;
Plenary presentation 2PL02 at EUCAS 2013
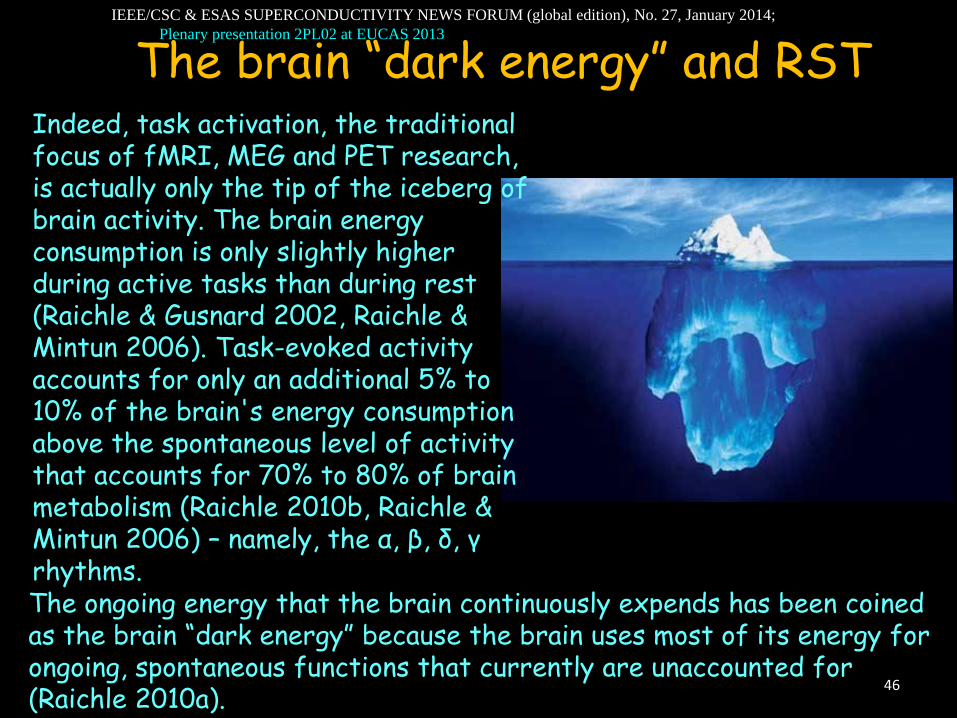
Indeed, task activation, the traditional focus of fMRI, MEG and PET research, is actually only the tip of the iceberg of brain activity. The brain energy consumption is only slightly higher during active tasks than during rest (Raichle & Gusnard 2002, Raichle & Mintun 2006). Task-evoked activity accounts for only an additional 5% to 10% of the brain's energy consumption above the spontaneous level of activity that accounts for 70% to 80% of brain metabolism (Raichle 2010b, Raichle & Mintun 2006) – namely, the α, β, δ, γ rhythms.
The brain “dark energy” and RST
The ongoing energy that the brain continuously expends has been coined as the brain “dark energy” because the brain uses most of its energy for ongoing, spontaneous functions that currently are unaccounted for (Raichle 2010a).
46
IEEE/CSC & ESAS SUPERCONDUCTIVITY NEWS FORUM (global edition), No. 27, January 2014;
Plenary presentation 2PL02 at EUCAS 2013
• By analyzing fMRI data acquired during periods of rest it was observed that the time activity in some voxels was not random, rather seemed to be either positively or negatively correlated with activity in other voxels.
• The time scale of these fluctuations is of the order of several tens of seconds.
• Extending this analysis to the whole brain, this positive/negative correlation was found to involve several cerebral districts, in turn forming different “networks”.
• They appeared to be associated to specific functions of the brain (vision, motion, audition, but also attention, memory, etc.).They were active during rest periods and therefore were defined as Resting State Networks”
Resting State Networks
47
IEEE/CSC & ESAS SUPERCONDUCTIVITY NEWS FORUM (global edition), No. 27, January 2014;
Plenary presentation 2PL02 at EUCAS 2013

Resting State Networks
(Fox et al., PNAS 2005) 48
IEEE/CSC & ESAS SUPERCONDUCTIVITY NEWS FORUM (global edition), No. 27, January 2014;
Plenary presentation 2PL02 at EUCAS 2013
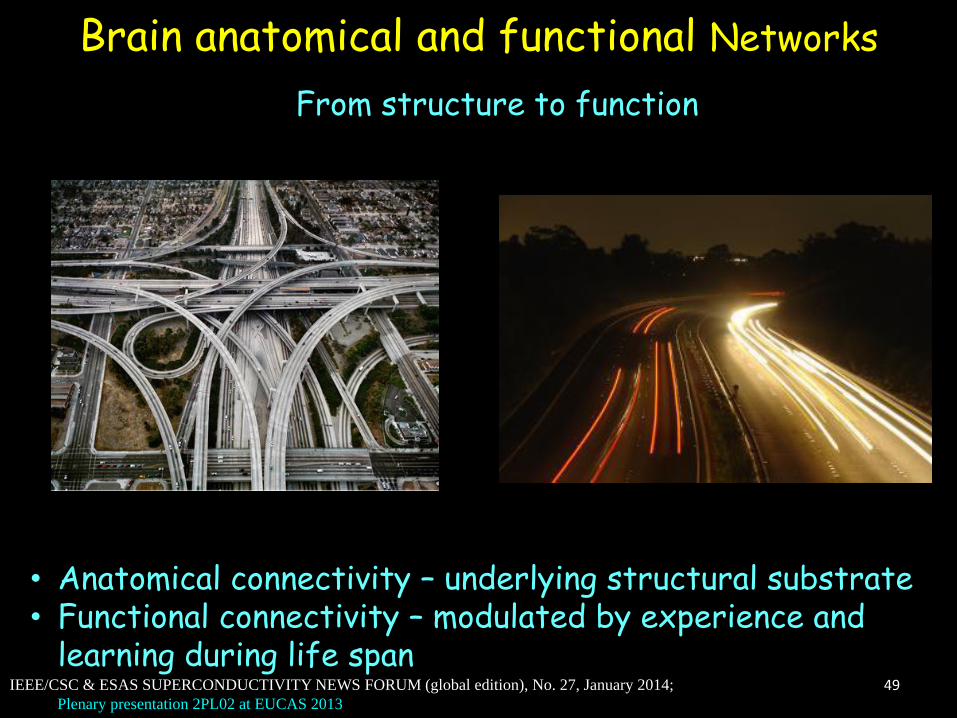
Brain anatomical and functional Networks
• Anatomical connectivity – underlying structural substrate • Functional connectivity – modulated by experience and
learning during life span
From structure to function
49 IEEE/CSC & ESAS SUPERCONDUCTIVITY NEWS FORUM (global edition), No. 27, January 2014;
Plenary presentation 2PL02 at EUCAS 2013
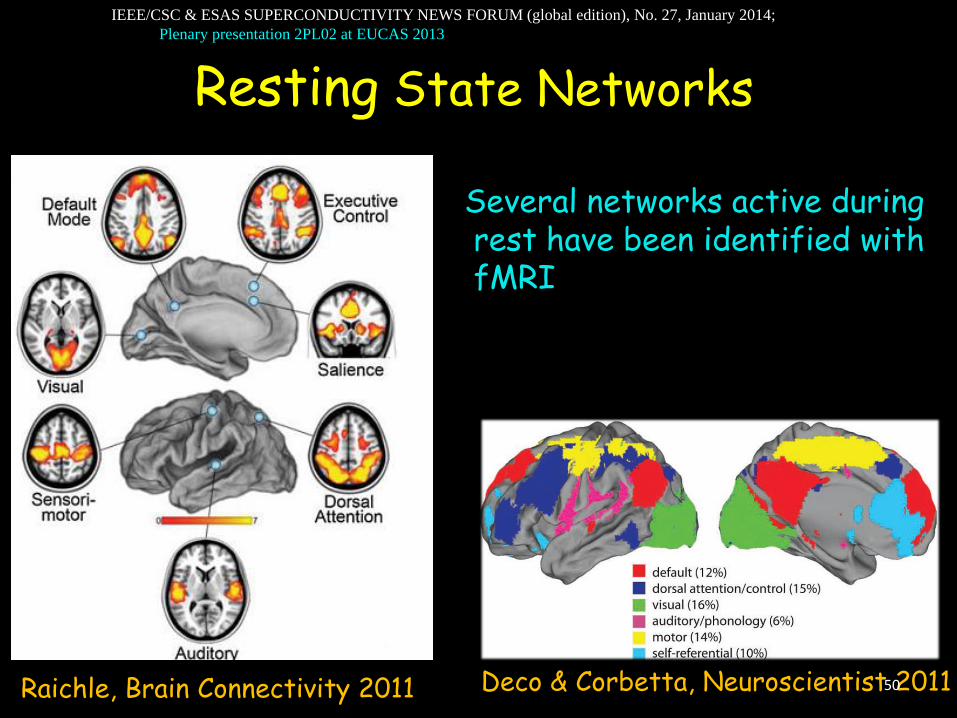
Deco & Corbetta, Neuroscientist 2011
Raichle, Brain Connectivity 2011
Several networks active during rest have been identified with fMRI
Resting State Networks
50
IEEE/CSC & ESAS SUPERCONDUCTIVITY NEWS FORUM (global edition), No. 27, January 2014;
Plenary presentation 2PL02 at EUCAS 2013
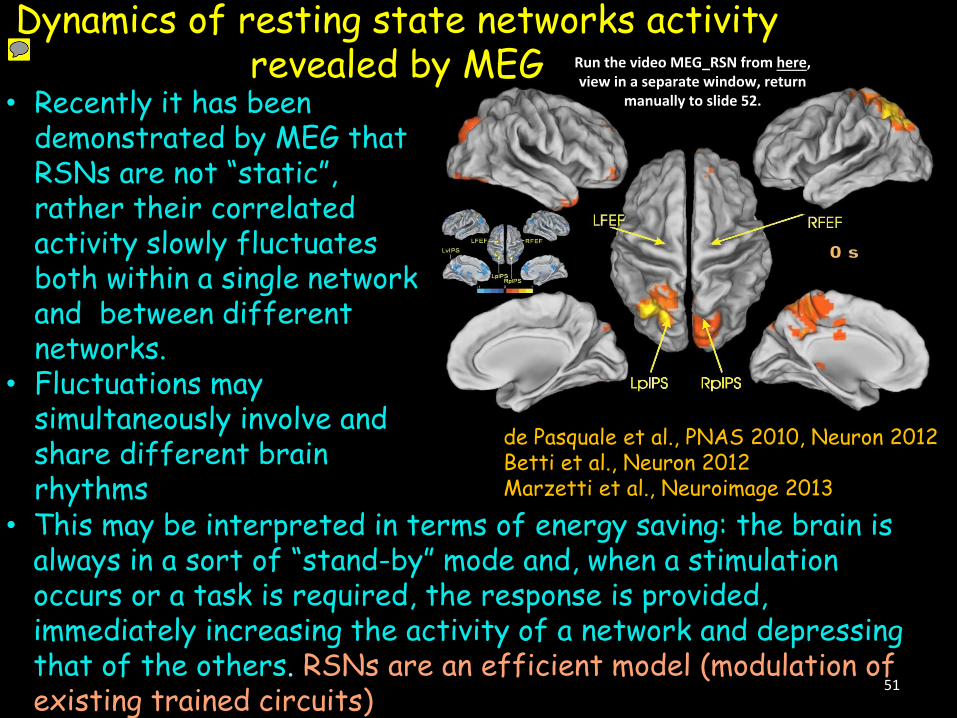
Dynamics of resting state networks activity revealed by MEG
• Recently it has beendemonstrated by MEG thatRSNs are not “static”,rather their correlatedactivity slowly fluctuatesboth within a single networkand between differentnetworks.
• Fluctuations maysimultaneously involve andshare different brainrhythms
• This may be interpreted in terms of energy saving: the brain isalways in a sort of “stand-by” mode and, when a stimulationoccurs or a task is required, the response is provided,immediately increasing the activity of a network and depressingthat of the others. RSNs are an efficient model (modulation ofexisting trained circuits)
de Pasquale et al., PNAS 2010, Neuron 2012 Betti et al., Neuron 2012 Marzetti et al., Neuroimage 2013
51
Run the video MEG_RSN from here,view in a separate window, return
manually to slide 52.
The human connectome
On the basis of this findings NIH launched in 2010 the Human Connectome Project aimed at identifying the connectivity maps of 1200 normal subjects. The project uses anatomical, structural and functional MRI, together with MEG to establish a huge database open to any user for basic and clinical studies. Particular interest is being given all around the world to studies investigating the degradation of the normal connectome in various kinds of brain diseases
52
IEEE/CSC & ESAS SUPERCONDUCTIVITY NEWS FORUM (global edition), No. 27, January 2014;
Plenary presentation 2PL02 at EUCAS 2013

Conclusions • Low Tc SQUIDs are routinely used in large scale systems with
excellent performances and reliability
• High Tc SQUIDs need further improvements for MEG applications (lower noise, integration in whole-head systems)
• MEG allows the recording of whole-head maps at millisecond time resolution
• MEG is commonly used in basic and clinical neuroscience
• Multimodal integration with fMRI provides a powerful tool for high temporal resolution and high spatial resolution functional imaging
• A novel generation of hybrid MEG-Ultra-low field MRI whole-head systems is likely to become available in the near future and might represent a real breakthrough for clinical applications
• MEG is a unique tool for studying the dynamics of brain connectivity!
53
IEEE/CSC & ESAS SUPERCONDUCTIVITY NEWS FORUM (global edition), No. 27, January 2014;
Plenary presentation 2PL02 at EUCAS 2013

Institute for Advanced Biomedical Technologies (ITAB) University of Chieti
www.itab.unich.it Thanks to all my collaborators and to you for your attention!
54
IEEE/CSC & ESAS SUPERCONDUCTIVITY NEWS FORUM (global edition), No. 27, January 2014;
Plenary presentation 2PL02 at EUCAS 2013


![COMPUTATIONAL 3D AND REFLECTIVITY IMAGING WITH HIGH PHOTON …akirmani/papers/ShinKGS_ICIP2014.pdf · be replaced with a superconducting nanowire single-photon detector (SNSPD) [18],](https://img.pdfslide.us/doc/110x75/5ec770430b24422ec45611e5/computational-3d-and-reflectivity-imaging-with-high-photon-akirmanipapersshinkgs.jpg)