Embed Size (px)
Citation preview

Impact of Rapid Urbanization and Industrialization
of Mandalay Environ on Ayeyarwady River
Myat lay Nwe
Lecturer
Department of Chemistry
University of Mandalay

Outlines
Abstract
Information
Myanmar
Ayeyarwady River
Mandalay
Sample Collected Area
River water from Ayeyarwaddy river
Result and Discussion
Conclusion

Abstract
Analysis of water quality is required for pollution control, the assessment of long-
term trends and environmental impacts for human beings. In this paper, it is pointed out that
how the effect of urbanization and industrialization of Mandalay Environ impacts on Ayeyarwady
River, the main blood of our land. Water samples of river were collected from six different
localities of Mandalay environ; namely Nyaungkwe, Mayangyan Jetty, Gawwein Jetty, near
Kantawgyi, near Yadanabon Bridge and junction of Ayeyarwady and Dohkhtawaddy river on
August 2013, 2014 and 2015, 2016 respectively. Physicochemical parameters of water samples
were monitored. The amount of calcium, hardness, magnesium, iron, manganese, chloride,
sulphate and total alkalinity were measured with the aids of sophisticated instruments. Heavy
metal contamination in water samples were detected by using Atomic Absorption Spectroscopic
method. The obtained data were studied and compared with the previously collected data of
1981, 1982 and 1995. The results showed that the water of Ayeyarwady was contaminated with
some heavy metals. The chloride percent is obviously increased. According to these data survey,
it is found that heavy metals contents are increasing year by year. Due to the long-term trend
research, Ayeyarwaddy River is being threatening by heavy metals especially lead. Judging from
these, it is seriously needed to save our blood vein, Ayeyarwady River.
Keywords; Urbanization, Industrialization, Mandalay Environ, Ayeyarwady

"The World Factbook – Burma". cia.gov. Retrieved 1 September 2012. The 2014 Myanmar Population and Housing Census Highlights of the Main Results Census Report Volume 2 – A. Department of Population Ministry of Immigration and Population. 2015.
Republic of the Union of Myanmar
Total area – 676,578 square kilometer


Source Mali River
- coordinates 28°22′0″N 97°23′0″E
Secondary source N'Mai River
- coordinates 28°4′0″N 98°8′0″E
Source confluence
- location Damphet, Kachin State
- elevation 147 m (482 ft)
- coordinates 25°42′0″N 97°30′0″E
Mouth Andaman Sea
- location Ale-ywa, Ayeyarwady Region, Myanmar
- elevation 0 m (0 ft)
- coordinates 15°51′19″N 95°14′27″E
Length 2,170 km (1,348 mi)
Basin 413,710 km2(159,734 sq mi)

running through the centre of the country
Myanmar’s most important commercial waterway
about 1,350 miles (2,170 km) long
flows wholly within the territory of Myanmar
total drainage area is about 158,700 square miles (411,000 square km)
Pulling teak logs, made into large rafts and floated down the Irrawaddy River
Agricultural Industrial
Domestic
Fishing
Transportation

Mandalay Region
Historical population
Year Pop.
1973 3,668,493
1983 4,577,762
2014 6,165,723
Source: 2014 Myanmar Census
• an administrative division of Myanmar.
• located in the center of the country
• Mandalay (regional capital)
Census Report. The 2014 Myanmar Population and Housing Census 2. Naypyitaw: Ministry of Immigration and Population. May 2015. p. 17.

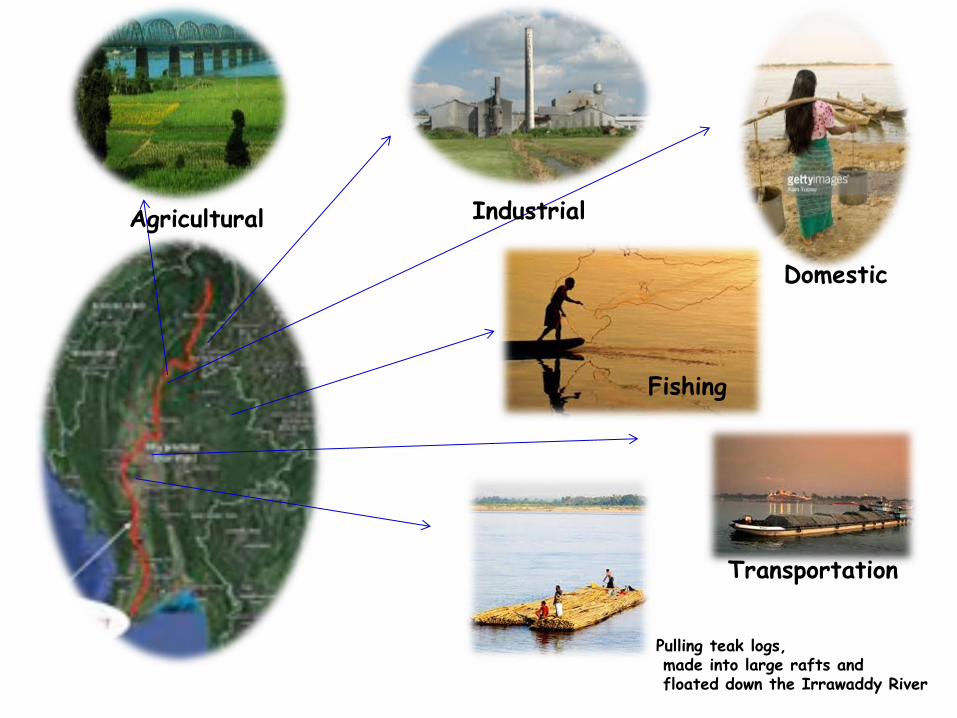
•the second-largest city and the last royal capital of Myanmar
• Located on the east bank of the Ayeyarwaddy River
•the economic hub of Upper Myanmar
• the centre of Myanmar’ culture
Mandalay


Year Number of People Growth Rate %
1983 532,948 2.5
1993 710,027 2.9
2007 921,741 1.9
2014 6,145,588 30.43
Urbanization of Rate of Mandalay Region
Within 10 year, just 200,000 of people increased Within 7 year, unbelievable increased about 5 million

In 1992, Mandalay was reformed into five townships and
86 wards by an announcement of Ministry of Home Affairs
and the Urban area becomes 41.35 square miles.
In 2014, Mandalay was reformed into seven townships.
Amarapura
Aungmyethazan
Chanayethazan (city centre)
Chanmyathazi
Maha Aungmye
Patheingyi
Pyigyidagun

Population is the main consideration
factor of Urbanization.

Which way can we use to solve these problems
???
Homeless Jobless hopeless
Homeless Jobless hopeless

Industrial Zone
Region Name of Zone
Year of Establishment
Area (acre)
No. of Industries
Mandalay Mandalay Industrial Zone-1
1990 809.510 661
Industrial
Zone-2
1997
137.000
333
http://myanmargeneva.org/e-com/MOI-2/MOI-2/myanmar.com/Ministry/moi2/zone.htm
Two more industrial zones in Mandalay Region
With more industrial zones,
job creation will be realized.

The industrial zone of Mandalay City were
established due to the government policy for a
market oriented economy.
As the local population were employed in the
industries, the job opportunities they have
provided changed their living standard and
economic condition.
Industrial Zone


Therefore many people also migrate from rural area for
their better life and income.
Job opportunities due to industrial zones and other trade
with international and local economic conditions, it is
assumed that Mandalay urban development is
pronounced in Myanmar.

It is interested thing
that how about pollution
appears on Ayeyarwaddy
river year after year by
our second most populated
region, Mandalay.

We should maintain the main blood of Our land,
Ayeyarwaddy River very well.

Long term trend research on water resources in
Mandalay environ
- determine the water quality year by year
- search the way to reduce impact of urbanization
and industrialization
- share the knowledge to save our environ

Source of Water of Sample

Site 6
Site 2
Site 3
Site 1
Nyaungkwe
Mayangyan Jetty
Gawwein Jetty
junction of Ayeyarwady and Dokhtawaddy river
Sample Collected Area
Site 5
Near Yadanobon Bridge
Site 4
Kan-taw-gyi Cannel

Near Nyaungkwe (site I)
begin in Mandalay Urban
the stream begin in Sagyin area flow into Ayeyarwady
river near Nyaungkwe quarter
Many marble quires and gold mines
most slum are living Nyaungkwe quarter

Mayangyan Jetty (Site II)
about 1.6 km from Gawwein Jetty
used as transit Jetty
Tourist water way transport association are formed with
about 50 motorboats

Gawwein Jetty (Site III)
Mandalay’s main pier
transport construction material, food and other products
around the country along Ayeyarwady river’s shipping
channel
at the Conner of 35th street and strand road in Mandalay

Kan-taw-gyi (Site IV)
the municipal waste water from
some quarter of Mandalay city drain directly into
Mandalay Kandawgyi and Taungthaman Lake
the water from Kandawgyi flow directly into Ayeyarwady
River at this site
Taungthaman Lake
Mandalay Kandawgyi

Near Yadanabon Bridge (site V)
near Petrol Jetty
near Boat Jetty
the water from the Taungthaman lake enter Ayeyarwady
river at that site
Taungthaman Lake
Mandalay Kandawgyi

Junction of the Ayeyarwady and Dokhtawaddy Rivers (Site VI)
most factories from Mandalay industrial zones drain their
wastewater directly into Dohktawaddy river at West of
Nyaung-pin-saung Village
Dohktawaddy river flow into Ayeyarwady river
Industrial Zone
I
II
Nyaung-pin-saung Village
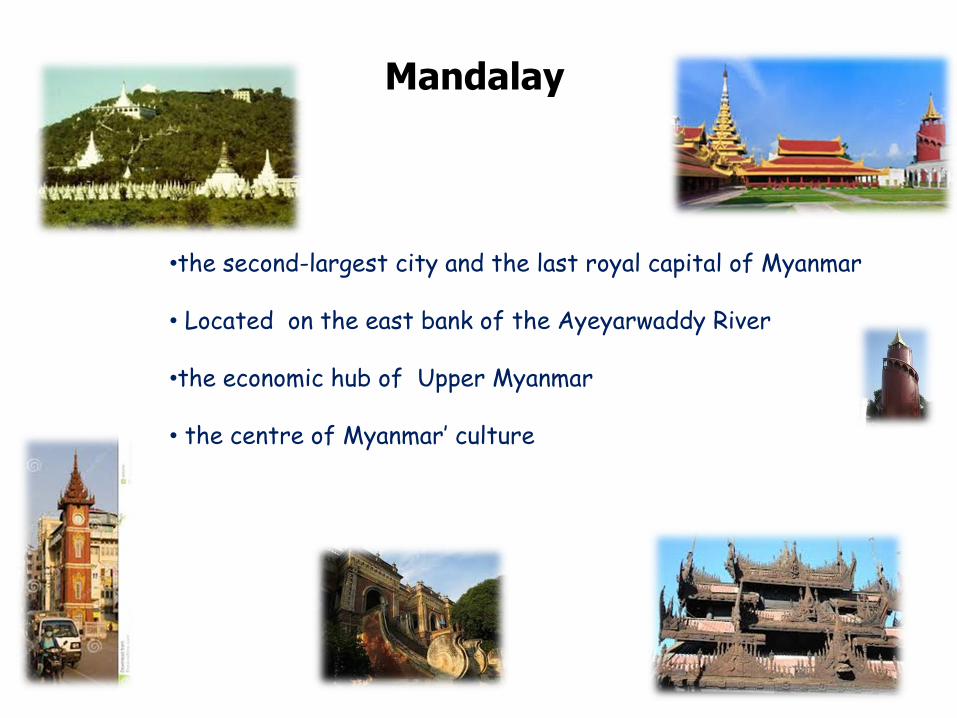
Physical Parameter - color
- Turbidity
- pH
- Total Solid
Chemical Parameter - Total Hardness
- Total Alkalinity
- Calcium Content
- Magnesium Content
- Sulphate
- Chloride
- Iron
- Manganese
- Dissolved Oxygen
Heavy Metal - Lead (Pb)
- Cadmium (Cd)

No parameter Method Determination (by)
1 Color Pt. Co standard Spectrophotometer
2 Turbidity Absorptometric Spectrophotometer
3 Total solid Direct Measurement Spectrophotometer
4 pH Direct Measurement pH meter
5 Hardness EDTA Titrimetric Titration
6 Calcium EDTA Titrimetric Titration
7 Magnesium Calculation Magnesium
Methods used in the analysis of water

No parameter Method Determination (by)
8 Chloride Argentometric Titration
9 alkalinity Titrimetric Titration
10 Total iron Atomic Absorption Spectrometric
Atomic Absorption Spectrophotometer
11 Manganese Persulphate Spectrophotometer
12 Sulfate Gravimetric precipitation
13 DO Winkler Titration
14 Lead Atomic Absorption Spectrometric
Atomic Absorption Spectrophotometer
15 Cadmium Atomic Absorption Spectrometric
Atomic Absorption Spectrophotometer
Methods used in the analysis of water

Results and Discussion
year - 1982, Aug - 1995, Aug - 2013, Aug - 2014, Aug - 2015, Aug - 2016, Aug
Site 1 = Ayarwaddy River that is 15 feet from Nyaungkwe
Site 2 = Ayarwaddy River that is 15 feet from Mayangyan Jetty
Site 3 = Ayarwaddy River that is 15 feet from Gawwein Jetty
Site 4 = Ayarwaddy River that is 15 feet from near Kan-taw-gyi
Site 5 = Ayeyarwaddy River that is 15 feet from near Yadanabon Bridge
Site 6 = Ayarwaddy River that is junction of Ayarwaddy and Dkhtawaddy river

Physical Parameter
color
Turbidity
pH
Total Solid

Color Analysis (Platinum, Cobalt Scale)
Site Aug, 1982
Aug, 1995
Aug, 2013
Aug, 2014
Aug 2015
Aug 2016
Highest desirable
level
Maximum permissible
level
1 7 9 6
5 50
2 6 7 10
3 5 6 7 8
4 7
5 5 7 7
6 5 7 12
August 2013 - reach highest desirable level
August 2014, 2015, 2016 - overcome highest desirable level

Turbidity Analysis (FAU Unit)
Site Aug, 1982
Aug, 1995
Aug, 2013
Aug, 2014
Aug 2015
Aug 2016
Highest desirable
level
Maximum permissible
level
1 18 30 51 148
5 25
2 18 18 12 18 131
3 18 18 20 42 136
4 183
5 15 24 134
6 22 35 189
2015 - Site 1, 3, and 5 overcome maximum permissible level
very busy river Used for commercial transportation turbid and turbid and turbid
August 2016, significantly increase because of 2016 is flash flood year.

Total Solid (mg/L)
Site Aug, 1982
Aug, 1995
Aug, 2013
Aug, 2014
Aug 2015
Aug 2016
Highest desirable
level
Maximum permissible
level
1 95.3 650 1030 1000
500 1500
2 94.4 96 338 462 900
3 95.2 102.5 218 318 1000
4 1200
5 190 310 900
6 610 500 1500
main reason for why the river water is turbid

pH Analysis
Site Aug, 1982
Aug, 1995
Aug, 2013
Aug, 2014
Aug 2015
Aug 2016
Highest desirable
level
Maximum permissible
level
1 7.1 6.6 6.9 7.9
7.0 to 8.5
6.5 to 9.2
2 7.2 7.9 7.4 7.8
3 7.2 6.8 8.1 7.5 7.8
4 7.8
5 8.2 7.6 7.6
6 8.3 7 8.3
satisfactory data

Physical Parameter of River Water
Site 1, Site 3, Site 4
Industry Pollution
many factors such as Urbanization and Industrialization
cause and affect
pollution of surface water, Ayeyarwaddy river water
Polluted in more extend comparing to previous report data
pollution rate increased rapidly year after year
Site (1), (3), (4) and (6) are most polluted than other year by year.
Site 6

Chemical Parameter
Total Hardness
Total Alkalinity
Calcium
Magnesium
Sulphate
Chloride
Iron
Manganese

Total Hardness Analysis (mg/L)
Site Aug, 1982
Aug, 1995
Aug, 2013
Aug, 2014
Aug 2015
Aug 2016
Highest desirable
level
Maximum permissible
level
1 32.43 120 160 124
100 500
2 30.52 44 40 100 80
3 30.52 40 40 60 56
4 68
5 40 40 52
6 240 160 120
Diersing, Nancy (2009). "Water Quality: Frequently Asked Questions." Florida Brooks National Marine Sanctuary, Key West, FL.
Site (1) and (6) reach hard water level
no significant change year after year

Total Alkalinity Analysis (mg/L)
Site Aug, 1982
Aug, 1995
Aug, 2013
Aug, 2014
Aug 2015
Aug 2016
Highest desirable
level
Maximum permissibl
e level
1 32.43 390 780 312
600 950
2 66.0 52 195 260 88
3 66.0 88 130 130 84
4 60
5 130 130 56
6 390 260 276
significant change in 2014
site (1) overcome highest desirable level in 2015

Calcium as Ca Analysis (mg/L)
Site Aug, 1982
Aug, 1995
Aug, 2013
Aug, 2014
Aug 2015
Aug 2016
Highest desirable
level
Maximum permissible
level
1 4.97 32 24 20
75 200
2 4.58 11.2 8 24 16
3 4.58 8 8 8 14
4 14
5 8 16 12
6 40 40 41
Year
no significant change until 2014
sharply started change in 2015 except site 3

Magnesium as Mg Analysis (mg/L)
Site Aug, 1982
Aug, 1995
Aug, 2013
Aug, 2014
Aug 2015
Aug 2016
Highest desirable
level
Maximum permissible
level
1 4.80 12 10 10
30 150
2 4.57 3.9 2.4 10 10
3 4.57 5 2.4 2.4 8
4 8
5 2.4 5 8
14 12 10
solve why high alkalinity of river water

Sulphate as SO4 Analysis (mg/L)
Site Aug, 1982
Aug, 1995
Aug, 2013
Aug, 2014
Aug 2015
Aug 2016
Highest desirable
level
Maximum permissible
level
1 2.68 98 127 98
200 400
2 1.92 7.68 69 79 70
3 1.62 70 78 98 98
4 98
5 59 69 78
6 88 102 127
With two years - Quite increased
compared with 1982 - seriously increased
One problem for river water

Chloride Analysis (mg/L)
Site Aug, 1982
Aug, 1995
Aug, 2013
Aug, 2014
Aug 2015
Aug 2016
Highest desirable
level
Maximum permissible
level
1 1.27 25 40 35
30 150
2 1.37 5.67 25 40 35
3 1.17 8 25 40 35
4 35
5 25 40 35
25 40 40
one of Serious factor , chloride percent
the increasing rate of chloride level
In 2015, exceed the highest desirable level
Rapid rate

Total Iron and Magnese Analysis (mg/L)
Site Aug, 1982
Aug, 1995
Aug, 2013
Aug, 2014
Aug 2015
Aug 2016
1 Nil Nil Nil Nil
2 Nil Nil Nil Nil Nil
3 Nil Nil Nil Nil Nil
4 Nil Nil Nil
5 Nil Nil Nil
6 Nil Nil Nil
not detectable (ppm level) in all sites
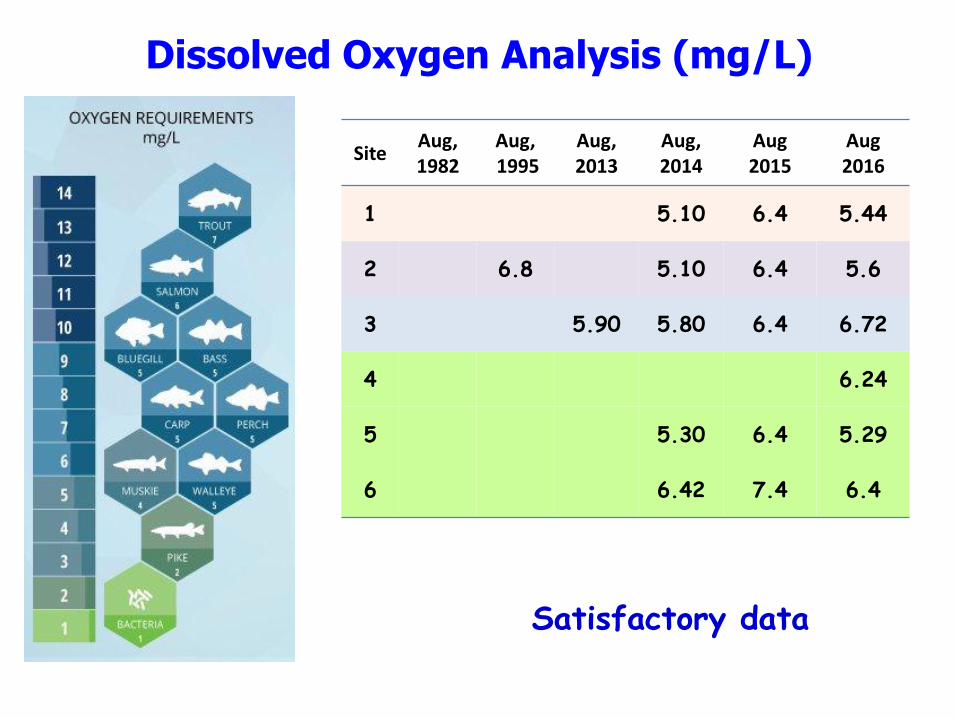
Dissolved Oxygen Analysis (mg/L)
Site Aug, 1982
Aug, 1995
Aug, 2013
Aug, 2014
Aug 2015
Aug 2016
1 5.10 6.4 5.44
2 6.8 5.10 6.4 5.6
3 5.90 5.80 6.4 6.72
4 6.24
5 5.30 6.4 5.29
6 6.42 7.4 6.4
Satisfactory data

Chemical Parameter of River Water
many factors such as Urbanization and Industrialization
cause and affect the pollution of surface water, Ayeyarwaddy river water
lead Ayeyarwaddy river water will become salty
Chloride overcome highest desirable level
All sites
Industry Pollution
Polluted in more extend comparing to previous report data
pollution rate increased rapidly year after year
Site (1), (3) and (5) are most polluted than other year by year.

Heavy Metal Determination
Lead (Pb)
Cadmium (Cd)

Heavy Metal Analysis (Lead) (mg/L)
Site Aug, 1982
Aug, 1995
Aug, 2013
Aug, 2014
Aug 2015
Aug 2016
1 Nil 0.0112 0.0270 0.0124
2 Nil Nil 0.0203 0.0473 0.0316
3 Nil 0.0183 0.0406 0.0541 0.0441
4 0.0468
5 0.0270 0.0338 0.0215
6 0.0338 0.0473 0.0312
Beginning to detect at Gawwein Jetty in August, 2013
Increasing year by year
rate of trade in Gawwein Jetty increase significantly

Heavy Metal Analysis (Cadmium) (mg/L)
Site Aug, 1982
Aug, 1995
Aug, 2013
Aug, 2014
Aug 2015
Aug 2016
1 Nil Nil Nil Nil
2 Nil Nil Nil Nil Nil
3 Nil Nil Nil Nil Nil
4 Nil Nil Nil
5 Nil Nil Nil
can not be detected (ppm level) until August, 2016

Heavy Metal Determination
Industry Pollution
Lead content of site (2), (3) , (4) and (6) are higher
Lead percent of Ayeyarwaddy river are going increasing rate year after year
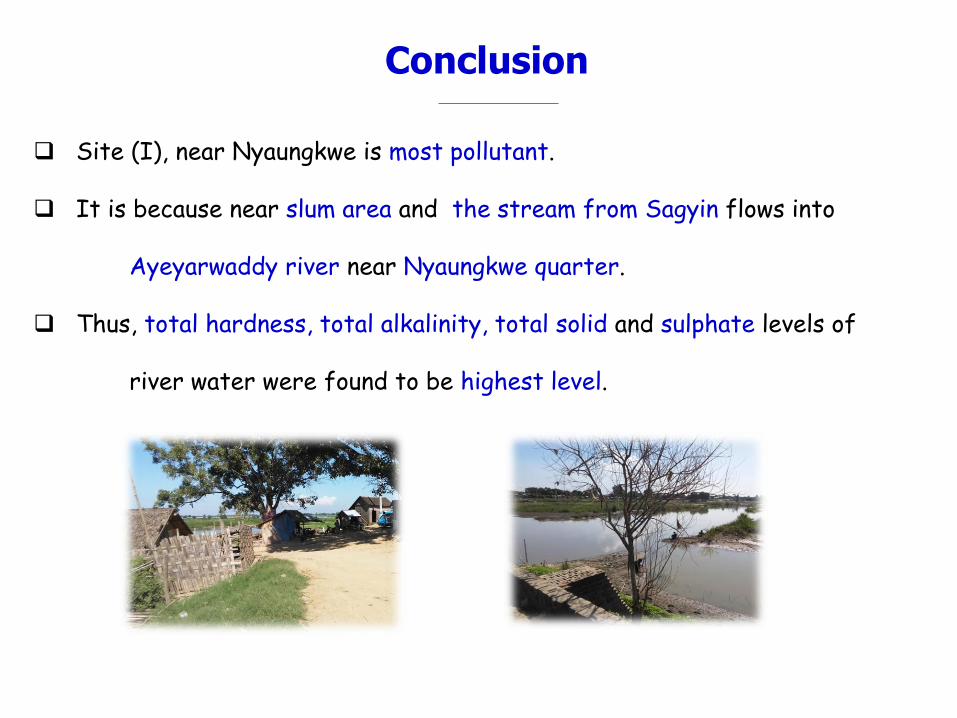
Site (I), near Nyaungkwe is most pollutant.
It is because near slum area and the stream from Sagyin flows into
Ayeyarwaddy river near Nyaungkwe quarter.
Thus, total hardness, total alkalinity, total solid and sulphate levels of
river water were found to be highest level.
Conclusion

Site (III), Gawwein Jetty is increasing the pollutant rate year by year.
The rate of trade in Gawwein Jetty significantly increase due to the
population growth increase.
Heavy metal (lead) content increase year by year.
Consequently, the pollutant level of Ayeyarwaddy river water at Gawwein
Jetty have become serious level.

Site (VI), Junction of Ayeyarwaddy river and Dokhthawady river
All water quality parameter are increasing rapid rate.
During 10 years, if the pollution rate continuously increase, the pollution
level of this site will reach toxic level.

Chloride level of ground water is near equal to the chloride level of river
water.
In this way, all of our soft water will become salty.

Industry Pollution
Urbanization and industrialization have negative
effects on the coastal ecosystem and
environment in general.

not exceed WHO standard
Physical Parameter
Chemical Parameter
Heavy metal content
Surface water and Ground water are polluted
By
Urbanization and
Industrialization
Due to population -
Due to Urbanization - reduce the water quality
Due to Industrial zone - Heavy metal contaminant appear

All of We are researchers
Search the way to reduce environmental impact
give awareness
Share our knowledge
Save our earth as mush as we can

References 1. Nicholls, L. Aid to Tropical Hypiece.
2. WHO Guidelines for Drinking-Water Quality, Volume-1, Recommendation, second edition, World Health Organization, Geneva
(1993).
3. WHO Guidelines for Drinking Water Quality, volume 2, Health Criteria and other Supportion Information (1994).
4. WMO Manual on water Quality Monitoring. WMO Operational Hydrology Report, No.27, World Meteorological Organization,
Geneva (1998).
5. World Health Organization, International Standards for Drinking Water (second Edition, Geneva, 1963).
6. World Health Organization, European Standard for Drinking Water (1970).
7. Quick, F. J Introductory College Chemistry, Macmillan Publishing Co, Inc, New York (1965).
8. Borde, A.B., and others. 2003. National Review of Successful and Innovative Restoration Projects. Prepared for NOAA Coastal
Services Center, by Battelle Marine Sciences Laboratory. Sequim, WA.
9. Bowen, Jennifer L., and Ivan Liela. "The ecological effects of urbanization of coastal
watersheds: historical increases in nitrogen loads and eutrophication of Waquoit Bay estuaries [Cape Cod, Massachusetts]." NRC
Research Press 58 (2001): 1489. Pro Quest. 10 Mar. 2006. Keyword: urbanization coastal.
10. De Mora, Stephen, Serge Demers, and Maria Vernet, eds. The Effects of UV Radiation in the
Marine Environment. Cambridge: Cambridge UP, 2000.
11. Global International Waters Assessment Final Report. United Nations Environmental
Programme, Global Environmental Facility, University of Kalmar. Dubai: UNEP Governing
Council, 2006.
12. Holland, Marjorie M., Elizabeth R. Blood, and Lawrence R. Shaffer, eds. Achieving
Sustainable Freshwater Systems. Washington: Island P, 2003.
13. Larkin, P.A. Freshwater Pollution, Canadian Style. London: McGill-Queen's UP, 1974.
14. McKinney, Michael L. "Urbanization, Biodiversity, and Conservation." American Institute of Biological Sciences 52 (2002).

• Thanks for your time and kind attention