Embed Size (px)
Citation preview

IMPACT OF LEAN SUPPLY CHAIN MANAGEMENT
STRATEGIES ON THE PERFORMANCE OF COMMERCIAL
BANKS IN KENYA
BY
MUKUNJU ESTHER WANJIRU
D61/61881/2010
A RESEARCH PROJECT PRESENTED IN PARTIAL
FULFILLMENT OF THE REQUIREMENTS FOR THE DEGREE
OF MASTER OF BUSINESS ADMINISTRATION (MBA),
UNIVERSITY OF NAIROBI
OCTOBER, 2014

ii
DECLARATION I declare that this research project is my original work and has never been submitted to
any other University for assessment or award of a degree.
Signature…………………………….. Date………………………………
MUKUNJU ESTHER WANJIRU
D61/61881/2010
This project has been submitted with my authority as the university supervisor.
Signature……………………………… Date……………………………..
Michael K. Chirchir
University of Nairobi, School of Business

iii
ACKNOWLEDGEMENTS Above all, I thank God for his grace, provision and seeing me through the project.
Individually I take the formatting errors that would be spotted in this script. My special
gratitude goes to my supervisor Mr. Michael Chirchir who tirelessly through his effort
and initiative guided me through the whole process. I would like to acknowledge all the
MBA students, colleagues, friends and my family especially for their moral and material
support for the completion of this project.

iv
DEDICATION This project is dedicated to my husband and children who have been my key asset to
success and supported me both emotionally and financially during the time of the
project. I sincerely appreciate their support and prayers that led to the completion of this
project within the stipulated timeframe.

v
TABLE OF CONTENTS DECLARATION ........................................................................................................... ii
ACKNOWLEDGEMENTS ......................................................................................... iii
DEDICATION .............................................................................................................. iv
LIST OF TABLES ...................................................................................................... vii
LIST OF FIGURES.................................................................................................... viii
ABBREVIATION AND ACRONYMS ........................................................................ ix
ABSTRACT ................................................................................................................... x
CHAPTER ONE: INTRODUCTION ........................................................................... 1
1.1Background of Study .................................................................................................. 1
1.1.1 Lean Supply Chain Management Strategies ........................................................ 3
1.1.2 Organizational Performance ................................................................................ 4
1.1.3 Commercial Banks in Kenya ............................................................................... 5
1.2 Statement of the Problem ........................................................................................... 6
1.3 Objectives of the Study .............................................................................................. 8
1.4 Value of the Study ..................................................................................................... 9
CHAPTER TWO: LITERATURE REVIEW ............................................................ 10
2.1 Introduction ............................................................................................................. 10
2.2The Five Principles of Lean Thinking ....................................................................... 10
2.3 Components of the Lean Supply Chain .................................................................... 11
2.5 Lean Practices in the Service Industry...................................................................... 15
2.6 Lean Supply Chain Management Strategies and Performance .................................. 19
2.7 Empirical Studies .................................................................................................... 21
2.8 Lean Supply Chain Management Strategies ............................................................. 23
2.8.1. Customer Relationship Management Strategy .................................................. 23
2.8.2 Customer Service Management Strategy ........................................................... 24
2.8.3 Demand Management Strategy ......................................................................... 24
2.8.4 Supplier Relationship Management Strategy ..................................................... 25
2.9 Conceptual Framework ............................................................................................ 26
CHAPTER THREE: RESEARCH METHODOLOGY ............................................ 27
3.1 Introduction ............................................................................................................. 27
3.2 Research Design ...................................................................................................... 27
3.3 Population ............................................................................................................... 28
3.4 Data Collection........................................................................................................ 28

vi
3.5 Validity and Reliabi1ity of Research Instrument ...................................................... 28
3.6 Data Analysis .......................................................................................................... 29
CHAPTER FOUR: DATA ANALYSIS AND INTERPRETATION ........................ 30
4.1 Introduction ............................................................................................................. 30
4.2 Response Rate ......................................................................................................... 30
4.3 Bank Operation ....................................................................................................... 30
4.4 Size of the Bank ...................................................................................................... 31
4.5.1 Customer Relationship Management Strategy ................................................... 32
4.5.2 Customer Service Management Strategy ........................................................... 34
4.5.3 Demand Management Strategy ......................................................................... 36
4.5.4 Supplier Relationship Management Strategy ..................................................... 37
4.5.5 Benefits of Lean Supply Chain Management Strategies .................................... 39
CHAPTER FIVE SUMMARY, CONCLUSION AND RECOMMENDATIONS .... 42
5.1 Introduction ............................................................................................................. 42
5.2 Summary of Findings .............................................................................................. 42
5.3 Conclusions ............................................................................................................. 44
5.4 Recommendations ................................................................................................... 44
5.5 Limitations of the Study .......................................................................................... 45
5.6 Suggestions for Further Research............................................................................. 45
REFERENCES ............................................................................................................ 47
APPENDICES ............................................................................................................... 1
Appendix I: Introductory Letter ....................................................................................... 1
Appendix II: Questionnaire ............................................................................................. 2
Appendix III: List of Licensed Commercial Banks in Kenya .......................................... 6

vii
LIST OF TABLES
Table 4.1 Bank Operation .............................................................................................. 31
Table 4.2: Size of the Bank ............................................................................................ 32
Table 4.3: Customer Relationship Management Strategy ............................................... 33
Table 4.4: Customer Service Management Strategy ....................................................... 34
Table 4.5: Demand Management Strategy ..................................................................... 36
Table 4.6 Supplier Relationship Management Strategy .................................................. 38
Table 4.7: Benefits of Lean Supply Chain Management Strategies ............................... 39

viii
LIST OF FIGURES Figure 1; Conceptual Framework................................................................................... 26

ix
ABBREVIATION AND ACRONYMS APS Advanced Planning and Scheduling
ERP Enterprise Resource Planning
FMEA Failure Mode and Effects Analysis
GDP Gross Domestic Product
ICT Information Communication Technology
JIT Just in Time
KFS Key Factors for Success
MGMT Management
MRP Material Resource Planning
MVA Market Value Added
OEE Overall Equipment Effectiveness
PDCA Plan-Do-Check-Act
SMED Single Minute Exchange of Dies
SOP Standard Operating Procedure
SPC Statistical Process Control
TOC Theory of Constraints
TPM Total Productive Maintenance
TPS Toyota Production System
TQC Total Quality Control
TQM Total Quality Management
US United States of America
VS Value Stream
VSM Value Stream Map
WIP Work in Progress

x
ABSTRACT The principle of Lean is to eliminate the waste from the system. The purpose of this study was to explore Lean Supply Chain Management strategies on the performance of Commercial bank in Kenya. The study had two objectives to achieve: to find out the lean strategies adopted by commercial Banks in Kenya and to determine the impact of lean supply chain management strategies on performance of commercial Banks in Kenya. The research design involved a cross sectional survey of all commercial banks in Kenya. Data was collected using a questionnaire that was administered through drop and pick later method. A census was employed in the stud where the target population for this study included all the 43 Commercial Banks operating in Kenya. One employee was selected from the procurement and operations department of each of the 43 Commercial Banks in Kenya. Primary data was collected using structured questionnaires with both close-ended and open-ended questions. The respondents of the study were selected from the supply chain department team of the 43 Commercial Banks in Kenya. Questionnaires were used as instruments of data collection. Secondary data was gathered from library material, bank journals and reports, media publications and various Internet search engines covering the business process management of Commercial Banks in Kenya. The data collected in the research was analyzed using descriptive statistics such as frequency distributions, percentages and frequency tables were used to summarize and relate variables. Multiple linear regression analysis was used to determine the joint relationship between independent and dependent. The findings were presented in tables. The study established that lean supply chain management strategies were not common among commercial banks in Kenya due to internal and external challenges. The study concludes that most commercial banks in Kenya have been embracing lean supply chain management strategies despite the challenges experienced form the internal and external environment. Lean supply chain management strategies have assisted the commercial banks to enhance the performance form the financial and non-financial perspective. The study recommends that top level management to make customer relations a culture of the organization by training new and existing employees, management to integrate ICT in customer service delivery, management should invest in modern models of analyzing demand and supply trends in order to overcome the challenge of overwhelming demand and commercial banks should strive and maintain long term relationships for quality of products and services. It was such an uphill task for the researcher to convince the respondents to participate in the study. Commercial banks are known to work under very strict confidentiality in order to secure any unauthorized access to information. Most of the respondents agreed to participate on condition that the information will not be divulged to any other party other than for academic purposes only. Future studies should explore the reasons behind the Challenges of lean supply chain management strategies applied by commercial banks in Kenya. Factors Affecting the Implementation of lean supply chain management Strategies among commercial banks should be investigated. Researchers should go ahead and establish the reasons behind the failure of lean supply chain management strategy implementation hence establish long term solutions. Future studies will minimize the challenges experienced during lean supply chain management strategy implementation. Future studies should try to investigate the relationship between lean strategies and performance of commercial banks in Kenya.

CHAPTER ONE: INTRODUCTION
1.1Background of Study In today’s environment, there is the added pressure to be more socially and
environmentally responsible and there are risks which need to be mitigated and managed
globally (Veykus, Carter & Erin, 2006). The complexity created by ever increasing
customer requirements and expectations, globalization, the pressure on cost, and the
availability and access to resources, management expectation to improve profitability,
increase revenue growth and capture and protect larger market share (Cooper and Lambert,
2012). In order to succeed, management must recognize that the ultimate success of an
organization depends on the ability to integrate the company’s network of business
relationships based on lean supply chain management strategies to gain competitive edge in
the dynamic and competitive market (Kallrath & Maindl, 2006).
Lean supply chain practices is a set of organizations directly linked by upstream and
downstream flows of products services, finances and information that collaborate work to
reduce cost and waste by efficiently and effectively pulling what is required to meet the
individual customer needs. Lean supply chain strategies have their origin in the just in time
philosophy, first adopted by many American and European firms in the late 1980s. Just in
time is a manufacturing philosophy based on planned waste elimination and on continuous
improvement in productivity. Its primary elements are: having the only required
inventories when needed, enhancing quality by having zero defects, reducing lead times,
incrementally revising operations, activity accomplishment at minimum costs (Simone,
Andrew, Kleiner & Brian 2004).

2
The lean theory is applicable to all forms of production such as job shop, process and to
many service environments as well. It is closely aligned with total quality management and
supplier management initiatives (Simone, Andrew, Kleiner & Brian 2004). The
maintenance and building of a lean supply chain revolves around six key attributes,
namely: demand management, cost and waste reduction, process standardization, industry
standardization, cultural change and cross enterprise collaboration (Larson & Halldorsson,
2004). In the services sector lean is not credited with the same level of popularity as in the
manufacturing sector. Companies and institutions in the service sector appear to embrace
many of the concepts of lean thinking without actually calling it “lean” (McManus &
Kevin 2007).
Karlsson and Ahlstrom (1996) developed a model of lean production system operation.
Implicit to this is the notion that the introduction of lean production enhances performance.
This model contains nine principles; elimination of waste, continuous improvement, zero
defects, just in time deliveries, pull of materials, multifunctional teams, decentralization,
integration of functions and the vertical information systems. Lean thinking has seldom
been applied to Commercial banks in comparison with manufacturing environments.
However, there is much evidence to show that the application of lean in to Commercial
banks in Kenya can be extremely beneficial leading to improved processing time, improved
service performance and achieving more with less. The model has been associated with the
practice of deciphering the value added activities from those that are waste in an
organization and its supply chain (McManus & Kevin 2007).

3
1.1.1 Lean Supply Chain Management Strategies Supply chain management strategies encompasses the planning and management of all
activities involved in sourcing and procurement, conversion and all logistics Management
activities. It also includes the coordination and collaboration with channel partners, which
can be suppliers, intermediaries, third party service providers and customers. Supply Chain
management integrates supply and demand management within and across companies
(Chow et al, 2008).
Chow et al, (2008) benchmarked supply chain management practices which included
practices related to supply and materials management issues, operations, information
technology and sharing and customer service. The findings were that a proportion of firms
practicing some form of supply chain management practice were quite high, mainly with a
view to improve on-time delivery. Lean thinking provides a way to re-specify value, line
up value creating actions in the best sequence, conduct these activities without interruption
whenever requests are made and effectively perform them (Womac and Jones, 1996).
There is no universal way of applying these lean principals and therefore every company
must find its own way of implementing the lean method (Chow et al, 2008). A lean supply
chain works to have products pulled through the channel using customer demand from
point of sale in A supply chain, with the pull, flows back from deliveries to the store or to
the customer warehouse back through to purchase orders placed on suppliers. Anything that
delays or impedes this flow must be analyzed as a potential non-value added activity
(Kallrath & Maindl, 2006).

4
Lean thinking in supply chain management is the use of lean principles to align activities
across corporate functions within the firm and to manage business relationships with
customers and suppliers thus eliminating waste (Wisner & Stanley, 2008). Although
reducing the startup time in lean supply chain is raising flexibility within the supply chain,
flexible and responsiveness to customer demand is important in the design, timing and
distribution that in lean production is not given much attention (Kallrath & Maindl, 2006).
Lean thinking critics on the other hand indicate that only 10% or less of companies
succeeds at implementing lean and other lean manufacturing practices (Larson &
Halldorsson, 2004). Although lean thinking is typically applied to manufacturing lean
techniques and focus are applicable anywhere there are processes to improve, including the
entire supply chain. A lean supply chain produces just what and how much is needed, when
it is required and where required .The underlying theme in a lean thinking is to produce
more with fewer resources while giving the end customer exactly what they want. This
means putting more focus on each product and its value stream. Lean is about eliminating
waste and enhancing value (Larson & Halldorsson, 2004).
1.1.2 Organizational Performance Performance involves the accomplishment of a given task measured against preset known
standards. It would be expected that overall performance determines an organizational
survival. It is a set of metrics used to quantify both the efficiency and effectiveness of
actions. Performance measurement framework proposed by Kaplan and Norton’s (1992)
balanced scorecard which is based on the principle that a performance measurement system
should provide managers with sufficient information to address the questions: how do we
look to our shareholders (financial perspective)?, what must we excel at (internal business

5
perspective)?, how do our customers see us (customer perspective)? and how can we
continue to improve and create value (innovation and learning perspective)? Lean supply
chain performance measurement will be measured in terms of minimal customer
complaints, reduced costs of production, Just- In time customer service, minimal paper
work, minimal employee contact with customers, increased online response, increased
electronic transactions and continuous improvement of internal processes (Mukwana,
2010).
Mukwana (2010) contends that, performance is measured by either subjective or objective
criteria; arguments for subjective measures include difficulties with collecting qualitative
performance data from small firms and with reliability of such data arising from differences
in accounting methods used by firms. Objective performance measures include indicators
such as profit growth, revenue growth, return on capital employed. Financial consultants
Stern Stewart and Co. created Market Value Added (MVA), a measure of the excess value
a company has provided to its shareholders over the total amount of their investments. This
ranking is based on eight more traditional aspects of financial performance including: total
return for one and three years, sales growth for one and three years, profit growth for one
and three years, net margin, and return on equity.
1.1.3 Commercial Banks in Kenya There has been tremendous growth in the Kenyan banking industry for the last decade.
Changes in the Kenyan economy and Commercial Banks have not been spared from the
impact of these changes. Lean supply chain management concepts are becoming drivers of
competitive commercial banks due to increased competition, globalization, changing
consumer needs and increased costs of operation. The banking sector in Kenya comprises

6
43 registered Commercial Banks that are licensed and regulated by the Central Bank of
Kenya. There are various banking laws in Kenya that and prudential guidelines that govern
and regulate the way banks are formed, operate and are managed in the country. Quality
service delivery to customers by Commercial Banks in Kenya still has remained a
challenge due to inappropriate lean supply chain management strategies adopted. Despite
the effort of minimizing costs of operation, lean supply chain management strategies has
remained a big challenge to commercial banks due to inadequate support from management
and training to employees (Wainaina, 2009).
Despite the efforts of commercial banks to perform in the dynamic business environment,
lean supply chain management practices has become the key drive of gaining competitive
advantage in the market. With the challenge of globalization, lean supply chain
management practices are driving commercial banks in Kenya to minimize wastes and
maximize profits by (Afei, 2010). Commercial banks that are global players in the financial
industry cannot operate without lean supply chain management practices. E-commerce
practices are strategic initiatives that commercial banks are trying to adopt in order to
attract and retain customers, minimize unnecessary marketing costs thus promote enhanced
value chain activities. Electronic banking practices by commercial banks has become lean
practice by cutting down operational costs, improving customer experience locally and
internationally, provided opportunities of product innovation and continuous improvement
in the system (Awino, 2009).
1.2 Statement of the Problem The application of lean supply chain management strategies is meant to lead to improved
performance of managers of the supply chain, enhance timely supplies and improve quality

7
on supplies at costs that enable institutions use the marked resources to maximize gain to
the stakeholders. This would mean that one way to achieve timely supplies and create
greater values is to apply lean supply chain management thinking and practices (Karlsson
and Ahlstrom, 1996). The application of lean supply chain strategies leads to the success of
companies by being responsive to customer needs, cost reduction and improved internal
business processes. Companies can benefit from lean strategies that will increase
profitability such as introducing an environment of change towards lean thinking (Bradley,
1999). Lean practices in organizations lead to flexibility, service, cost, quality and
innovation are well taken care of and contribute immensely towards a good supply chain
management practice (Mukwana, 2010).
Commercial banks in Kenya are facing challenges in the supply chain practices due to stiff
completion, influence of technology and globalization. Due to these challenges,
performance of commercial banks has decreased tremendously due to inefficient and
ineffective customer relationship strategies, customer service management, and demand
management and supplier relationship. Generally, in terms of performance, and
improvements service companies are far behind. Transferring lean management concept
from the services might offer opportunities for improvements. Many service businesses
have improved and profited by the use of lean management methods and tools. Yet the
benefits have not been as nearly as impressive for service industries applying lean
management principles (Afei, 2010).
Commercial Banks in Kenya are facing challenges from the internal and external
environment including globalization, stiff competition, changing customer needs and

8
wants, increased operational costs, underutilized capacity, small extent of ICT adoption in
the system and unsatisfied client needs. Studies carried out by (Afei, 2010; Muya, 2011 and
Muloko, 2012) with regard to lean supply chain management strategies observed that most
organizations face technological challenges when implementing lean practices in the
supply chain. Other local studies carried out in Kenya by (Wainaina, 2009; Odoyo and
Awino, 2009) on supply chain management strategies and performance of commercial
entities observed that organizations in Kenya were yet to fully embrace the supply chain
management strategies and most of the practices used were borrowed from the procurement
philosophy.
However, arising from the above findings of previous studies, there are many areas that
have not been studied with regard to lean supply chain management strategies on
performance of Commercial Banks in Kenya. The study will seek to answer the question;
what is the impact of lean supply chain management strategies on performance of
Commercial Banks in Kenya?
1.3 Objectives of the Study The specific objectives of the study will be:
i. To find out the lean strategies adopted by commercial Banks in Kenya.
ii. To determine the impact of lean supply chain management strategies on
performance of commercial Banks in Kenya.

9
1.4 Value of the Study The research findings are expected to contribute to a better understanding of lean supply
chain management strategies on the performance of Commercial Banks in Kenya.
It will help various shareholders to make strategic lean decisions in procurement, marketing
Human Resource management and distribution in order to survive in the competitive
industry.
Commercial Banks in Kenya will gain an In-depth understanding on how to meet customer
needs cost effectively thus zero waste tolerance. Innovative ways of satisfying customers
will be established.
The Government will be in a position to formulate lean policies that are aimed at increasing
productivity and safeguarding the interests of Commercial Banks in Kenya based on lean
practices on customer satisfaction.
Scholars and Researcher will form a basis upon which further research on the same will be
based. The findings will enable the researchers understand the necessary resources which
may be required in future related studies in lean management practices.

10
CHAPTER TWO: LITERATURE REVIEW
2.1 Introduction The chapter outlines; the five principles of lean thinking, components of the lean supply
chain, lean practices in the service industry, lean supply chain management strategies and
performance empirical studies, lean supply chain management strategies and conceptual
framework.
2.2The Five Principles of Lean Thinking Identify Customers and Specify Value: The starting point is to recognise that only a small
fraction of the total time and effort in any organisation actually adds value for the end
customer. By clearly defining Value for a specific product or service from the end
customer’s perspective, all the non-value activities can be removed (Danford & Matthew,
2007). Identify and Map the Value Stream: The Value Stream is the entire set of activities
across all parts of the organisation involved in jointly delivering the product or service.
This represents the end-to-end process that delivers the value to the customer (Danford &
Matthew, 2007). Create Flow by Eliminating Waste: This involves mapping the value
stream which involves only 5% of activities that add value, this can raise to 45% in a
service environment. Eliminating this waste ensures that your product or service “flows” to
the customer without any interruption, detour or waiting (Jusko & Jill 2007).
Respond to Customer Pull: This is about understanding the customer demand on your
service and then creating your process to respond to this. Such that you produce only what
the customer wants when the customer wants it (Jusko & Jill 2007). Pursue Perfection:

11
Creating flow and pull starts with radically reorganising individual process steps, but the
gains become significant as the entire steps link together. As this happens more and more
layers of waste become visible and the process continues towards the theoretical end point
of perfection, where every asset and every action adds value for the end customer (Kallrath
& Maindl, 2006).
2.3 Components of the Lean Supply Chain Lean supply chain management comprises various elements that are integrated for
efficiency and effectiveness of the organization. Both elements should be present for any
lean enterprise firm in the modern context. Competitive firms need to understand and
measure the extent to which each element adds value in the supply chain (Kallrath &
Maindl, 2006). Components of lean supply chain include; lean suppliers, lean procurement,
lean manufacturing, lean warehousing, lean transportation and lean customers. According
to Lambert, (2012) lean suppliers are able to respond to changes. Their prices are generally
lower due to the efficiencies of lean processes, and their quality has improved to the point
that incoming inspection at the next link is not needed.
Lean suppliers deliver on time and their culture is one of continuous improvement (Jusko
& Jill 2007). To develop lean suppliers, organizations should include suppliers in their
value stream. They should encourage suppliers to make the lean transformation and involve
them in lean activities. This will help them fix problems and share savings. In turn, they
can help their suppliers and set continually declining price targets and increasing quality
goals (Halldorsson, Kotzab, Mikkol, & Skjoett-Larsen, 2007). Some lean procurement
processes are e-procurement and automated procurement. E-procurement conducts
transactions, strategic sourcing, bidding, and reverses auctions using Web-based

12
applications (Kallrath & Maindl, 2006).
Automated procurement uses software that removes the human element from multiple
procurement functions and integrates with financials (Harland, 2012). The key to lean
procurement is visibility. Suppliers must be able to "see" into their customers' operations
and customers must be able to "see" into their suppliers' operations. Organizations should
map the current value stream, and together create a future value stream in the procurement
process (Simchi-Levi & Kaminsky, 2007). They should create a flow of information while
establishing a pull of information and products (Danford & Matthew, 2007). Lean service
systems produce what the customer wants, in the quality the customer wants, when the
customer wants it, and with minimum resources.
According to Lambert (2012) lean warehousing means eliminating non-value added steps
and waste in product storage processes. Typical warehousing functions are; receiving, put-
away/storing, replenishment, picking, packing and shipping (Harland, 2012). Lean
concepts in transportation as suggested by Cooper, (2000) include; core carrier programs,
improved transportation administrative processes and automated functions, optimized mode
selection and pooling orders, combined multi-stop truckloads, cross docking, right sizing
equipment, import/export transportation processes and inbound transportation and
backhauls. The keys to accomplishing the concepts above include mapping the value
stream, creating flow, reducing waste in processes, eliminating non-value-added activities
and using pull processes (Danford & Matthew, 2007). Lean customers are interested in
establishing effective partnerships they are always seeking methods of continuous
improvement in the total supply chain to reduce costs. Lean customers expect value from

13
the products they purchase and provide value to the consumers who they interact with
(FAO, 2007).
Lean thinking is a total internal lean optimization process that emphasizes the prevention of
waste in terms of any extra time, labor, or material spent producing a product or service
that does not add value to it. A lean system’s unique tools, techniques, and methods can
help organization to reduce costs, achieve just-in-time delivery, and shorten lead times
(Lavassani, Movahedi & Kumar, 2009). As lean systems are customer focused and driven
this approach makes sure that products or services produced and delivered at the right time
in the right quantity at the right location at the right time with minimum costs incurred
(Locher, & Drew, 2007).
A lean system allows production of a wide variety of products or services, efficient and
rapid changeover among them as needed, efficient response to fluctuating demand, and
increased quality (Schonberger & Richard, 2007). Lean approach encourages a rapid
response to the customers ever changing demands with focus on mass customizations
rather than mass production. Lean systems make the work flow more efficient, productive,
and flexible to changes in requirements (Simone & Kleiner, 2004).
To develop a lean supply chain, there is need to apply lean to the supply chain as a system
(Simchi-Levi & Kaminsky 2007). To accomplish this, lean thinking changes the focus of
management from optimizing separate technologies, assets, and vertical departments to
optimizing the flow of products and services through entire value streams that flow
horizontally across technologies, assets, and departments to customers. It is through this

14
holistic, enterprise-wide approach to lean implementation that the theory extends beyond
functional strategy to a broader supply chain strategy employed by the company (Simone,
et al, 2004). Eliminating waste along entire value streams, instead of at isolated points,
creates processes that need less human effort, less space, less capital, and less time to make
products and services at far less costs and with much fewer defects, compared with
traditional business systems. Companies are able to respond to changing customer desires
with high variety, high quality, low cost, and with very fast throughput times The strengths
of lean approach are more immediate and practical focus on waste, flow and flexibility
(Stimson and William, 2005). A lean organization optimizes the flow of products and
services to its customers. It delivers customer value by; reducing lead times, improving
quality, eliminating waste, reducing the total costs, engaging and energizing people (Jusko
& Jill 2007).
Lean processes provide a way to do more with less, less human effort, less equipment, less
time, and less space while coming closer and closer to providing customers with exactly
what they want, when they want it, where they want it, and at a price that meets their
cost/value expectations (Simchi-Lev & Kaminsky, 2007). After years of benchmarking and
observation in organizations around the world, Womack & Jones (2009) have found that
converting a classic batch-and-queue production system to lean production helps an
organization achieve the following results for manufacturing: Labor productivity is doubled
all the way through the system for direct, managerial, and technical workers and from raw
materials to delivered product.

15
At the same time, production throughput times are cut by up to 90% with a subsequent
reduction in inventory in the system by up to 90% as well (Cooper, Lambert, & Pagh,
2012). Errors reaching the customer and scrap within the production process are typically
cut in half, as are job-related injuries and other undesirable side-effects of a non-lean
production process(Haag, Cummings, McCubbrey, Pinsonneault, & Donovan, 2006).
Time-to-market for new products is often halved, meaning that a wider variety of products
within product families can be offered at very modest additional cost. The capital
investments required to implement the lean approach are very modest, even negative, if
facilities and equipment can be freed up and sold (Cooper, Lambert, & Pagh, 2012).
2.5 Lean Practices in the Service Industry Implementing lean concepts means breaking old patterns and installing new ones. To
accomplish this, an organization needs a whole new set of tools and a framework for
applying them. Lean processes merge several elements to form an integrated whole, which
aligns the various parts of an organization to make a change of great magnitude (Ketchen &
Hult, 2006). Lean companies work cooperatively with their customers. Creating high levels
of value often requires close relationships with the customers. Value is often added more
by the additional services and close cooperation than by the attributes of the products
themselves (Ketchen & Hult, 2006).
Service quality is perceived by customers is the extent of discrepancy between customer’s
expectations and their perceptions of actual service performance (Simchi-Lev & Kaminsky,
2007). This implies that quality of a service is very subjective and cannot be grasped in
easy indicators like in manufacturing. However some dimensions of quality in service
operations can be described as tangibles, reliability, responsiveness, assurance and empathy

16
(Cooper, Lambert, & Pagh, 2012). In order know the dimensions classification can help to
organize and structure the different aspects, which need to be considered for the
management of services. There are many ways to structure the manifold types of services
offered in the market (Schonberger & Richard, 2007). Services can be roughly categorized
in personal services, infrastructure services, distribution services, government services,
business services, manufacturing services, and value added services.
Generally, Lean approach is a systematic approach to identify and eliminate elements of a
process that do not add value to the final outcome of the process (Kallrath, & Maindl,
2006). Lean can be seen as a concept addressing the quality, cost and delivery of a
company’s business processes by using an integrated set of principles, methods and tools.
Furthermore, Lean is a philosophy of leadership, teamwork and problem solving, resulting
in a process of continuous improvement throughout the entire organization by focusing on
the needs of the customer, empowering employees. Thus lean centers the process that
delivers and is less about its final outcome, the actual product or delivery respectively
(Schonberger & Richard, 2007).
Furthermore, services can be distinguished according to the degree of customer
involvement and repeatability of tasks performed in service production. Schemmer
proposed the service process matrix to demonstrate that service management problems are
common among different service industries (Schemmer, 1986). Within this matrix, services
are classified according to two dimensions that significantly affect the character of the
service production and delivery process. The repeatability on the ordinate is considered
from the service organization’s point of view and refers to similarity by stage rather than by

17
individual customer (Lavassani, Movahedi & Kumar, 2009).
While the broad stages may have high repeatability, the detailed tasks to be done may be
very dissimilar. On the abscissa customer involvement refers to the frequency with which
service providers get in contact with the actual (external) customers. It does not take into
account the length of contact between provider and customer; rather it describes the ability
of the customer to affect the nature of the service being delivered personally. The
boundaries in this figure are not as strict as displayed. In reality they are fuzzy and can be
considered as continuous spectrums (Simchi-Lev & Kaminsky, 2007).
Service organizations require special management approaches that go beyond simply
adapting management techniques prevailing in manufacturing organizations. The
distinctive characteristics discussed above enhance the view to managerial service
approaches to a systems view including the customer as a participant in the service process.
Thus the customer should be considered as an input that is being transformed by the service
process into an output with some degree of satisfaction (Locher, & Drew, 2007). The
position of a service operations manager includes both production and marketing in an
open system with the customer as a partner in the value creation process. The traditional
manufacturing separation of the production and marketing functions with finished-goods
inventory as an interface is neither possible nor appropriate in service organizations. By
necessity, the operations and marketing functions are integrated for service organizations
(Simchi-Lev & Kaminsky, 2007).

18
Customer expectations and satisfaction is highly subjective and is difficult to grasp and
measure. Simultaneity of production and consumption of services requires accurate time
planning with respect to potential adaption due to suddenly adjusted customer specification
(Simchi-Lev & Kaminsky, 2007). Managing customer experience is as important as
managing the actual outcome of service processes. The invisible nature of service processes
makes them far more difficult to manage compared to manufacturing processes. It is often
impossible to overlook material flow in service processes and to keep track where any
given piece of work is located at any point in time. In addition service processes and their
activities are often much more complex than manufacturing activities, which even more
complicates service management (Lavassani, Movahedi & Kumar, 2009).
In order to create commitment for lean implementation, specific target setting, time- and
resource-planning for the improvements should be contracted and agreed with all the staff
and continuously updated and communicated. The major difficulties many companies
encounter in attempting to apply Lean are a lack of direction, a lack of planning, and a lack
of adequate project sequencing. The knowledge of tools in particular and techniques is
often not considered as a problem. For implementing lean successfully, the service
managers have to determine what the business customer needs, what the employees are
connected with, and what the senior leaders support (Simchi-Lev & Kaminsky, 2007).
Change initiatives are often supported and represented through a person who is responsible
for triggering, overlooking and moderating the change processes. This concept should also
be applied in doing a lean transformation in a service organization (Lavassani, Movahedi &
Kumar, 2009).: an influential person with strong multidisciplinary expertise and strong

19
social skills can act as a process manager or value stream manager, supervising cross
functional teams elaborating the improvements on an operational basis (Lavassani,
Movahedi & Kumar, 2009). Ultimately, for lean implementation in an organization it is
beneficial to start with adopting lean principles to one certain part of the organization as a
‘test balloon’. Setting up a model rollout in one area of the organization as a fully
functioning microcosm of the entire process allows senior managers to conduct
experiments and smooth out the kinks. It also entails excitement among all employees
enterprise wide paving the way for the broad transformation effort that follows up (Ketchen
& Hult, 2006).
2.6 Lean Supply Chain Management Strategies and Performance Lean supply chain management strategies entail; customer relationship management,
customer service management, demands management and supplier relationship. Lean
systems provide value addition services to customer service delivery in the market and they
include; speed and responsiveness to customers, reduced inventories, reduced inventories,
supply chain as a competitive weapon, path forward to a lean supply chain, new product
development. According to Kouvelis, Chambers and Wang (2006) lean systems allow a
supply chain to not only to be more efficient, but also faster. As the culture of lean takes
over the entire supply chain, all links increase their velocity. A culture of rapid response
and faster decisions becomes the expectation and the norm. Slow response or no response
becomes the exception, rather than the rule (Jusko & Jill, 2007).
In the lean paradigm, inventory is considered waste (Veykus, Renee, & Erin, 2006). Many
companies today produce directly into trailers and maintain no other finished goods
inventory. All quality inspections and checks are performed within the process, rather than

20
after production are complete. In this true make-to-order scenario, all goods are shipped
directly to the next link in the supply chain when the trailer is full, and overproduction is
not possible and cannot be tolerated. No space is designated to store finished goods (Hines,
2004). The system is not designed to carry them. The elimination of bottlenecks is one goal
of a lean supply chain, but a bottleneck will always exist to some degree. Raw material
inventory is a different matter. Although the leanest organizations have arranged just in
time deliveries to support manufacturing, this approach requires the absolute highest degree
of competency and coordination within the supply chain (Veykus, Carter & Erin, 2006).
According to Cooper (2012), traditional mass production tries to minimize unit costs by
increasing total production over the life cycle of the product. High development costs are
the result of this model. To recover the enormous development and initial capital costs
sunk into the product before it was produced; mass producers forecast and run long
production cycles. Consumer preferences and variety suffer in this scenario. Costs still
need to be minimized, but not at the expense of what more sophisticated consumers now
demand (Kallrath & Maindl, 2006). A strong supply chain enables the member companies
to align themselves with each other and to coordinate their continuous improvement efforts
(Kallrath & Maindl, 2006). This synthesis enables even small firms to participate in the
results of lean efforts. Competitive advantage and leadership in the global marketplace can
only be gained by applying lean principles to the supply chain. Thought, commitment,
planning, collaboration, and a path forward are required (Chow et al, 2008).
According to Chow et al. (2008) Lean is a cooperative process for survival and for success.
Supply chains that want to grow and continue to improve must adopt lean. Lean concepts

21
require an attitude of continuous improvement with a bias for action. The concepts of lean
apply to all elements of the supply chain, including support departments such as product
development, quality, human resources, marketing, finance, purchasing, and distribution.
The challenge is to bring all of these areas out of their traditional silos and make them work
together to reduce waste and create flow. Duplication and a lack of appropriate and timely
communication run rampant in these traditional organizations. A lean supply chain is
proactive and plans for the unexpected by positioning all resources for effectiveness.
Downturns in demand can be addressed without layoffs or significant productivity losses
(Larson & Halldorsson, 2004).
Movahedi, Lavassani and Kumar, (2009) lean promotes minimizing new product
development time and expense. This delivers the product to market faster, making it easier
to incorporate current requirements into the product. Lean also promotes the use of less
capital-intensive machines, tools, and fixtures, which results in more flexibility and less
initial cost to recover (Schonberger & Richard, 2007). As a result, product life cycles may
be shorter and product developments incorporated in newer versions of the product more
frequently. Profitability does not suffer and brand loyalty is increased, as customers prefer
to buy products and services from a perceived innovator (Kallrath & Maindl, 2006).
2.7 Empirical Studies A study carried out by Wainaina (2009) on supply chain management best practices in
large private manufacturing firms in Kenya" identified that lean enterprises experience
challenges like; insufficient monitoring and control to the suppliers’ delivery time, lack of
suppliers engagements, lack of supply chain integration, and collaboration especially with
trade marketing and distribution teams, lack of close inventory review out of not having

22
periodical checks, lack of clear responsibility line inside supply chain management, lack of
understanding and visibility to the desired marketing activities, lack of understanding and
recognition to the production constraints and management, as well as capacity planning
A study carried out by Awino (2009) on selected strategy variables on firm’s performance:
A study of supply chain management in large private manufacturing firms in Kenya
indicated that various challenge which include; resistance to change by management and
inadequate technology to support the concept were key hindrances of the practice. The key
aspect of supply chain management practices according to Tan et al (2002) were supply
chain integration, information sharing, customer service management, geographic
proximity, and JIT capabilities. Simone and Kleiner (2004) focused on five practices at
supply chain level that are a key to create supply chain responsiveness. They include
outsourcing, strategic supplier partnerships, customer relationship, information sharing, and
product modularity. Locher and Drew (2007) also conducted the research regarding supply
chain management practices; they investigated long-term relationship, cross-functional
teams, supplier base reduction, and supplier involvement.
The same with McManus and Kevin (2007) also examined in their study long-term
relationship, information sharing, cooperation process integration and supply chain
leadership underlying the supply chain management practices. Schonberger and Richard
(2007) identified supply chain management practices in form of strategic supplier
partnership, customer relationship, and information sharing. This research adopts the same
supply chain management practices (supplier partnership, customer relationship and
information sharing) (Simone, Andrew, Kleiner & Brian 2004).

23
2.8 Lean Supply Chain Management Strategies This section outlines the customer relationship management strategy, customer service
management strategy, demand management strategy and supplier relationship management
strategy.
2.8.1. Customer Relationship Management Strategy Customer relationship management strategies entail; identify customers and values where
only a small fraction of the total time and effort in any organization adds value for the end
customer. By clearly defining value from the end customer's perspective, all the non-value
activities can be targeted for removal. Identify and map the value stream will represent the
end-to-end process that delivers value to the customer; understand their needs and identify
how you are delivering on them. Create flow by eliminating waste like when the value
stream is first mapped, only 5% of activities add value. Eliminating this waste ensures the
product or service 'flows' to the customer without any interruption, detour or waiting
(Muloko, 2012).
Establish/respond to customer pull by understand the customer demand and create the
process to respond to this, so that only what the customer wants when they want it, is
produced and finally, seek perfection through creating flow and pull shows more and more
layers of waste as the process continues towards theoretical perfection, where every asset
and every action adds value for the end customer. Lean Thinking hones working practices
so that people, materials and resources operate together to eliminate waste, allowing the
project to run at optimum efficiency. In Lean Thinking, every activity undertaken can be
considered in terms of whether it adds value or falls into one of the eight classes of waste:

24
overproduction, waiting, transportation, non-value-added processing, inventory, under-
utilizing people, defects and motion (Wainaina, 2009).
2.8.2 Customer Service Management Strategy Effective lean strategies will lead to improved quality service delivery to customers in the
banking industry hence improved performance of the commercial banks in terms of
revenue growth and expanded market share. Reliability, responsiveness, tangibles,
assurance, and empathy encompass quality aspects of banking services from customer
point of view (Kotler, 2007). To develop effective lean supply chain management
strategies, managers need insights into how the various attributes of a service are valued by
the current and prospective customers within that segment; they should integrate business
with technology, engage people, and adopt best practices for value addition and results.
2.8.3 Demand Management Strategy Demand management is a unified method of controlling and tracking business unit
requirements and internal purchasing operations. It helps organizations remain engaged in
their supplier relationships and related advantages. Organizations use demand management
systems to address external spending factors, arrange purchase orders and eradicate waste.
(Wainaina, 2009). Demand management focuses on the volume of products that are
purchased from providers, rather than individual product pricing, in contrast to
conventional sourcing initiatives. Demand management is also known as consumption
management or strategic spend management. Demand management begins with an in-depth
perception of existing business requirements, historical buying behavior and expected
requirement for the service or product sourced by an organization. This research includes
an assessment of purchase orders, service or product specifications and strategic business

25
plans (Afei, 2010).
Building overall performance measures and essential performance indicators is vital to
keeping track of demand and potential intervention. The accumulated data can result in
better demand forecasts, which may be incorporated with an extensive supplier-
communications program. These details help suppliers handle assets more effectively,
which reduces expenditures (Odoyo and Awino, 2009). Advantages of demand
management include; screens the growth and decline of the quantity of transactions
between suppliers, monitors all related expenditures, illustrates the reasoning behind
continuing to strengthen supplier relationships - internally and externally. Demand
management is developing into a widely accepted strategy preferred across a variety of
organizations and sectors, like telecom and financial institutions. Many organizations that
use demand management to target indirect spent sections also use the approach for more
complicated spent categories, such as travel, direct materials and technology (Muloko,
2012).
2.8.4 Supplier Relationship Management Strategy
Supplier relationship management (SRM) is the discipline of strategically planning for, and
managing, all interactions with third party organizations that supply goods and/or services
to an organization in order to maximize the value of those interactions. In practice, SRM
entails creating closer, more collaborative relationships with key suppliers in order to
uncover and realize new value and reduce risk. In practice, SRM expands the scope of
interaction with key suppliers beyond traditional buy-sell transactions to encompass other
joint activities which are predicated on a shift in perspective and a change in how
relationships are managed, which may or may not entail significant investment (Muloko,

26
2012).
Supplier relationship management (SRM) is the systematic, enterprise-wide assessment of
suppliers’ assets and capabilities with respect to overall business strategy, determination of
what activities to engage in with different suppliers, and planning and execution of all
interactions with suppliers, in a coordinated fashion across the relationship life cycle, to
maximize the value realized through those interactions (Odoyo and Awino, 2009). The
focus of SRM is to develop two-way, mutually beneficial relationships with strategic
supply partners to deliver greater levels of innovation and competitive advantage than
could be achieved by operating independently or through a traditional, transactional
purchasing arrangement. Effective SRM requires not only institutionalizing new ways of
collaborating with key suppliers, but also actively dismantling existing policies and
practices that can impede collaboration and limit the potential value that can be derived
from key supplier relationships (Muya, 2011).
2.9 Conceptual Framework
Figure 1; Conceptual Framework
Independent Variables Dependent Variables
(Author, 2014)
Customer Relationship Management Strategy
Performance of Commercial Banks In terms of:
Return on Investment Minimal costs of operation Customer satisfaction Minimal wastage
Customer Service Management Strategy
Demand Management Strategy
Supplier Relationship Management Strategy

27
CHAPTER THREE: RESEARCH METHODOLOGY
3.1 Introduction This section outlines; research design target population, data collection methods and
techniques and data analysis method.
3.2 Research Design Krishnaswami (2003) defined the research design as an arrangement of conditions for
collection and analysis of data in a manner that aimed to combine relevance to the
research purpose with economy in procedures. Therefore, the design is a framework used
to attach the research components together. This part dealt with the methodology and
procedures that were used in the study. The research design therefore is seen as a
conceptual structure within the research conducted with an intention to explore new
knowledge to a recent study.
This study adopted descriptive survey research design aimed at establishing the Influence
of Lean Supply Chain Management Strategies on Performance of Commercial Banks in
Kenya. A descriptive study was concerned with finding out the what, where and how of a
phenomenon and a cross-sectional survey design was chosen since in cross-sectional
surveys, data was collected at one point in time from sample selected to represent a larger
population (Mugenda, 2003). The descriptive study aimed at obtaining information that
could be analyzed, patterns extracted and comparison made for the purpose of clarification
and provision of basis for making decisions. Both qualitative and quantitative data was
obtained for comparison purposes.

28
3.3 Population The target population for this study included 43 Commercial Banks operating in Kenya.
One employee was selected from the procurement and operations department of each of the
43 Commercial Banks in Kenya. A census was conducted since the population was small;
43 commercial banks in Kenya
3.4 Data Collection Primary data was collected using structured questionnaires with both close-ended and
open-ended questions. The respondents of the study were selected from the supply chain
department team of the 43 Commercial Banks in Kenya. Primary data was collected from
respondents who were based in the head office; one employee; that was the head of
operations and the other head of procurement or their equivalent was selected from the 43
Commercial Banks in Kenya by the use of questionnaires as the main instruments of data
collection (See appendix II). Questionnaires were administered to respondents by the
researcher during working hours. Drop and pick later method were applied where
respondents had no time to respond immediately. Secondary data was gathered from library
material, bank journals and reports, media publications and various Internet search engines
covering the business process management of Commercial Banks in Kenya.
3.5 Validity and Reliabi1ity of Research Instrument Validity of the research instrument was determined through seeking opinions of experts
in the field of study especially in the department of Procurement in Commercial Bank
operating in Nairobi County. This facilitated the necessary revision of the research
instrument. Reliability of the research instrument was enhanced through a pilot study
that was carried on 2 Commercial Banks operating in Nairobi County, Kenya.

29
3.6 Data Analysis The data collected in the research was edited, coded and entries made into statistical
software (Statistical Package for Social Sciences, SPSS version 20). This involved
converting quantitative (nominal and ordinal data) into numerical codes. The first objective
was analyzed qualitatively since the respondents’ opinion and views were evaluated by the
researcher. The second objective was analyzed using multiple linear regression analysis to
establish the relationship between independent variables (Customer Relationship
Management Strategy, Customer Service Management Strategy, Demand Management
Strategy and Supplier Relationship Management Strategy) and dependent variable
(Performance of Commercial Banks). Descriptive statistics such as frequency distributions,
percentages and frequency tables were used to summarize and relate variables which were
attained from the administered questionnaires.

30
CHAPTER FOUR: DATA ANALYSIS AND INTERPRETATION
4.1 Introduction This study was carried out to establish the impact of lean supply chain management
strategies on the performance of commercial banks in Kenya. Data was collected from
supply chain managers, procurement managers and operations managers who were in
charge of supply chain functions in their respective banks. The findings are presented as
follows;
4.2 Response Rate A total of 55 questionnaires were distributed to commercial banks through their
headquarters based in Nairobi. Out of the 55 questionnaires, 43 were returned to the
researcher. This represents a response rate of 99%. This percentage was considered
sufficient for this study. The high response rate was achieved due to face to face
administering of the questionnaires by the researcher.
4.3 Bank Operation
The respondents of the study were asked to indicate the period of which their banks
operated in the Kenyan market. The following were the findings as shown in Table 4.1
below:

31
Table 4.1 Bank Operation Years Frequency Percentage (%) 5 – 10 years 6 13%
11 – 15 years 9 20%
16 – 20 years 15 34%
Over 20 years 12 28%
Less than 5 years 0 0%
Total 43 100
Source: Research Data (2014)
As shown in Table 4.1, 34% of the respondents indicated that their banks had operated for
a period of 16-20 years. 28% of them indicated that their banks had operated for a period of
over 20 years in the local market.20% indicated that their banks had operated between 11-
15 years. 13% indicated that they had operated for a period of 5-10 years. None of them
indicated less than 5 year.
4.4 Size of the Bank
The respondents of the study were asked to indicate the size of their banks. The following
were the findings as shown in Table 4.2 below:

32
Table 4.2: Size of the Bank Size Frequency Percentage (%) Large 32 74%
Medium 6 13%
Small 2 5%
Total 43 100
Source: Research Data (2014)
As shown in Table 4.2, 74% of the respondents indicated that their banks were large size
based on the market share and asset base. 13% of them indicated that they were medium
size while 5% of them were small size.
4.5 Lean Supply Chain Management Strategies
The researcher wanted to establish whether respondents understood lean supply
management strategies. Majority (90%) of them indicated that they understood lean supply
chain management strategies since they applied them for efficiency and effectiveness.
4.5.1 Customer Relationship Management Strategy
The respondents of the study were asked to indicate the extent to which they applied
customer relationship management strategy. The following were the findings as shown in
Table 4.3 below:

33
Table 4.3: Customer Relationship Management Strategy N To a
Very Large Extent
[5]
To a Large Extent
[4]
To a moderate
Extent
[3]
To a small
Extent
[2]
Not At all
[1]
Mean Score
Total S.E
Continuous research is
conducted on customer
products/service
43 4.6 22.2 12.4 61.0 0.00 2.41 100 .194
Customers are attracted
and maintained
43 4.5 22.2 12.1 61.1
0.00 2.23 100 .194
There is close
relationship with
customers
43 0.00 0.00 0.00 18.1 82.0 2.23 100 .194
There are minimal
human interaction
during service delivery
43 4.8 22.1 0.00 12.3 61.4 2.17 100 .194
Reduced waiting time
is experienced by the
customer
43 4.6 0.00 12.3 61.2 22.3 2.17 100 .194
Customers access
services without delay
43 4.9 12.2 22.2 61.0 0.00 2.09 100 .194
Customers are given an
opportunity to measure
the service they get
43 0.00 0.00 17.1 34.1 48.8 2.06 100 .105
Source: Research Data (2014)
As shown in Table 4.3, 61% of the respondents indicated that continuous research on
products and services by their banks were on a small extent due to costs that were
associated with a mean of 2.41. 61% of them indicated that little efforts were put in place
by their commercial banks to attract customers and maintain long term relations since their
banks did not carry out periodical research with a mean of 2.23. 61% of them said that
there was human interaction during customer service delivery due to inadequate technology

34
in the value chain activities with a mean of 2.17.
Majority, 61% of them indicated that customers did not experience reduced waiting time
since most of the services were not automated with a mean of 2.17. Majority (61%) of the
respondents indicated that customers experienced delays in service access and this affected
their satisfaction with a mean of 2.09.48% of the respondents indicated that customers were
not given an opportunity to measure services they got from their commercial banks due to
poor mechanisms of measurement that were in place with a mean of 2.06.
4.5.2 Customer Service Management Strategy
The respondents of the study were asked to indicate the extent to which they applied
customer service management strategy. The following were the findings as shown in Table
4.4 below:
Table 4.4: Customer Service Management Strategy N To a
Very Large Extent
[5]
To a Large Extent
[4]
To a moderate
Extent
[3]
To a small
Extent
[2]
Not At all
[1]
Mean Score
Total S.E
Customers rely the
bank services always
43 2.4 2.4 17.1 26.8 51.2 4.22 100 .154
Customers are royal
due to satisfaction
43 0.00 0.00 29.3 41.5 29.3 4.00 100 .121
Technology enhance
customers service
43 22.2 2.2 39.0 2.4 34.1 4.00 100 .148
Minimal complaints
are experienced
43 0.00 2.2 34.4 39.0 24.4 3.85 100 .129
Timely feedback is
given to customers
43 0.00 2.1 34.2 39.0 24.4 3.85 100 .110
Customers get instant 43 4.9 4.8 22.0 24.4 43.9 3.78 100 .162

35
solutions without delay
Minimal employee
motion at the
workplace
43 4.9 4.7 22.0 24.4 43.9 3.78 100 .162
There is good
communication among
workers and
employees
43 0.00 34.2 17.1 48.7 0.00 2.11 100 .105
Minimal waste of
unused human talent
43 0.00 0.00 17.1 33.6 48.5 2.11 100 .105
Customers express
their views on services
they want
43 0.00 22.4 21.7 56.1 0.00 2.10 100 .109
Source: Research Data (2014)
As shown in Table 4.4, 51% of the respondents indicated that they did not rely on bank
services always due to delays experienced and system failure in some cases when
customers were too many with a mean of 4.22. 46% of them indicated that they were loyal
to their banks at a small extent due to poor services accessed with a mean of 4.00. 39% of
them indicated that technology influenced service delivery at a moderate extent despite the
challenges of the bank to implement and customer resistance to new technology with a
mean of 4.00. 39% of them indicated that there were customer complaints due to
challenges experienced during service access.
The challenges were due to delays in the system to transact and system failure in some days
with a mean of 3.85. 39% of them indicated that they did not get instant feedback
concerning the status of their financial statements in time due to system failure with a mean
of 3.85. 41% of them indicated that they did not get instant solutions on their problems as
complex procedures associated with paper work were slowing down their drive to be
services with a mean of 3.78. 41% of them indicated that there were a lot of movement of

36
workers within the premised due to lack of integrated system with a mean of 3.78. 49% of
them indicated that there were imbalances in employee responsibilities with a mean of
2.11. This was due to unclear role specification and measurement of individual workload
with a mean of 2.11. 56% of them indicated that customers were given an opportunity to
express their views on the services they received at a minimal extent with a mean of 2.10.
This was due to lack of proper mechanisms to measure customer satisfaction among
commercial banks.
4.5.3 Demand Management Strategy
The respondents of the study were asked to indicate the extent to which they applied
demand management strategy. The following were the findings as shown in Table 4.5
below:
Table 4.5: Demand Management Strategy N To a
Very Large Extent
[5]
To a Large Extent
[4]
To a moderate
Extent
[3]
To a small
Extent
[2]
Not At all
[1]
Mean Score
Total S.E
The bank has
alternative means of
meeting customer
demands
43 4.9 4.9 22.0 24.4 43.9 3.78 100 .162
The bank uses
technology to
overcome
overwhelming demand
43 4.9 4.9 22.0 24.4 43.9 3.78 100 .162
The bank anticipate
customer demands in
advance
43 24.3 4.9 22.0 43.9 4.9 3.78 100 .162

37
The bank utilizes
resources effectively to
meet customer
demands
43 0.00 22.3 0.00 22.0 56.1 3.63 100 .109
The bank uses models
to analyze forces of
demand and supply
43 0.00 22.0 22.1 56.1 0.00 3.63 100 .109
The bank minimizes
waste through planning
43 0.00 22.3 22.3 56.3 0.00 3.63 100 .109
Source: Research Data (2014)
As shown in Table 4.5, 44% of the respondents indicated that the bank did not have
alternative means of meeting customer demands with a mean of 3.78. This was due to poor
consumer research and continuous improvement of services. 44% of them indicated that the
bank did not use modern technology to overcome overwhelming demand in the market
with a mean of 3.78. This was associated with internal and external challenges. Employee
resistance to adopt new technology and lack of support from top level management were
major challenges.44% of them indicated that the bank did not anticipate customer demands
in advance due to changing external business environment and customer needs and wants
with a mean of 3.78. 56% of them indicated that the bank did not utilize resources
effectively to meet customer needs and wants due to poor internal control mechanisms used
by their banks with a mean of 3.63. 56% of them indicated that the bank analyzed forces of
demand and supply and minimized planning on a small extent with a mean of 3.63.
4.5.4 Supplier Relationship Management Strategy The respondents of the study were asked to indicate the extent to which they applied
supplier relationship management strategy. The following were the findings as shown in
Table 4.6 below:

38
Table 4.6 Supplier Relationship Management Strategy N To a
Very Large Extent
5]
To a Large Extent
[4]
To a moderate
Extent
[3]
To a small
Extent
[2]
Not At all
[1] Total (%)
Mean Score S.E
There is mutual
relationships among
stakeholders
40 0.00 22.0 17.9 60.3 0.00 100 3.13 .109
Suppliers are selected
based on quality
40 0.00 22.0 27.7 40.2 0.00 100 2.80 .109
There is close
collaborations with
suppliers
40 0.00 22.0 29.9 48.0 0.00 100 2.80 .194
Suppliers are sourced
through online
40 0.00 22.0 32.5 0.00 45.3 100 2.80 .194
Suppliers are vetted
by quality
management boards
40 0.00 48.8 0.00 0.00 62.4 100 2.11 .105
Suppliers are
maintained for long
term
40 0.00 12.0 0.8 0.00 80.4 100 2.10 .109
Suppliers are always
are sources from the
global markets
40 0.00 22.0 5.5 0.00 72.3 100 2.10 .109
Source: Research Data (2014)
As shown in Table 4.6, 60% of the respondents indicated that mutual relationship among
stakeholders was on a small extent with a mean of 3.13. This was due to lack of proper
mechanisms of customer relationship management by most of the commercial banks. 40%
of the respondents indicated that suppliers were selected based on quality at a small extent
close collaborations were minimal with a mean of 2.80. This was due to stiff competition

39
and globalization challenges. 45% of them indicated that suppliers were not sourced
through online due to challenges of technology in the system and employee resistance with
a mean of 2.80. 62% of them indicated that suppliers were not vetted by quality
management boards due to inadequate time and lack of policies of vetting with a mean of
2.11. 80% of them indicated that suppliers were maintained for long term period on a
minimal extent due to competition challenges with a mean of 2.10. Finally suppliers were
not sources from the global market due cost implication with a mean of 2.10.
4.5.5 Benefits of Lean Supply Chain Management Strategies The respondents of the study were asked to indicate the Benefits of Lean Supply Chain
Management Strategies. The following were the findings as shown in Table 4.7 below:
Table 4.7: Benefits of Lean Supply Chain Management Strategies Benefits N To a
Very Large Extent
5]
To a Large Extent
[4]
To a moderate
Extent
[3]
To a small Exten
t
[2]
Not At all
[1]
Mean Score
S.E
Improved supplier and
logistics performance
43 43.7 0.00 22.0 24.4 4.7 3.76 .162
The ability to deliver
every time at the same
cost to the business
43 43.5 0.00 22.0 24.4 4.6 3.74 .162
Predictable throughput
times from better labor
utilization
43 43.8 0.00 22.0 24.4 4.7 3.68 .162
Improved working capital
positions from reduced
inventory
43 43.9 0.00 22.0 24.4 4.9 3.64 .162
Lower warranty and
customer service costs
43 43.9 0.00 22.0 24.4 4.9 3.64 .162
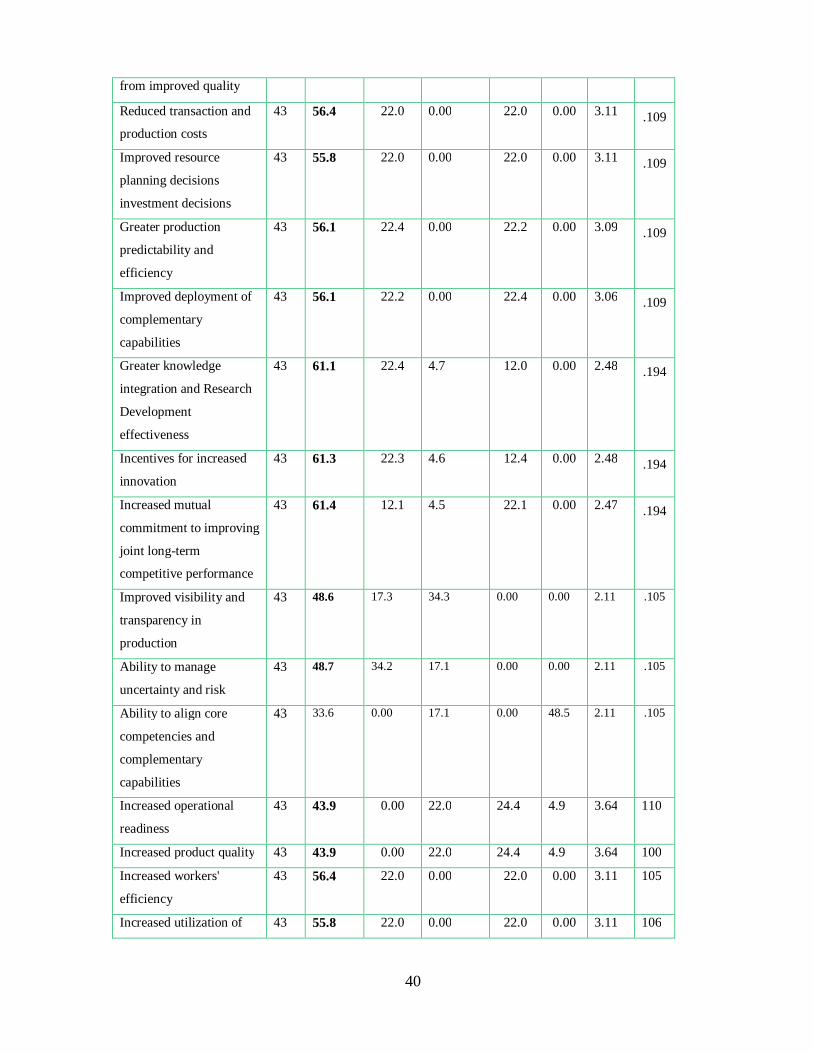
40
from improved quality
Reduced transaction and
production costs
43 56.4 22.0 0.00 22.0 0.00 3.11 .109
Improved resource
planning decisions
investment decisions
43 55.8 22.0 0.00 22.0 0.00 3.11 .109
Greater production
predictability and
efficiency
43 56.1 22.4 0.00 22.2 0.00 3.09 .109
Improved deployment of
complementary
capabilities
43 56.1 22.2 0.00 22.4 0.00 3.06 .109
Greater knowledge
integration and Research
Development
effectiveness
43 61.1 22.4 4.7 12.0 0.00 2.48 .194
Incentives for increased
innovation
43 61.3 22.3 4.6 12.4 0.00 2.48 .194
Increased mutual
commitment to improving
joint long-term
competitive performance
43 61.4 12.1 4.5 22.1 0.00 2.47 .194
Improved visibility and
transparency in
production
43 48.6 17.3 34.3 0.00 0.00 2.11 .105
Ability to manage
uncertainty and risk
43 48.7 34.2 17.1 0.00 0.00 2.11 .105
Ability to align core
competencies and
complementary
capabilities
43 33.6 0.00 17.1 0.00 48.5 2.11 .105
Increased operational
readiness
43 43.9 0.00 22.0 24.4 4.9 3.64 110
Increased product quality 43 43.9 0.00 22.0 24.4 4.9 3.64 100
Increased workers'
efficiency
43 56.4 22.0 0.00 22.0 0.00 3.11 105
Increased utilization of 43 55.8 22.0 0.00 22.0 0.00 3.11 106

41
machines and space
Reduced of machine
failures
43 56.1 22.4 0.00 22.2 0.00 3.09 .109
Compressed cycle times 43 56.4 22.0 0.00 22.0 0.00 3.11 .109 Reduced logistics costs 43 55.8 22.0 0.00 22.0 0.00 3.11 .109 Increased inventory levels 43 56.1 22.4 0.00 22.2 0.00 3.09 .109 Increased supply chain
visibility
43 56.1 22.2 0.00 22.4 0.00 3.06 .109
Improved supplier and
logistics performance
43 61.1 22.4 4.7 12.0 0.00 2.48 .194
Source: Research Data (2014)
As shown in Table 4.7, majority of the respondents indicated that the lean supply chain
management strategies added value addition to their system. Some of these values were;
Improved supplier and logistics performance, The ability to deliver every time at the same
cost to the business, Predictable throughput times from better labor utilization, Improved
working capital positions from reduced inventory, Lower warranty and customer service
costs from improved quality, Reduced transaction and production costs , Improved resource
planning decisions investment decisions , Greater production predictability and efficiency ,
Improved deployment of complementary capabilities , Greater knowledge integration and
Research Development effectiveness, Incentives for increased innovation, Increased mutual
commitment to improving joint long-term competitive performance, Improved visibility
and transparency in production, Ability to manage uncertainty and risk, Ability to align
core competencies and complementary capabilities, Increased operational readiness,
Increased product quality, Increased workers' efficiency Increased utilization of machines
and space, Reduced of machine failures, Compressed cycle times, Reduced logistics costs,
Increased inventory levels, Increased supply chain visibility and Improved supplier and
logistics performance.

42
CHAPTER FIVE: SUMMARY, CONCLUSION AND RECOMMENDATIONS
5.1 Introduction
This study was carried out to establish the impact of lean supply chain management
strategies on the performance of commercial banks in Kenya. This chapter presents the
summary of findings for the objectives of this study, gives conclusions, recommendations
based on the findings of the study and the suggestions on areas that need to be researched
as far as this concept is concerned.
5.2 Summary of Findings
The study established that customer relationship management strategy was not a common
practice among commercial banks in Kenya as a lean strategy. This was characterized by;
lack of continuous research on products and services lack of long term relations with
customers, high human interaction during customer service delivery due to inadequate
technology in the value chain activities, increased waiting, delays during service access and
lack of appropriate mechanisms to measure customer satisfaction. Lean companies work
cooperatively with their customers (Ketchen & Hult, 2006).
The study established customer service management strategy was applied at a minimal
extent as a lean practice among commercial banks in Kenya. This was characterized by
delays experienced and system failure in some cases when customers were too many, lack
of appropriate technology to improve customer experience, customer complaints due to
challenges experienced during service access, lack instant feedback concerning the status

43
of their financial statements in time due to system failure, lack of integrated system,
customers were given an opportunity to express their views on the services they received.
Value is often added more by the additional services and close cooperation than by the
attributes of the products themselves (Ketchen & Hult, 2006)
The study found out that demand management strategy was not applied as a lean
management strategy at a great extent by most of the commercial banks. This was due to;
bank did not have alternative means of meeting customer demands, banks did not use
modern technology to overcome overwhelming demand, changing external business
environment and customer needs and wants poor utilization of resources effectively to meet
customer needs and wants. Service quality is perceived by customers is the extent of
discrepancy between customers’ expectations and their perceptions of actual service
performance ( Simchi-Lev & Kaminsky, 2007).
The study found out that supplier relationship management strategy was not a common lean
strategy among commercial banks in Kenya. This was due to; poor mutual relationship
among stakeholders, lack of proper mechanisms of customer relationship management,
failure to select suppliers based on quality due to stiff competition and globalization
challenges, technology was not embraced during sourcing of suppliers, suppliers were not
vetted by quality management boards due to inadequate time and lack of policies of vetting
and finally suppliers were not sources from the global market due cost implication. The
study also established that there was a positive relationship between independent variables
and performance of commercial banks in Kenya. Lean can be seen as a concept addressing

44
the quality, cost and delivery of a company’s business processes by using an integrated set
of principles, methods and tools (Schonberger & Richard, 2007).
5.3 Conclusions The study concludes that most commercial banks in Kenya have been embracing lean
supply chain management strategies despite the challenges experienced form the internal
and external environment. Lean supply chain management strategies have assisted the
commercial banks to enhance the performance form the financial and non-financial
perspective. This is supported by the results from a regression analysis conducted that
indicated that there is a strong relationship between lean supply chain strategies and
performance of commercial banks in Kenya. To gain competitive edge in the financial
industry, commercial banks have no choice other than implementation of the lean strategies
for survival.
5.4 Recommendations
The study established that customer relationship management strategy was not a common
practice among commercial banks in Kenya as a lean strategy. Therefore, this study
recommends that top level management to make customer relations a culture of the
organization by training new and existing employees.
The study established customer service management strategy was applied at a minimal
extent as a lean practice among commercial banks in Kenya. Therefore, this study
recommends that management to integrate ICT in customer service delivery.

45
The study found out that demand management strategy was not applied as a lean
management strategy at a great extent by most of the commercial banks. Therefore, this
study recommends that management should invest in modern models of analyzing demand
and supply trends in order to overcome the challenge of overwhelming demand.
The study found out that supplier relationship management strategy was not a common lean
strategy among commercial banks in Kenya. Therefore, this study recommends that
commercial banks should strive and maintain long term relationships for quality of
products and services.
5.5 Limitations of the Study It was such an uphill task for the researcher to convince the respondents to participate in
the study. Commercial banks are known to work under very strict confidentiality in order to
secure any unauthorized access to information. Most of the respondents agreed to
participate on condition that the information will not be divulged to any other party other
than for academic purposes only.
The findings of this study and application thereof are limited to commercial banks in
Kenya. They may not be applicable directly to other organizations operating outside the
Kenyan banking industry. It is therefore important to note that they can only be used for
comparative purposes and not any direct application in another country.
5.6 Suggestions for Further Research Future studies should explore the reasons behind the Challenges of lean supply chain
management strategies applied by commercial banks in Kenya. Factors Affecting the

46
Implementation of lean supply chain management Strategies among commercial banks
should be investigated. Researchers should go ahead and establish the reasons behind the
failure of lean supply chain management strategy implementation hence establish long term
solutions. Future studies will minimize the challenges experienced during lean supply chain
management strategy implementation. Future studies should try to investigate the
relationship between lean strategies and performance of commercial banks in Kenya.

47
REFERENCES
Andreas Wieland, Carl Marcus Wallenburg (2011): Supply-Chain-Management in
stürmischen Zeiten. Berlin.
Awino H. Y. (2009). Selected Strategy Variables on Firm’s Performance: A Study of
Supply Chain Management in Large Private Manufacturing Firms in Kenya. MBA
Research Project. University of Nairobi
Central Bank of Kenya Report (2010)
Cooper, M.C., Lambert, D.M., & Pagh, J. (2012) Supply Chain Management: More Than a
New Name for Logistics. The International Journal of Logistics Management Vol 8,
Iss 1, pp 1–14
Danford, Matthew D. (2007). Middle Management Resist Lean Implementation, Survey
Suggests. Modern Machine Shop, 80(5), 1.
Doug Page,"Dayton Region a Crucial Hub for Supply Chain Management", Dayton Daily
News, 2009-12-21.
Edgeman, Rick L., & Bigio, David I. (2004). Six Sigma In Metaphor: Heresy Or Holy
Writ?. Quality Progress, 37(1), 6.
FAO, 2007, Agro-industrial supply chain management: Concepts and applications. AGSF
Occasional Paper 17 Rome.
Haag, S., Cummings, M., McCubbrey, D., Pinsonneault, A., & Donovan, R. (2006),
Management Information Systems For the Information Age (3rd Canadian Ed.),
Canada: McGraw Hill Ryerson ISBN 0-072-81947-2
Halldorsson, Arni, Herbert Kotzab & Tage Skjott-Larsen (2003), Inter-organizational

48
theories behind Supply Chain Management – discussion and applications, In
Seuring, Stefan et al. (eds.), Strategy and Organization in Supply Chains, Physica
Verlag.
Halldorsson, A., Kotzab, H., Mikkola, J. H., Skjoett-Larsen, T. (2007). Complementary
theories to supply chain management. Supply Chain Management: An International
Journal, Volume 12 Issue 4, 284-296.
Harland, C.M. (2012) Supply Chain Management, Purchasing and Supply Management,
Logistics, Vertical Integration, Materials Management and Supply Chain Dynamics.
In: Slack, N (ed.) Blackwell Encyclopedic Dictionary of Operations Management.
UK: Blackwell.
Hines, T. 2004. Supply chain strategies: Customer driven and customer focused. Oxford:
Elsevier.
Jusko, Jill. (2007). Accounting For Lean Tastes. Industry Week, 256(9), 3.
Kallrath, J., Maindl, T.I. (2006): Real Optimization with SAP® APO. Springer ISBN 3-540-
22561-7.
Kaushik K.D., & Cooper, M. (2000). Industrial Marketing Management. Volume29, Issue
1, January 2000, Pages 65–83
Ketchen Jr., G., & Hult, T.M. (2006). Bridging organization theory and supply chain
management: The case of best value supply chains. Journal of Operations
Management, 25(2) 573-580.
Kombo, K. & Tromp. (2006). Proposal and Thesis Writing. Makuyu : Pauline Publications
Kouvelis, P.; Chambers, C.; Wang, H. (2006): Supply Chain Management Research and
Production and Operations Management: Review, Trends, and Opportunities. In:

49
Production and Operations Management, Vol. 15, No. 3, pp. 449–469.
Krishnaswami, O. R. (2003). Methodology of Research in Social Science. Mumbai:
Himalaya Publishing House.
Larson, P.D. and Halldorsson, A. (2004). Logistics versus supply chain management: an
international survey. International Journal of Logistics: Research & Application,
Vol. 7, Issue 1, 17-31.
Lavassani K., Movahedi B., Kumar V. (2009) Developments in Theories of Supply Chain
Management: The Case of B2B Electronic Marketplace Adoption, The International
Journal of Knowledge, Culture and Change Management, Volume 9, Issue 6, pp.
85–98.
Locher, Drew. (2007). In the Office: Where Lean And Six Sigma Converge. Quality
Progress, 40(10), 2.
Mentzer, J.T. et. al. (2001): Defining Supply Chain Management, in: Journal of Business
Logistics, Vol. 22, No. 2, 2001, pp. 1–25
Movahedi B., Lavassani K., Kumar V. (2009) Transition to B2B e-Marketplace Enabled
Supply Chain: Readiness Assessment and Success Factors, The International
Journal of Technology, Knowledge and Society, Volume 5, Issue 3, pp. 75–88.
McManus, Kevin. (2007). The trouble with teams. Industrial Engineer, 39(10), 1.
Mugenda & Mugenda (1999). Research Methods: Quantitative and Qualitative Approaches
(2nd edition). Nairobi: Acts Press.
Muya, K.J. (2010). Influence of Lean Supply Chain Practices on Performance of Oil
Companies, School of Business. MBA Thesis Tanzania University of Open
Learning Tanzania.

50
Muloko, GT. (2012). The Relationship between Lean supply Chain Practices and
Organizational Performance, School of Business. MBA Thesis. Kampala
International University
Ofei, A.M. (2010). Lean Enterprise and Profitability of FMCG, School of Business.
MBA Thesis. University of Lagos, Nigeria
Odoyo J.B. (2009). Lean Enterprise and Performance Management of among MSE’s in
Kenya. MBA Research Project. University of Nairobi
Schonberger, Richard. (2007). Faltering Lean. Industrial Engineer, 39(11), 1.
Simone, Andrew., & Kleiner, Brian H. (2004). A Practical Guide to Workplace Reduction.
Management Research News, 27(4/5), 8.
Stimson, William A. (2005). A Deming Inspired Management Code of Ethics. Quality
Progress, 38(2), 8.
Simchi-Levi D. Kaminsky P., Simchi-levi E. (2007), Designing and Managing the Supply
Chain, third edition, Mcgraw Hill
Veykus, Renee., & Carter, Erin. (2006). Fix the Process, Not the People. Strategic Finance,
88(1), 8.
Walesh, Stuart G. (2008), Job security is an oxymoron. Civil Engineering, 67(2), 2.
Wainaina, P. A. (2009). Supply Chain Management Best Practices in Large Private
Manufacturing Firms in Kenya. MBA Research Project. University of Nairobi

1
APPENDICES
Appendix I: Introductory Letter Mukunju Esther Wanjiru
C/o university of Nairobi,
P.o box 30197-00100,
Nairobi.
Kenya.
TO WHOM IT MAY CONCERN
Dear Sir/Madam,
REF: MBA RESEARCH STUDY
I am a student pursuing for a Masters degree in Business Administration at the University of
Nairobi. In partial fulfillment of the requirements to the award of the Masters degree, I am
required to carry out a research and write on “Influence of Lean Supply Chain
Management Strategies on Performance of Commercial Banks in Kenya”
I kindly request your assistance by availing your time to respond to the questionnaire. The
information will be treated with utmost good faith and a copy of the final report will be made
available to you at your request.
Thank you
Yours faithfully,
Student
Mukunju Esther Wanjiru
D61/61881/2010
Sign....................................................

2
Appendix II: Questionnaire SECTION A: Organizational Demographics
Please supply the required data by filling in the blanks where space is provided or by ticking
[√] against the most appropriate answer.
I respondents name………………………………………………………….. [Optional]
1. For how long has this Commercial Bank been operating in Kenya?
a) Less than 5 years [ ]
b) 5 – 10 years [ ]
c) 11 – 15 years [ ]
d) 16 – 20 years [ ]
e) Over 20 years [ ]
2. What is the size of your Commercial Bank in terms of market share?
a) Large sized company [ ]
b) Medium sized company [ ]
c) Small sized company [ ]
SECTION B: LEAN SUPPLY CHAIN MANAGEMENT STRATEGIES 3. Do you understand lean supply chain management strategies?
Yes [ ] No [ ] 4. To what extent does your Commercial Bank apply the following lean supply chain
management strategies?
Lean Practices Very Great Extent [5]
Great Extent [4]
Moderate Extent [3]
Little Extent [2]
No extent [1]
Customer Relationship Management Strategy
Customers access services without delay
Customers are given an opportunity to measure
the service they get
Continuous research is conducts on customer
products/service
Customers are attracted and maintained
There is close relationship with customers
There are minimal human interaction during
service delivery

3
Reduced waiting time is experienced by the
customer
Customer Service Management
Strategy
Minimal employee motion at the workplace
There is good communication among workers
and employees
Minimal waste of unused human talent
Customers express their views on services they
want
Customers are assured of the services always
Customers rely the bank services always
Customers are royal due to satisfaction
Technology enhance customers service
Minimal complaints are experienced
Timely feedback is given to customers
Customers get instant solutions without delay
Demand Management Strategy
The bank has alternative means of meeting
customer demands
The bank uses technology to overcome
overwhelming demand
The bank anticipate customer demands in
advance
The bank utilizes resources effectively to meet
customer demands
The bank uses models to analyze forces of
demand and supply
The bank minimizes waste through planning
Supplier Relationship Management
Strategy
There is mutual relationships among
stakeholders
Suppliers are selected based on quality
There is close collaborations with suppliers
Suppliers are sourced through online
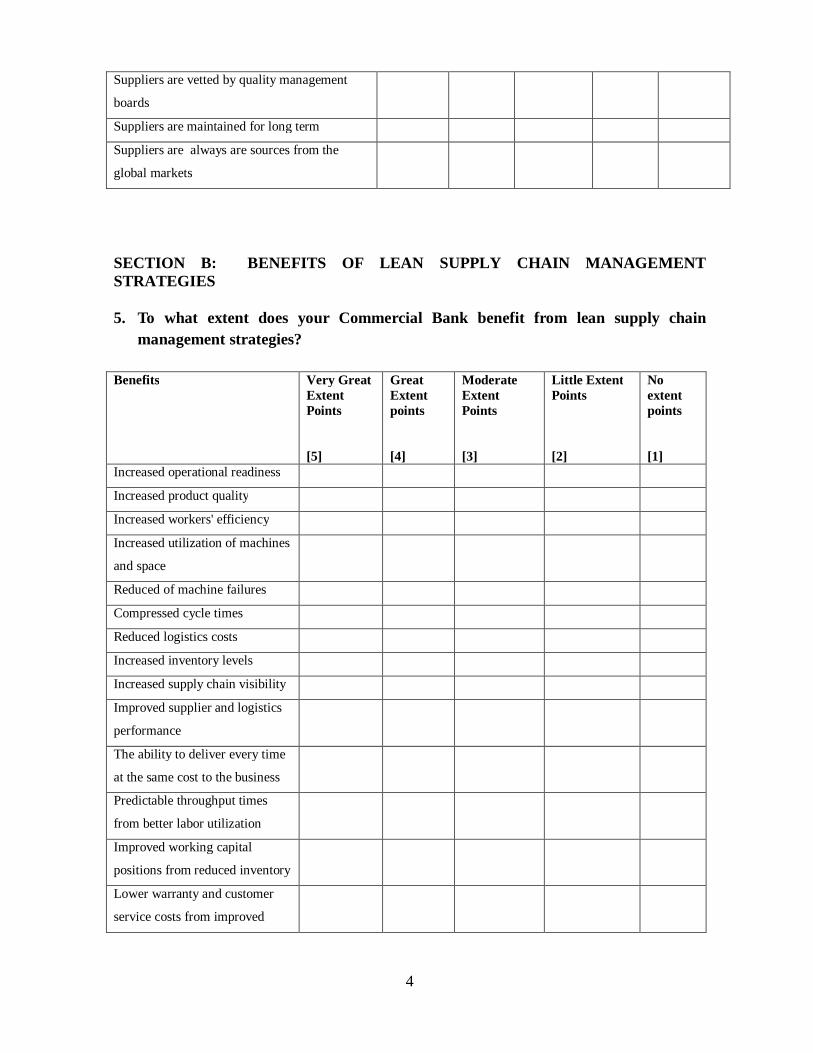
4
Suppliers are vetted by quality management
boards
Suppliers are maintained for long term
Suppliers are always are sources from the
global markets
SECTION B: BENEFITS OF LEAN SUPPLY CHAIN MANAGEMENT STRATEGIES 5. To what extent does your Commercial Bank benefit from lean supply chain
management strategies? Benefits Very Great
Extent Points [5]
Great Extent points [4]
Moderate Extent Points [3]
Little Extent Points [2]
No extent points [1]
Increased operational readiness
Increased product quality
Increased workers' efficiency
Increased utilization of machines
and space
Reduced of machine failures
Compressed cycle times
Reduced logistics costs
Increased inventory levels
Increased supply chain visibility
Improved supplier and logistics
performance
The ability to deliver every time
at the same cost to the business
Predictable throughput times
from better labor utilization
Improved working capital
positions from reduced inventory
Lower warranty and customer
service costs from improved

5
quality
Reduced transaction and
production costs
Improved resource planning
decisions investment decisions
Greater production predictability
and efficiency
Improved deployment of
complementary capabilities
Greater knowledge integration
and Research Development
effectiveness
Incentives for increased
innovation
Increased mutual commitment to
improving joint long-term
competitive performance
Improved visibility and
transparency in production
Ability to manage uncertainty
and risk
Ability to align core
competencies and
complementary capabilities
THANK YOU FOR YOUR COOPERATION

6
Appendix III: List of Licensed Commercial Banks in Kenya
1. ABC Bank (Kenya) 2. Bank of Africa 3. Bank of Baroda 4. Bank of India 5. Barclays Bank 6. CFC Stanbic Bank 7. Chase Bank (Kenya) 8. Citibank 9. Commercial Bank of Africa 10. Consolidated Bank of Kenya 11. Cooperative Bank of Kenya 12. Credit Bank 13. Development Bank of Kenya 14. Diamond Trust Bank 15. Dubai Bank Kenya 16. Ecobank 17. Equatorial Commercial Bank 18. Equity Bank 19. Family Bank 20. Fidelity Commercial Bank Limited 21. Fina Bank 22. First Community Bank 23. Giro Commercial Bank 24. Guardian Bank 25. Gulf African Bank 26. Habib Bank 27. Habib Bank AG Zurich 28. I&M Bank 29. Imperial Bank Kenya 30. Jamii Bora Bank 31. Kenya Commercial Bank 32. K-Rep Bank 33. Middle East Bank Kenya 34. National Bank of Kenya 35. NIC Bank 36. Oriental Commercial Bank 37. Paramount Universal Bank 38. Prime Bank (Kenya) 39. Standard Chartered Kenya 40. Trans National Bank Kenya 41. United Bank for Africa 42. Victoria Commercial Bank 43. Housing Finance
Source: Central Bank of Kenya Report (2014)