Embed Size (px)
Citation preview
Business and Economic Research
ISSN 2162-4860
2014, Vol. 4, No. 2
www.macrothink.org/ber 98
Impact of Intangible Assets on Profitability of Hong
Kong Listed Information Technology Companies
Hanran Li
Dept. of Information Systems, City University of Hong Kong
Tat Chee Avenue, Kowloon, Hong Kong SAR
Tel: 86-136-3124-5527 E-mail: [email protected]
Wenshu Wang
The Hong Kong and Shanghai Banking Corporation, Securities Department (HSS Department)
Taikoo Hui Building 2, No. 383 Tianhe Road, Tianhe District, Guangzhou, China
Tel: 86-136-3124-0808 E-mail: [email protected]
Received: July 31, 2014 Accepted: August 12, 2014
doi:10.5296/ber.v4i2.6009 URL: http://dx.doi.org/10.5296/ber.v4i2.6009
Abstract
The objective of our study is to find out the relationship between intangible assets and financial
performance of the listed technology firms in Hong Kong exchange market. Through
reviewing the listed firms‟ annual reports for a five year period (from 2008 to 2012), we have
collected data of three kinds of intangible assets, which are research and development cost,
employee benefit expense, and sales training. Meanwhile, we have used total assets and net
profit as control variables in analyzing the relationship between intangible assets and financial
performance, represented by return on assets (ROA) of firms. Using lagged R&D expenditure
as instrumental variable; our results suggested that research and development investment and
sales training are beneficial to firms‟ financial performance while employee benefit expense is
not.
Keywords: Intangible Assets, Research and Development, Sales Training, Return on Assets,
Net Profit, Total Assets
Business and Economic Research
ISSN 2162-4860
2014, Vol. 4, No. 2
www.macrothink.org/ber 99
1. Introduction
As the ultimate goal of firms is to maximize its wealth of its shareholders, it is important to
identify the factors that affect the firms' financial performances. When evaluating firms'
financial performances, the prevailing approach is to use accounting variables to calculate
firms' earnings and the costs incurred from various activities. However, under the General
Accepted Accounting Principles (GAAP), most of the assets recorded in the firms' financial
statements are tangible assets, or physical assets. The contributions of intangible assets have
been overlooked. With the absence of recognition of intangible assets, some important factors
to firms' potential return are neglected while tangible assets' effects are over-emphasized. The
intangible assets of firms have high value to the firms' future return, especially for
knowledge-based firms like information technology companies. For example, R&D
expenditure, employees‟ training,employees‟ given benefits, patent, and staffs' education level
are all intangible assets that may have potential effects on firms' future financial performances.
With information technology firms' dependence on knowledge and innovation, it is vital to take
intangible assets into consideration when assessing these companies‟ financial performance.
Thus, in our research, we focus on investigating the relationship between R&D expenditure,
advertising expenditure, employee benefit and sales training and the financial performances of
a firm. More specifically, we have selected them as the innovative factors of a firm to examine
how these variables affect the firm‟s financial performances. In this paper, Hong Kong is
chosen to examine the relation between return on asset (ROA) of latest information technology
companies and intangible assets. Currently, The Hong Kong exchange operates two markets:
the main board and growth enterprise market. Until 31 January, 2014, 1,657 enterprises
including 810 mainland companies are listed in HKSE. In 2013, the volume of transactions
exceeded 15 trillion Hong Kong dollars. This market is chosen for a couple reasons. 1. Hong
Kong is the internationally recognized financial center which attracts enormous mainland
enterprises and multinational cooperation to raise capital. 2. There is no control of foreign
exchange in Hong Kong and the tax rate in Hong Kong is relatively low which are good for
mainland companies to build up international horizon. 3. Based on the common law of United
Kingdom, the sound legal system in Hong Kong and strong regulatory body (securities and
futures commission) ensure the companies will raise funds properly and enhance the market
confidence. Comparing to stock market in mainland china, companies listed in Hong Kong
stock market are required to disclose more information about its financial position, corporate
governance and other information the public should be aware of.
Our research focuses on: 1) Investigating the relationship between the intangibles assets and
financial performance of the listed information technology companies in Hong Kong. Typically,
only intangible assets with data available to the public and can be related to innovative factors
are included. 2) Constructing an integrated model of how different intangible assets affect
return on asset (ROA) with detail explanation of causal relationship of the model. 3)
Demonstrating a new way of assessing a firm's future financial performance to investors by
showing them the implications behind these quantifiable, approachable-to-public intangible
assets.
Business and Economic Research
ISSN 2162-4860
2014, Vol. 4, No. 2
www.macrothink.org/ber 100
Since R&D expenditure is endogenous in nature, we use lagged values of R&D as instrumental
variables. We found that R&D has significant positive effect on ROA. However, increasing
employee benefit does not improve ROA as documented in the existing literature.
2. Literature Review
2.1 Research and Development
Though R&D expense in IT companies has been increasing in the past few decades, the
influence of R&D expenditure on firm‟s financial outcome remains controversial. Some
believe that R&D expense can enhance firm‟s future financial outcome while others do not. For
example, Kothari, Laguerre, and Leone (2002) observed that, as R&D expense increases, the
fluctuation of future earnings also increases. They documented an uncertain relationship
between R&D expense and future earnings. However, their result may be biased as they focus
on a sole factor in determining the factor‟s relationship with the firm‟s returns in the future.
Other researchers have documented that a firm‟s R&D investment is positively related to a
firm‟s future earnings.
R&D is a type of intellectual market-based intangible assets that contribute to a firms‟
knowledge in product development and market environment (Srivastava et al., 1998).As an
intangible asset, Research and development (R&D) yields high importance to firms in terms of
technology changes that are related to potential manufacturing cost reduction and product
innovation. R&D intensity may be the most direct indicator to the degree of a firm‟s innovation.
According to Mairesse and Mohnen(2005), R&D can be related to innovation by certain kind
of knowledge production function and R&D is positively relate to all approaches of output of
innovation such as patent holdings and patent application. Love and Roper (1999) suggested
that in large firms, to implement R&D is necessary for innovation. Empirical studies have
found R&D to be one of the determinants of the success of a new product (Henard& Szymanski,
2001; Troy, Hirunyawipada, & Paswan, 2008). Most of IT companies earn the competitive
advantage through continuously updating their products and services since IT industry is an
industry with rapid growth. Therefore, the successful performance of newly invented products
serves as one of the dominant factors related to future financial performance.
However, it takes time for a firm‟s R&D investment to reveal its contribution on a firm‟s
financial outcome; lots of previous researches have demonstrated that there is no short run
relationship between a firm‟s R&D expense and the firm‟s financial performance. Specifically,
Chiao (2001), who studied the short run and long run connection between a firm‟s R&D
investment and the firm‟s financial outcome, pointed out that the long run correlation between
a firm‟s R&D investment and financial performance was positive while the short run
relationship is bi-directional. Mairesse and Siu (1984) also carried on a study that revealed no
short run connection between a firm‟s R&D expense and financial performance. Thus, in our
study, we will examine the relationship between a firm‟s previous year‟s R&D expenditure as
an instrumental variable and the firm‟s current year financial performance by using the 1-year
lagged value of R&D expense to examine the long term effect of research and development
activities on a firm‟s financial performance.
Business and Economic Research
ISSN 2162-4860
2014, Vol. 4, No. 2
www.macrothink.org/ber 101
2.2 Employee Benefit
An organization cannot be innovative just by depending on few core employees in R&D
department. All employees, despite different positions, should contribute to the firm which
makes it an innovative organization. When the company is committed to innovation, rewarding
and compensating the staff is a necessary approach to motivate them to embark on innovation
activity (Malaviya & Wadhwa, 2005). According to Chen et al. (2012), financially rewarding
employees‟ outstanding performances can benefit the firm‟s technological innovations.
Laursen (2003) stated that reward and bonus to a grass-root employee for minor progress can
boost such incremental innovation activity regardless of the particular company in which the
incentive system is implemented. In addition, extrinsic incentives, for example, monetary
compensation can motivate employees to participate on innovation activity (Winston & Baker,
1985). Moreover, employee‟s behaviors are changeable so extrinsic factors can result in
expected performance and behavior.
High level of creativity can be resulted for rewarding employee‟s divergent thinking (Winston
& Baker, 1985; Edwards, 1989). In addition, lots of experimental researches indicated that
large economic compensation positively relates to employees‟ incremental innovative activity.
( Eisenberger & Cameron, 1996; Eisenberger & Armeli, 1997).
Since the IT companies are the sources of technological innovation, the more innovative
activities, the more creative products and services will be invented. Moreover, the employees
in IT companies always have high educational background. In order to retain these talents, the
firm will provide an attractive employee benefit package to them. These high quality
employees will positively influence the firm‟s financial performance.
2.3 Sales Training
Previous research has found that the higher the sales force competencies, the higher sales return
a firm can obtain (Honeycutt et al., 2001). Sales force competency is based on salespersons‟
performances on a specific given task (Ennis, 1998). Moreover, with the increasing completion
among firms and changing technologies, more and more firms are seeking training on sales
force to increase their sales volume. Sales people today have to equip themselves with broad
level of knowledge to satisfy customers‟ various needs and to retain customer loyalty (Galvin,
2001). Organizations‟ main expectation of investing in sales training is to let this training
expenditure to aid the firm in reaching its objectives, or namely, increasing its sale return
(Moore & Seidner, 1998).
However, researchers have encountered difficulties when evaluating whether using sales
training can benefit the firm in achieving firms‟ financial objectives (Lupton, Weiss, &
Peterson, 1999). There are simply too many different financial metrics for firms to measure
their financial performances. Thus the lack of empirical work in sales training area is the main
reason for the missing of a concrete solution about how sales training will affect future sales
return (Warr, Allan, & Birdi, 1999).
Previous studies have demonstrated that the effect of sales training on return of asset from
different angles. Doyle and Cook (1984) have conducted an experiment in UK retailing stores
Business and Economic Research
ISSN 2162-4860
2014, Vol. 4, No. 2
www.macrothink.org/ber 102
to look into the effect of sales training. Through comparing the stores‟ weekly sales before and
after sales training, they have found that stores receiving sales training had significantly higher
sales revenue. They have also found that, with sales training, salespeople could accomplish
multiple tasks at high quality. Recent studies have reported that strategic sales training can
increase firms‟ profitability and customers‟ loyalty (Johnson, 2004). Similarly, Pfizer has also
proposed that, with sales training, the salesperson turnover rate can be reduced and
productivity can be boosted up.
3. Data and Methodology
When it comes to measuring a firm‟s financial performance, several indicators are commonly
used: return on equity (ROE), return on investment (ROI), return on sales (ROS), return on
assets (ROA), and earnings per share (EPS). Among them, we choose ROA to be our
dependent variable to measure our selected firms‟ financial performance based on the
following considerations. ROA is the value of the firm‟s annual net income divided by the
firm‟s total assets in book value. There are two reasons: 1. Based on our observations on the
firms‟ annual reports and announced financial indexes, we found that ROE, ROI, ROA are
highly correlated over time. Namely, a high ROA is usually accompanied by a high ROE in a
given time period. However, among these variables, ROA remains most stable over time; other
financial performance indicators seem to have large fluctuation with little change in our
independent variables. Thus, using ROA as an indicator of financial performance is most
representative. 2. ROA indicates a firm‟s ability to generate revenue that exceeds actual
spending. ROA represents the accounting income for shareholders (Carter et al, 2003). The
ultimate purpose of our research is to better serve shareholders‟ interests, using ROA thus
matches the purpose of our research. 3. in our study, the technology firms included usually
require more assets for production. Not only can ROA explain firm‟s financial performance,
it also indicates a firm‟s assets utilization (Balakrishnan et al., 1996).
3.1 Estimation Model
Our key estimation equation is:
(1)
Where : Return on asset of company i at time t
: Logarithm of research and development expenditure of company i at time t-1
: Logarithm of employee benefit of company i at time t
Business and Economic Research
ISSN 2162-4860
2014, Vol. 4, No. 2
www.macrothink.org/ber 103
: Dummy variable, training program of company i at time t
: Logarithm of total asset of company i at time t
: Net profit of net profit of company i at time t-1
: Return on asset of company i at time t-1
Other than using a firm‟s total assets ( )as one of the control variable to
shield the firm size influence on assets return, we adopted net profit as another control
variable to isolate the effect that strategic management and environmental factors on a firm‟s
financial performance. Generally speaking, net profit reveals a firm‟s financial situation in a
post-tax basis.
3.2 Measurement of Variables
3.2.1 Measurement of R&D Activity
R&D was measured by different proxies in different literatures. Dividing R&D expense by
sales or the number of patent is the most common measure. Other measurements include
dividing R&D cost by profit, number of current research project, or dividing R&D employee
by total staff and number of staff with undergraduate degree or above.
Most of the annual report merely announce R&D expenditure and staff number without
detailed educational background. Therefore, due to the lack of information, we choose
companies‟ R&D expenditure to represent R&D activity. In this paper, we use lagged value of
R&D. As demonstrated by Fung and Lau (2013), only past values of R&D affect current profit
growth. Also, using current R&D would cause endogenity issue rendering the estimate biased.
Hypothesis 1: Other things being equal, the R&D expenditure and the firm‟s ROA has a
positive correlation.
3.2.2 Measurement of Employee Benefits
Most of the literatures measure the employee benefit by surveying the employees using
questionnaire or percentage of top manager‟s incentive compensation and those allocated to
other employees (Arbaugh, Cox, & Camp, 2004). Therefore, we use the company‟s employee
benefit expenditure in the model.
Hypothesis 2: Other things being equal, the employee incentive can have a positive effect on a
firm‟s ROA.
3.2.3 Measurement of Sales Training
To isolate the interventions (seasonality, market conditions, and marketing efforts) on
training‟s effect, researchers point out the necessity of using a control group and an experiment
Business and Economic Research
ISSN 2162-4860
2014, Vol. 4, No. 2
www.macrothink.org/ber 104
group. Namely, the study should be conducted with one group of firms offer training for
employees while the other group does not. Thus, in practice, we used dummy variables to
indicate the relationship between sales training expenditure and ROA. Namely, we denoted
firms provided sales training to employees with 1 and labeled firms without sales training to
employees with the number 0. We search the whole annual report about anything regard to
sales training to determine this variable of each company. We then conducted a regression
analysis between sales training and the firm‟s ROA to examine their relationship.
Hypothesis 3: Other things being equal, the sales training can have a positive effect on a firm‟s
ROA.
The sources of IT technological companies listed in Hong Kong financial information are
annual reports from 2008 to 2012 from the Hong Kong Stock Exchange. The companies that do
not reveal R&D expenditure will be excluded. There are three categories of companies -
Electronic Product and Component, Internet Information Provider/ Multimedia, and
Application and Software Supplier1.
We modified the Sun and Huang (2013) model to suit our purpose. We collect the data from the
annual reports during 2008-2012. The source of these annual reports is the official website of
Hong Kong Exchange News named HKExnews. After selecting the companies related to
information technology industry, we have 92 companies in our sample. All of the data from the
annual report are expressed in million Hong Kong dollars.
The t-test will be used to test the hypothesis mentioned above.
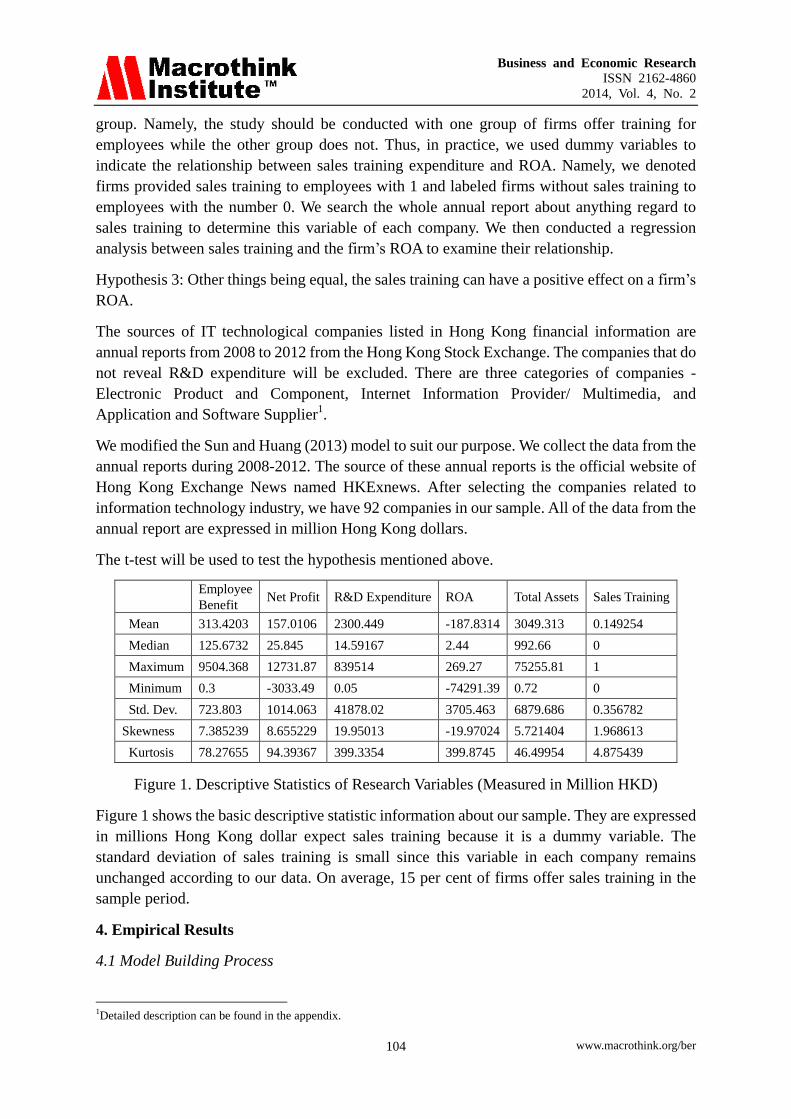
Employee
Benefit Net Profit R&D Expenditure ROA Total Assets Sales Training
Mean 313.4203 157.0106 2300.449 -187.8314 3049.313 0.149254
Median 125.6732 25.845 14.59167 2.44 992.66 0
Maximum 9504.368 12731.87 839514 269.27 75255.81 1
Minimum 0.3 -3033.49 0.05 -74291.39 0.72 0
Std. Dev. 723.803 1014.063 41878.02 3705.463 6879.686 0.356782
Skewness 7.385239 8.655229 19.95013 -19.97024 5.721404 1.968613
Kurtosis 78.27655 94.39367 399.3354 399.8745 46.49954 4.875439
Figure 1. Descriptive Statistics of Research Variables (Measured in Million HKD)
Figure 1 shows the basic descriptive statistic information about our sample. They are expressed
in millions Hong Kong dollar expect sales training because it is a dummy variable. The
standard deviation of sales training is small since this variable in each company remains
unchanged according to our data. On average, 15 per cent of firms offer sales training in the
sample period.
4. Empirical Results
4.1 Model Building Process
1Detailed description can be found in the appendix.
Business and Economic Research
ISSN 2162-4860
2014, Vol. 4, No. 2
www.macrothink.org/ber 105
Firstly, we run the Pooled Ordinary Least Square (POLS) method to estimate the impact of
intangibles on ROA. Since our data are different from that of the literature, an improvement of
the regression model is necessary. The existing literature use data in 2009 while our data are
ranging from 2008-2012. When dealing with the panel data, it is important to choose between
the fixed effect and random effect model. The selection criterion is the Hausman test. If the
result rejects the null hypothesis that random effect model is not efficient and consistent, we
will use fixed effect.
The most significant difference between fixed and random effect in panel data estimation is the
assumption that fixed effect require the individual effect and any explanatory variable are
correlated while random effect require no correlation between them. The fixed effect
estimation uses the time-demeaned data In our model, the variable of sales
training of each company in 5 years is a constant without any variation (constant 1 or 0 in 5
years). Since there is no change of sales training in 5 years, we can merely use random effect in
our model 2(Wooldridge, 2009).
According to the result of Durbin-Watson statistic, ROA has a moderate autocorrelation. To
eliminate this problem, we add to model autocorrelation. The model estimation
requires that all explanatory variables are exogenous variables. However, according to
Wooldridge (2009), research and development in the future is influenced by other factors such
as current profitability and ROA which makes R&D a suspect endogenous variable. Moreover,
unobserved effects such as management level of the company may also influence ROA of a
company. Therefore, an introduction of instrumental variable is necessary. The requirements of
instrumental variable are that this variable should be highly correlated to R&D and no
correlation to the random error. Among the available data we have, and can
satisfy these two requirements: R&D expenditure may has no relationship to management level
(variables influence the management level may include managers‟ education level or working
experience). There is a significant relationship between R&D expenditure a year ago
( and that of two or three years ago ( and . Meanwhile, we
calculate the robust standard error using a method similar to Fung et al. (2014a) and Fung et al.
(2014b) to control for cross-sectional and temporal dependence.
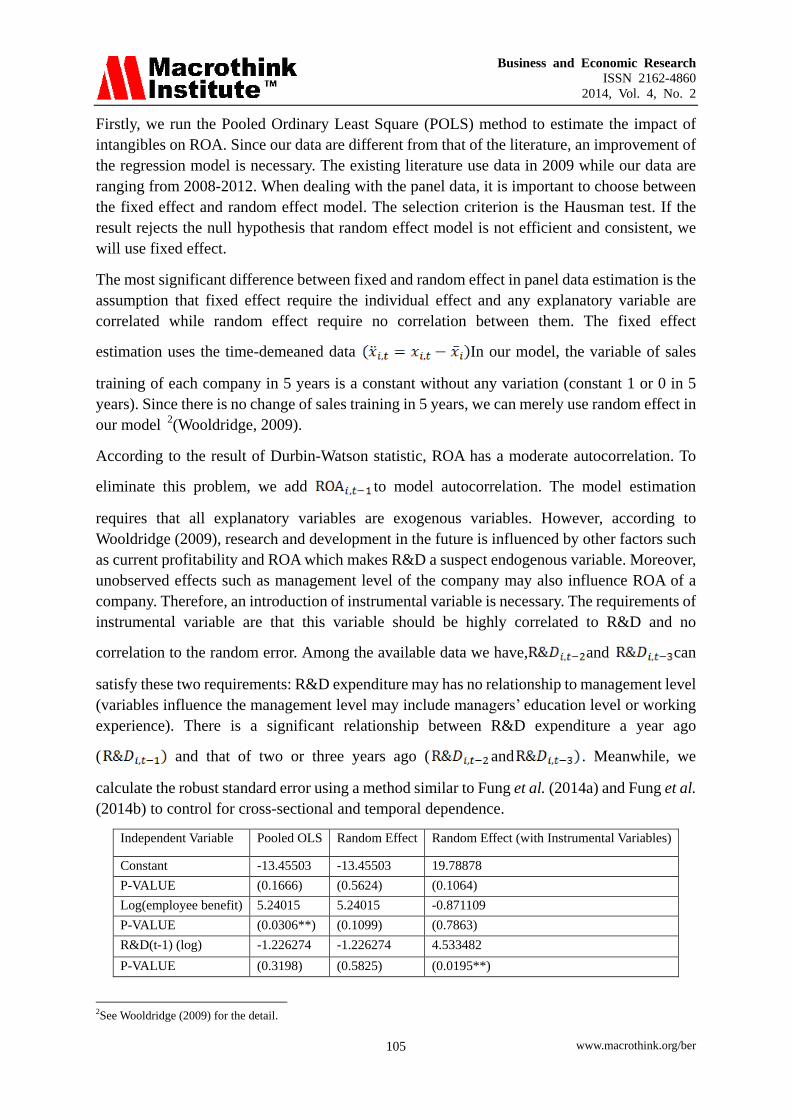
Independent Variable Pooled OLS Random Effect Random Effect (with Instrumental Variables)
Constant -13.45503 -13.45503 19.78878
P-VALUE (0.1666) (0.5624) (0.1064)
Log(employee benefit) 5.24015 5.24015 -0.871109
P-VALUE (0.0306**) (0.1099) (0.7863)
R&D(t-1) (log) -1.226274 -1.226274 4.533482
P-VALUE (0.3198) (0.5825) (0.0195**)
2See Wooldridge (2009) for the detail.
Business and Economic Research
ISSN 2162-4860
2014, Vol. 4, No. 2
www.macrothink.org/ber 106
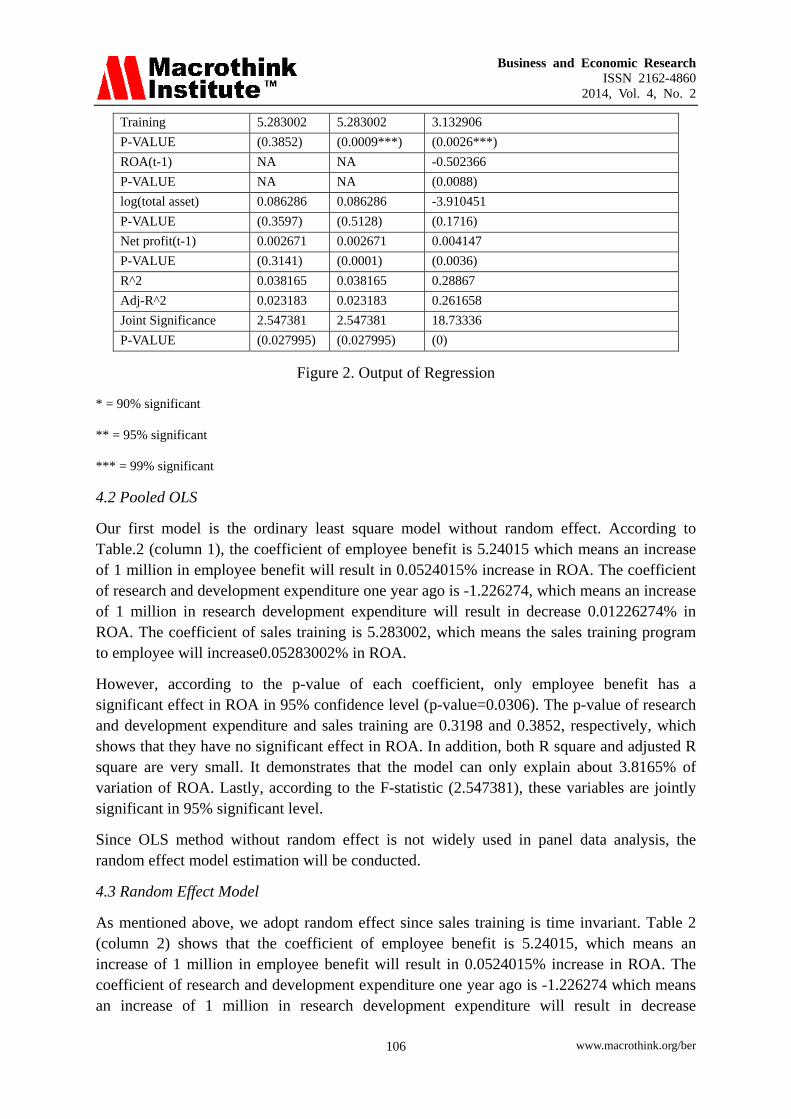
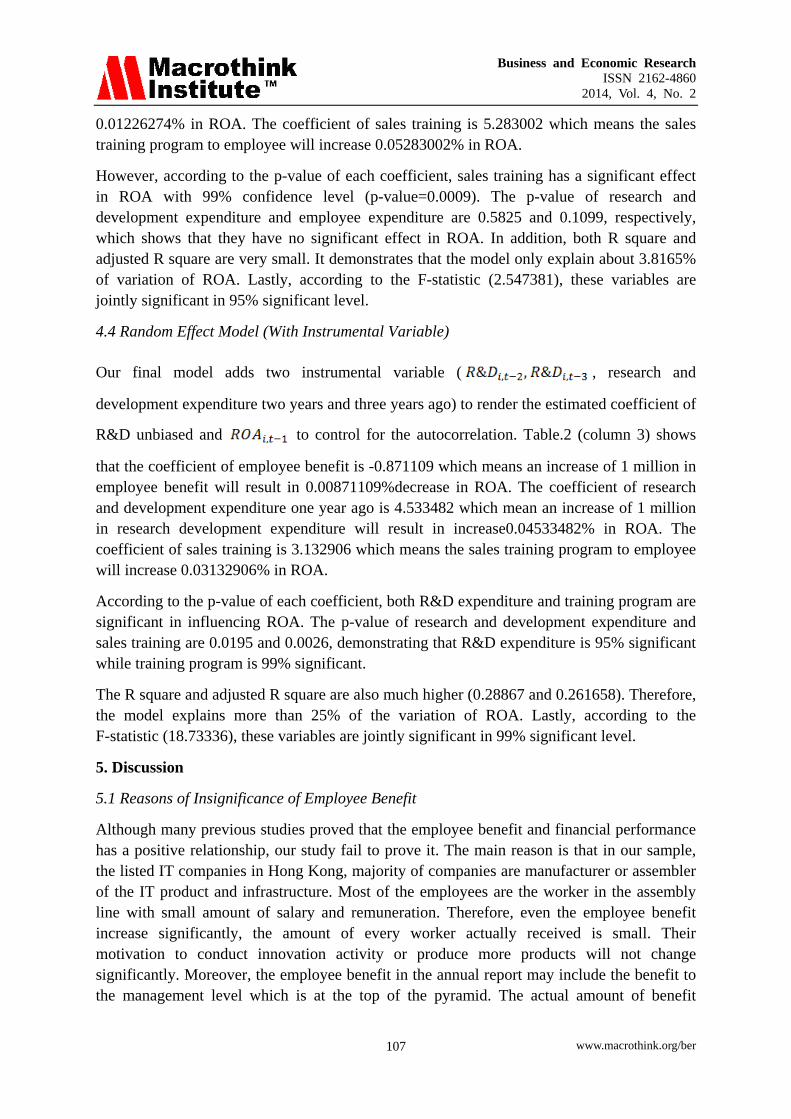
Training 5.283002 5.283002 3.132906
P-VALUE (0.3852) (0.0009***) (0.0026***)
ROA(t-1) NA NA -0.502366
P-VALUE NA NA (0.0088)
log(total asset) 0.086286 0.086286 -3.910451
P-VALUE (0.3597) (0.5128) (0.1716)
Net profit(t-1) 0.002671 0.002671 0.004147
P-VALUE (0.3141) (0.0001) (0.0036)
R^2 0.038165 0.038165 0.28867
Adj-R^2 0.023183 0.023183 0.261658
Joint Significance 2.547381 2.547381 18.73336
P-VALUE (0.027995) (0.027995) (0)
Figure 2. Output of Regression
* = 90% significant
** = 95% significant
*** = 99% significant
4.2 Pooled OLS
Our first model is the ordinary least square model without random effect. According to
Table.2 (column 1), the coefficient of employee benefit is 5.24015 which means an increase
of 1 million in employee benefit will result in 0.0524015% increase in ROA. The coefficient
of research and development expenditure one year ago is -1.226274, which means an increase
of 1 million in research development expenditure will result in decrease 0.01226274% in
ROA. The coefficient of sales training is 5.283002, which means the sales training program
to employee will increase0.05283002% in ROA.
However, according to the p-value of each coefficient, only employee benefit has a
significant effect in ROA in 95% confidence level (p-value=0.0306). The p-value of research
and development expenditure and sales training are 0.3198 and 0.3852, respectively, which
shows that they have no significant effect in ROA. In addition, both R square and adjusted R
square are very small. It demonstrates that the model can only explain about 3.8165% of
variation of ROA. Lastly, according to the F-statistic (2.547381), these variables are jointly
significant in 95% significant level.
Since OLS method without random effect is not widely used in panel data analysis, the
random effect model estimation will be conducted.
4.3 Random Effect Model
As mentioned above, we adopt random effect since sales training is time invariant. Table 2
(column 2) shows that the coefficient of employee benefit is 5.24015, which means an
increase of 1 million in employee benefit will result in 0.0524015% increase in ROA. The
coefficient of research and development expenditure one year ago is -1.226274 which means
an increase of 1 million in research development expenditure will result in decrease
Business and Economic Research
ISSN 2162-4860
2014, Vol. 4, No. 2
www.macrothink.org/ber 107
0.01226274% in ROA. The coefficient of sales training is 5.283002 which means the sales
training program to employee will increase 0.05283002% in ROA.
However, according to the p-value of each coefficient, sales training has a significant effect
in ROA with 99% confidence level (p-value=0.0009). The p-value of research and
development expenditure and employee expenditure are 0.5825 and 0.1099, respectively,
which shows that they have no significant effect in ROA. In addition, both R square and
adjusted R square are very small. It demonstrates that the model only explain about 3.8165%
of variation of ROA. Lastly, according to the F-statistic (2.547381), these variables are
jointly significant in 95% significant level.
4.4 Random Effect Model (With Instrumental Variable)
Our final model adds two instrumental variable ( , research and
development expenditure two years and three years ago) to render the estimated coefficient of
R&D unbiased and to control for the autocorrelation. Table.2 (column 3) shows
that the coefficient of employee benefit is -0.871109 which means an increase of 1 million in
employee benefit will result in 0.00871109%decrease in ROA. The coefficient of research
and development expenditure one year ago is 4.533482 which mean an increase of 1 million
in research development expenditure will result in increase0.04533482% in ROA. The
coefficient of sales training is 3.132906 which means the sales training program to employee
will increase 0.03132906% in ROA.
According to the p-value of each coefficient, both R&D expenditure and training program are
significant in influencing ROA. The p-value of research and development expenditure and
sales training are 0.0195 and 0.0026, demonstrating that R&D expenditure is 95% significant
while training program is 99% significant.
The R square and adjusted R square are also much higher (0.28867 and 0.261658). Therefore,
the model explains more than 25% of the variation of ROA. Lastly, according to the
F-statistic (18.73336), these variables are jointly significant in 99% significant level.
5. Discussion
5.1 Reasons of Insignificance of Employee Benefit
Although many previous studies proved that the employee benefit and financial performance
has a positive relationship, our study fail to prove it. The main reason is that in our sample,
the listed IT companies in Hong Kong, majority of companies are manufacturer or assembler
of the IT product and infrastructure. Most of the employees are the worker in the assembly
line with small amount of salary and remuneration. Therefore, even the employee benefit
increase significantly, the amount of every worker actually received is small. Their
motivation to conduct innovation activity or produce more products will not change
significantly. Moreover, the employee benefit in the annual report may include the benefit to
the management level which is at the top of the pyramid. The actual amount of benefit
Business and Economic Research
ISSN 2162-4860
2014, Vol. 4, No. 2
www.macrothink.org/ber 108
distributed to employee may smaller than the number stated in annual reports. Therefore, the
effect of employee benefit is not significant in our case.
5.2 Limitations
There are three limitations of this study. First, the Sample size used in our research is
relatively small considering the total number of listed information technology companies in
Hong Kong. Second, due to the limited access to data, we have excluded a few independent
variables in our study, such as the number of patents, the education level of employees and
sales training time. These variables are also the important indicators of a firm‟s intangible
asset regarding to R&D, employee benefit and sales training, respectively. Thus our research
may not be comprehensive enough. Third, according to our research method, sales training is
a dummy variable where „1‟ represents the firm provide sales or promotion training to the
salesman and „0‟ shows the company does not provide. We search the key word “sales
training” in company‟s annual report to determine this variable in every company. However,
only few companies explicitly stated there is training program of sales provide to the
employee while the majority of them merely said the company has employee training
program but does not specify what these training program are. Therefore, it may difficult to
identify whether the sales training program is offered in the company only depend on the
information in annual report.
6. Conclusion
This paper examine the effect of research and development expenditure, employee benefit
and sales training to return on asset in information technology companies listed in Hong
Kong. The result of our regression model demonstrates both R&D expenditure and sales
training have a positive relationship to ROA in statistics. The previous studies about
intangible asset and financial performance are mainly biological and medical companies in
Europe and North America. The related studies and researches conducted in Asia and
information technology industry are very few. Therefore, this paper partially fills this missing
gap.
7. Recommendation
Two parties may find this paper useful: the administration staff and individual investors. For
the managers and decision makers in the company, this paper can help them to understand the
effect of intangible assets such as R&D expenditure, employee benefit and sales training in
firm‟s financial performance so that they can develop more comprehensive strategies,
especially in information technology companies. They will be better in allocating resource to
R&D expenditure, employee benefit and sales training.
For the individual investors, this paper provide a new angle to them to evaluate firm‟s
performance and forecast the future development vision of an information technology
company base on intangible asset. They can collect these numbers of a company and make a
forecasting estimation to judge whether the company they choose has significant potential
growth and profitability and make investment to these companies to gain more return.
Business and Economic Research
ISSN 2162-4860
2014, Vol. 4, No. 2
www.macrothink.org/ber 109
Appendix
Categories of Chinese IT firms listed at Hong Kong Stock Exchange.
1. Electronic Product and Component
Most of these enterprises are the manufacturer of electronic hardware and component. Their
products are the material basis of the whole IT industry. These companies have either a
strong power and initiative of innovation or a large scale manufacturing equipment and
skilled workers. There are 35 companies in this category in our sample.
2. Internet Information Provider/Multimedia Companies
These companies are providing channels to users so that they can access information on the
internet, such as co-operations operating a portal site, telecommunication companies and
internet service providers (ISP). Nowadays, these co- operations may extend its business to
other areas easily since they have high level of vitality in creation and innovation with large
amount of active user group or develop to a dominant power in one specific area. There are
24 companies in this category in our sample.
3. Application and Software Supplier
In addition to hardware companies, more than 30 software and application suppliers are listed
in Hong Kong exchange. Besides traditional computer software companies, more and more
companies focus on smart devices application development and game development appear in
Hong Kong stock market which are mainly listed in GEM. There are 33 companies in this
category in our sample.
References
Aaker, D., & Jacobson, R. (1994). The financial information content of perceived quality.
Journal of Marketing Research, 31, 191-201. http://dx.doi.org/10.2307/3152193
Ailawadi, K. L., Lehmann, D. R., & Neslin, S. A. (2003).Revenue premium as an outcome
measure of brand equity. Journal of Marketing, 67, 1-17.
http://dx.doi.org/10.1509/jmkg.67.4.1.18688
Arbaugh, J. B., Cox, L. W., & Camp, S. M. (2004).Employee equity, incentive compensation,
and growth in entrepreneurial firms. New England Journal of Entrepreneurship, 7(1), 15-25.
Retrieved from http://search.proquest.com/docview/231213495?accountid=38789.
Arias-Aranda, D., Minguela-Rata, B., & Rodriguesz-Duarte, A. (2001). Innovation and firm
size: An empirical study for spanish engineering consulting companies. European Journal of
Innovation Management, 4(3), 133-14. Retrieved from
http://search.proquest.com/docview/211855199?accountid=38789.
http://dx.doi.org/10.1108/EUM0000000005671
Bebchuk, L., Reinier Kraakman & Georges Triantis (2000). Stock Pyramids, Cross-Ownership
and Dual Class Equity: The Mechanisms and Agency Costs of Separating Control from
Cash-flow Rights, Concentrated Corporate Ownership, R. Morck ed., National Bureau of
Business and Economic Research
ISSN 2162-4860
2014, Vol. 4, No. 2
www.macrothink.org/ber 110
Economic Research (NBER), p.445-460.
Benhabib J, Spiegel MM (1994). The role of human capital in economic development:
evidence from aggregate cross-country data. J Monet Econ 70, 143-173.
http://dx.doi.org/10.1016/0304-3932(94)90047-7
Balakrishnan, R., T. Linsmeier, M. Venkatachalam. (1996). Financial benefits from JIT
adoption: Effects of customer concentration and cost structure. Accounting Review. 71(2)
183-206.
Carter, D. A., Simkins, B. J., & Simpson, W. G. (2003). Corporate governance, board diversity,
and firm value. Financial Review, 38, 33-53. http://dx.doi.org/10.1111/1540-6288.00034
Chan, L. K., Lakonishok, J., & Sougiannis, T. (2001). The stock market valuation of research
and development expenditures. Journal of Finance, 56(6), 2431-2456.
http://dx.doi.org/10.1111/0022-1082.00411
Chauvin, K. W., & Hirschey, M. (1993). Advertising, R&D expenditures and the market value
of the firm. Financial Management, 22, 128-140. http://dx.doi.org/10.2307/3665583
Chen, M. Y., Lin, C. Y., Lin, H., & Mcdonough, E. F. (2012). Does transformational leadership
facilitate technological innovation? the moderating roles of innovative culture and incentive
compensation. Asia Pacific Journal of Management, 29(2), 239-264.
http://dx.doi.org/10.1007/s10490-012-9285-9
Chiao, C. (2001) The relationship between R&D and physical investment of firms in
science-based industries, Applied Economics, 33, 23-35.
http://dx.doi.org/10.1080/00036840150203206
Damanpour, F., & Schneider, M. (2006). Phases of the Adoption of Innovation in
Organizations: Effects of Environment, Organization and Top Managers. British Journal of
Management, 17(3), 215-236. doi:10.1111/j.1467-8551.2006.00498.x.
Damanpour, F. (1992). Organizational Size and Innovation. Organization Studies (Walter De
GruyterGmbh & Co. KG.), 13(3), 375-402. http://dx.doi.org/10.1177/017084069201300304
Di Vito, J., Claude Laurin and Yves Bozec (2010). R&D Activity in Canada: Does Corporate
Ownership Structure Matter?,Canadian Journal of Administrative Studies, forthcoming.
http://dx.doi.org/10.1002/cjas.152
Doyle, Peter, & David Cook (1984). An Evaluation of a Sales Training Programme in a
Retailing Environment, European Journal of Operational Research, 16(3), 308-313.
http://dx.doi.org/10.1016/0377-2217(84)90284-4
Dubinsky, Alan J. (1999). Salesperson Failure: Sales Management Is the Key, Industrial
Marketing Management, 28 (January), 7-18.
Dobni, C. B. (2008). The DNA of innovation. The Journal of Business Strategy, 29(2), 43-50.
http://dx.doi.org/10.1108/02756660810858143
Business and Economic Research
ISSN 2162-4860
2014, Vol. 4, No. 2
www.macrothink.org/ber 111
Edwards, M. R. (1989). Measuring creativity at work: developing a reward-for-creativity
policy, Journal of Creative Behavior, 23, 26-37.
http://dx.doi.org/10.1002/j.2162-6057.1989.tb00515.x
Ennis, Susan (1998). Assessing Employee Competencies, in Evaluating Corporate Training:
Models and Issues, Stephen M. Brown and Constance J. Seidner, eds., Boston: Kluwer
Academic, 183-208.
Fennell, M. L. (1984). Synergy, influence, and information in the adoption of administrative
innovations. Academy of Management Journal, 27(1), 113. http://dx.doi.org/10.2307/255960
Fung, K. W. T., Lau, C. K. M., & Chan, K. H. ( 2014a). The Conditional CAPM, Cross-Section
Returns and Stochastic Volatility. Economic Modeling. 38, 316-327
Fung, K. W. T., Demir, E., & Zhou L. (2014b). Capital Asset Pricing Model and Stochastic
Volatility: A Case study of India. MPRA working paper no.56180.
Fung, K. W. T., & Lau, C. K. M. (2013). Financial Development, Economic Growth and R&D
Cyclical Movements. Journal of Applied Economics and Business Research, 3(3)
Galvin, Tammy (2001). 2001 Industry Report, Training, 38(10), 40-75.
Gallié, E., & Legros, D. (2012). Firms' human capital, R&D and innovation: A study on french
firms. Empirical Economics, 43(2), 581-596. http://dx.doi.org/10.1007/s00181-011-0506-8
Ha-Brookshire, J. (2009). Does the firm size matter on firm entrepreneurship and performance?
Journal of Small Business and Enterprise Development, 16(1), 132-146.
http://dx.doi.org/10.1108/14626000910932926
Henard, David H., & David M. Szymanski (2001). Why Some New Products Are More
Successful Than Others, Journal of Marketing Research, 38(August), 362-75.
http://dx.doi.org/10.1509/jmkr.38.3.362.18861
Hermalin, B. E., & Michael S. Weisbach (1991). The Effects of Board Composition and Direct
Incentives on Firm Performance, Financial Management, 20, 101-112.
http://dx.doi.org/10.2307/3665716
Hirschey, M. (1985). Market structure and market value. Journal of Business, 58, 89-98.
http://dx.doi.org/10.1086/296284
Hirschey, M., & Spencer, S. (1992). Size effects in the market valuation of fundamental factors.
Financial Analyst Journal, 48, 91-95. http://dx.doi.org/10.2469/faj.v48.n2.91
Hitt, M. A., R. E. Hoskisson & R. D. Ireland (1990). Mergers and Acquisitions and Managerial
Commitment to Innovation in M-Form Firms, Strategic Management Journal, 11(S), 29-47.
Honeycutt,KiranKarande, Ashraf Attia, & Steven D. Maurer (2001), A Utility-Based
Framework for Evaluating the Financial Impact of Sales Force Training Programs, Journal of
Personal Selling & Sales Management, 21, 3(Summer), 229-238.
Jin, B. (2006). Performance implications of information technology implementation in an
Business and Economic Research
ISSN 2162-4860
2014, Vol. 4, No. 2
www.macrothink.org/ber 112
apparel supply chain, Supply Chain Management: An International Journal, 11, 309-16.
http://dx.doi.org/10.1108/13598540610671752
Johnson, Heather (2004). Field of Sales. Training, 41 (July), 36-37.
Laursen, K., & Foss, N. J. (2003). New human resource management practices,
complementarities and the impact on innovation performance, Cambridge Journal of
Economics, 27(2), 243-63. http://dx.doi.org/10.1093/cje/27.2.243
Kothari, S. P., T. E. Laguerre, & A. J. Leone. (2002). Capitalization versus Expensing:
Evidence on the Uncertainty of Future Earnings from Capital Expenditure versus R&D
Outlays. Review of Accounting Studies, 7, 355-382.
Love, J. H., & Roper, S. (1999). The determinants of innovation: R & D, technology transfer
and networking effects. Review of Industrial Organization, 15(1), 43-64. Retrieved from
http://search.proquest.com/docview/209862097?accountid=38789
Lupton, Robert A., John E. Weiss, & Robin T. Peterson (1999). Sales Training Evaluation
Model (STEM): A Conceptual Framework, Industrial Marketing Management, 28(January),
73-86.
Mairesse, J. and Siu, A. K. (1984) An extended accelerator model of R&D and physical
investment, in R&D Patents and Productivity (Ed.) Z. Griliches, University Chicago Press,
Chicago, pp. 271-98.
Malaviya, P., & Wadhwa, S. (2005). Innovation management in organizational context: An
empirical study. Global Journal of Flexible Systems Management, 6(2), 1-14. Retrieved from
http://search.proquest.com/docview/201693792?accountid=38789
Mintzberg, H., D. Raisinghani & A. Theoret (1976). The Structure of Unstructured Decision
Processes, Administrative Science Quarterly, 21, 246-275. http://dx.doi.org/10.2307/2392045
Mizik, N., & Jacobson, R. (2003).Trading off between value creation and value appropriation:
the financial implications of shifts in strategic emphasis. Journal of Marketing, 67, 63-76.
http://dx.doi.org/10.1509/jmkg.67.1.63.18595
Moore, Carol Ann, & Constance J. Seidner (1998). OrganizationalStrategy and Training
Evaluation, in Evaluating Corporate Training: Models and Issues, Stephen M. Brown and
Constance J. Seidner, eds., Boston: Kluwer Academic, 19-40.
Mairesse, J., & Mohnen, P. (2004). The importance of R&D for innovation: A reassessment
using french survey data. Journal of Technology Transfer, 30(1-2), 183.
http://dx.doi.org/10.1007/s10961-004-4365-8
Nelson RR, Phelps E (1994) Investment in humans, technological diffusion, and economic
growth. Am Econ Rev 2(3), 69-75.
Morck, R., David A. Strangeland & Bernard Yeung (2002). Inherited Wealth, Corporate
Control and Economic Growth: The Canadian Disease? in R. K. Morck, (ed.) Concentrated
Corporate Ownership (Chicago, Il: University of Chicago Press).
Business and Economic Research
ISSN 2162-4860
2014, Vol. 4, No. 2
www.macrothink.org/ber 113
Ozgulbas, N., Ali, S. K., & Yilmaz, F. (2006). Identifying the effect of firm size on financial
performance of SMEs.The Business Review, Cambridge, 6(1), 162-167. Retrieved from
http://search.proquest.com/docview/197297029?accountid=38789
Sasser, S. L. (2006). Creativity, innovation and integration in global advertising agency
channel relationships: Creativity in the real world. (Order No. 3218294, Wayne State
University). ProQuest Dissertations and Theses, 143-143 p. Retrieved from
http://search.proquest.com/docview/304966567?accountid=38789
Shaheen, S., & Malik, Q. A. (2012). The impact of capital intensity, size of firm and
profitability on debt financing in textile industry of pakistan. Interdisciplinary Journal of
Contemporary Research in Business, 3(10), 1061-1066. Retrieved from
http://search.proquest.com/docview/1013486912?accountid=38789
Srivastava, R., Shervani, T. A., & Fahey, L. (1998). Market-based assets and shareholder value:
a framework for analysis. Journal of Marketing, 62, 2-18.doi:
http://dx.doi.org/10.2307/1251799
Troy, Lisa C., TanawatHirunyawipada, & Audhesh K. Paswan (2008). Cross-Functional
Integration and New Product Success: An Empirical Investigation of the Findings, Journal of
Marketing, 72(November), 132-46. http://dx.doi.org/10.1509/jmkg.72.6.132
Weifeng Sun & Zuhui Huang. (2013), Advertising expenditure,R&D expenditure,and firm
performance, Science Research Management, 34(2), 44-51
Villalonga, B., & R. Amit. (2006). How Do Family Ownership, Control, and Management
Affect Firm Value?, Journal of Financial Economics, 80, 385-417.doi:
http://dx.doi.org/10.1016/j.jfineco.2004.12.005
Warr, Catriona Allan, & Kamal Birdi (1999). Predicting Three Levels of Training Outcome,
Journal of Occupational and Organizational Psychology, 72(September), 351-375.
http://dx.doi.org/10.1348/096317999166725
Winston, A. S., & Baker, J. E. (1985). Behavior analytic studies of creativity: a critical review,
The Behavior Analyst, 8, 191-205.
Wooldridge, J. M. (2009). Introductory to econometrics: a modern approach(4thed.).Cengage
Learning, c2009.
YAFEH Y et YOSHA O; (2003), Large shareholders and banks: Who monitors and how? The
Economic Journal, 13, 128-146. http://dx.doi.org/10.1111/1468-0297.00087
Copyright Disclaimer
Copyright for this article is retained by the author(s), with first publication rights granted to
the journal.
This is an open-access article distributed under the terms and conditions of the Creative
Commons Attribution license (http://creativecommons.org/licenses/by/3.0/).


![INTANGIBLE VALUE –FACT OR FICTION - AI Home | … · [IAS 38.8] 3. INTANGIBLE VALUE –FACT OR FICTION ... 2.36 INTANGIBLE PROPERTY (INTANGIBLE ASSETS): Non-physical assets, …](https://img.pdfslide.us/doc/110x75/5af0812f7f8b9ac2468e1bc2/intangible-value-fact-or-fiction-ai-home-ias-388-3-intangible-value.jpg)