Embed Size (px)
Citation preview
Impact of climate Change on forest ecosystems in India
Rajiv Kumar ChaturvediNational Environmental Sciences Fellow
Indian Institute of ScienceBangalore

CLIMATE CHANGE AND FOREST SECTOR
Forests are a critical sector for climate change science and policy.
1. Source to CO2 emissions contributing to Global warming and Climate Change- In 2008 forests contributed to 12% of the global GHG emissions (Le Quere et al. 2009)
2. A sink to CO2,leading to mitigation of Climate Change- Globally LULUCF sector is estimated to have a mitigation potential of 13.8 GtCO2e/yr by 2030 at carbon prices less than or equal to US$/tCO2e (Nabuurs et al. 2007)
3. Vulnerable to the impacts of Climate Change - Most DGVMs (dynamic global vegetation models) show significant forest dieback towards the end of this century in tropical, boreal and mountain areas (Fischlin et al. (2007)
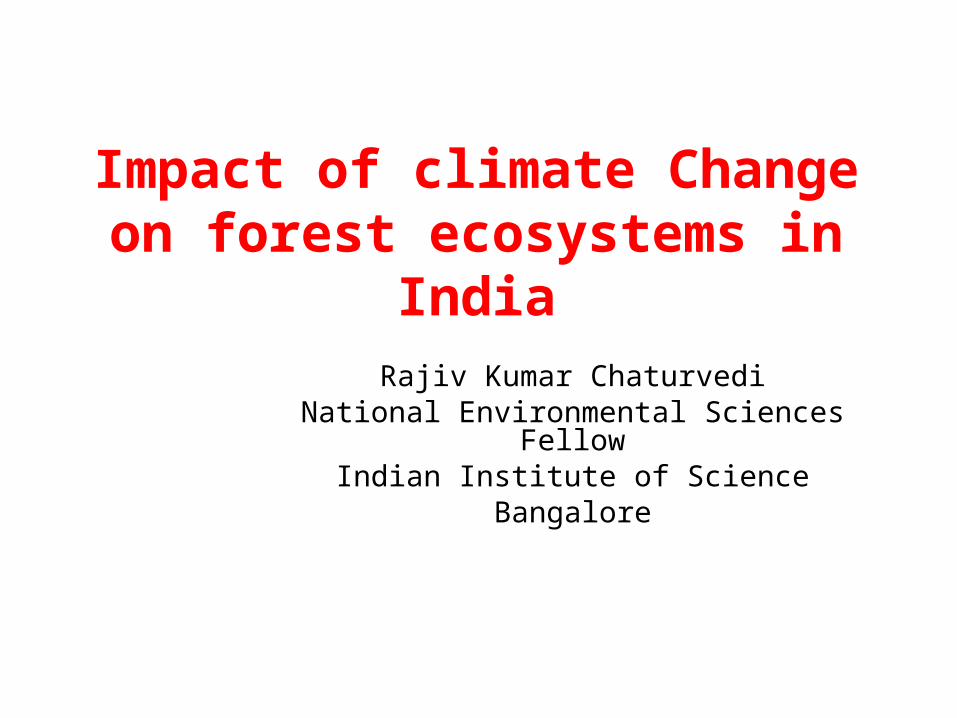
STATE OF INDIAN FORESTS
Source: Champion & Seth, 1960
Source: Forest survey of India

MAN-MADE DISTURBANCE AND FOREST FRAGMENTATION
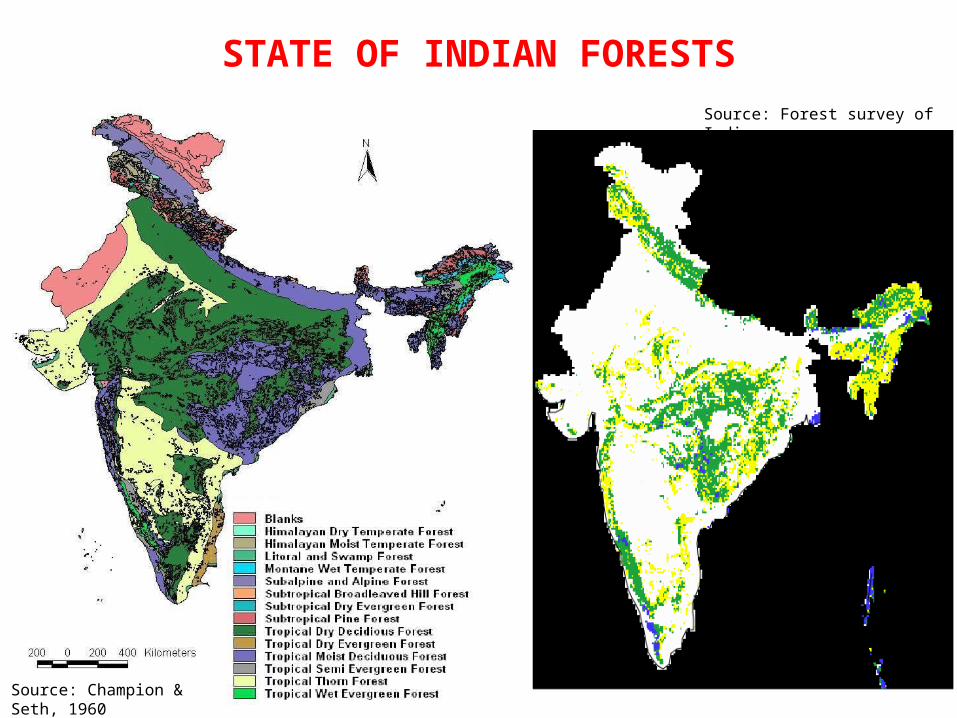
How does the projected climate change impact Indian forests?
-Changes Net Primary productivity-Changes biomass and soil carbon, and
-Changes vegetation distribution patterns
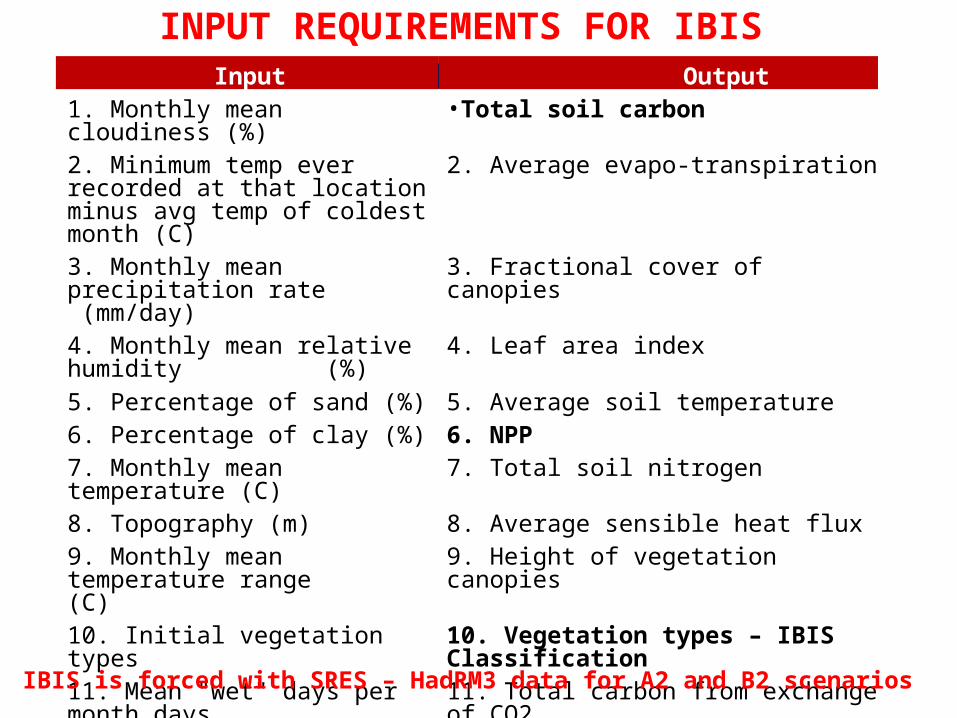
Input Output1. Monthly mean cloudiness (%) •Total soil carbon 2. Minimum temp ever recorded at that location minus avg temp of coldest month (C)
2. Average evapo-transpiration
3. Monthly mean precipitation rate (mm/day)
3. Fractional cover of canopies
4. Monthly mean relative humidity (%)
4. Leaf area index
5. Percentage of sand (%) 5. Average soil temperature6. Percentage of clay (%) 6. NPP7. Monthly mean temperature (C) 7. Total soil nitrogen8. Topography (m) 8. Average sensible heat flux9. Monthly mean temperature range (C)
9. Height of vegetation canopies
10. Initial vegetation types 10. Vegetation types – IBIS Classification11. Mean "wet" days per month days 11. Total carbon from exchange of CO2 12. Monthly mean wind speed at sig=0.995 m/s
INPUT REQUIREMENTS FOR IBIS
IBIS is forced with SRES – HadRM3 data for A2 and B2 scenarios

MODEL VALIDATION – VEG TYPE CHANGE
1.Tropical wet evergreen forests,2.Tropical semi evergreen forests, 3.Tropical moist decidious forest, 4.Tropical dry decidious forest, 5.Tropical thorny/scrub forests, 6.Tropical dry evergreen forest,7.Littoral and swampy forest, 8.Subtropical broad -leaved hill forests, 9.Subtropical pine forests, 10.Sub-tropical dry evergreen forests, 11.Montane wet temperate forests, 12.Himalayan wet/ moist temperate forests, 13.Himalayan dry temperate forests, 14.Sub-alpine forests, 15.Moist alpine, 16.Dry alpine
1: tropical evergreen forest / woodland, 2: tropical deciduous forest / woodland, 3. temperate evergreen broadleaf forest / woodland, 4: temperate evergreen conifer forest / woodland, 5: temperate deciduous forest / woodland, 6: boreal evergreen forest / woodland, 7: boreal deciduous forest / woodland, 8: mixed forest / woodland, 9: savanna, 10: grassland / steppe, 11: dense shrubland, 12: open shrubland, 13: tundra, 14: desert, 15. polar desert / rock / ice
Chaturvedi et al. 2011

MODEL VALIDATION - NPP
Model generated current NPP (kgC/m2) compared with the remote-sensing-derived mean NPP data from 1982 to 2006
R2 = 0.63
Chaturvedi et al. 2011
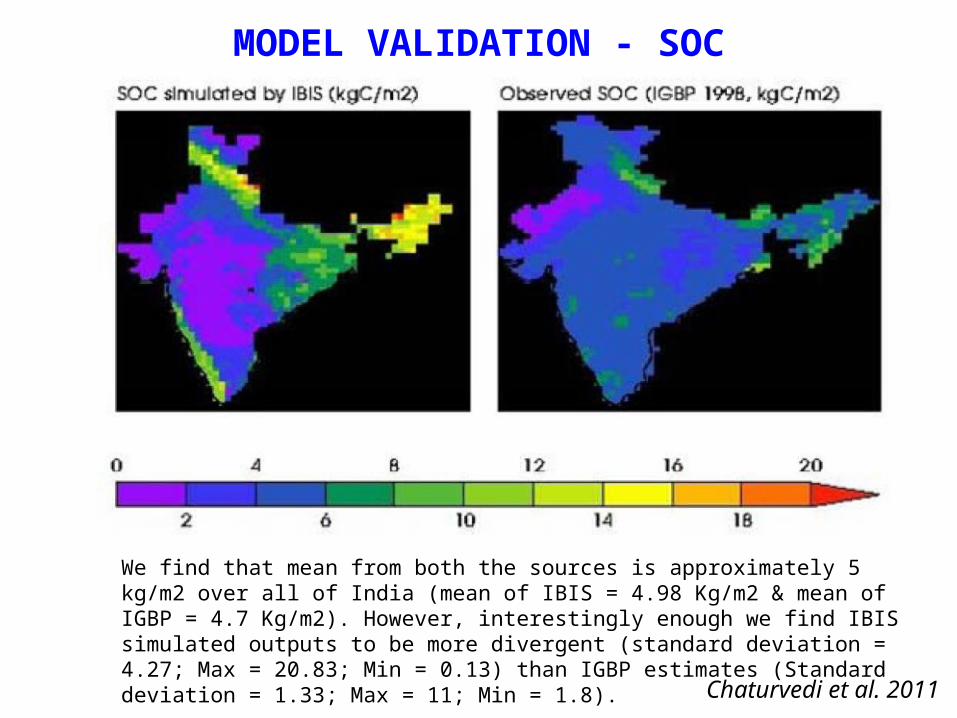
MODEL VALIDATION - SOC
We find that mean from both the sources is approximately 5 kg/m2 over all of India (mean of IBIS = 4.98 Kg/m2 & mean of IGBP = 4.7 Kg/m2). However, interestingly enough we find IBIS simulated outputs to be more divergent (standard deviation = 4.27; Max = 20.83; Min = 0.13) than IGBP estimates (Standard deviation = 1.33; Max = 11; Min = 1.8).
Chaturvedi et al. 2011

MODEL VALIDATION - SOC
Forested sites were found to have higher soil organic carbon with an average of 97 tonnes /ha compared (with a standard deviation of 19.8 tC/ha) to Non-forested patches with an average of 64 tonnes/ ha (with a standard deviation of 27.2 tC/ha). The average Soil Organic Carbon in the region was found to be 78.15 tonnes C/ha (S.D =29.2) as compared to 89.13 tonnes C/ha as predicted IBIS for that particular grid.
Chaturvedi et al. 2011
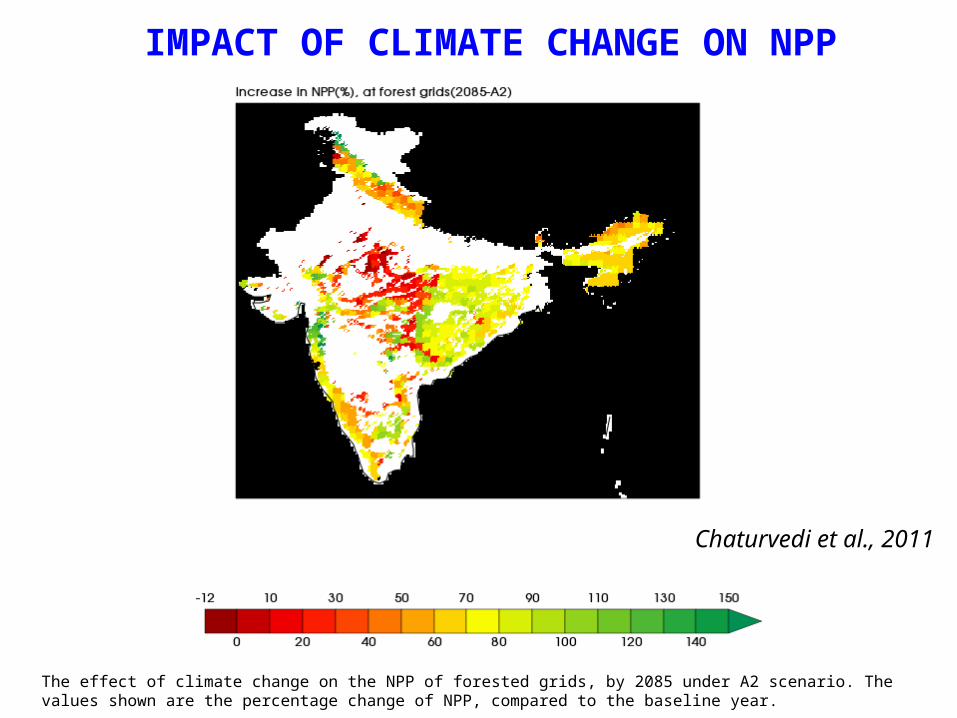
The effect of climate change on the NPP of forested grids, by 2085 under A2 scenario. The values shown are the percentage change of NPP, compared to the baseline year.
Chaturvedi et al., 2011
IMPACT OF CLIMATE CHANGE ON NPP
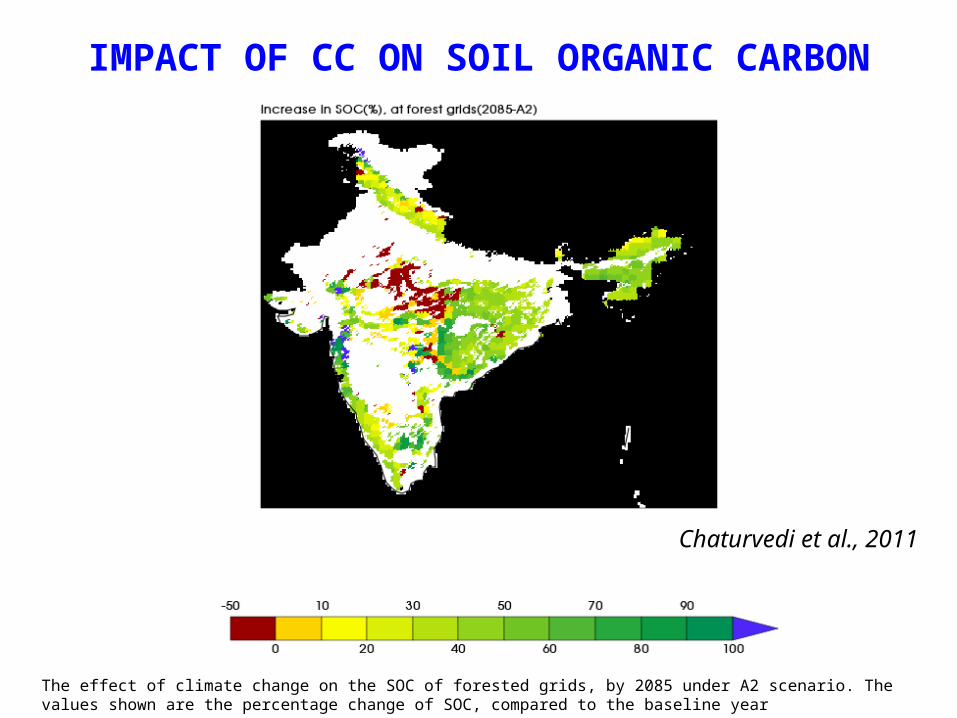
The effect of climate change on the SOC of forested grids, by 2085 under A2 scenario. The values shown are the percentage change of SOC, compared to the baseline year
Chaturvedi et al., 2011
IMPACT OF CC ON SOIL ORGANIC CARBON
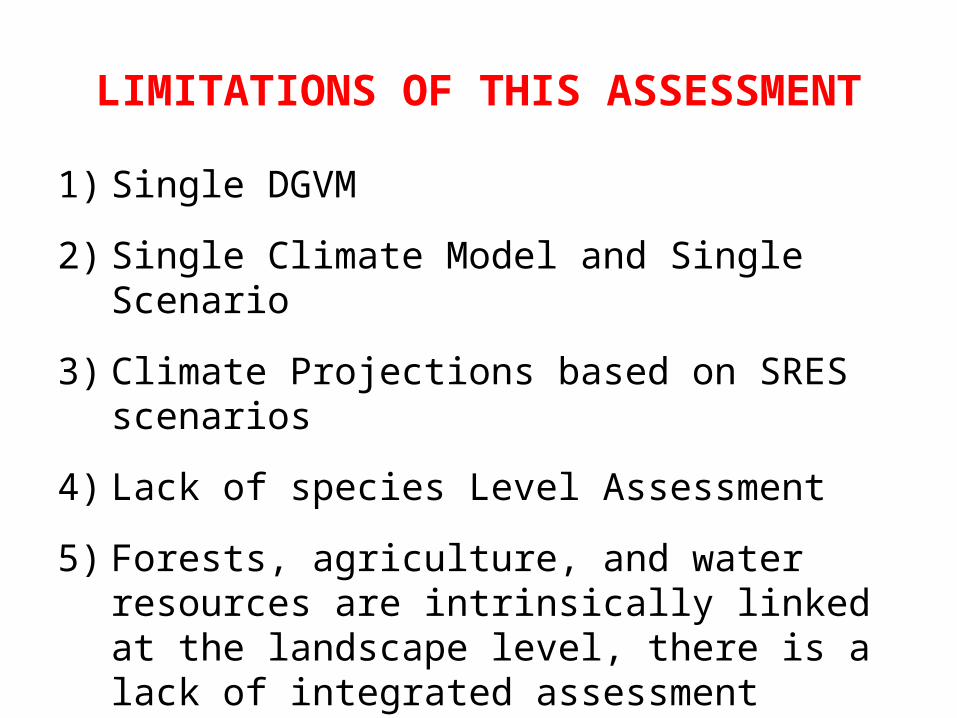
LIMITATIONS OF THIS ASSESSMENT
1) Single DGVM
2) Single Climate Model and Single Scenario
3) Climate Projections based on SRES scenarios
4) Lack of species Level Assessment
5) Forests, agriculture, and water resources are intrinsically linked at the landscape level, there is a lack of integrated assessment
6) Lack of landscape/district/watershed level vulnerability Assessment
7) In sufficient representation of Nitrogen Cycle, Fire/ Pest dynamics in the DGVMs
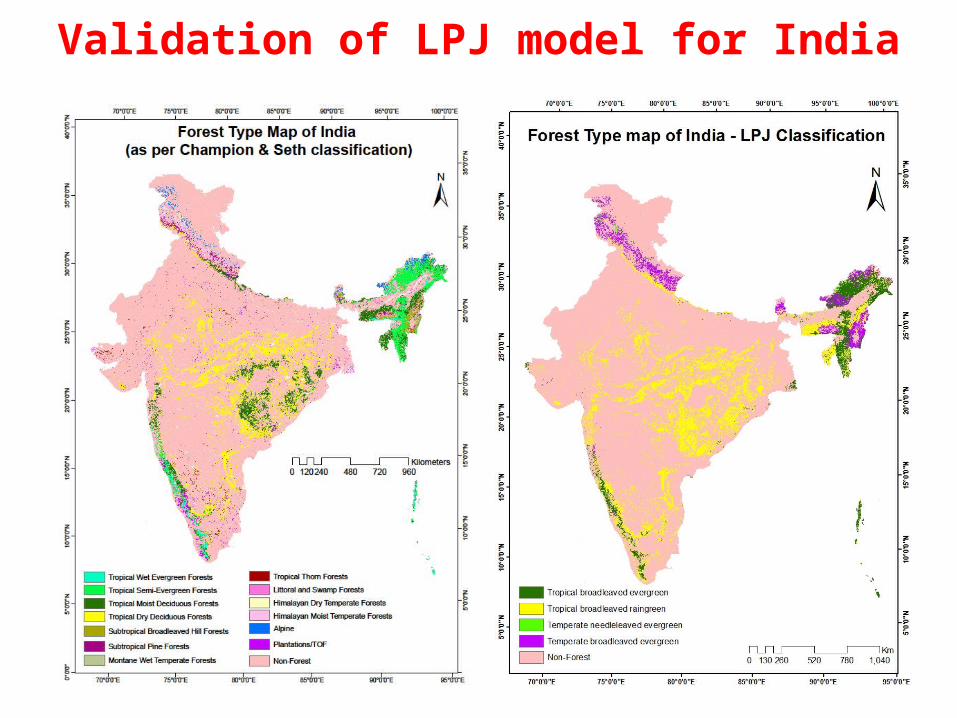
Validation of LPJ model for India
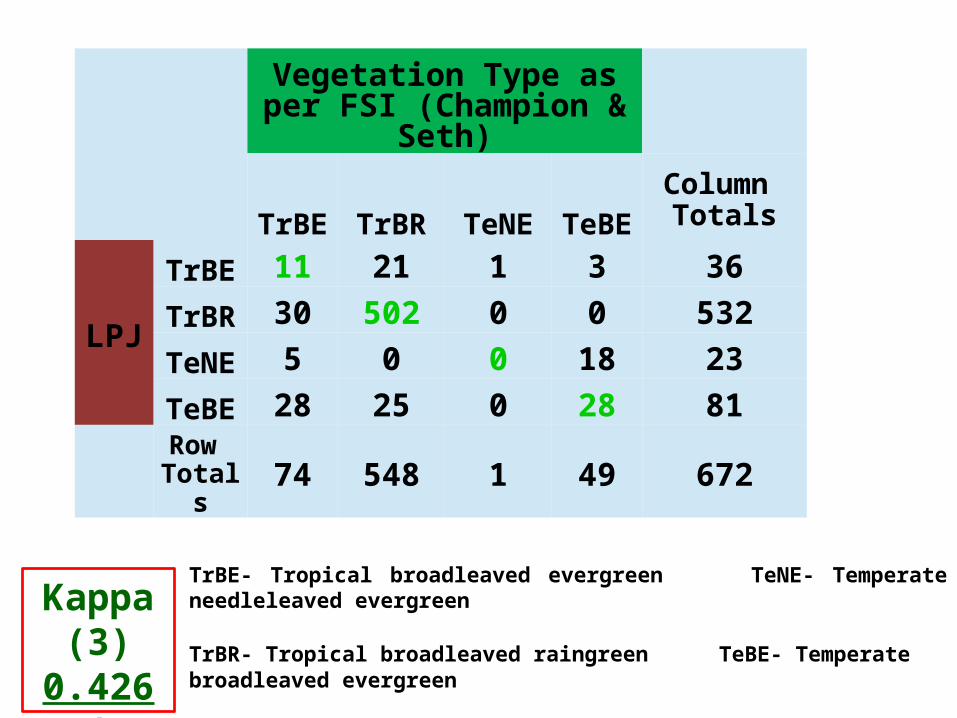
Vegetation Type as per FSI (Champion & Seth)
TrBE TrBR TeNE TeBEColumn
Totals
LPJ
TrBE 11 21 1 3 36
TrBR 30 502 0 0 532
TeNE 5 0 0 18 23
TeBE 28 25 0 28 81
Row Totals 74 548 1 49 672
Kappa (3)
0.4261
TrBE- Tropical broadleaved evergreen TeNE- Temperate needleleaved evergreen
TrBR- Tropical broadleaved raingreen TeBE- Temperate broadleaved evergreen
TeBS- Temperate broadleaved summergreen
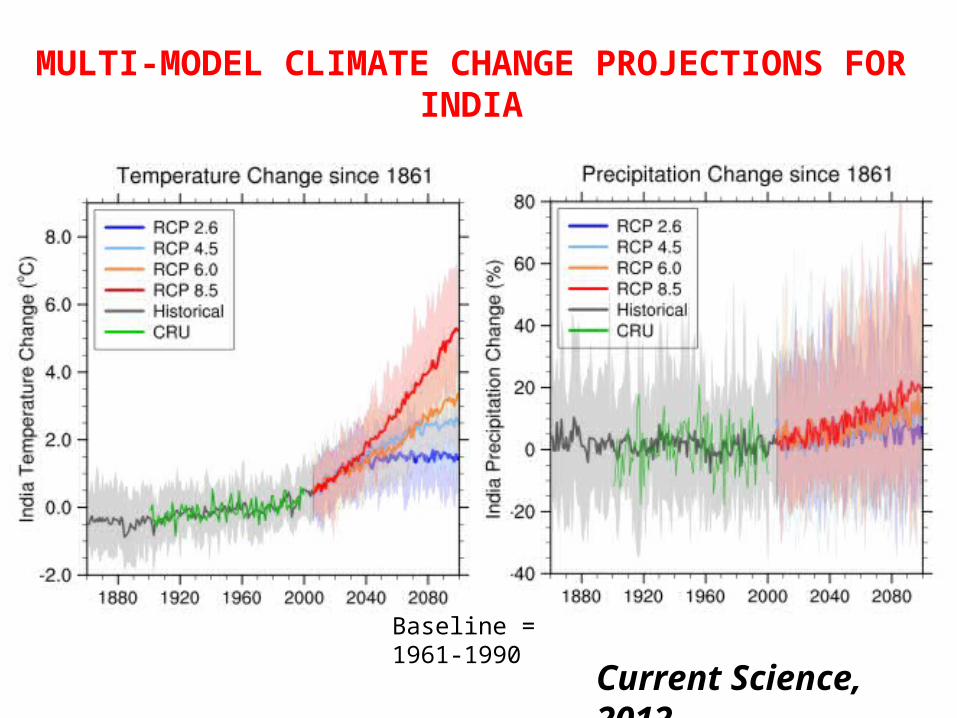
Baseline = 1961-1990
Current Science, 2012
MULTI-MODEL CLIMATE CHANGE PROJECTIONS FOR INDIA
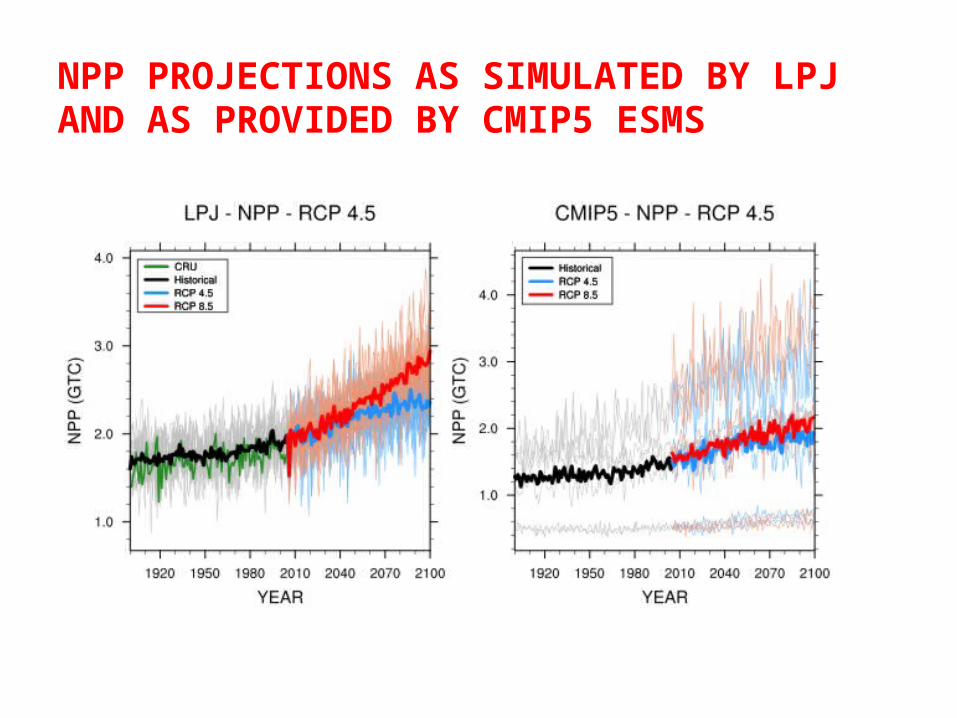
NPP PROJECTIONS AS SIMULATED BY LPJ AND AS PROVIDED BY CMIP5 ESMS
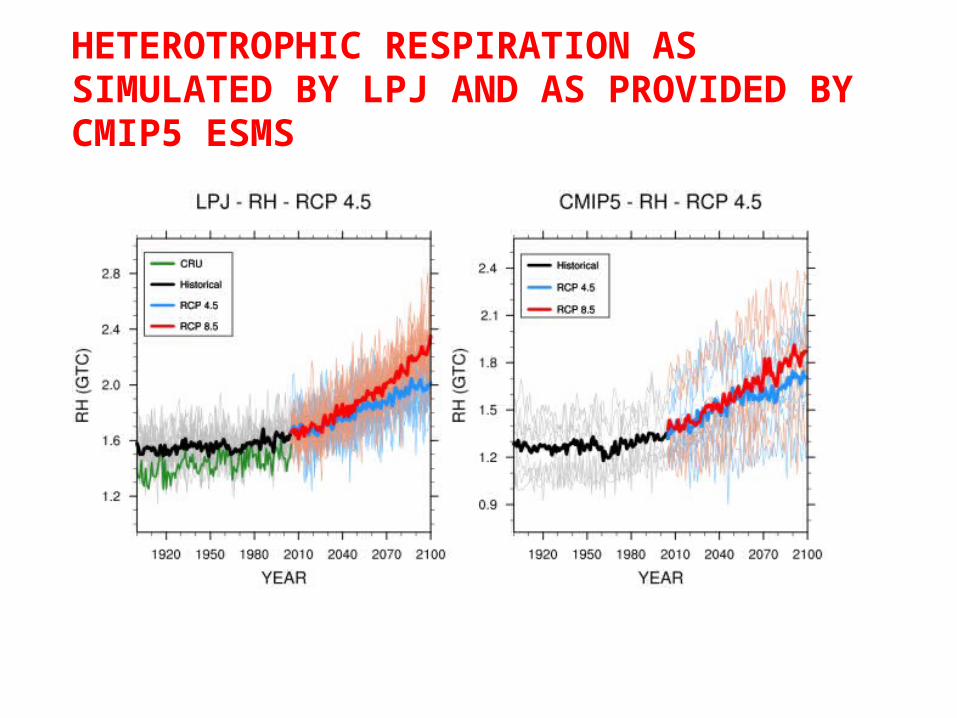
HETEROTROPHIC RESPIRATION AS SIMULATED BY LPJ AND AS PROVIDED BY CMIP5 ESMS
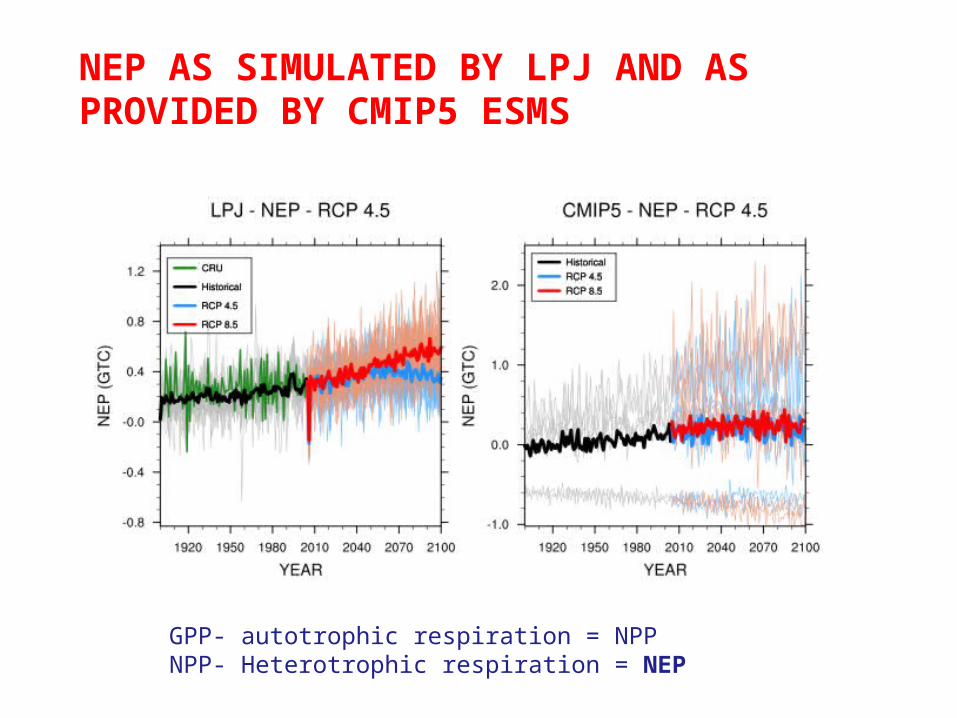
NEP AS SIMULATED BY LPJ AND AS PROVIDED BY CMIP5 ESMS
GPP- autotrophic respiration = NPPNPP- Heterotrophic respiration = NEP
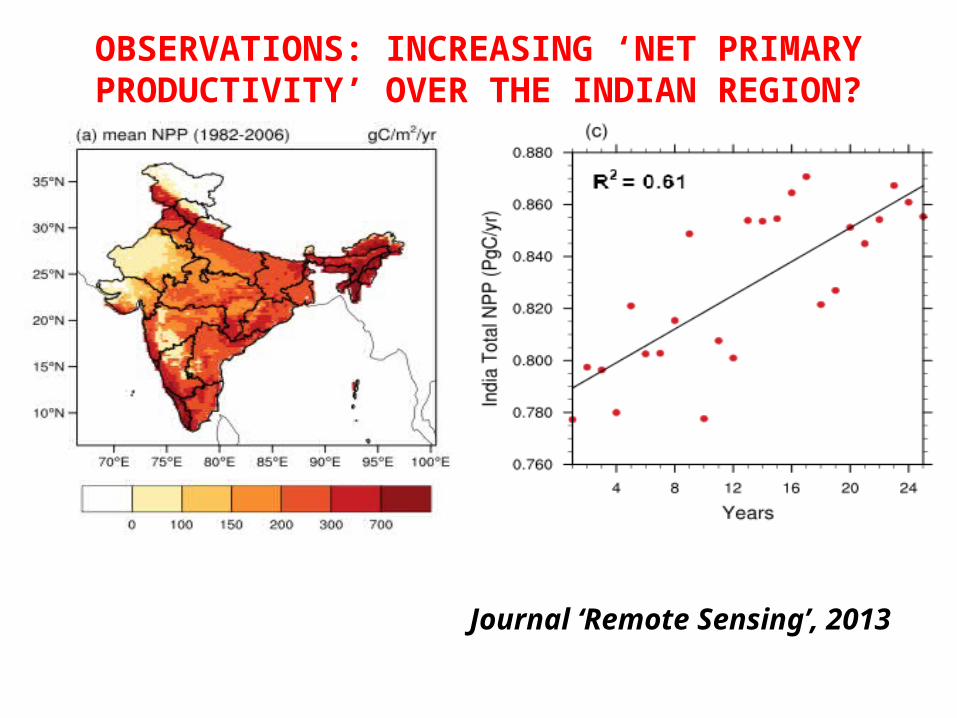
OBSERVATIONS: INCREASING ‘NET PRIMARY PRODUCTIVITY’ OVER THE INDIAN REGION?
Journal ‘Remote Sensing’, 2013
IMPACT OF CLIMATE CHANGE ON VEGETATION DISTRIBUTION IN INDIA

1 = stable grids
2=forest grids undergoing change
Chaturvedi et al., 2011

MAN-MADE DISTURBANCE AND FOREST FRAGMENTATION
FOREST VULNERABILITY TO CLIMATE CHANGE, ARISES DUE TO HUMAN FACTORS OF DEFORESTATION, FOREST DEGRADATION AND FOREST FRAGMENTATION – WHICH INHIBITS
THE VEGETATION'S ABILITY TO DISPERSE, POLLINATE AND MIGRATE
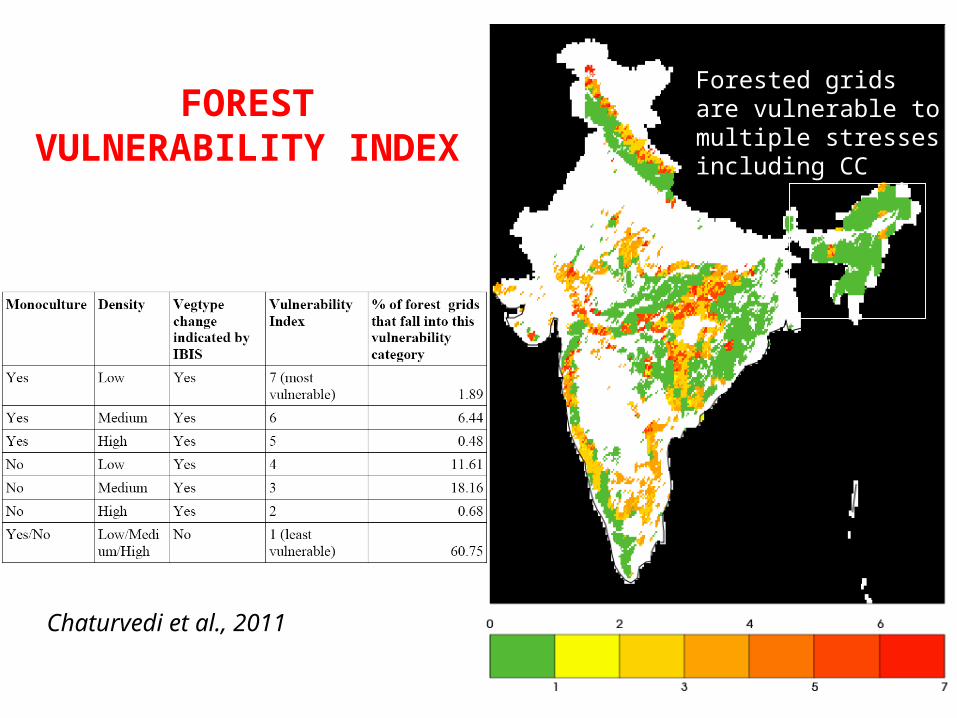
FOREST VULNERABILITY INDEX
Chaturvedi et al., 2011
Forested grids are vulnerable to multiple stresses including CC

LIMITATIONS OF IMPACT ASSESSMENT STUDIES IN INDIA
1. Lack of observational data, also observed impacts of CC not well quantified for different natural and production systems
2. Lack of climate data downscaling for local level applications
3. Uncertainty in the precipitation projections remains largely unaddressed
4. Overall uncertainty in the climate change impact projections are NOT quantified due to use of a single climate model, single scenario and single impact assessment model
5. Most of the impact assessment is based on mean climate, whereas it is the extreme climate that causes the maximum damage
6. Modelling and projections of extreme precipitation events remains a challenge
7. Most of our impact assessment models are coming from either Europe/US and these are tailor-made for these regions, and NOT for India

Thanks