Embed Size (px)
Citation preview

Executive Summary China’s entry into the WTO opens up both opportunities as well as threats to the Indian
industry. Chinese entry shall increase the voice of developing nations in the WTO and
can enable them to have their demands of greater protection to domestic industries
accepted. India and China globally compete in the same export markets; Chinese entry
shall make Indian exports uncompetitive and threaten traditional Indian strongholds such
as textiles, tea and jewellery.
There is also the fear that Chinese goods may flood the Indian markets causing domestic
producers to go out of business. This fear, based on current data is largely unfounded as
there has been no perceptible increase in inflow of goods form China into India since the
easing of Quantitative Restrictions, over one year ago.
China is ahead of India both in terms of trade openness as well as its promised
commitment to further trade liberalization. China’s entry into the WTO shall force Indian
industry to become more competitive and shall pave the way for second-generation
market reforms in India. Labour market reforms, interest term structure reforms and basic
infrastructure reforms shall spur growth and competitiveness by cutting costs.
China’s huge market also becomes a potential market for Indian goods and increasing
domestic competitiveness can be leveraged by pushing exports.
Thus the potential for Indian industry to take advantage of the opportunity is large, but
needs to be backed up with forward- looking strategic policy initiatives form the
government. In a rapidly globalizing world economy there is no room for protectionism
and industry must compete based on its inherent strengths. Thus domestic industry needs
reforms in market structure to spur competiveness.

Introduction The WTO is a transnational organization that regulates trade between nations. It was
formed on the 1st of January 1995 by the Uruguay Pact countries. It has 142 countries as
its members. WTO provides a forum for trade negotiations, technical assistance and for
cooperation with other international organizations. The WTO wields tremendous
influence in shaping the course of world trade. Membership of the WTO, therefore,
enables nations to have a say in the framing of policies for their benefit.
India and China are emerging as the two largest markets in the world today. Foreign trade
has been one of the key factors fuelling high GDP growth rates (6.1% and 10.7%1
respectively for the years 1990 to 1999) in both these nations. In this context, the role of
the WTO as a body, which regulates and promotes trade assumes tremendous
significance for these countries.
India is a founder member of the WTO. The recent Doha summit of the WTO saw the
entry of China into the WTO. The entry of China had been held up because of
disagreements on the removal of trade barriers, which protect the Chinese domestic
industry from foreign competition. But all these disagreements have been resolved
through mutual bilateral agreements under the rules of the WTO.
China’s entry opens up a host of opportunities and threats for India. On one hand, it can
lend strength to the lobby of developing nations within the WTO. On the other, Chinese
industry will be able to compete in the Indian market on favourable terms.
This project will attempt to study the impact of China’s entry in the WTO on India by
examining the various issues and will also try to formulate a possible strategy so as to
optimise the gains accruing to India.
The present project allows us to use our skills towards good project planning and to apply
our knowledge of strategic issues to a dynamic environment involving deep structural
change.
1 Department of Economics and Statistics, Tata Services, Statistical outline of India, 2001, Bombay 241.
Literature Review China’s foreign trade increased explosively, from about $202 billion in the late 1970s to
$475 billion in 2000. By 2000 its share of total world trade had sextupled as compared
with 1977 and as early as 1995 China had become one of the top ten trading countries in
the world. Simultaneously, the total stock of foreign direct investment in China accounted
for almost a third of the cumulative foreign direct investment in all developing countries.
India’s share of total world exports was 0.6% compared to 3.5% of China.
China remains only shallowly integrated into the world economy in certain respects. The
foreign invested firms, which accounted for only about one-eighth of all manufacturing
output, were responsible for almost half of all of China's exports3. High tariffs and an
array of non-tariff barriers meant that some critical sectors of the Chinese economy
remain relatively insula ted from international competition.
Given this history of insularity from the world economy, the Chinese leadership has
increasingly come to the view that one of the principal benefits of becoming a member of
the World Trade Organization is the increased competition it would bring to China's
domestic market. Even though this would entail short-term economic costs, the Chinese
government has come to realize that economic reform and developing a market economy
is an imperative proposition.
During the 1990s, annual growth rates of U.S. merchandise exports to China averaged
16.1 percent 4. Even if annual growth rates in the next decade declined by half, U.S.
2 National Bureau of Asian Research 3 Lardy, Nicholas R., Issues in China’s WTO Accession, US-China Security review May 2001, p. 12. 4 Lau, Lawrence, J, New Estimates of the United States-China Bilateral Trade Balances, Institute for International Studies, Stanford University, April 1999, p. 22.

merchandise exports would reach $32 billion by 2005. Recent studies project that exports
of U.S. merchandise and services to China by 2005 would range from $27.8 to $36.5
billion with the entry of China into the WTO5.
In spite of being a member of the WTO, India still has barriers to trade to safeguard the
interests of domestic industry and trade. These restrictions are allowed by the WTO, but
have to be phased out gradually. The phasing out of the Quantitative Restrictions
coinciding with the entry of China into the WTO shall subject Indian industry to severe
competition. Indian industry has expressed concern that China would take advantage of
subsidized power, low-interest bank loans and lower labour costs in its own country to
dump its products in India. However, the fears of Chinese goods flooding the Indian
market and driving Indian industry out of business seem to be exaggerated. There was no
disproportionate rise in imports in 2000/01 because of the withdrawal of quantitative
restrictions 6.
Global Economic Outlook Since October 2000 the prospects for global growth have weakened significantly, led by a
marked slowdown in the United States, a stalling recovery in Japan, and moderate growth 5 See Exhibit I 6 See Exhibit II

in Europe and in a number of emerging market countries7. Some slowdown from the
rapid rates of global growth of late 1999 and early 2000 was both desirable and expected,
especially in those countries most advanced in the cycle, but the downturn is proving to
be steeper than earlier thought. The revised projections of growth figures for the next two
years8 also indicate that the growth rates are likely to decrease. This data is indicative of a
Global recessionary scenario.
In such a situation nations are looking at spurring growth through increase in trade and
positive trade balances. China’s entry into the WTO at this juncture is expected to
increase the volume of international trade by up to 7%9.
Hence China’s entry into the WTO has far ranging implications not only for India but
also for the Global economy.
Terms of China’s Accession to the WTO The terms of an accession take two basic forms.
7 See Exhibit III 8 See Exhibit IV 9 National Bureau of Asian Research

Firstly there are the Schedules of commitments, which set out the full range of market
access obligations, which China, will be legally bound to grant to every Member when it
enters the WTO. The schedules cover tariffs and non-tariff measures applicable to
agricultural trade and industrial goods (commitments under the GATT), and services
(commitments under the General Agreement on Trade in Services, or GATS).
Secondly there are the Protocol and Working Party Report on the accession of China to
the WTO. These documents, which also include legally binding commitments, essentially
set out how China promises to fulfill her new WTO obligations. As well as containing
detailed descriptions of, and obligations relating to, China’s current and planned trade
and investment régimes, they detail a number of special provisions to which China will
be subject during the first years of her WTO Membership. These temporary derogations
from normal WTO rules are intended to reflect the unique challenge of incorporating
China into the world trading system. This is an economy in the midst of transition from
state ownership to the market based system; a country that has taken many measures to
introduce market economics, but where certain features of a state led economy still
prevail. Most notably, the protocol affords other Members special protection for their
own industries against damaging surges of exports from China.
The terms of accession detail the degree to which China will adopt the WTO rules and
agreements. These govern international trade in goods, agriculture and services, and
include provisions on many related areas such as trade related investment measures,
technical barriers to trade, sanitary and phytosanitary measures, intellectual property
protection, and government procurement.

Political Fallouts The WTO is presently sharply polarized between the developing and the developed
nations. The block of developing nations led by India are pressing for safeguards to
domestic industries from international competition and gradual phasing out of trade
restrictions 10. The developed nations on the other hand want faster phasing out of
restrictions and access of these markets to their industries. This polarization has, as
witnessed at the recent Doha summit prevented agreements from being reached on
strategic issues of Intellectual Property Rights and Quantitative restrictions.
China’s entry into WTO is in India’s interests as China shares India’s point of view on
various WTO issues. It has more diplomatic clout than India, and for the benefit of other
third world countries, might be able to break US and EU hegemony in the multilateral
organization. Thus, China's participation will increase the voice of the developing
countries, so that the rules for the new game at WTO may become more balanced and
more beneficial to the developing countries.
Another political implication of China’s entry is that bilateral sources of trade friction,
notably with regard to accused Chinese dumping of chemicals in India, will be easier to
resolve because China will be under the ambit of the WTO Dispute Settlement Body
China will also become more transparent about its rules and regulations on trade and
investment. All relevant economic data about the country will have to be provided to the
WTO's general council. In case WTO members consider these laws or regulations to be
unfair, a dialogue can be initiated with China under the WTO's dispute settlement
mechanism. This greater transparency in trade practices and advance information can be
utilized in planning countermeasures to unfavorable policies..
10 Interview with Satish Deodhar on 14th December
Economic Fallouts China’s entry into the WTO is a double-edged sword for India. India compares
unfavorably with respect to China on almost all the major Macro economic indicators11.
India’s share of world exports stands at a meagre 0.6%, while China enjoys a 3.5% share
of the total world exports. China is ahead of India both in terms of trade openness as well
as its promised commitment to further trade liberalization.
As per commitments made to the WTO, weighted average tariff rates in India in 2005
will be around 30%, while in the same time frame China will reduce average tariff rates
to 9.44%. Quantitative restrictions (QR) in India remain on 2,714 tariff lines and India is
seeking 3-4 year phase out period of QRs. China has committed itself to phasing most
QRs out by 2002 and the rest by 2005. While agricultural tariffs in India will be in range
of 0 to 300%, average tariff in China will be in the range of 17% by end 2004. Further
China has agreed to remove agricultural export subsidies.
It might turn out in the long run that China has offered to deliver much more than what it
actually can, but in the present situation this is pressurizing India to open up at a much
faster pace and compete with China for foreign investments. In order to understand the
impact of China’s entry on Indian trade we need to analyze respective trade figures and
their projected growth trends.
A region wise analysis of India’s imports and exports shows that the US accounts for
9%12 of India’s imports and 23%13 of India’s exports. This positive trade balance has
increased quite dramatically from the year 199514,after India joined the WTO.
11 See Exhibit V 12 See Exhibit VI 13 See Exhibit VII 14 See Exhibit VIII
A similar analysis of China-US trade figures15 show that the trade balance between them
has reached an all time high in China’s favor. With China now being a member of the
WTO, this trade balance is likely to rise even further. As a large proportion of India’s
exports are to the US, a growth in Chinese exports to the US is a major threat to the
Indian economy.
The effect on India-China bilateral trade is likely to be even more significant. The current
trade figures show a trade balance in China’s favor16. This balance is likely to move
upward after the entry of China into the WTO. Given the fact that China is one of the
largest suppliers of cheap labor- intensive goods in the world market, there are
apprehensions that cheap Chinese goods may flood the Indian market and spell disaster
for local manufacturers.
15 See Exhibit IX 16 See Exhibit X

Sector wise Analysis of Impacts
The major sectors that shall be impacted17 by China’s entry into the WTO are
Textiles
India has welcomed the move to facilitate China’s entry into the WTO in the hope that
the entry of China into the multilateral organization will increase the access of India’s
textiles into Chinese markets and China will also have to come out of its non-transparent
regime of export subsidies. The key question is whether China will get quota free access
in textiles, by January 1, 2005, when the clause in Agreement on Textile and Clothing
comes into force18. If China gets that, India will face more competition in textiles. In fact
the phasing-out of textile and apparel quotas by 2005 will enable China to wrest market
share from other low-cost Asian producers. The textile sector in India is already feeling
tremendous competitive pressure on their bottom line and many textile units are on the
verge of closure. With the easing of quantitative restrictions on imports in 2001, prices of
Chinese goods will ease further due to greater economies in exports.
Consumer Goods
The spur to competitiveness from lower tariffs will make Beijing an even more
formidable competitor in labor- intensive sectors such as shoes and toys. The Chinese are
exporting to India a wide range of low-cost consumer goods that have a mass market in
India such as kitchen-ware, textiles, electronic items, furniture, toys, cosmetics, footwear
and accessories. In fact in the last four years, there has been a deluge of cheap imports
from China – tyres, bicycles, watches and clocks, toys, plastics and dyes, and bulk drugs.
17 See Exhibit XI 18 Interview with G.S.Gupta on 14th December
In the very near future Indian scooter and motorcycle manufacturers are going to face
stiff competition from the Chinese. The sector that will be worst hit will be the small-
scale sector. The Chinese export import corporations are financially stronger, have more
efficient processes and turn out goods at extremely cheap prices. Armed with competitive
advantage of low price the Chinese are moving in new markets at a feverish pace and
Indian exports will also come under serious threat with the entry of China into the WTO.
Farm Products
China has committed to make agricultural import concessions. India has asked for lower
tariffs in 180 such commodities. As the Chinese get richer, their changing food habits
have made the country a net importer of farm products. Thanks to the green revolution
India’s agriculture generates surpluses, which needs places to be sold. Hence India’s
agricultural products shall find a ready market and benefit by China’s entry into the
WTO.
Information Technology Since 1991 India has discovered competitiveness in services, most notably in software.
While there is little bilateral business in this area at present, India’s InfoTech industry
will have to look beyond the West. China is determined to be a major player in the
coming revolution in InfoTech services like electronic commerce. There is hence a large
opportunity in this area for India to capitalize on its competitiveness and increase trade.
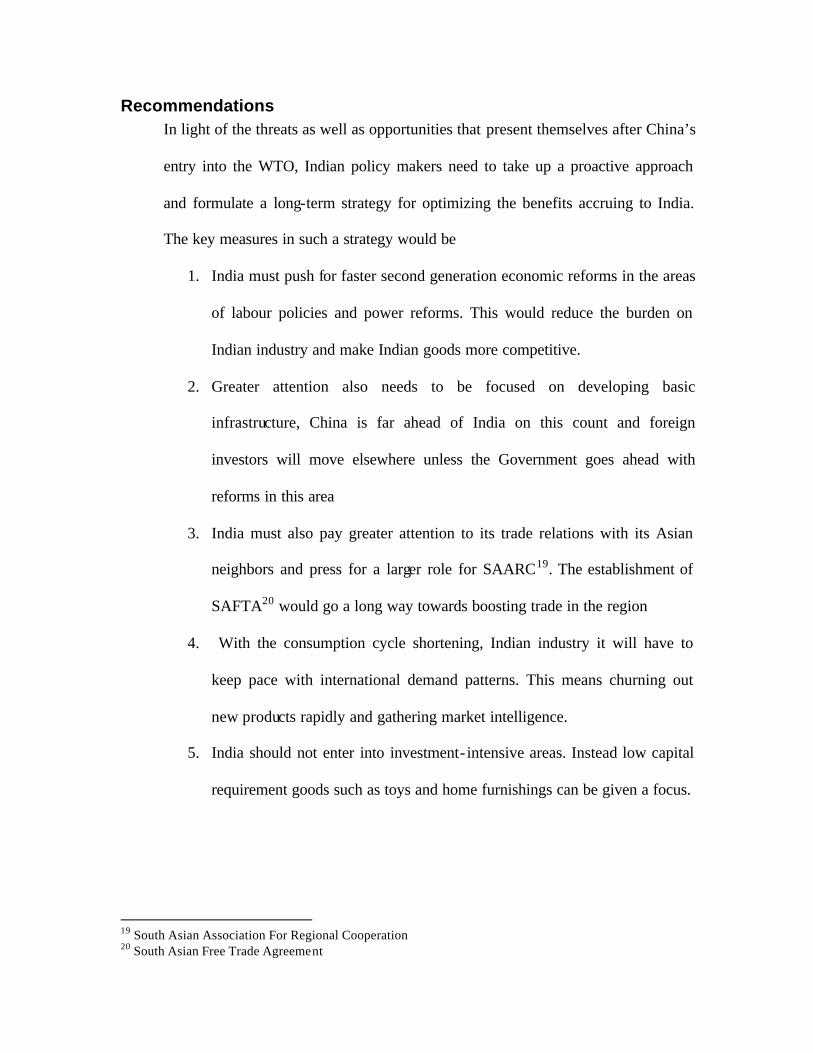
Recommendations In light of the threats as well as opportunities that present themselves after China’s
entry into the WTO, Indian policy makers need to take up a proactive approach
and formulate a long-term strategy for optimizing the benefits accruing to India.
The key measures in such a strategy would be
1. India must push for faster second generation economic reforms in the areas
of labour policies and power reforms. This would reduce the burden on
Indian industry and make Indian goods more competitive.
2. Greater attention also needs to be focused on developing basic
infrastructure, China is far ahead of India on this count and foreign
investors will move elsewhere unless the Government goes ahead with
reforms in this area
3. India must also pay greater attention to its trade relations with its Asian
neighbors and press for a larger role for SAARC19. The establishment of
SAFTA20 would go a long way towards boosting trade in the region
4. With the consumption cycle shortening, Indian industry it will have to
keep pace with international demand patterns. This means churning out
new products rapidly and gathering market intelligence.
5. India should not enter into investment- intensive areas. Instead low capital
requirement goods such as toys and home furnishings can be given a focus.
19 South Asian Association For Regional Cooperation 20 South Asian Free Trade Agreement

Conclusion
China’s entry into the WTO is viewed in India as a mixed blessing. On one
hand it helps India lend voice to its concerns in the WTO on the issue of
protecting domestic industry, but there are also large downsides as our exports
might become less competitive. There are also concerns that Chinese goods
would flood the Indian markets and spell doom for domestic producers.
China’s entry into the WTO also presents significant trade opportunities to
India as it gains access to the largest market in the world. Therefore, in order to
maximize its gains, India must adopt a forward looking strategy aimed both at
neutralizing Chinese competition by making Indian goods more competitive as
well as pushing Indian exports into China.
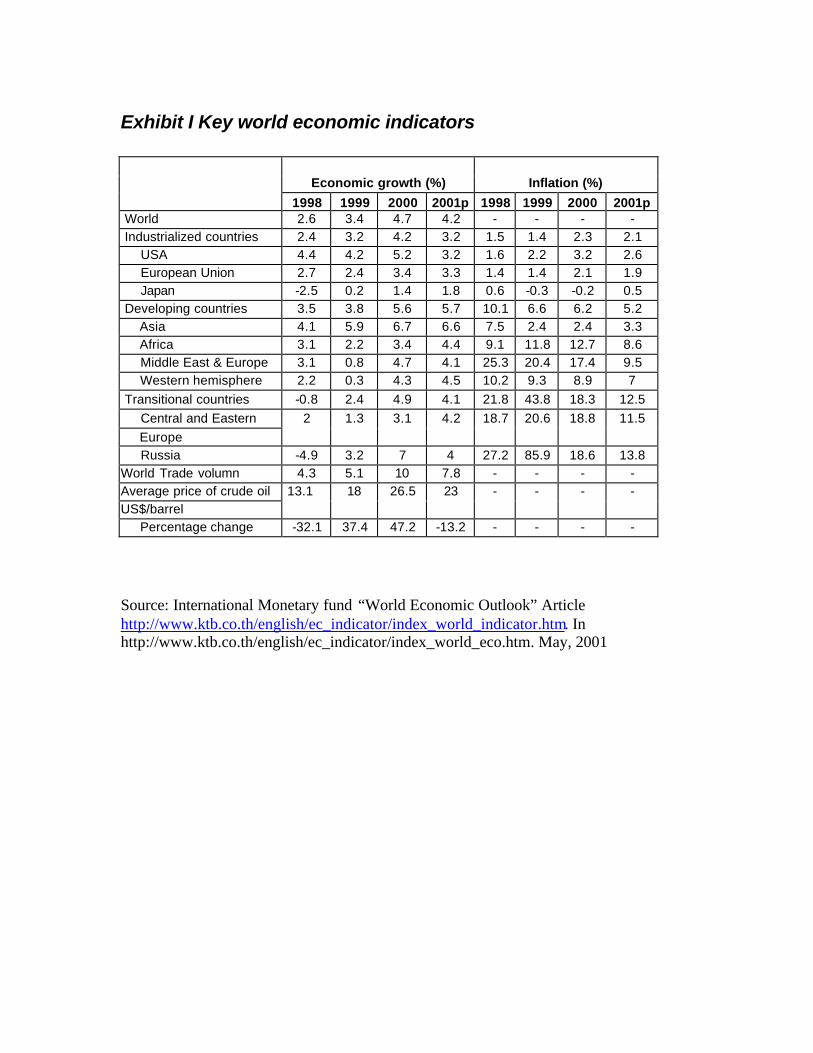
Exhibit I Key world economic indicators
Economic growth (%) Inflation (%)
1998 1999 2000 2001p 1998 1999 2000 2001p World 2.6 3.4 4.7 4.2 - - - - Industrialized countries 2.4 3.2 4.2 3.2 1.5 1.4 2.3 2.1 USA 4.4 4.2 5.2 3.2 1.6 2.2 3.2 2.6 European Union 2.7 2.4 3.4 3.3 1.4 1.4 2.1 1.9 Japan -2.5 0.2 1.4 1.8 0.6 -0.3 -0.2 0.5 Developing countries 3.5 3.8 5.6 5.7 10.1 6.6 6.2 5.2 Asia 4.1 5.9 6.7 6.6 7.5 2.4 2.4 3.3 Africa 3.1 2.2 3.4 4.4 9.1 11.8 12.7 8.6 Middle East & Europe 3.1 0.8 4.7 4.1 25.3 20.4 17.4 9.5 Western hemisphere 2.2 0.3 4.3 4.5 10.2 9.3 8.9 7 Transitional countries -0.8 2.4 4.9 4.1 21.8 43.8 18.3 12.5 Central and Eastern Europe
2 1.3 3.1 4.2 18.7 20.6 18.8 11.5
Russia -4.9 3.2 7 4 27.2 85.9 18.6 13.8 World Trade volumn 4.3 5.1 10 7.8 - - - - Average price of crude oil US$/barrel
13.1 18 26.5 23 - - - -
Percentage change -32.1 37.4 47.2 -13.2 - - - -
Source: International Monetary fund “World Economic Outlook” Article http://www.ktb.co.th/english/ec_indicator/index_world_indicator.htm. In http://www.ktb.co.th/english/ec_indicator/index_world_eco.htm. May, 2001
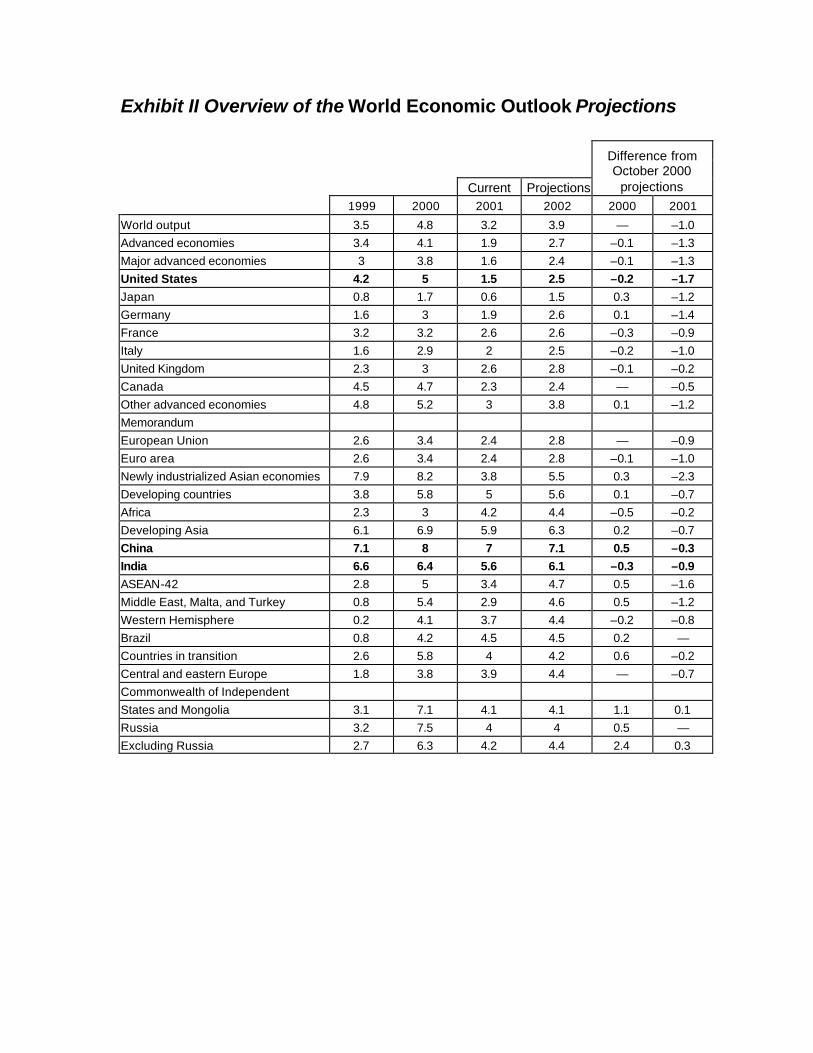
Exhibit II Overview of the World Economic Outlook Projections Current Projections
Difference from October 2000
projections 1999 2000 2001 2002 2000 2001
World output 3.5 4.8 3.2 3.9 — –1.0 Advanced economies 3.4 4.1 1.9 2.7 –0.1 –1.3 Major advanced economies 3 3.8 1.6 2.4 –0.1 –1.3 United States 4.2 5 1.5 2.5 –0.2 –1.7 Japan 0.8 1.7 0.6 1.5 0.3 –1.2 Germany 1.6 3 1.9 2.6 0.1 –1.4 France 3.2 3.2 2.6 2.6 –0.3 –0.9 Italy 1.6 2.9 2 2.5 –0.2 –1.0 United Kingdom 2.3 3 2.6 2.8 –0.1 –0.2 Canada 4.5 4.7 2.3 2.4 — –0.5 Other advanced economies 4.8 5.2 3 3.8 0.1 –1.2 Memorandum European Union 2.6 3.4 2.4 2.8 — –0.9 Euro area 2.6 3.4 2.4 2.8 –0.1 –1.0 Newly industrialized Asian economies 7.9 8.2 3.8 5.5 0.3 –2.3 Developing countries 3.8 5.8 5 5.6 0.1 –0.7 Africa 2.3 3 4.2 4.4 –0.5 –0.2 Developing Asia 6.1 6.9 5.9 6.3 0.2 –0.7 China 7.1 8 7 7.1 0.5 –0.3 India 6.6 6.4 5.6 6.1 –0.3 –0.9 ASEAN-42 2.8 5 3.4 4.7 0.5 –1.6 Middle East, Malta, and Turkey 0.8 5.4 2.9 4.6 0.5 –1.2 Western Hemisphere 0.2 4.1 3.7 4.4 –0.2 –0.8 Brazil 0.8 4.2 4.5 4.5 0.2 — Countries in transition 2.6 5.8 4 4.2 0.6 –0.2 Central and eastern Europe 1.8 3.8 3.9 4.4 — –0.7 Commonwealth of Independent States and Mongolia 3.1 7.1 4.1 4.1 1.1 0.1 Russia 3.2 7.5 4 4 0.5 — Excluding Russia 2.7 6.3 4.2 4.4 2.4 0.3

Exhibit III China: Macroeconomic Indicators
China's Economic Indicators, 1995-2000 1995 1996 1997 1998 1999 2000 Gross Domestic Product (GDP)
5,847.8 6,788.50 7,446.30 7,834.50 8,191.10 8,940.40
Real GDP growth (%) 10.5 9.6 8.8 7.8 7.1 8
Consumer price index (%) 17.1 8.3 2.8 0.8 -1.4 0.4
China's Industrial Output, 1995-2000 Gross value of industrial output 1995 1996 1997 1998 1999 2000Total industrial output 9,189.4 9,959.5 11,373.3 11,904.8 12,611.1 3,957.0% growth 20.3 16.6 13.1 10.8 11.6 9.9State-owned enterprises 3,122.00 3,617.30 3,596.80 3,362.10 3,557.10 1,403.20% growth 8.2 5.1 3.8 0.1 8.8 10.1Collective enterprises 3,362.30 3,923.20 4,334.70 4,573.00 4,460.70 330.1% growth 15.2 20.9 10.2 9.1 6 7.4Individual-owned enterprises 1,182.10 1,542.00 2,037.60 2,037.20 2,292.80 --% growth 51.5 20 15.4 14.7 14.4 --Other enterprises 1,523.10 1,658.20 2,098.20 2,727.00 3,296.20 1,028.70% growth 37.2 23.8 30.2 25.3 27.6 --
China's Financial Indicators, 1995-2000 1995 1996 1997 1998 1999 2000
Exchange rate * 8.4 8.3 8.3 8.3 8.3 8.3 Forex reserves ($bn)
73.6 105 139.9 145 154.7 165.6
Govt. revenue (total) 624.2 740.8 865.1 987.6 1,144.40 1,476.00 Tax revenue 603.8 691 823.4 926.3 1,068.30 1,266.00 Domestic debt 151.1 184.8 241.2 322.9 370.2 150* Foreign debt ($ bn) 106.6 116.3 131 146 151.8 -- Government deficit 58.2 53 58.2 92.2 174.4 259.8 SOURCES: National Bureau of Statistics, People’s Republic of China “PRC Main Economic Indicators” Article http://www.uschina.org/press/econmarch99.html. In uschina.org/press. 2 Feb, 2000

Exhibit VII Breakup of India’s Imports
Indian Imports: Region wise
31%
9%
3%32%
8%
7%
9% 1%
ECM Countries
E.F.T.A Countries
EAST EUROPE
ESCAP
REST OF ASIA &OCEANIAAFRICA
U.S.A
Legend: 1. E.C.M: European Common Market 2. E.F.T.A: European Free Trade Agreement 3. E.S.C.A.P: East, South and Central Asia-Pacific
Source: Ministry of Commerce and Industry, India “Annual Report, 2000-2001” Article http://commin.nic.in/doc/annual/App7.htm in commin.nic.in/doc/annual/App.htm Apr, 2001.

Exhibit VIII Breakup of India’s Exports
24%
1%
3%
1%
27%12%
5%
1%
23%
3%
ECM Countries
E.F.T.A
EAST EUROPEAN COUNTRIES
REST OF EUROPE
ESCAP
REST OF ASIA ANDOCEANIA
AFRICA
SOUTH AMERICA
U.S.A.
OTHER AMERICANAND CARRIBEANCOUNTRIES
India's Exports: Regionwise
Legend: 1. E.C.M: European Common Market 2. E.F.T.A: European Free Trade Agreement 3. E.S.C.A.P: East, South and Central Asia-Pacific
Source: Ministry of Commerce and Industry, India “Annual Report, 2000-2001” Article http://commin.nic.in/doc/annual/App5.htm in commin.nic.in/doc/annual/App.htm Apr, 2001.

Exhibit X Projected US-China Trade Figures
US Exports to China
01020304050
1995 2000 2005 2010
Years
$ B
illio
ns
US Exports toChina
Year $ Billions
1999 20.42000 222001 23.82002 25.72003 27.82004 302005 32.42006 352007 37.82008 40.82009 44.1
Source: K.C. Fung and Lawrence J. Lau, New Estimates of the United States-China Bilateral Trade Balances (Institute for International Studies, Stanford University, April 1999), p. 22.

Exhibit IX India US Trade Figures
Year Imports Exports Balance of Trade 1991 1,999.30 3,192.50 1,193.20 1992 1,917.10 3,779.80 1,862.70 1993 2,778.10 4,553.70 1,775.60 1994 2,294.00 5,309.50 3,015.50 1995 3,295.80 5,726.20 2,430.40 1996 3,328.30 6,169.50 2,841.20 1997 3,607.60 7,322.40 3,714.80 1998 3,564.40 8,237.20 4,672.80 1999 3,687.80 9,070.80 5,383.00 2000 3,662.80 10,686.50 7,023.70
India US Trade Figures
0.002,000.004,000.006,000.008,000.00
10,000.0012,000.00
1990 1995 2000 2005
Years
$ M
illio
ns
Imports ExportsBalance of trade
Source: U.S. Census Bureau “US-India Trade Statistics” Article http://www.indianembassy.org/indusrel/ind_us_trade_2000.html in http://www.indianembassy.org/indusrel Apr, 2001

Exhibit X US China Trade Figures
Year Imports Exports Trade Balance
1990 4.81 15.24 -10.431991 6.28 18.97 -12.691992 7.42 25.73 -18.311993 8.76 31.54 -22.781994 9.28 38.79 -29.501995 11.75 45.54 -33.791996 11.99 51.51 -39.521997 12.86 62.56 -49.701998 14.24 71.17 -56.931999 13.11 81.79 -68.682000 16.19 100.02 -83.83
Note: All figures in US $ Billions
US trade with China
-100.00
-50.00
0.00
50.00
100.00
150.00
1990
1992
1994
1996
1998
2000
Years
$ B
illio
ns Imports
ExportsTrade Balance
Source: U.S. Census Bureau “US-China Trade Statistics” Article http://www.census.gov/foreign-trade/balance/c5700.html in census.gov/foreign-trade/index.html Apr, 2001
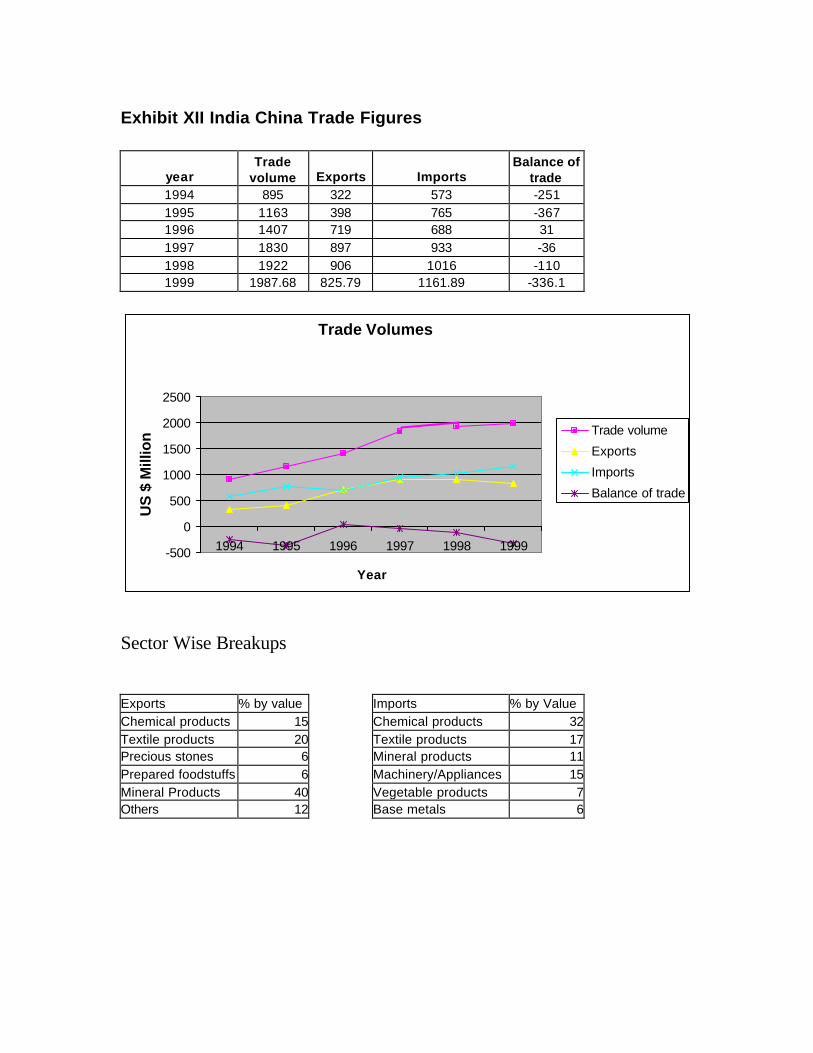
Exhibit XII India China Trade Figures
year Trade
volume Exports Imports Balance of
trade 1994 895 322 573 -251 1995 1163 398 765 -367 1996 1407 719 688 31 1997 1830 897 933 -36 1998 1922 906 1016 -110 1999 1987.68 825.79 1161.89 -336.1
Trade Volumes
-500
0
500
1000
1500
2000
2500
1994 1995 1996 1997 1998 1999
Year
US
$ M
illio
n Trade volume
Exports
Imports
Balance of trade
Sector Wise Breakups
Exports % by value Imports % by Value Chemical products 15 Chemical products 32Textile products 20 Textile products 17Precious stones 6 Mineral products 11Prepared foodstuffs 6 Machinery/Appliances 15Mineral Products 40 Vegetable products 7Others 12 Base metals 6

Exports
% by value
15%
20%
6%6%
41%
12%
Chemicalproducts
Textile products
Precious stones
Preparedfoodstuffs
Mineral Products
Others
Imports
% by Value
32%
17%11%
15%
7%
6%
3%
9%
Chemicalproducts
Textile products
Mineral products
Machinery/Appliances
Vegetableproducts
Base metals
Assisi, Charles. “The misunderstood maharaja”, Express Investment Week, (9 November
1998), 18.
Bhargava, Anil. “Red Storm Rising”, Businessworld, (23 July 2001), 42.
Findlay, C., et al., Asia Pacific Air Transport: Challenges and Policy Reforms.
Singapore: Institute of Southeast Asian Studies, 1997.
[email protected] “PSU’s approved for disinvestment: Air India,” Article
divest.nic.in/psuapp/airindia.htm in divest.nic.in/index.htm. 17 May 2001.
Morrison, Steven; and Winston, Clifford. The Economic effects of Airline Deregulation.
Washington DC: The Blookings Institute, 1986.
Rao, D. Panduranga; and Rao, G. Venkata. Indian Airlines: A study of its performance.
New Delhi: Inter-India Publications, 1997.
Saraswati, Sujan Kumar. “Civil Aviation Environment in India”, Economic and Political
Weekly, (12 May 2001), 1639.
Taneja, Nawal K. The Commercial Airline Industry. Massachusetts: D.C. Health and
Company, 1976.

Exhibit I: Air India’s Present Financial Situation as on 31.3.20001
Paid up Capital Rs. 153.84 crores
Government of India Shareholding Rs. 153.84 crores (100%)
Net Worth Rs.401.97 crores
Net Profit/(Loss) Rs. (-) 37.63 crores
Number of Employees 17,169
Debt-to-equity ratio 10:1
1 [email protected] “PSU’s approved for disinvestment: Air India,” Article divest.nic.in/psuapp/airindia.htm in divest.nic.in/index.htm. 17 May 2001.