Embed Size (px)
Citation preview
NBER WORKING PAPER SERIES
CHINA'S WTO ENTRY:ANTIDUMPING, SAFEGUARDS, AND DISPUTE SETTLEMENT
Chad P. Bown
Working Paper 13349http://www.nber.org/papers/w13349
NATIONAL BUREAU OF ECONOMIC RESEARCH1050 Massachusetts Avenue
Cambridge, MA 02138August 2007
Thanks to Rachel McCulloch, Shang-Jin Wei, Tom Prusa, Marty Feldstein, Richard Cooper, Lee Branstetter,Bruce Blonigen, Will Martin, and conference participants at the NBER for useful comments on anearlier version. Matthew Niedzwiecki and Paul Deng provided outstanding research assistance. TheWorld Bank provided financial support for the collection of data used in this project. All remainingerrors are my own. The views expressed herein are those of the author(s) and do not necessarily reflectthe views of the National Bureau of Economic Research.
© 2007 by Chad P. Bown. All rights reserved. Short sections of text, not to exceed two paragraphs,may be quoted without explicit permission provided that full credit, including © notice, is given tothe source.
China's WTO Entry: Antidumping, Safeguards, and Dispute SettlementChad P. BownNBER Working Paper No. 13349August 2007JEL No. F13,F5
ABSTRACT
This chapter assesses China's integration into the global trading system by examining areas of internationalpolitical-economic "friction" associated with its increased trade. We use a number of newly constructeddata sets to examine tensions associated with its rapidly increasing trade and the trade policy commitmentsthat China and its trading partners have undertaken as part of its 2001 WTO accession. With respectto China's exports, we examine data on WTO members' use of antidumping and their discriminatorytreatment of Chinese firms prior to and following accession. We conclude that the application of antidumpingagainst China has become more discriminatory since its 2001 accession. Furthermore, evidence froma regression analysis rules out the theory that pre-accession discrimination is associated with foreigntargeting of high import tariff Chinese products as a WTO accession negotiation strategy. We alsoprovide evidence that WTO members are also discriminating against China's exports by substitutinguse of new import-restricting "China-safeguard" policy instruments. Next, with respect to China'simports, we examine data on China's antidumping use - now the WTO's fifth most frequent user ofantidumping - by targeted sectors and countries. We also provide evidence from products within China'slargest sectoral user of a positive relationship between the size of the accession year tariff liberalizationand the subsequent resort to antidumping protection after accession. Finally, we examine China's experiencein managing frictions associated with its growing role in world trade through formal WTO disputesettlement proceedings.
Chad P. BownDepartment of Economics, MS021Brandeis UniversityP.O. Box 549110Waltham, MA 02454-9110 [email protected]
1
1 Introduction
Policymakers choose to enter into trade agreements like the WTO for many political and economic
reasons. However, economic theorists have posited two reasons central to this decision: first, that “large”
countries seek reciprocal market access commitments to neutralize the terms-of-trade effects of trade
liberalization; and second, that many countries seek an externally enforced contract in order to credibly
commit domestic sectors to policy reform.1 From the broad perspective of economic theory, China’s 2001
WTO accession might be motivated along the following lines: China agreed to undertake substantial
import liberalization in exchange for greater certainty with respect to market access for its exports; and
China’s program of reform would gain domestic credibility from trading partners’ threat and actual use of
WTO dispute settlement procedures to ensure that China was living up to its liberalization commitments.
This chapter examines China’s political-economic experience in the face of “frictions” in the
international trading system as it transitions to full WTO membership. We use a number of newly
compiled data sources that track areas of international political-economic tensions associated with
China’s increased trade. We focus on both its own exports and the potential changes in policy treatment
they face across foreign markets as well as China’s imports, and its own changes in trade policy
associated with the market access commitments it undertook as part of its 2001 accession. While certainly
only a part of the landscape, the data characterizing the changing nature of trade policies by China and its
trading partners helps us characterize China’s actual WTO accession experience thus far.
With respect to policies facing China’s exports, we examine data on WTO members’ use of
antidumping import restrictions against Chinese firms prior to and following its 2001 accession. While
most economists view antidumping as economically baseless and little more than an easy-to-access tool
of protectionism, there are many insights to be gained from examining its use, especially when it comes to
China’s exporters’ experience. An additional benefit to studying antidumping is that it is a measurable
and relatively transparent policy whose use has spread to many developed and developing countries.
1 For economic theory formalizing the first argument, see Bagwell and Staiger (1999), for the second, see Maggi and Rodriguez-Clare (1998).
2
While it is certainly not the only tool of protectionism, antidumping is increasingly one of the few WTO-
consistent instruments of protection that remains available to policymakers as more and more countries
bind their import tariffs under the WTO and take on other liberalization commitments.2
Therefore, in section 2 of this chapter, we present data revealing the historic foreign use of
antidumping against China’s exporters. These measures reveal one contributing explanation for China’s
desire to seek WTO entry. By using a number of measures across virtually all of the major antidumping
users in the WTO system, we find that China’s exporters faced substantial discriminatory treatment
relative to other exporting country targets during the 1995-2001 period. We also introduce a regression
approach that exploits variation across China’s exported products to examine a previously unexplored
potential explanation for this feature of the data – i.e., that foreign users were more likely to target
China’s products that were benefiting from high Chinese import tariffs. The theory is that high-tariff
products may have been targeted to assist negotiators extract market access commitments from China.
Nevertheless, we rule out this explanation as we find no robust evidence of this relationship in the data.
We also examine WTO member use of antidumping against China since its WTO accession to
assess whether there is any associated change to the pattern of discrimination it has faced. As we also
explore in section 3, any change in the use of antidumping against China by WTO members must be
viewed in light of the potential for members to substitute alternative policy instruments – such as
transitional “China safeguards” and other use of safeguards and import restrictions. Nevertheless, as a
preview to our results, while there are certainly new pressures put on foreign policymakers since 2002
that we are unable to formally control for – generated by the combination of China’s expanding exports
and the fact that policymakers can no longer funnel discrimination against China into their “normal”
2 As further motivation on welfare-economic grounds, Gallaway, Blonigen and Flynn (1999) present evidence from a study of the cumulative effects of U.S.-imposed antidumping that it was the second most costly trade policy program in terms of lost U.S. economic welfare in 1993 at $3 billion, trailing only the Multi-Fibre Arrangement. Thus, despite any given antidumping measure only covering a handful of imported products, the fact that antidumping-using countries do not stop using the policy once they have started and that imposed measures are infrequently revoked once implemented, the cumulative impact of the policy can be substantial for lost economic welfare.
3
application of tariffs – there is evidence from antidumping and other new China-specific forms of
contingent protection that policymakers are increasing discrimination against China’s exporters under
these particular provisions.
The next set of questions we explore concerns China’s own import market access liberalization
commitments associated with its WTO accession. An important question facing all countries that have
undertaken substantive, new market access commitments is whether they are subsequently able to live up
to them, despite the political-economic pressure imposed by domestic, import-competing firms that call
for the imposition of new trade restrictions. To examine this issue, we examine data on China’s own new
and growing use of antidumping as well as other import-restricting measures. In the period since its
accession, China has become one of the five most frequent users of antidumping in the WTO system. We
describe the composition of sectors and foreign countries that are the targets of China’s increasingly
important antidumping use, as well as potential explanations for these targets. Finally, in a formal
regression analysis we focus on a subsample of China’s antidumping activity and search for evidence of a
relationship between the size and timing of China’s own import-market liberalization and its subsequent
use of antidumping to re-impose trade restrictions. For products within the chemicals sector – the
dominant industrial user of antidumping within China – we find economically significant evidence that
the larger was the accession year (2001-2002) tariff reduction, the greater is the probability that the
product subsequently sought new protection from imports via antidumping during the post-accession
period.
Finally, in section 5 of this chapter, we examine data on how China has been learning to manage
trade frictions through the formal, multilateral auspices of WTO dispute settlement proceedings. The data
indicates that, despite predictions based on its share of global trade and diversity of trading partners that
might have led to expectations that China would be a frequent litigant in WTO disputes, such activity did
not materialize in the first five years after its accession. Instead, China has stood on the sideline of other
countries’ disputes learning about the process in anticipation. Nevertheless, a flurry of recently initiated
4
disputes as well as other related policy changes and external shocks indicates that China’s role in future
WTO dispute settlement may be substantially altered going forward.
2 Foreign Use of Antidumping against China’s Exports
Prior to China’s accession to the WTO in 2001, existing members were unconstrained by WTO rules for
how to treat imports from China. I.e., while WTO members are expected to afford one another most-
favored-nation (MFN) treatment for the application of tariffs, members were nevertheless not required to
offer such treatment to nonmembers like China. Nevertheless, some countries did offer Chinese exports
reasonable access to their markets – either through voluntary MFN treatment or sometimes even
preferential treatment through programs such as the Generalized System of Preferences.3
Despite not being bound by WTO rules with how to treat imports from China – meaning that a
country could simply unilaterally raise tariff rates applied against imports from China prior to its 2001
accession without being in violation of any multilateral rules – a number of countries nevertheless chose
to limit China’s exports by resorting to policies of administered protection. In this section we examine
how a number of WTO members treated imports from China under the most common form of
administered import protection - antidumping.
We begin this section by documenting the growing use of antidumping across the WTO
membership over time. We then examine antidumping use from the perspective of China’s exporters –
focusing on which trading partners have been using it and against which Chinese export industries it has
been used. We then compare the use of antidumping against China to the use of antidumping against other
frequently targeted exporting countries to illustrate the discriminatory nature of the policy, and we
examine whether there is evidence that how Chinese exporters were treated under the policy prior to its
WTO accession has subsequently changed. Finally, we provide a more formal regression analysis into the
3 For example, the United States Congress voted on a year-to-year basis during the 1990s, after floor debates over a number of issues including its humanitarian record, on whether to continue to grant China most-favored-nation status.
5
question of whether antidumping use against China’s exports prior to its 2001 accession might be
understood as the WTO membership strategically targeting Chinese industries with high import tariffs,
perhaps to increase the depth of China’s own import market access liberalization commitments.
2.1 Antidumping proliferation across the WTO membership
Antidumping use has proliferated across the WTO membership over the last twenty years. According to
WTO (2007a,b), 42 different WTO members initiated antidumping investigations during the 1995-2006
period, while 38 of those countries imposed at least one import restriction under their domestic
antidumping laws. The import-restricting policy has gone from one used primarily by four “historical
users” (U.S., EU, Canada and Australia) in the 1980s, to a trade policy instrument used by an increasing
share of the WTO membership, including a number of developing countries (Prusa 2001, Zanardi 2004).
Table 1 breaks down country-level antidumping using two rough measures (new investigations
and new measures imposed) during two sub-periods of the WTO era (1995-2001 and 2002-2006) around
the date of China’s WTO accession. As the table reveals, roughly 80% of all new antidumping
investigations and measures imposed during the 1995-2001 period was the work only 10 countries – the
previously mentioned four “historical” developed-economy users, and six “new” developing-country
users (Argentina, Brazil, India, Mexico, South Africa and Turkey).4 It is worth noting the continued
importance of these particular 10 countries because they serve as the focus of our empirical analysis of
antidumping use vis-à-vis China described below. We focus on these countries’ use of the import-
4 For a survey of the research literature on antidumping, see Blonigen and Prusa (2003). As Zanardi (2004) reports, each of the “new user” countries had implemented antidumping legislation prior to the WTO’s inception: South Africa (1914), Argentina (1972), India (1985), Mexico (1986), Brazil (1987), and Turkey (1989). Nevertheless, the “historical” users (U.S., EU, Canada and Australia) were the dominant users of antidumping throughout the 1980s; the new users did not begin intensively using antidumping to restrict imports until they undertook their substantial trade liberalization programs of the late 1980s or early 1990s. As we will discuss in substantial detail below, China began its use of antidumping in 1997.
6
restricting policy because we have detailed data on it from an independent source that allows us to pursue
questions that could not be addressed by assessing what countries report to the WTO alone.5
While table 1 suggests that the developed economies have reduced their relative use of
antidumping over the period since China’s accession, the combined efforts of these 10 countries continue
to dominate global use of the policy. Together, they contributed 83% of the new investigations and 68%
of the new measures imposed even as the total antidumping use by WTO members continues to grow,
especially with the emergence of China itself as a major new user (10% of investigations, 11% of new
measures imposed by all WTO members) between 2002-2006.
2.2 Which countries use antidumping to restrict imports from China?
Next we switch perspectives from the users of antidumping to its primary target – exporting firms from
China.6 Figure 1 illustrates that the most frequent users of antidumping overall (the 10 countries from
table 1) are also the countries most frequently targeting China with antidumping. By 2001, these 10
countries were initiating roughly 60 new investigations of dumping by Chinese exporters per year. Since
1999, the number of new investigations against Chinese exports from the four historical developed-
economy users of antidumping (U.S., EU, Canada and Australia) has leveled off at roughly 20 per year.
On the other hand, with the exception of a slight drop in 2004, there has been an upward trend in the
number of new investigations per year by the new-user developing-country group – starting from a low of
8 new cases in 1995 to 30 or more new cases against China per year in the 2001-2004 period.
5 While data reported in WTO (2007a,b) is the most up-to-date information available regarding notification of investigations and notification that countries are imposing measures, it suffers from a number of flaws which prevent it from being useful for detailed analysis. For example, the two columns of data for the 2002-2006 of table 1 should not be misinterpreted as yielding information on the share of investigations during that period that resulted in measures being imposed. Countries are also not required to report to the WTO the Harmonized System (HS) product codes of the imports facing antidumping activity as well as a number of other pieces of important information for empirical analysis. The data appendix describes the features of the Global Antidumping Database (Bown, 2007) which contains the detailed data that we rely on for most of the empirical analysis. 6 For prior studies of China as target on different samples of data, see Messerlin (2004) and Liu and Vandenbussche (2002).
7
A comparison of this aggregated data of antidumping use against China during its pre-accession
(1995-2001) versus post-accession (2002-2006) period provides our first indicator that there is no prima
facie evidence that WTO membership has thus far limited the incidence of China exporter’s facing new
investigations of dumping behavior. In section 2.4 below, we examine other features of the data
underlying country-specific use of antidumping to focus on this question in more depth.
2.3 Which Chinese export sectors are targeted by antidumping?
Figures 2 and 3 examine foreign antidumping use against China’s exports over the 1995-2004 period via
examination of the sectors that are most frequently targeted.
Consider first figure 2 which examines the combined data for the historical, developed economy
users of antidumping – the U.S., EU, Canada and Australia. Figure 2a presents the data for the use of
antidumping by sector, while figure 2b presents the information on these sectors' shares of Chinese
exports to these four markets during the time period. A substantial share of the investigations targeting
Chinese products have been in the steel and industrial chemicals categories which are the traditional
sectoral users of antidumping across using countries. Prior to 2004, Chinese textile and apparel exports
were not yet a substantial target of developed economy antidumping – for the most part because these
user countries were able to limit imports through other trade policy instruments such as the WTO
Agreement on Textiles and Clothing, which contained its own transitional safeguard provision during the
phase-out of the Multi-Fibre Arrangement. Furthermore, as we discuss in more detail in section 3 below,
WTO members need not resort to antidumping to limit imports of Chinese textile and apparel products
given that the terms of China’s 2001 WTO accession provide a transitional textile and apparel product
safeguard policy instrument that can be used until 2008. Furthermore, while imports of textile and apparel
products from China have risen in these countries during this time period, their share of China’s total
exports to these economies is in decline as China diversifies its export basket.
8
Figure 3 illustrates the developing country “new user” targeting of Chinese products by sector.
How developing countries have targeted China with antidumping appears quite similar to the developed
economies’ use of antidumping during this time period. Antidumping use against China is also dominated
by the steel and industrial chemicals industries in these developing countries, and Chinese exports in these
industries are relatively stagnant (as a share of total Chinese exports to these markets) over this time
period. Nevertheless, there has been a recent increase in the share of antidumping cases in textile and
apparel products – as some countries have shifted toward the antidumping policy instrument to protect
these sectors – as well as other industries, of which other manufacturing products are also frequently
targeted. As figure 3b indicates, antidumping is increasing at the same time that these developing
countries’ imports from China in these categories has also been increasing dramatically.
2.4 How do antidumping-user countries treat China relative to other exporters?
Examining China as an antidumping target in isolation is a limiting exercise for a number of reasons. The
first is because as a discretionary trade policy, antidumping has the distinguishing feature that user
countries can vary the extent to which their particular application discriminates among targeted trading
partners. In this section we examine how China as an antidumping target compares to other countries
targeted by antidumping. Tables 2 and 3 provide summary data on how major users of antidumping treat
China in terms of various discretionary elements that affect the scope of each user’s discrimination.
Consider table 2, where we examine first the United States’ use of antidumping over the 1995-
2001 period vis-à-vis its most targeted trading partners. By cutting the data in a variety of ways, the
evidence clearly indicates that while the policy could be applied in a relatively nondiscriminatory manner,
the U.S. exhibited considerable discrimination vis-à-vis China during this time period. China is the most
frequently investigated foreign target of U.S. antidumping, facing 13% of all investigations. It was the
largest target despite being only the fifth largest exporter overall to the U.S. market during the 1995-2001
period with 8 percent of the U.S. import market (final column), trailing Canada, the EU, Japan and
Mexico. Second, 68% of the U.S. investigations that Chinese exporters faced resulted in the imposition of
9
a final antidumping measure – a rate that is much higher than the average of 53% across all investigated
countries. Third, despite an incentive for antidumping authorities to seek to name exporters from
additional countries in investigations, China was the only country named in 42% of the investigations that
its exporters faced, while the average across all cases was 20%.7 Finally, in the investigations that resulted
in final antidumping measures being imposed, the average antidumping duty facing exporters from China
was 131.77% - almost twice as high as the average facing all exporters.8 These combined features of the
data for the U.S. use of antidumping indicate that, in practice, antidumping in the United States has
resulted in discriminatory treatment of imports from China relative to other source countries during the
1995-2001 period.9
While these results are neither the only, nor perhaps a fundamental motivating force behind
China’s seeking WTO accession, the data does suggest a potential expected benefit associated with
China’s full membership in the organization – less discriminatory treatment in export markets relative to
other foreign competitors. One potential benefit of China’s accession could be to reign in foreign use of
7 The option to “cumulate” imports from multiple countries in the injury investigation potentially increases the probability of an affirmative injury decision (Hansen and Prusa, 1996), as well as heading off a potential increase in imports from exporting countries not named in the investigation. 8 Note that this chapter does not pursue an empirical investigation into the interesting follow-up question of how – legally and administratively – countries “get away with” discriminating against China via application of higher antidumping duties than those that face other foreign suppliers. First, WTO members differ in when they have agreed to reclassify China as a market economy as opposed to be a non-market economy (NME). For example, under the terms of the 1999 U.S.-China bilateral agreement, the U.S. is authorized to continue using the unfavorable NME designation to evaluate Chinese dumping until 2014. NME status grants antidumping investigators the discretion to designate surrogate countries to be used to estimate measures of Chinese firms’ costs. Second, Chinese firms may be less likely to represent themselves in the U.S. antidumping process, which can result in investigators using the “Best Information Available” (BIA) practices. Both NME and BIA affect the construction of the normal value measure from which to compare the export price in the U.S. market. For an analysis of administrative procedures in the U.S. antidumping process that influence the differential between China and other antidumping-targeted countries, as well as how these dumping margins may be changing over time, see Blonigen (2006). See also the discussion in Moore (2006) and Moore and Fox (2005). 9 There are additional potentially discriminatory elements of the antidumping policy that we do not capture in the tables. First, since antidumping is also a foreign-firm specific trade policy, the instrument can be used to discriminate across firms within a country. The data reported in tables 2 and 3 is the average margin imposed against all firms within that country. Second, firms across countries may differ in their likelihood of receiving offers of the preferable outcome of “price undertakings,” relative to facing the imposition of duties. Third, foreign targets may also be treated systematically different in sunset or administrative reviews of antidumping, affecting when a measure that has been imposed is removed.
10
antidumping against China’s exporters so that they received tariff treatment that was closer to that
provided by a strict application of the WTO’s most-favored-nation principle.
As we explore with greater rigor in a regression analysis described below, there are a number of
potential contributing factors behind the decision to target China during its pre-accession period. For
example, one potential explanation is that WTO members used antidumping as a policy to complement
their negotiations strategy in order to extract more import market accession concessions from China as
part of the accession. Under the assumption that this was a determinant of antidumping use prior to its
accession, an important follow-up question is whether there is evidence that the U.S. has changed its
treatment of China under antidumping after 2001 and there is nothing more to extract from China in terms
of commitments associated with its WTO accession.
The second panel of rows in table 2 illustrates characteristics of U.S. antidumping use between
2002-2004, which is the most recent time period since China’s 2001 accession for which comprehensive
data is available across countries. Note that there is no evidence from this table that the U.S. has lessened
its discriminatory treatment of China via the antidumping policy relative to the pre-accession period. Over
26% of all U.S. investigations during 2002-2004 targeted China, up from 13% in 1995-2001. The U.S.
imposed import restrictions in 76% of the cases in which China was investigated, up from 68% in 1995-
2001. Furthermore, China was the only country named in 52% of the cases in which it was investigated
(up from 42% in 1995-2001), and it faced a conditional mean duty of 148.38% (up from 131.77% in
1995-2001). There is thus no evidence from this data that China’s WTO membership beginning at the end
of 2001 has had a disciplining effect on the U.S. use of antidumping vis-à-vis its exports.10
The other three sets of panels in table 2 extend the analysis of cross-country use of antidumping
by breaking down the data in a similar fashion for the three other developed economy users (EU, Canada,
Australia) and examining the discriminatory application of their antidumping vis-à-vis China. While these
10 This is not necessarily surprising for reasons we discuss in section 5. Because of the self-enforcing nature of WTO dispute settlement and the fact that, as of the time of writing (June 2007), China had yet to take on any substantive offensive initiatives to enforce its market access rights – by challenging U.S. use of antidumping, for example.
11
users do not appear to discriminate between China and other targeted exporters along each of the same
indicators and to quite the same degree as the United States did between 1995-2001, there is nevertheless
substantial evidence of significant differential treatment facing China’s exporters and other major targets
of antidumping. Next, with respect to whether WTO accession has curtailed these countries from
targeting China with antidumping cases, we conclude that there is also no evidence of this effect. There is
some evidence of a general downward trend in the collective use of antidumping by the EU, Australia and
Canada during the 2002-2004 time period. Nevertheless, while the overall use of antidumping by these
countries may have declined, an increasing share of these countries’ total caseload continues to target
China with new investigations: in the EU, 28% of all cases targeted China (up from 14% in 1995-2001),
in Australia it was 16% (up from 10% in 1995-2001), and in Canada it was 26% (up from 11% in 1995-
2001).
Table 3 presents a similar breakdown of the data for the six major developing country “new
users” of antidumping (Argentina, Brazil, India, Mexico, South Africa, Turkey). Evidence from these
users also indicates a distinct pattern of a discriminatory application of the policy vis-à-vis China.11
Furthermore, the discriminatory application appears to be intensifying in the period since China’s WTO
accession – China is the most targeted foreign country in all six of these new users over the 2002-2004
period, despite being no larger than the third largest foreign supplier to any of these markets. One
interpretation of this change is that it appears that many of these developing countries are more than
simply concerned with the implications of preference erosion associated with China’s WTO accession
(and receipt of MFN treatment) and having to compete on equal terms with Chinese exporters in foreign
markets. Many industries in these developing countries are also concerned for their domestic markets and
have increasingly sought new import restrictions to prevent Chinese exports entering their markets as
well.
11 We do not provide summary data on the average size of the measure imposed by the developing countries as it would be nontrivial to construct. Unlike the developed economy users, developing countries are less likely to impose antidumping in the form of simple ad valorem duties and are more likely to impose them as specific duties (denominated in import and/or export currencies), price undertakings or other combinations thereof.
12
While we have found no evidence that the severity of discrimination facing China’s exporters
under foreign use of antidumping has improved relative to China’s pre-WTO accession period, we cannot
make the bolder claim that the WTO accession has not had any impact on its use. As the last column in
each country panel in tables 2 and 3 indicates, China’s export share in each of these economies’ import
markets has also increased during this time period. Ceteris paribus, an export increase means more
products to potentially target with antidumping. Furthermore, there are real reasons to expect countries to
undertake more discrimination vis-à-vis China within the antidumping trade policy instrument for the
post-accession (when compared to the 1995-2001) period. Prior to 2001, if a foreign government felt
domestic political pressure to discriminate vis-à-vis imports from China it may have been able to do use
by raising tariffs directly. Now that China is a member of the WTO, in the face of China’s booming
exports, a WTO member that seeks to legally discriminate against Chinese exports must now funnel that
discrimination into a WTO-consistent policy instrument or face risk of a trade dispute. Raising trade
barriers against China alone via antidumping protection is one such mechanism – we explore other
substitute import-restricting (safeguard) policy instruments in the next section. An alternative way to
implicitly discriminate against China relative to other foreign producers in a WTO consistent manner is to
find a legal way to grant the non-Chinese producers preferential access – examples would include
offering unilateral preferences if the exporters are in developing countries under the Generalized System
of Preferences (GSP) or by forming a preferential trade agreement on a reciprocal basis.12
2.5 Did pre-accession antidumping against China target its high tariffs?
Unlike many other exporting countries that were also subject to antidumping trade restrictions imposed
during the 1995-2001 period, China stands out for one other reason: it was simultaneously negotiating the
terms of its own accession into the WTO. Thus one question to explore is whether a contributing
12 For a discussion of examples of U.S. preferential trade agreements negotiated between 2002-2005 with exporting countries that compete with Chinese exporters in important product categories like textiles and apparel, see Bown and McCulloch (2007).
13
explanation for the discriminatory application of antidumping during the 1995-2001 period (illustrated in
tables 2 and 3) is that existing WTO members were using the policy to complement pressure being placed
on China to liberalize import markets under accession negotiations. We investigate this question by
asking whether Chinese goods that benefited from higher import tariff protection were more likely to be
targeted with foreign antidumping investigations, once we control for other product-level differences.
Evidence of such a relationship would be consistent with a more charitable interpretation of the
discriminatory application of antidumping – i.e., that that foreign trading partners were strategically using
antidumping to attempt to increase the tariff liberalization commitments that China was willing to
undertake under the terms of its 2001 WTO accession.13
We formalize this inquiry by estimating a model of the determinants of a foreign antidumping
investigation over a Chinese export product i each year during the 1995-2001 period.14 We construct an
unbalanced panel for t = 1995,…, 2001 of yearly Chinese exports of 4589 different 6-digit HS products i
to an aggregated, rest-of-the-world trading partner called “Foreign.”15 For our baseline estimates, Foreign
will be the combination of 15 antidumping-using countries – the 10 major users listed in table 1 in
addition to less frequent users such as Colombia, Indonesia, Korea, New Zealand, and Taiwan.16
13 The argument is that, in the presence of a foreign antidumping law, China implicitly assists its exporters by liberalizing its imports of the same product. Foreign countries are more likely to use antidumping against China’s exports if China’s imports are protected by high tariffs because it is easier for foreign competitors to show evidence that Chinese firms “dumped” their exports if those firms are protected by high tariffs at home. A protected home market faces less competition (from imports), resulting in higher domestic prices and thus higher dumping margins when less than fair value determinations are constructed from price-to-price comparisons. For a discussion in the case of China, see Messerlin (2004). 14 Using indicators or counts of measures imposed instead of investigations is likely to give similar results, given the results of tables 2 and 3. Furthermore, evidence dating back to Staiger and Wolak (1994) indicates that even a mere antidumping investigation can have a destructive effect on a country’s exports, even if no trade-restricting measures are ultimately imposed, suggesting that investigations are an important indicator with which to begin. 15 The panel is unbalanced because we condition on there being nonzero exports of the product in that year for there to be an observation. 16 In the aggregate, these fifteen countries received slightly less than 50% of China’s exports during this time period. This percentage is not larger primarily because the list of 15 countries omits two of China’s top 4 export destination markets in Hong Kong (24.0% of exports in 1997) and Japan (17.4% of exports in 1997), neither of which used antidumping against any exporter with any frequency during this time period.
14
We formally estimate this relationship after controlling for a number of other factors and by using
two types of models. The first model is a binomial probit in which the dependent variable is an indicator
for whether any one of the 15 countries initiated an antidumping investigation against Chinese exports of
the product in year t. The second model is a negative binomial regression model in which the dependent
variable is the count of the number of antidumping investigations that the 15 countries cumulatively
undertook against Chinese exports of the product in year t.17 Our explanatory variable of interest is
China’s pre-accession MFN applied tariff for product i – evidence of a positive relationship between the
size of the Chinese import tariff and the event of foreign antidumping investigations against Chinese
exports would support the theory that China’s high tariffs were a contributing determinant to which of its
products were being targeted with antidumping.
There are, of course, a number of other determinants of foreign country antidumping activity
against China’s exports that we seek to control for in the estimation. For example, we expect a positive
relationship between antidumping use in year t and two explanatory variables: the size of China’s exports
of the product (given by the aggregated value of China’s exports of the product to “Foreign” in t-1) as
well as the level of recent growth of those exports (given by the growth of the aggregated value of
China’s exports of the product between t-2 and t-1). We also control for whether there has been recent
prior antidumping activity in the same product against China’s exports with an indicator that takes on a
value of 1 if the same product was subject to an investigation in either t-2 or t-1. Next, we use year
dummies to control for year-to-year macroeconomic shocks in indicators such as exchange rates and
exchange rates, which Knetter and Prusa (2003) have shown affect aggregate filings across countries via
the business cycle. Finally, as there are certain industries that are simply more frequent users of
antidumping across countries, we include industry dummies in the estimation as well.18 The industry
17 A closely-related framework is Knetter and Prusa (2003) which examines determinants of antidumping-using countries’ aggregate yearly filings over time. In contrast, we examine determinants of different products within a single country being filed against over time. 18 The industry definitions that we use can be found in the data appendix. There are a number of potential reasons why certain industries – such as steel and chemicals – are frequent targets of antidumping across all using countries.
15
dummies should also help control for the influence of political-economic elements that we do not control
for separately since we are using a “Foreign” aggregate.
Table 4 presents our estimates of the binomial probit and negative binomial regression models.
The models relate potential determinants of an aggregated “Foreign” that potentially initiates new
antidumping investigations against a Chinese exported product i over t = 1995,…, 2001. Consider first the
estimates of the marginal effects of the binomial probit model reported in columns (1). The signs of the
estimated effects are broadly consistent with the underlying theory. As for the control variables, China’s
larger export product categories are more likely to be investigated than export products with lesser value.
The greater is the recent export growth of the product, the more likely it is to be targeted as well, though
this effect is not statistically significant. Products that were targets in the recent past (t-2 or t-1) are also
more likely to be targeted in t. This relationship holds even after we control for industry-level effects that
indicate it is more likely that products in industries such as chemicals, textiles and apparel, footwear,
metals, and transportation equipment are all more likely than the omitted industry category (other
miscellaneous products) to be investigated.
Nevertheless, the key variable of interest is the effect of China’s pre-accession import tariff rate
on the probability that that export product is subject to a foreign antidumping an investigation. In column
(1), the estimate of 0.015 is positive and statistically significant, which provides preliminary evidence in
support for the underlying theory that export products with higher import tariffs face a higher probability
of being targeted with a foreign antidumping investigation. The economic effect implied by the estimate
is also sizable. The model’s predicted probability that an average Chinese export product is investigated
with an antidumping case in a given year is 0.0084. The mean applied tariff in the underlying data was
0.241 (i.e., 24.1%), so a 10 percentage point increase in this variable above the average (to 0.341)
increases the predicted probability of an investigation to 0.01.
For example, the nature of evidence required in antidumping laws may make it biased toward use by cyclical, capital-intensive industries with high fixed costs. On the other hand, the highly concentrated nature of these industries may make it easier for antidumping to be used in a cross-industry retaliatory manner to facilitate internationally collusive outcomes.
16
Despite preliminary evidence of higher tariff products being more likely to be targeted with
foreign antidumping, as a simple robustness check, we re-estimate the binomial probit model on the same
sample of 1995-2001 data except we redefine the “Foreign” aggregate of Chinese trading partners to only
include the four developed economy historical users of antidumping – the U.S., EU, Canada and
Australia. A number of reasons motivate construction of such a sensitivity analysis. First, these four
economies are relatively large destination markets for China’s exports, thus also providing much of the
variation of the key control variables. Second, the four developed economies were among the major
demandeurs during China’s WTO accession negotiations. Finally, these are the countries with historical
“experience” in using antidumping. Thus, these four countries were the most likely (of any of the
antidumping users) to have the ability to manipulate use of antidumping away from capture of domestic
industry and toward its use for strategic purposes during China’s pre-accession negotiations.
Nevertheless, as the estimates in specification (2) indicate, when we estimate the model on these four
countries’ use of antidumping against China – the positive and significant impact of the China pre-
accession tariff disappears.
Columns (3) and (4) of table 4 present additional robustness checks on these two sets of results.
These specifications use the same explanatory variables and underlying samples of data as (1) and (2); in
them we simply redefine the dependent variable as the counts of antidumping investigations (as opposed
to a 0/1 indicator) facing product i in year t , and we estimate this relationship via a negative binomial
regression model.19 The estimates presented are the model coefficients transformed into incidence rate
ratios (IRRs) which are more straightforward to interpret. In specification (3), which is estimated on the
sample of cumulated exports to and antidumping investigations by 15 antidumping-using countries, the
estimated IRR for the pre-accession applied tariff is greater than 1 and statistically significant at 1.012.
19 For a discussion of the negative binomial regression model see Greene (2000, pp. 880-891). Of the 28265 product-year observations in the 1995-2001 sample, there were 455 non-zero entries. While the count variable could range between 0 and 15 in principal (the number of antidumping-imposing countries in the sample), the maximum was 3, and only 23 products faced investigations in two different countries in the same year. Thus there is little additional variation to be gained in using the negative binomial regression model relative to the binomial probit.
17
The IRR estimate implies that a one unit increase in the applied tariff (from 24.1% to 25.1%, as we have
rescaled this variable for the negative binomial specifications) increases the count of yearly investigations
in that product by 1.2%. Nevertheless, in specification (4), when we redefine the “foreign” aggregate in
the sample to only include cumulated exports to and antidumping use by the U.S., EU, Canada and
Australia, the positive impact of the pre-accession tariff disappears. In fact, since the estimated IRR of
0.991 is less than 1, the estimated impact of a higher pre-accession tariff is to reduce the number of
antidumping investigations in the developed economy users, though this effect is not statistically
significant.
Therefore, we conclude that there is no robust evidence that pre-accession use of antidumping
against China was driven by strategic considerations. To the extent that there was, on average, a
propensity for Chinese exports of products with higher (Chinese) pre-accession import tariffs to be the
target of foreign antidumping, the antidumping over such products was initiated by the developing
country users. It was unlikely that these countries were targeting such products with the strategic purpose
of influencing China’s tariff liberalization commitments under its WTO accession negotiations. An
alternative explanation is that the positive correlation simply reflects a common political economy
pressure facing makers of the same product in China and these other developing countries. It is simply
that the political pressure was manifest in different policy instruments - the political pressure from
import-competing firms within the other developing countries led them to pursue import protection via
new antidumping against China’s exports, while the political pressure from import-competing firms
within China led them to pursue import protection via higher applied tariffs. This would also make sense
since China did not have an active antidumping policy in place during most of this time period.
18
3 Trade Policy Substitution? Other WTO-Consistent Policies to Restrict Imports
from China
One expected benefit to China from WTO accession was that access to a rules-based system with
potential enforcement through effective dispute-settlement provisions would lead to nondiscriminatory
treatment for its exporters as trading partners would be required to abide by the agreement’s MFN
principle of equal tariff treatment. An additional potential benefit to accession might be to help reign in
foreign use of antidumping against China’s exports, as well as perhaps reducing the discriminatory nature
of its application. The data presented in the last section indicates little evidence through 2004 that this has
been the case. Nevertheless, it is important to recognize that even if WTO members had applied a less
discriminatory antidumping policy against China’s exports since 2001, an important question is whether
there were simply other potentially substitutable import-restricting policies that members had been using
to manage China’s export growth instead.
This section examines WTO member use of a number of other trade policy instruments to assess
the likelihood of such trade policy substitution: the transitional product-specific China safeguard, the
WTO’s “regular” safeguard policy, other negotiated safeguard-like trade restrictions such as the re-
emergence of “grey-area” measures and “voluntary” export restraints (VERs) that were banned by the
WTO in prior contexts, and finally countervailing measures under “anti-subsidy” policies. The resort to
such policies in addition to antidumping has arisen as WTO members are now otherwise required to offer
Chinese exporters MFN treatment through their tariff schedules.
3.1 The transitional product-specific China safeguard
A unique feature of China’s 2001 WTO accession is establishment of a “Transitional Product-Specific
Safeguard Mechanism” (Section 16, WTO, 2001) which any WTO importing country can use against
19
China’s exports until 2014.20 As described in Bown and Crowley (2007a), many characteristics of this
new “China safeguard” are at odds with core WTO principles and established instruments of administered
import protection available to members.21 The most radical change introduced by the new China
safeguard is the weakened evidentiary criterion – even relative to antidumping - that members must
satisfy in order to meet WTO legal requirements to impose a new barrier to Chinese trade. Not only is the
threshold domestic injury requirement lower than that required under the “regular” WTO safeguard, but a
clause in this new safeguard allows a second country to justify its own imposition of a new import
restriction after a first country has implemented a China-safeguard on the basis of a “trade deflection”
threat alone, without having to carry out its own injury investigation.22
What countries are using the China safeguard to restrict imports from China, and what sectors are
being targeted? Table 5 provides information on 21 China-safeguard investigations that WTO members
have initiated since China’s 2001 accession. As of data reported by June 2007, seven recent cases had
been resolved with the imposition of new trade restrictions, eight of the investigations concluded with no
new measures imposed,23 and a number of others are still either unresolved or have been resolved without
20 The question of how to accommodate the accession of a substantial new member such as China into the GATT/WTO system is not new, as Japan’s 1955 entry into the GATT raised similar concerns. A 1987 GATT working party pointed out that, despite the desire at the time for some existing members to introduce a new Japan-specific safeguard,
“Japan became a contracting party in September 1955 without any new general safeguard clause being added to the General Agreement. Some [13 out of 34] contracting parties invoked Article XXXV [“Non-Application of the Agreement between Specific Contracting Parties”] on Japan’s accession. In a number of cases, Japan negotiated bilateral trade agreements containing special safeguard clauses which were followed by the countries concerned disinvoking Article XXXV” (GATT 1987, p. 2).
21 First, the allowance of a China-specific trade restriction on imports of fairly traded goods is otherwise inconsistent with MFN treatment. Second, the use of the new China safeguard also does not require the policy-imposing country to immediately compensate China for withdrawing trade concessions which weakens the commitment to the WTO’s reciprocity principle as well. 22 See Bown and Crowley (2007a) and the discussion of Article 16.8 of China’s accession terms (WTO, 2001). See also the discussion in Messerlin (2004) and Andersen and Lau (2002). Bown and Crowley (2007b) provide evidence of trade deflection in the context of Japanese exports being targeted with discriminatory import restrictions. See also Durling and Prusa (2006) for evidence of trade deflection in the hot-rolled steel market. 23 Interestingly, in at least five of the cases in the table that did not result in new measures (four for the U.S., one for Canada) the domestic adminstering authority in charge of the domestic injury/market disruption investigation found
20
notification to the WTO. The products under investigation have some overlap with the sectors that
typically dominate antidumping investigations (steel and chemicals), though there is also use to restrict
footwear, and other manufactures. Since the January 2005 expiration of the Multi-Fibre Arrangement
(MFA) and transitional Agreement on Textiles and Clothing (ATC), resort to the China safeguard has not
surprisingly been dominated by textiles and apparel cases. While most of the countries resorting to the
China safeguard are developing countries, some of these countries (e.g., India, Turkey) are also some of
the biggest new users of antidumping. At a basic level, there is thus some evidence of substitutability
between a country’s use of antidumping to target imports from China and use of a China-specific
safeguard since 2002, suggesting the data presented in tables 2 and 3 is understating the true level of trade
policy discrimination that China’s exports continue to face despite its accession to the WTO.
3.2 The transitional textiles and apparel China safeguard and related voluntary export
restraints
Table 5 does not include all transitional China-safeguard measures; certain WTO members have either
imposed or threatened to impose additional safeguard restrictions on Chinese exports of textile and
apparel products that are not reported there. Such trade restrictions can be justified under a separate
transitional product safeguard mechanism and are available for WTO members to restrict imports of such
products from China through 2008.24 One distinguishing feature between the textiles and apparel China
evidence in favor of new measures and recommended that a new China safeguard import restriction be applied. Despite this recommendation, the final policy decision in each case was not to apply measures. 24 According to WTO’s Trade Policy Review of China (2006, p. 60, emphasis added),
“Article 242 of China's Working Party Report permits WTO Members to request consultations with China if the Member believes that imports of textiles and apparel products of Chinese origin covered by the ATC [i.e., the 1995-2005 Agreement on Textiles and Clothing] are causing market disruption; during the consultation, China will hold exports of the products in question at a level no greater than 7.5% (6% for wool) above the amount entered during the first 12 months or the most recent 14 months preceding the month in which consultations were requested. The restraints established as a result of these consultations will be effective for a year from the date on which consultations were requested unless otherwise agreed. Members can not use simultaneously measures under this provision, and the transitional product-specific safeguard measures under Article 16 of China's Protocol of Accession. Article 242 covers a period up to 2008.”
21
safeguard cases that are treated separately from China-safeguard cases involving other products is that
there is much less transparency – regarding information over investigations or outcomes - in the former.
Moreover, the initiation of safeguard investigation for textile and apparel products and the imposition of
trade-restricting measures are frequently not reported to the WTO Committee on Safeguards.25
In particular, noticeably absent from table 5 are a number of high-profile textile and apparel
China-safeguard cases initiated by the United States and the European Union. In the U.S., one important
way in which this safeguard is distinct is that its injury investigations take place outside of the U.S.
International Trade Commission’s quasi-judicial investigative process that otherwise handles the injury
investigations for antidumping, global safeguards, other China-safeguards, as well as countervailing duty
cases. Instead, the textile and apparel China safeguard injury investigations are handled internally by the
U.S. Department of Commerce’s Office of Textile and Apparel (OTEXA). Table 6 reports data from
OTEXA’s website on the textile and apparel products for which U.S. producers initiated safeguard
investigations and requested import restrictions for 2003-2005.
A common resolution to these U.S. and EU textile and apparel investigations is China frequently
agreeing to voluntarily restrain exports and undertake other grey area measures – a practice that has been
explicitly discouraged in other WTO Agreements.26 For example, shortly after the expiration of the
MFA/ATC in January 2005, a surge in textile and apparel imports from China triggered U.S. and EU
investigations and led each trading partner to negotiate a settlement with China. In the face of the threat of
discriminatory import restrictions in each case, China instead agreed to establish an explicit mechanism to
voluntarily restrain export growth in a number of politically sensitive product categories.27
25 It is for this reason that table 5 does not include all countries’ use of the transitional product-specific China safeguard investigations and/or impositions. 26 VERs were a trade-restricting policy outcome that was frequently used in the 1970s and 1980s, but one which was banned under the WTO’s Agreement on Safeguards’ Article 11:1(b). 27 The WTO’s Trade Policy Review of China (WTO 2006, pp. 60-61) explicitly describes the VER settlements between the EU and China and the U.S. and China in these investigations as follows,
“On 10 June 2005, China and the European Communities signed a Memorandum of Understanding (MOU), placing export restraints on ten categories of Chinese textiles and clothing
22
3.3 The use of new trade restrictions under the WTO Agreement on Safeguards
A third alternative to antidumping that is another WTO-sanctioned trade policy that a member can use to
restrict imports from China is a “global safeguard” applied under the rules set out by the WTO Agreement
on Safeguards. Admittedly, a fundamental distinction between a global safeguard measure and
antidumping (or either of the new “China-safeguards,” for that matter) is that the basic WTO conditions
require a global safeguard be applied on a nondiscriminatory basis. Nevertheless, there are a number of
exceptions to this rule. The result is that countries frequently structure the imposition of new safeguard
measures to allow for a discriminatory impact against exporters with certain characteristics, many of
which have important potential implications for a country like China.
Discretionary elements of the Agreement on Safeguards allow a safeguard-imposing country to
potentially discriminate implicitly against exporters with certain characteristics.28 First, import-restricting
measures are frequently imposed as quantitative restrictions or tariff rate quotas, policies which require
government officials to make the secondary choice of a decision rule for how to allocate import licences
(and thus market share) across many potential exporters. When imposing such policies, the WTO rules
suggest that imposing countries allocate licences based on historical market share in a recent three year
period, a decision rule which implicitly discriminates against new entrants. Second, countries that impose
a global safeguard are encouraged by an explicit provision to exempt developing countries from the
exports to the EC until 31 December 2007. The growth rates of these exports would be limited to between 8% and 12.5% per year. As a quid pro quo, the EC agreed to end its ongoing safeguard investigation on these products and to refrain from adopting measures as permitted under Article 242 of China's WTO Working Party Report, in categories not covered by the MOU…..Under the Interim Measures, MOFCOM compiles a "Catalogue of Textiles Products Subject to Interim Export Administration", including exports of textiles and clothing subject to restrictions imposed by countries or regions unilaterally, and textile exports subject to temporary quantitative control under bilateral agreements. For each product listed in the Catalogue, the quota is partly assigned through a bidding system, and partly allocated based on the exporter's share in China's total export value for the previous year in the respective categories.…A similar agreement was signed with the United States on 8 November 2005. The restraints on certain categories of textiles and clothing exports from China are effective from 1 January 2006 to 31 December 2008; exports of these products are expected to increase by 8% to 10% in 2006, by 13% in 2007, and 17% in 2008.”
28 Bown and McCulloch (2004) provide a discussion and empirical analysis of the following discriminatory elements in global safeguard cases initiated between 1995 and 2000.
23
measure, provided those exporters are de minimus suppliers (less than 3% of the import market
individually, less than 9% collectively). Such exemptions obviously discriminate against even developing
countries that are non-de minimus suppliers, as they will face trade barriers under the measure that other
foreign competitors do not. Finally, many safeguard-imposing countries frequently exempt from the
safeguard’s application the imports coming in from preferential trade agreement (PTA) partners. This also
serves to implicitly discriminate against non-PTA partner foreign suppliers who face an import restriction
under the global safeguard that key foreign competitors in other trading partners do not.29
Since the WTO’s 1995 inception, member countries have imposed over 75 new global safeguard
trade restrictions, after more than 145 safeguard investigations. Not surprisingly, many of the major users
of global safeguards are the major users of antidumping and the China-safeguard, including a number of
other developing countries, and among the major sectoral targets are chemicals and steel/metals.30
According to data on safeguard outcomes compiled in Bown (2007), roughly half of the safeguard
measures have been imposed as either a quantitative restriction or tariff rate quota, both of which require
that policymakers make the secondary decision of how to allocate import licenses and thus market share.
As China is a new entrant in many safeguard-imposing country markets in many of these products that are
being targeted, it is likely to receive a reduction in its historical market share when quantitative
restrictions are imposed that base licences on historical market shares. Furthermore, virtually all of the
29 This does not even consider examples of global safeguards applied in clear violation of WTO MFN rules, such as the steel safeguard imposed by the United States in 2002. This policy not only exempted entire countries from the trade restriction (e.g., NAFTA partners Canada and Mexico), it also introduced discriminatory “product exclusions” that the United States Trade Representative granted to exporters at the level of a foreign firm-specific product. For a discussion and empirical analysis, see Bown (2004). A typical exclusion might be as narrowly defined as a trademarked product that only one foreign firm could produce legally. For example, see product exclusion N454.01 granted to the UK firm Somers Forge, Ltd. on 11 June 2002, “Forged alloy steel die blocks of round or rectangular cross section. U.S. Trademark No. 1213781, commonly known as ‘VMC’ or ‘HYTUF’,” or exclusion N408.10 granted to the Japanese firm Daido Steel on 22 August 2002, “A specialized, high grade tool steel, known as Daido’s proprietary grade NAK 55, that is used for the construction of plastic molds.” See the USTR’s website, “President Bush Takes Action on Steel,” http://www.ustr.gov/sectors/industry/steel.shtml , last access date of 29 February 2004. 30 According to WTO (2007d), between 1995 and April 2007, the WTO members with the most global safeguard measures imposed were India (8), Turkey (7), Chile (7), the U.S. (6) and Jordan (6). The most targeted sectors were chemicals (17), prepared foodstuffs (11), and steel/metals (10).
24
global safeguard measures that WTO members have imposed have also carved out explicit country
exemptions for certain trading partners – PTA members and/or de minimus developing country suppliers.
Given that China is not a member of many PTAs and it is a relatively large supplier of many products that
are subject to the trade restrictions, it is also likely to suffer discriminatory treatment under these
discretionary elements as well.31 Thus, it is likely that the pattern of trade policy discrimination we
detected via member application of antidumping (as well as the China-specific safeguards) has carried
over to the application of global safeguard measures as well.
3.4 Countervailing measures and anti-subsidy policies
A final WTO-sanctioned policy with the potential to result in discriminatory import restrictions is the
second major unfair trade provision of countervailing duties. The WTO Agreement on Subsidies and
Countervailing Measures permits WTO members to impose country-specific import restrictions in the
face of evidence of 1) injury to a domestic petitioning industry that has requested an investigation, and 2)
receipt of WTO-inconsistent subsidies that have caused the injury.
According to the WTO (2007e), many fewer countries have imposed countervailing measures
since 1995 than have imposed antidumping or safeguard measures. Of the seventeen countries that
cumulatively imposed 191 different countervailing measures between 1995 and April 2007, the major
users were the U.S. (75), EU (46), Canada (20) and South Africa (11). Nevertheless, of the 191 country-
specific import-restrictions that were imposed, in only two instances (both by Canada in 2004) was the
target China.
While China has not historically been a major target of countervailing measures, that may
nevertheless be changing. The United States, for example, imposed no definitive countervailing measures
on imports from China between 1984 and the time of writing (June 2007). This stemmed from a 1984
31 Indeed, rather than list the developing countries exempted from the safeguard, many safeguard-imposing countries have resorted to a system in which they exempt all developing countries except China plus one or two others. See the safeguard data on country exemptions available in the Global Antidumping Database at www.brandeis.edu/~cbown/global_ad/data_files/SG-WTO-v2.1xls .
25
decision by the U.S. Department of Commerce decision (upheld by the 1986 Georgetown Steel case)
which implemented a policy not to consider anti-subsidy investigations of exports from non-market
economies like China and the former Soviet Union. Nevertheless, in March 2007 the Department of
Commerce changed its policy stance on this issue in the context of a countervailing duty investigation
over coated free sheet paper imports from China, Indonesia and Korea (Department of Commerce, 2007).
Commerce is now willing to entertain countervailing duty petitions against China, and the first such
definitive U.S. CVD on Chinese products in over twenty years could be imposed as early as summer
2007. As the United States is by far the largest current user of countervailing measures in the WTO
system, this decision could signal a fundamental shift that might result in the U.S. complementing its use
of antidumping and China-safeguards with substantial resort to this additional policy tool.
4 China’s Imports and Its Own Use of Antidumping and Safeguards
China implemented and began using its own antidumping law to restrict imports in 1997 prior to its WTO
accession (Jung, 2002). It initiated its first (and as of June 2007, only) safeguard investigation in 2002
shortly after its accession. Before examining the data relating to China’s use administered import-
protection policies, we review a number of the main political-economic theories reasons why China may
have implemented such legislation a priori and once it has been implemented, which industries are more
likely to seek resort to the measures ex post.
Economists have developed a number of theories behind why a country implements legislation
allowing for the re-application of import restrictions after it has agreed to upper limits on its import tariffs
(i.e., tariff bindings) through a trade agreement, as China did when it acceded to the WTO in 2001.
Hoekman and Kostecki (2001) refer to these as the “escape valve” and “insurance” motives. Bagwell and
Staiger (1990), for example, use a repeated-game setting to show that allowing such trade restrictions to
be imposed at times of increased trade volumes (when there is a strong terms-of-trade gain motive for a
country to impose a new tariff) allows trading partners to sustain lower cooperative tariffs. Once a
26
safeguard or antidumping provision is in place, there is then a substantial body of research examining
political-economic explanations for which industries seek and receive protection under its provisions.32
Until recently, for reasons related to both data availability and the frequency with which the policy was
used, research into determinants of use of antidumping and safeguards has focused almost exclusively on
historical users such as the U.S. and EU.
In presenting a first empirically-oriented examination of China’s own use of antidumping, this
section proceeds in two steps. First, much like the approach we took for the other major users of
antidumping presented in section 2, we characterize the data by focusing first on how China has been
using antidumping over time, which exporting sectors and trading partners it has targeted, as well as the
discriminatory nature of its use. Then we focus on one particular Chinese import-competing sector’s use
of antidumping and present a more formal regression approach in which to examine whether there is a
relationship between China’s post-accession use of antidumping and the pattern and timing of tariff
liberalization it took on as part of its WTO accession commitments.
4.1 China’s adoption and use of import-restricting antidumping and safeguards
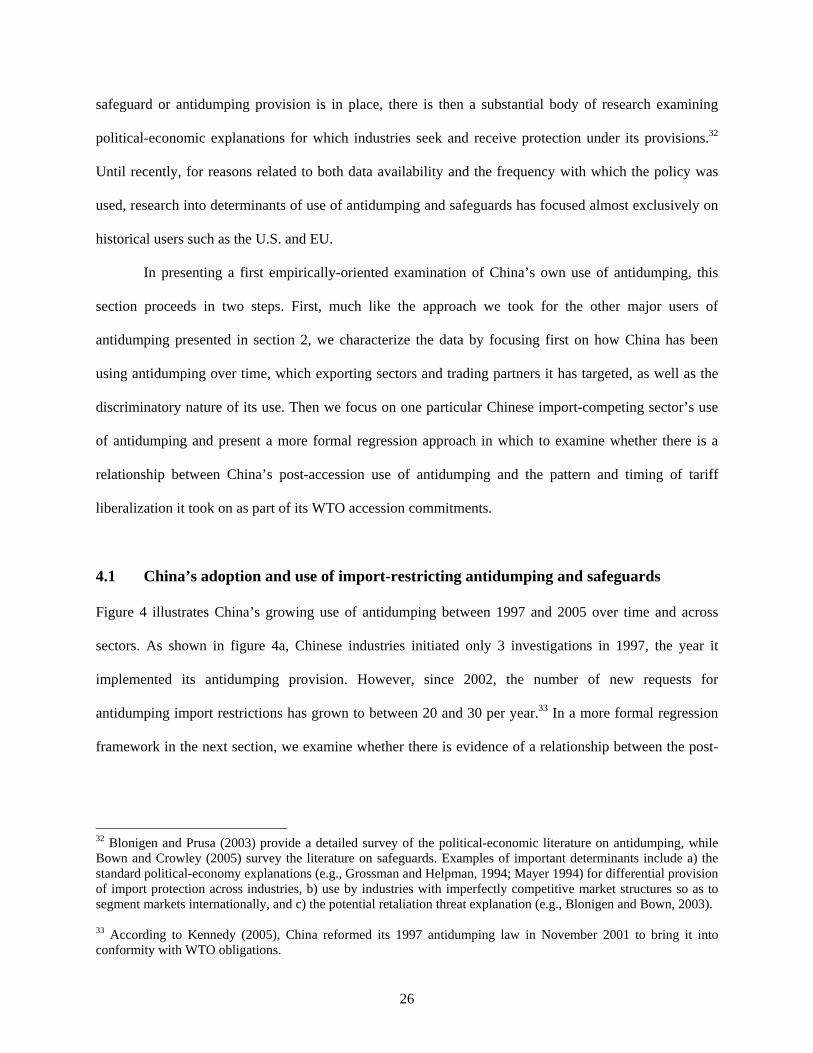
Figure 4 illustrates China’s growing use of antidumping between 1997 and 2005 over time and across
sectors. As shown in figure 4a, Chinese industries initiated only 3 investigations in 1997, the year it
implemented its antidumping provision. However, since 2002, the number of new requests for
antidumping import restrictions has grown to between 20 and 30 per year.33 In a more formal regression
framework in the next section, we examine whether there is evidence of a relationship between the post-
32 Blonigen and Prusa (2003) provide a detailed survey of the political-economic literature on antidumping, while Bown and Crowley (2005) survey the literature on safeguards. Examples of important determinants include a) the standard political-economy explanations (e.g., Grossman and Helpman, 1994; Mayer 1994) for differential provision of import protection across industries, b) use by industries with imperfectly competitive market structures so as to segment markets internationally, and c) the potential retaliation threat explanation (e.g., Blonigen and Bown, 2003). 33 According to Kennedy (2005), China reformed its 1997 antidumping law in November 2001 to bring it into conformity with WTO obligations.
27
accession use of antidumping and the level and timing of market access commitments that China
undertook as part of its 2001 accession to the WTO
Figure 4 also documents the sectoral distribution of China’s antidumping investigations, revealing
that they have been dominated by the industrial chemicals sector, with only a small fraction of use by the
steel, textile and apparel, and other import-competing industries. Figure 4b illustrates the share of these
particular industries’ imports in China’s total imports received over the 1995-2005 period. Not
surprisingly, there is nothing apparent in the raw trade data that would appear to justify why these
particular Chinese industries have become the predominant users of antidumping within China.
Table 7 provides more detail as to the outcomes of the Chinese antidumping investigations across
exporting country targets broken down by its pre-accession (1997-2001) versus post-accession (2002-
2004) use. When we compare this data to similarly broken out data for the other major users of
antidumping illustrated in tables 2 and 3, these data indicate that China may be using antidumping quite
differently. Not only are Chinese cases dominated by a particular sector (chemicals, see figure 4), data on
the overall caseload of Chinese investigations and outcomes (table 7) indicates that there is much less
differentiation or discrimination across targeted exporting countries. Each of the targeted countries is a
major source of Chinese imports, and they each lose a similar proportion of investigations so that the
result is that their exporters each face new trade restrictions with similar frequency. China also rarely
names only one country in an antidumping investigation over an imported product, which is another
potential means of discriminating across exporters that other antidumping-using countries have used.
Furthermore, unlike many other new users of antidumping, China almost exclusively applies import
restrictions as ad valorem duties, and the duties imposed do not appear be radically different across
countries either. To summarize the implications of this table – unlike the evidence for other country users
in tables 2 and 3 – China applied antidumping in a relatively nondiscriminatory manner during this time
period - i.e., for China there is no country that it treats like others treat China.
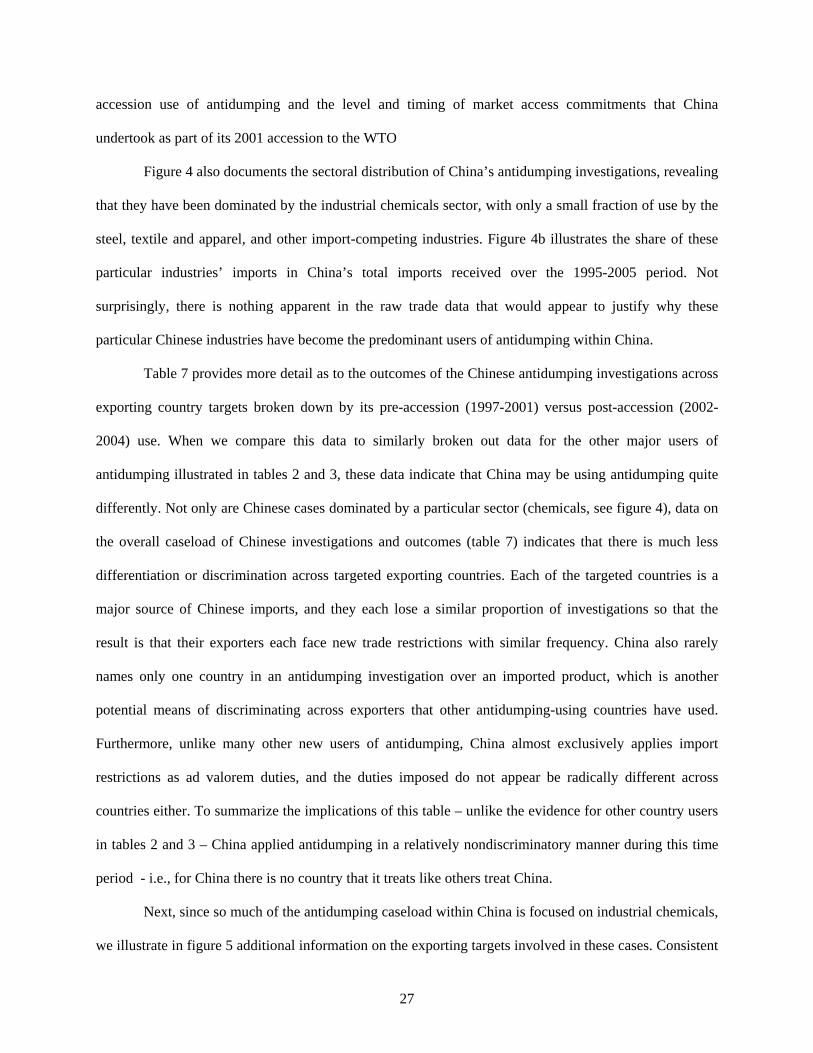
Next, since so much of the antidumping caseload within China is focused on industrial chemicals,
we illustrate in figure 5 additional information on the exporting targets involved in these cases. Consistent
28
with the features of its overall nondiscriminatory application of the policy documented in table 5, it
appears from figures 5a and 5b that the vast majority of the chemicals industry requests for new
antidumping protection target what appear to be China’s major sources for its chemical imports over the
1997-2005 period – the U.S., EU, Korea, Japan, Russia and Taiwan.
Finally, we point out that Chinese industries have only pursued one safeguard investigation since
the 2001 WTO accession. This occurred during the global steel crisis of 2002 and is associated with a
cross-country surge in steel safeguard investigations – led by the United States and followed by at least
eight other WTO members. The result of this particular Chinese safeguard investigation was that it
followed the U.S. lead and imposed definitive safeguard restrictions on steel imports that lasted between
May 2002 and December 2003.34
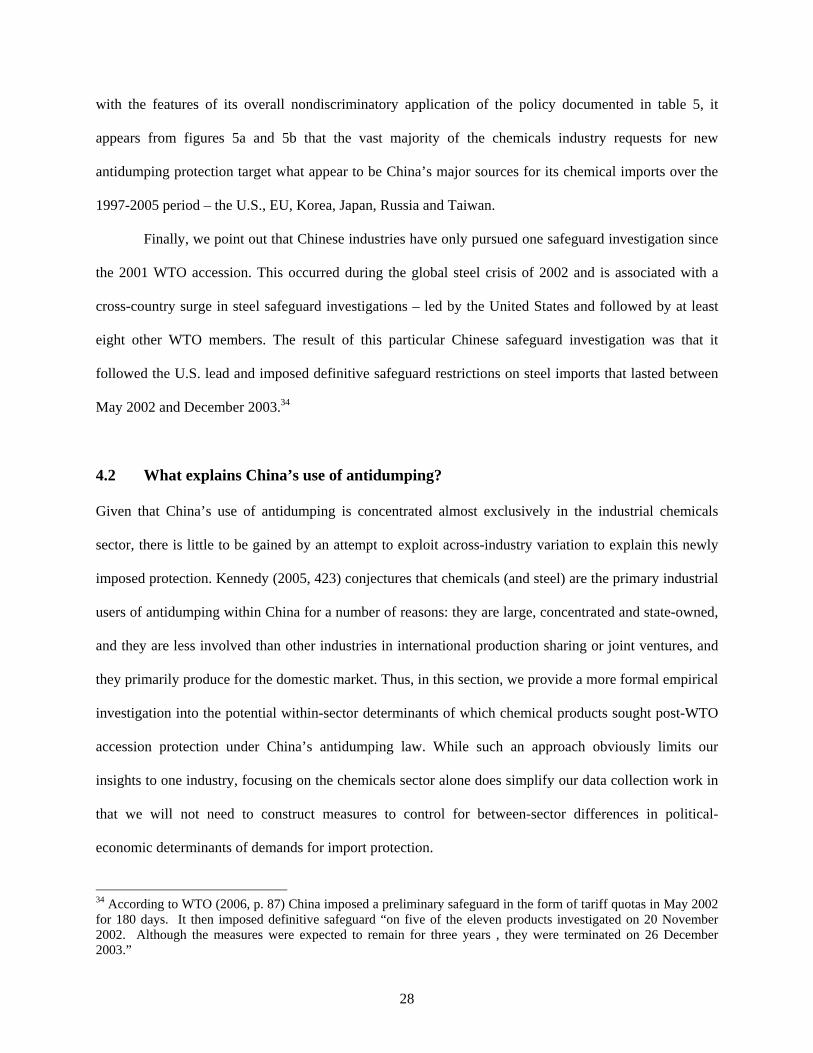
4.2 What explains China’s use of antidumping?
Given that China’s use of antidumping is concentrated almost exclusively in the industrial chemicals
sector, there is little to be gained by an attempt to exploit across-industry variation to explain this newly
imposed protection. Kennedy (2005, 423) conjectures that chemicals (and steel) are the primary industrial
users of antidumping within China for a number of reasons: they are large, concentrated and state-owned,
and they are less involved than other industries in international production sharing or joint ventures, and
they primarily produce for the domestic market. Thus, in this section, we provide a more formal empirical
investigation into the potential within-sector determinants of which chemical products sought post-WTO
accession protection under China’s antidumping law. While such an approach obviously limits our
insights to one industry, focusing on the chemicals sector alone does simplify our data collection work in
that we will not need to construct measures to control for between-sector differences in political-
economic determinants of demands for import protection.
34 According to WTO (2006, p. 87) China imposed a preliminary safeguard in the form of tariff quotas in May 2002 for 180 days. It then imposed definitive safeguard “on five of the eleven products investigated on 20 November 2002. Although the measures were expected to remain for three years , they were terminated on 26 December 2003.”
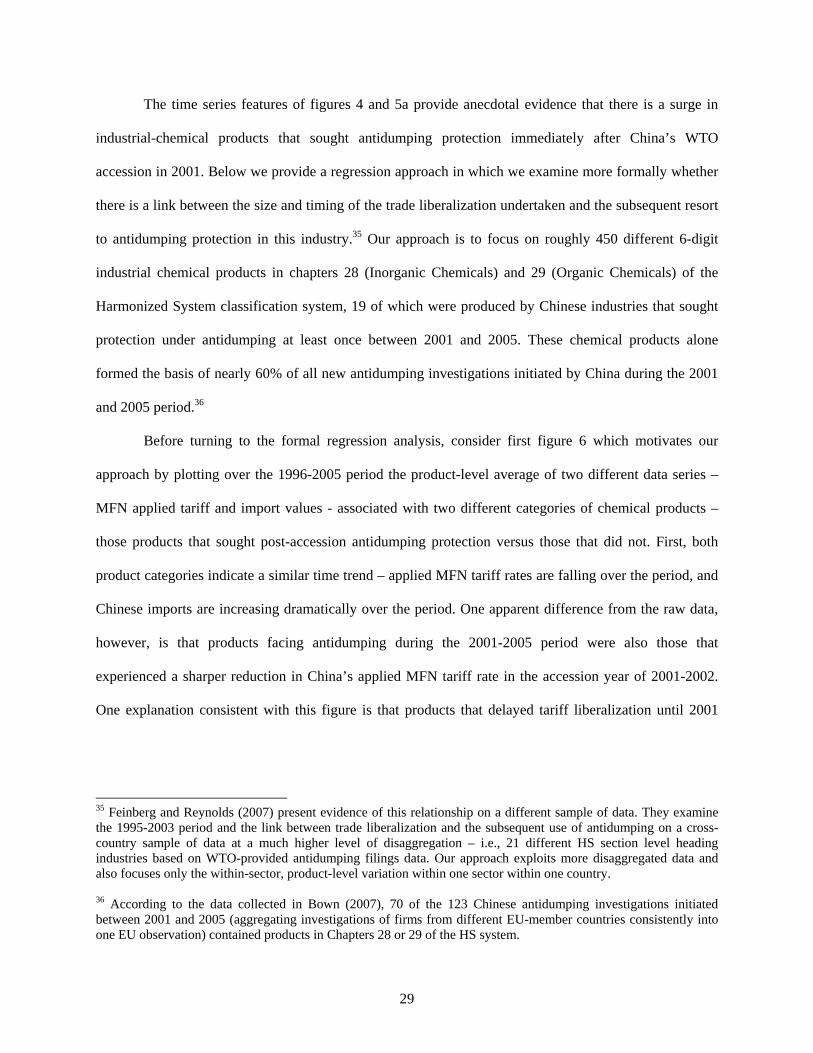
29
The time series features of figures 4 and 5a provide anecdotal evidence that there is a surge in
industrial-chemical products that sought antidumping protection immediately after China’s WTO
accession in 2001. Below we provide a regression approach in which we examine more formally whether
there is a link between the size and timing of the trade liberalization undertaken and the subsequent resort
to antidumping protection in this industry.35 Our approach is to focus on roughly 450 different 6-digit
industrial chemical products in chapters 28 (Inorganic Chemicals) and 29 (Organic Chemicals) of the
Harmonized System classification system, 19 of which were produced by Chinese industries that sought
protection under antidumping at least once between 2001 and 2005. These chemical products alone
formed the basis of nearly 60% of all new antidumping investigations initiated by China during the 2001
and 2005 period.36
Before turning to the formal regression analysis, consider first figure 6 which motivates our
approach by plotting over the 1996-2005 period the product-level average of two different data series –
MFN applied tariff and import values - associated with two different categories of chemical products –
those products that sought post-accession antidumping protection versus those that did not. First, both
product categories indicate a similar time trend – applied MFN tariff rates are falling over the period, and
Chinese imports are increasing dramatically over the period. One apparent difference from the raw data,
however, is that products facing antidumping during the 2001-2005 period were also those that
experienced a sharper reduction in China’s applied MFN tariff rate in the accession year of 2001-2002.
One explanation consistent with this figure is that products that delayed tariff liberalization until 2001
35 Feinberg and Reynolds (2007) present evidence of this relationship on a different sample of data. They examine the 1995-2003 period and the link between trade liberalization and the subsequent use of antidumping on a cross-country sample of data at a much higher level of disaggregation – i.e., 21 different HS section level heading industries based on WTO-provided antidumping filings data. Our approach exploits more disaggregated data and also focuses only the within-sector, product-level variation within one sector within one country. 36 According to the data collected in Bown (2007), 70 of the 123 Chinese antidumping investigations initiated between 2001 and 2005 (aggregating investigations of firms from different EU-member countries consistently into one EU observation) contained products in Chapters 28 or 29 of the HS system.
30
were the products that subsequently felt the pressure to re-implement protection in the form of new
antidumping import restrictions quickly thereafter.37
Table 8 provides a more formal econometric analysis of the link between tariff liberalization and
subsequent antidumping use. There we report marginal effects estimates of the binomial probit model of
determinants of whether each of roughly 450 particular 6-digit HS products in the chemical industry
sought antidumping protection (=1) in China during the 2001-2005 period.38 After controlling for the size
of imports of the product (0.117), evidence from column (1) indicates that a larger reduction in applied
tariffs in 2001-2002 is associated with a higher probability of seeking antidumping protection from
imports at some point over the subsequent period. The size (-0.017) of the marginal effect is also
economically significant – the implication is that an additional 1 percentage point reduction in the applied
MFN tariff leads to an additional 1.7 percentage point increase in the predicted probability of an
antidumping investigation when the model is evaluated at the means of the data.39
In the remaining columns we add additional controls as robustness check on the sensitivity of this
result. In column (2) we add a control for the size of the overall tariff liberalization commitment the
product has to undergo between 1996 (the first year for which we have disaggregated tariff data) and
2005. Perhaps surprisingly, the size of the overall tariff reduction commitment undertaken between 1996
and 2005 is negatively related to the decision to seek antidumping protection, though the estimate is not
37 A second interesting feature of the data series in figure 6 is that imports in products targeted with antidumping appear to be growing more rapidly since 2001. And this is despite the combination of two factors - they face on average higher levels of applied MFN tariff rates than products not subsequently targeted with antidumping and many of the products also subsequently faced additional Chinese antidumping import restrictions. 38 By choosing the product as the unit of observation, as opposed to a product-foreign exporter pair, we abstract from potential partner-specific (e.g.., retaliatory) considerations that have been shown to affect antidumping use for other countries (e.g., Blonigen and Bown, 2003). While this a potential limitation of the current approach, given the evidence from table 6 that China appears to apply antidumping is a relatively nondiscriminatory manner, eliminating this potential source of variation may not come at as great a cost as might be the case for other antidumping-user countries. 39 When evaluated at the means of the data, the model’s predicted probability of an investigation is 0.032. Thus an additional 1 percentage point reduction in the reduction in the applied MFN tariff (e.g., from the mean reduction of -2.24 percentage points to -3.24 percentage points) leads to an increase in the predicted probability of an investigation by 1.7 percentage points to 0.049. Note that this tariff reduction is well within one standard deviation of the applied tariff reduction in the sample, which is 1.23 percentage points.
31
statistically significant.40 Furthermore, the size of the impact of the accession-year tariff liberalization
commitment impact increases to -0.023. Next, in column (3) we also control for the product’s post-
accession “tariff overhang” defined as the difference between the 2005 applied MFN tariff rate and the
2005 MFN bound tariff rate commitment. The smaller this difference (i.e., the closer is the applied rate to
the binding), the higher is the probability that the product seeks additional protection via antidumping,
perhaps because it has no other WTO-consistent form to implement additional protection.41 Finally, in
column (5) we control for whether the product experienced a pre-accession surge in imports. While we
expect this to be positively related to requests for antidumping protection between 2001-2005, there is no
evidence of this relationship from this specification. Nevertheless, the sign and estimated size of the
coefficients on the other variables of interest remain unchanged.
In summary, there is some evidence from examination of Chinese chemical products – by far the
dominant user of antidumping within China during its immediate post-accession period – that there is a
relationship between the size of the tariff liberalization undertaken between 2001-2002 (the year of its
WTO accession), and China’s subsequent use of antidumping between 2001 and 2005. In particular, an
additional 1 percentage point reduction in the MFN applied tariff rate during 2001-2002 is associated with
a 1.7 to 2.3 percentage point increase in the probability that a given chemical product seeks an
antidumping investigation over the subsequent 5 year period. This is a large effect given that the predicted
probability of the average product seeking antidumping protection during the period is only 2.9 to 3.2
percent. It is also apparent that it may be the timing of the effect that matters, as there is no statistically
40 One explanation for a potential positive estimated effect is that it could instead be picking up the effect of the underlying ability of producers of certain products to organize politically – i.e., domestic producers of products unable to maintain (applied MFN) tariff protection over the 1996-2005 period (in the face of WTO accession) are also unable to organize politically and convince Chinese government authorities that they should receive special import protection under antidumping. Note finally that, in unreported results, we have ruled out the possibility that this result is driven by collinearity between the 2001-2002 tariff change and the broader 1996-2005 tariff change. 41 Though statistically significant and consistent with what theory would predict, economically, this effect is quite small as there is actually quite little difference in the underlying data between the applied rates and bound rates (-0.2 percentage points) and which could be a statistical anomaly associated with averaging the actual tariff bindings (made at the 8-digit level) to the 6-digit level required for the empirical analysis.
32
significant relationship between the probability of a post-accession antidumping investigation and the size
of the overall trade liberalization commitment made for the 1996-2005 time period.
5 China in WTO Dispute Settlement
Negotiating a successful accession into the WTO is itself an important achievement. Nevertheless, it does
not automatically follow that, upon becoming a member of the organization, an acceding country
necessarily receives equal treatment under WTO rules. Furthermore, becoming a member does not by
itself imply that the country’s own policymakers continue to live-up to the trade liberalizing commitments
that they or their predecessor agreed for the country to take on. An implication of this for the WTO is
that, as a self-enforcing agreement, it is sometimes through resort to formal dispute settlement litigation
and threats (and follow-through) of retaliation that the bargain of countries exchanging a balance of
market accession concessions “works” and the benefits of WTO membership are conferred.
Therefore, an import source from which to track China’s transition to full WTO membership is its
experience in formal WTO dispute settlement. Upon receiving entry into the organization in 2001, it
would not have been surprising to observe an almost immediate onslaught of formal China-centered
disputes, simply because the country is involved in a substantial share of global trade in many sensitive
product categories with dozens of different trading partners.42 This includes disputes both in which China
would be a respondent (defendant), with its policies being challenged by other WTO members who may
have been biding their time until 2002 China would finally also face the discipline of international rules,
and also in which China would be a complainant (plaintiff) going on the offensive to enforce the market
access commitments that the existing WTO members had promised.
42 Horn, Mavroidis and Nordström (2005) provide evidence from a 1995-1998 sample of data that the pattern of actual disputes compares favorably to that predicted from a simple probabilistic model that links the frequency of disputes simply to the amount of trade a country undertakes as well as the diversity of its trading partners. The implication from such a model for a country like China is that, simply because it is a country that is involved in a substantial amount of international trade with many it countries, it would likely see itself involved in many formal WTO trade disputes, even when abstracting from the likelihood that certain traded products may be more likely to face disputes than others. This idea is also supported by the evidence provided in Bown (2005a,b) which examines
33
Instead, as we illustrate in the next two sections, China has been largely and conspicuously absent
from major WTO litigation in the initial period following its 2001 accession. Nevertheless, there are
increasing signs that this grace period may be coming to an end which may foreshadow a major shift in
China’s role in formal WTO dispute settlement going forward.
5.1 China as complainant
The top half of table 9 presents an up-to-date breakdown of China’s formal participation in WTO trade
dispute proceedings as a complainant (plaintiff). Perhaps surprisingly, China has filed thus far only one
formal dispute of its own as a complainant – participating as a co-complainant (along with eight other
countries) in the formal challenge to the U.S. use of a safeguard to restrict steel imports in 2002.43 While
China ultimately benefited from the successful resolution to this case – the U.S. complied with WTO
legal rulings and removed the steel safeguard measure in December 2003 – this outcome was arguably a
by-product of the legal efforts undertaken by more active WTO members in the case such as the EU,
which successfully identified politically sensitive U.S. export products to target for retaliation threats.44
There are a number of complementary reasons to indicate some surprise that China has not played
a more active offensive role as a complainant in WTO trade disputes thus far. First, the most common
measure to challenge under formal WTO dispute settlement is increasingly another country’s antidumping
trade dispute data from the period prior to China’s WTO accession and finds that the decision of a WTO member to actively participate in a potential trade dispute is positively related to the country’s market access interest at stake. 43 Indeed, some countries immediately take part in formal trade disputes upon entry into the WTO. For example, almost immediately after acceding in 1996 and 1997, respectively, Ecuador and Panama joined (as co-complainants) the ongoing, U.S.-led trade dispute against the EU’s import-restricting banana regime, as bananas are an important export sector for both of these economies. 44 Despite its lack of prior experience in such cases, there is nevertheless some evidence from the case that China put itself in the position to take appropriate retaliatory action if the EU’s efforts were not successful at getting the U.S. to comply. According to WTO (2006, pp. 87-88, emphasis added) “In response to a safeguard measure imposed by the United States, China notified the Committee on Safeguards in May 2002, its proposed suspension of concessions and other obligations, in accordance with Article 12.5 of the Agreement on Safeguards. The proposed suspension, which would have taken effect from March 2005 or from the fifth day following a DSB decision that the measures adopted by the United States were inconsistent with the WTO Agreement, would have taken the form of an increase in duty of 24% on selected products originating in the United States.”
34
import restrictions.45 When combining the feature of frequent WTO filings over antidumping measures
with evidence from the data presented in section 2 regarding the discriminatory treatment of China under
foreign antidumping (even after its 2001 accession), it would not have been surprising to see China begin
to start filing disputes over this issue. This also suggests the potential scope for a substantial number of
Chinese disputes over this issue going forward.
There are a number of potential contributing explanations worthy of discussion, even though they
are not empirically testable at this stage, given the lack of data on Chinese disputes. One contributing
explanation is certainly China’s continued non-market economy designation, which allows policymakers
in certain trading partners substantial discretion with how they can construct estimates that China’s
exporters have dumped.46 Nevertheless, in the case of the United States, the 2007 U.S. decision to now
consider countervailing duty investigations against China - i.e., implicitly treating China as a market
economy under one law – while continuing to treat China as an NME under another trade law
(antidumping), does raise the possibility of China pursuing a dispute in this area.
A second potential explanation for China’s failure to challenge other country’s use of
antidumping through formal WTO disputes is if it had decided instead to take matters into its own hands
by using its own antidumping trade policy to retaliate in order to lessen the likelihood of future
discriminatory. However, this appears to be an unlikely explanation for China’s failure to challenge other
countries’ use of antidumping. The data presented in section 4 indicates that China’s use of antidumping
has been fairly limited – i.e., dominated by the chemicals industry – and its own application of
45 Bown and Hoekman (forthcoming) report that over 25% of all formal WTO disputes between 1999-2006 related to antidumping. This is likely because of a number of factors including a) the increasing resort to antidumping globally, b) its relative transparency, and c) the fact that an antidumping measure is foreign country-specific so successful removal (via formal WTO litigation) will not necessarily generate positive spillovers to other trading partners, which limits the free-rider problem associated with organizing to pursue a WTO dispute in the first place. See also Bown (2005a). 46 The argument is, even if China filed a WTO dispute and won a case against an antidumping-imposing country, because of China’s continued NME status, the using country would still have substantial discretion to identify an alternative means of imposing a WTO-consistent trade restriction that would leave China’s exporters no better off than if it had not pursued the case to begin with.
35
antidumping has been relatively nondiscriminatory across foreign export targets in rough proportion to
the size of their chemical exports to China.
5.2 China as respondent
The lower half of table 9 presents information on the formal WTO trade disputes that China has been
involved in as a respondent (defendant) country. Just as China has been infrequently on the offensive in
WTO litigation, it has also infrequently had to defend itself from foreign challenges thus far. 47 Prior to a
flurry of formal disputes filed in 2006-2007, China has only been challenged in one dispute in 2004 – a
value-added tax on integrated circuits in a case the U.S. brought that China quickly settled.
Since 2006, WTO have filed a number of new disputes against China, perhaps signaling an end to
the no-litigation standoff in the initial period following China’s 2001 accession. In 2006, the U.S., EU and
Canada initiated a challenge over China’s alleged discriminatory treatment of imports of auto parts.
Through June 2007, the U.S. had initiated three additional disputes against China. The first dispute
initiated along with Mexico, accuses China of offering tax refunds and industrial subsidies in violation of
its WTO commitments. The other two complementary disputes involve the U.S. challenging China’s
treatment of intellectual property (IP)-intensive industries such as movies, music and books. The first
alleges that China has failed to sufficiently legislate and enforce laws protecting the IP of U.S. firms (thus
failing to live up to its commitments under the TRIPs Agreement), the second alleges that U.S. firms face
discriminatory barriers when attempting to distribute their IP-intensive products and services within
China (a violation of the GATS).
47 It is somewhat surprising, for example, to have seen the United States actively pursuing WTO disputes against China sooner than it ended up doing so, given the political pressure imposed by many domestic constituencies. I.e., protectionist sentiment in the U.S. Congress vis-à-vis China that focused on the growth of China’s bilateral trade surplus with the United States and calls for the yuan to be revalued long preceded the eventual flurry of new U.S. disputes against China in 2006-2007.
36
As the issues at stake under these disputes are fundamental to China’s continued efforts at reform,
it will be important to watch how both sides choose to proceed in these – as well as other impending
WTO challenges to China’s policies – going forward.
5.3 China as an interested third party
While China has been infrequently the main litigant – as either a complainant or respondent – in WTO
trade disputes thus far, table 10 indicates that China has substantial experience following WTO disputes
as an interested third party in cases involving another complainant and respondent country. In 40
different disputes, China has been extremely active in observing the WTO dispute settlement process
through this manner.
WTO members have many reasons to observe and weigh in on such disputes in this third party
role. One economically-motivated reason to closely follow a dispute is the country’s own market access
interests over a disputed product – e.g., China may want to make sure that any settlement or resolution to
the case between the two disputing parties does not involve a negotiated outcome in which market access
between the two disputants is restructured in a way that discriminates against its exporters. Second, a
country without a market access interest at stake in a particular case may still have a systemic interest if it
affects an interpretation of a WTO rule or procedure affecting its economic interests somewhere else.
Third, countries may also choose to participate via this route as it provides them with a lower (resource
and political) cost of learning about the WTO litigation experience in a way that will likely pay off in
future disputes that they are involved in as complainants or respondents.
What is clear from the table is that China has chosen to participate in many different types of
disputes over a range of traded products – import restrictions and export promotion, contingent protection,
intellectual property, etc. China is likely using this strategy in part to keep abreast of how the rules are
slowly adjusting as the WTO case law and judicial interpretations begin to fill out some of the missing
37
areas not explicitly covered by WTO rules.48 Furthermore, China is also likely using this opportunity to
learn about how the interplay between law, political posturing and economics in WTO litigation plays
out. China must certainly recognize the inevitability as a larger trader that it will be a frequent target of
formal dispute settlement activity, and likely sooner rather than later.
5.4 China in future WTO dispute settlement
Our discussion of China’s future in WTO litigation is mere speculation, of course. It is also likely that
China may find itself involved in future WTO trade litigation over issues that have not yet arisen. One
feature of China’s trade is that a new controversy over Chinese export products appears to surface in
media headlines almost every day – whether it be recent allegations of melamine in pet food, diethylene
glycol in toothpaste, lead paint in children’s toys, banned antibiotics in farmed seafood, etc. In each of the
instances thus far, importing countries have imposed trade restrictions that appear, if the prima facie
evidence in news reports is accurate, to be justifiable under WTO provisions. Thus, it is not likely that
any of these product bans would be subject of future trade dispute challenges.49
Nevertheless, the increasing frequency of such incidents suggests that sooner or later a
policymaker will face domestic political pressure to impose an import restriction over some new concern
that ultimately will be determined to not be based on sound scientific evidence, and in such a case China
may seek to file a dispute to protect its market access rights.50 Perhaps more importantly, the changing
48 While no strict stare decisis in WTO case law, nevertheless, decisions made in Panel Reports and by the Appellate Body are frequently based on prior decisions, suggesting that precedent matters at least implicitly. 49 While under the GATT, imposing import restrictions to protect human, animal or plant health was justified under Article XX, much of this has been expanded under the WTO to be covered under the Agreement on Sanitary and Phytosanitary (SPS) measures as well as the Agreement on Technical Barriers to Trade (TBT). 50 There are a number of examples in WTO cases in which one country imposes an import ban on a product which it claimed was based on health (or environmental protection) purposes but which another trading partner challenged. These include U.S. challenges to EU bans on hormone-treated beef and genetically modified foods, as well as foreign challenges to U.S. measures to restrict tuna and shrimp imports that it alleged were necessary to protect the lives of dolphins and sea turtles, respectively.
38
nature of trade and many of these controversies over the impact of imported products is likely to affect
future institutional arrangements over consumer protection, health and safety.
6 Conclusion
This chapter examines a number of different newly compiled dataset to assess issues surrounding China’s
2001 accession to the WTO. We use data from the foreign use of antidumping during the 1995-2001 to
document the discrimination that China faced under this one particular trade policy, identifying one of the
potential benefits its exporters may have expected to receive with WTO membership. Nevertheless, while
a number of other factors were also changing during the time period – including WTO members being
required to otherwise offer China MFN treatment and China’s own rising exports – since 2001, there is no
evidence that foreign discrimination vis-à-vis China via antidumping has improved. Furthermore, there
are a number of additional trade policy instruments (e.g., China safeguards) that have also developed
since 2001 that countries are also resorting to so as to continue to discriminate against Chinese exports in
certain products. Finally, we also are able to find no robust evidence that there is a strategic relationship
between China’s own high import-tariff products and which export products foreign users were targeting
with antidumping.
Regarding its own introduction of new import-restricting measures, we find that while China is
now in the top five, in terms of the countries that most frequently implement new antidumping trade
restrictions, the post-2001 surge in Chinese use is dominated by its industrial chemicals industry. Unlike
the other major users of antidumping that are each increasingly applying their measures in a
discriminatory fashion, we also provide evidence that China applies such new trade restrictions in a much
less discriminatory (i.e., non-MFN) fashion. Finally, we also provide some evidence from a sample of
Chinese chemical industry data that the cross-product variation in demands for new antidumping
measures during the post-accession is related to the severity of the accession year tariff liberalization
undertaken in 2001-2002.
39
Lastly, while it is somewhat surprising that China was not a frequent litigant in formal WTO
dispute settlement activity in the early years after its accession, it is currently confronted by a number of
WTO disputes. Furthermore, given its share in world trade and the political sensitivity of the sectors
involved in many of its traded products, it is likely to be involved in many more disputes going forward.
40
References
Andersen, Scott and Christian Lau (2002) “Hedging Hopes with Fears in China’s Accession to the World
Trade Organization: The Transitional Special-Product Safeguard for Chinese Exports,” Journal of
World Intellectual Property 5(3): 405-476.
Bagwell, Kyle and Robert W. Staiger (1990) “A Theory of Managed Trade,” American Economic Review
80(4): 779-795.
Bagwell, Kyle and Robert W. Staiger (1999) “An Economic Theory of GATT,” American Economic
Review 89(1): 215-248.
Blonigen, Bruce A. (2006) “Evolving Discretionary Practices of U.S. Antidumping Activity,” Canadian
Journal of Economics 37(3): 874-900.
Blonigen, Bruce A. and Chad P. Bown (2003) “Antidumping and Retaliation Threats,” Journal of
International Economics 60(2): 249-273.
Blonigen, Bruce A. and Thomas J. Prusa (2003) “Antidumping,” in E. Kwan Choi and James Harrigan
(eds.) Handbook of International Trade Oxford, UK: Blackwell Publishers.
Bown, Chad P. (2004) “How Different Are Safeguards from Antidumping? Evidence from U.S. Trade
Policies toward Steel,” mimeo, July.
Bown, Chad P. (2005a) “Trade Remedies and World Trade Organization Dispute Settlement: Why Are
So Few Challenged?” Journal of Legal Studies 34(2): 515-555.
Bown, Chad P. (2005b) “Participation in WTO Dispute Settlement: Complainants, Interested Parties and
Free Riders,” World Bank Economic Review 19(2): 287-310.
Bown, Chad P. (2007) “Global Antidumping Database,” [Version 1.0 published as World Bank Policy
Research Paper No. 3737, October 2005. Current version 3.0, June, updated data available at
http://www.brandeis.edu/~cbown/global_ad/ ].
Bown, Chad P. and Meredith A. Crowley, (2005) “Safeguards,” in Patrick F.J. Macrory, Arthur E.
Appleton, and Michael G. Plummer (eds.), The World Trade Organization: Legal, Economic and
Political Analysis. Springer: New York.
Bown, Chad P. and Meredith A. Crowley (2007a) “China’s Export Growth and the China Safeguard:
Threats to the World Trading System?” Federal Reserve Bank of Chicago Working Paper No.
2004-28 (revised), June.
Bown, Chad P. and Meredith A. Crowley (2007b) “Trade Deflection and Trade Depression,” Journal of
International Economics 72(1): 176-201.
Bown, Chad P. and Bernard M. Hoekman (forthcoming) “Making Trade Agreements Relevant for Poor
Countries: Why Dispute Settlement Is Not Enough,” Journal of World Trade.
41
Bown, Chad P. and Rachel McCulloch (2004) “The WTO Agreement on Safeguards: An Empirical
Analysis of Discriminatory Impact," in Michael G. Plummer (ed.), Empirical Methods in
International Trade. Cheltenham, UK: Edward Elgar.
Department of Commerce (2007) “Press Release: Commerce Applies Anti-Subsidy Law to China,”
http://www.commerce.gov/opa/press/Secretary_Gutierrez/2007_Releases/March/30_Gutierrez_C
hina_Anti-subsidy_law_application_rls.html , 30 March.
Durling, James P. and Thomas J. Prusa (2006) “The Trade Effects Associated with an Antidumping
Epidemic: The Hot-Rolled Steel Market, 1996-2001,” European Journal of Political Economy
22(3): 675-95.
Feinberg, Robert M. and Kara M. Reynolds (2007) “Tariff Liberalization and Increased Administered
Protection: Is there a Quid Pro Quo?” The World Economy 30(6): 948-961.
Gallaway, Michael P., Bruce A. Blonigen, and Joseph E. Flynn (1999) “Welfare Costs of the U.S.
Antidumping and Countervailing Duty Laws,” Journal of International Economics 49(2): 211-
244.
GATT (1987) “Negotiating Group on Safeguards: Work Already Undertaken in the GATT on
Safeguards.” Geneva, GATT document MTN.GNG/NG9/W/1, available at
http://www.worldtradelaw.net/history/ursafeguards/W1.pdf.
Greene, William H. (2000) Econometric Analysis. (4e) New Jersey: Prentice Hall.
Grossman, Gene M. and Elhanan Helpman (1994) “Protection for Sale,” American Economic Review
84(4): 833-850.
Hansen, Wendy L. and Thomas J. Prusa (1996) “Cumulation and ITC Decision-Making: The Sum of the
Parts is Greater than the Whole,” Economic Inquiry 34(4): 746-769.
Hoekman, Bernard M. and Michael M. Kostecki (2001) The Political Economy of the World Trading
System: The WTO and Beyond (2nd edition) New York: Oxford University Press.
Horn, Henrik, Petros C. Mavroidis and Håkan Nordström (2005) “Is the Use of the WTO Dispute
Settlement System Biased?” in Petros C. Mavroidis and Alan Sykes (eds.), The WTO and
International Trade Law/Dispute Settlement, Cheltenham: Edward Elgar.
Jung, Youngjin (2002) “China’s Aggressive Legalism: China’s First Safeguard Measure,” Journal of
World Trade 36(6): 1037-1060.
Kennedy, Scott (2005) “China's Porous Protectionism: The Changing Political Economy of Trade
Policy,” Political Science Quarterly 120(3): 407-432.
Knetter, Michael M. and Thomas J. Prusa (2003) “Macroeconomic Factors and Antidumping Filings:
Evidence from Four Countries,” Journal of International Economics 61(1): 1-17.
42
Liu, Xiang and Hylke Vandenbussche (2002) “European Union Anti-Dumping Cases Against China: An
Overview and Future Prospects with Respect to China’s World Trade Organization
Membership,” Journal of World Trade 36(6): 1125-1144.
Maggi, Giovanni and Andres Rodriguez-Clare (1998) “The Value of Trade Agreements in the Presence of
Political Pressures,” Journal of Political Economy 106(3): 574-601.
Mayer, Wolfgang (1984) “Endogenous Tariff Formation,” American Economic Review 74(5): 970-985.
Messerlin, Patrick A. (2004) “China in the World Trade Organization: Antidumping and Safeguards,”
World Bank Economic Review 18(1): 105-130.
Moore, Michael O. (2006) “U.S. Facts-available Antidumping Decisions: An Empirical Analysis,”
European Journal of Political Economy 22(3): 639-652
Moore, Michael O. and Alan Fox (2006) “Why Don't Foreign Firms Cooperate in U.S. Antidumping
Investigations?: An Empirical Analysis,” mimeo, June.
Prusa, Thomas J. (2001) “On the Spread and Impact of Antidumping,” Canadian Journal of Economics
34(3): 591-611.
Staiger, Robert W. And Frank A. Wolak (1994) “Measuring Industry-Specific Protection: Antidumping in
the United States,” Brookings Papers on Economic Activity: Microeconomics 51-118.
WTO (2001) “Accession of the People’s Republic of China.” available on-line at http://www.wto.org/,
document number WT/L/432, 23 November.
WTO (2006) “Trade Policy Review Body - Trade Policy Review - Report by the Secretariat - People's
Republic of China - Revision.” available on-line at http://www.wto.org/, document number
WT/TPR/S/161/Rev.1, 26 June.
WTO (2007a) “AD Initiations: By Reporting Member” available on-line at
http://www.wto.org/english/tratop_e/adp_e/adp_stattab2_e.xls , last accessed on 22 June.
WTO (2007b) “AD Measures: By Reporting Member” available on-line at
http://www.wto.org/english/tratop_e/adp_e/adp_stattab7_e.xls , last accessed on 22 June.
WTO (2007c) “AD Initiations: By Exporting Country” available on-line at
http://www.wto.org/english/tratop_e/adp_e/adp_stattab1_e.xls , last accessed on 22 June.
WTO (2007d) “Statistics on Safeguard Measures,” available on-line at
http://www.wto.org/english/tratop_e/safeg_e/safeg_e.htm , last accessed on 22 June.
WTO (2007e) “Statistics on Subsidies and Countervailing Measures,” available on-line at
http://www.wto.org/english/tratop_e/scm_e/scm_e.htm , last accessed on 22 June.
Zanaradi, Maurizio (2004) “Antidumping: What are the Numbers to Discuss at Doha?” The World
Economy 27(3): 403-433.
43
Data Appendix
Antidumping data
What governments report to the WTO, regarding their use of antidumping is limited and frequently
inconsistent with what is reported in official national government publications. We rely on data reported
to the WTO (e.g., WTO, 2007a,b,c) only infrequently in this chapter, and we use it primarily to
supplement information from our other sources of data that may not be available in the most recent years
(e.g., table 1 and figure 1).
The source of the data on antidumping use for the empirical analysis is the Global Antidumping
Database, a cross-country data collection project funded by the World Bank and Brandeis University,
which contains more detailed data including dates associated with the investigation, countries targeted,
measures imposed, Harmonized System products affected, etc. The database derives from data hand-
collected from official national government publications, and it covers 19 policy-using countries which
account for roughly 90% of the antidumping activity undertaken by all WTO members over the 1995-
2004 period. Bown (2007) provides a users manual describing the source of the underlying country of the
major users described in the text.
Data collected on China’s use of antidumping, as reported in the Global Antidumping Database
and Bown (2007), is translated to English from official Chinese government websites. China’s dumping
determination data is taken from the Bureau of Fair Trade for Imports and Exports (MOFCOM,
http://dcj.mofcom.gov.cn/ ), its injury investigations are handled by the Bureau of Industry Injury
Investigation (MOFCOM, http://gpj.mofcom.gov.cn/ ). Additional information was collected from the
China Trade Remedy Information website (http://www.cacs.gov.cn/DefaultWebApp/index.htm ).
Import and export data
Product-level import and export data at the 6-digit Harmonized System level is from Comtrade, taken
from World Integrated Trade Solution (WITS) database.
Tariff data
China’s applied MFN tariff rates (available for years 1996, 1997, 2001-2005) and its final WTO tariff
binding schedule (submitted in 2001) are available at the 8-digit product-level from the WTO Integrated
Database, taken from WITS. We use simple averaging to aggregate the tariff rates from the 8-digit to the
6-digit level to match them with the 6-digit Chinese import and export data.
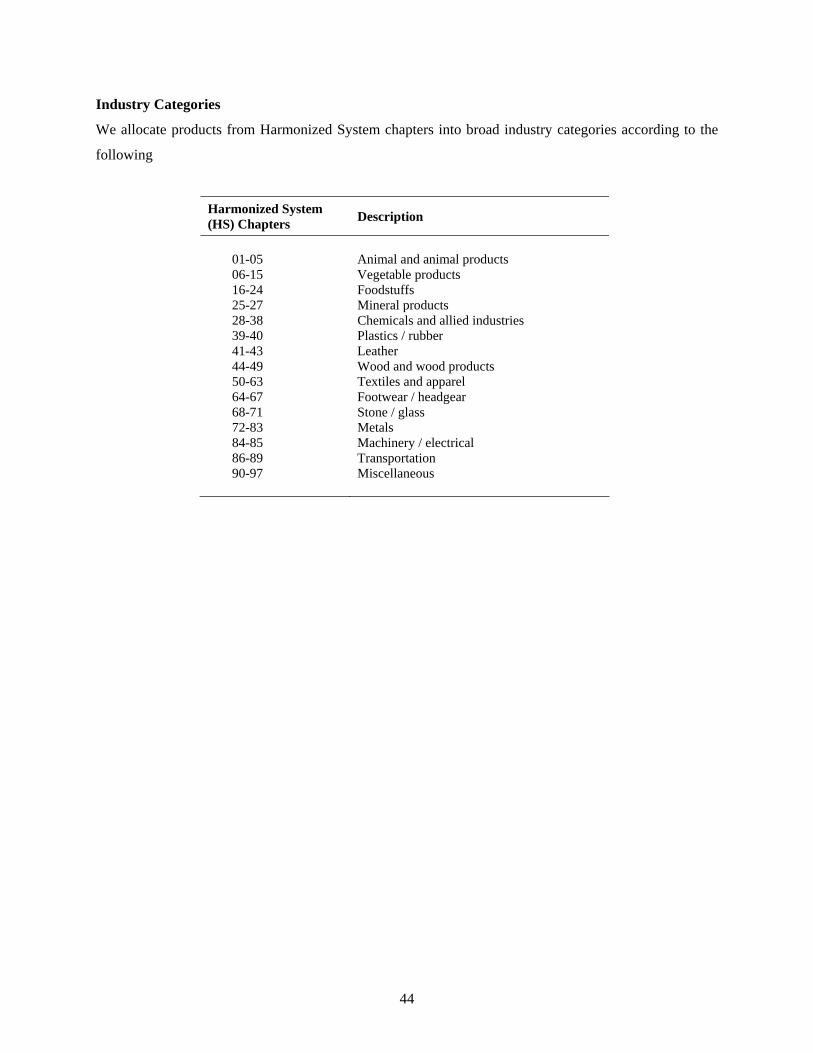
44
Industry Categories
We allocate products from Harmonized System chapters into broad industry categories according to the
following
Harmonized System (HS) Chapters Description
01-05 Animal and animal products 06-15 Vegetable products 16-24 Foodstuffs 25-27 Mineral products 28-38 Chemicals and allied industries 39-40 Plastics / rubber 41-43 Leather 44-49 Wood and wood products 50-63 Textiles and apparel 64-67 Footwear / headgear 68-71 Stone / glass 72-83 Metals 84-85 Machinery / electrical 86-89 Transportation 90-97 Miscellaneous
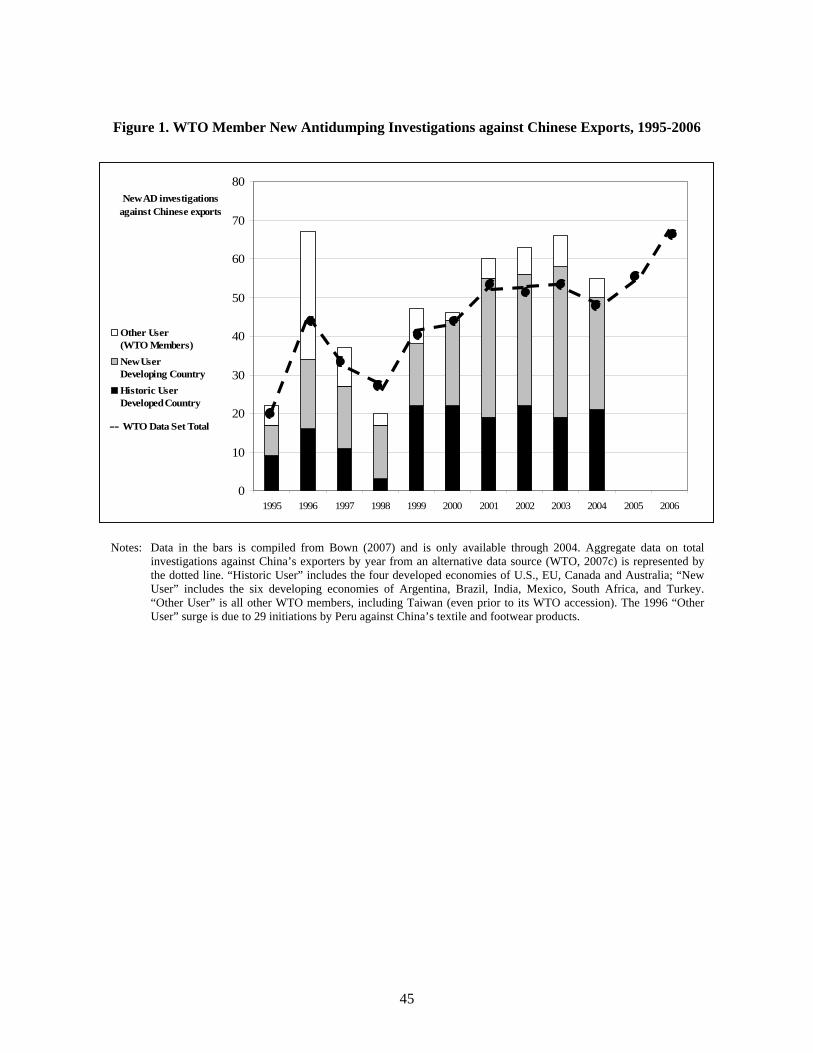
45
Figure 1. WTO Member New Antidumping Investigations against Chinese Exports, 1995-2006
0
10
20
30
40
50
60
70
80
1995 1996 1997 1998 1999 2000 2001 2002 2003 2004 2005 2006
New AD investigations against Chinese exports
Other User (WTO Members)New User Developing CountryHistoric UserDeveloped Country
-- WTO Data Set Total
Notes: Data in the bars is compiled from Bown (2007) and is only available through 2004. Aggregate data on total investigations against China’s exporters by year from an alternative data source (WTO, 2007c) is represented by the dotted line. “Historic User” includes the four developed economies of U.S., EU, Canada and Australia; “New User” includes the six developing economies of Argentina, Brazil, India, Mexico, South Africa, and Turkey. “Other User” is all other WTO members, including Taiwan (even prior to its WTO accession). The 1996 “Other User” surge is due to 29 initiations by Peru against China’s textile and footwear products.
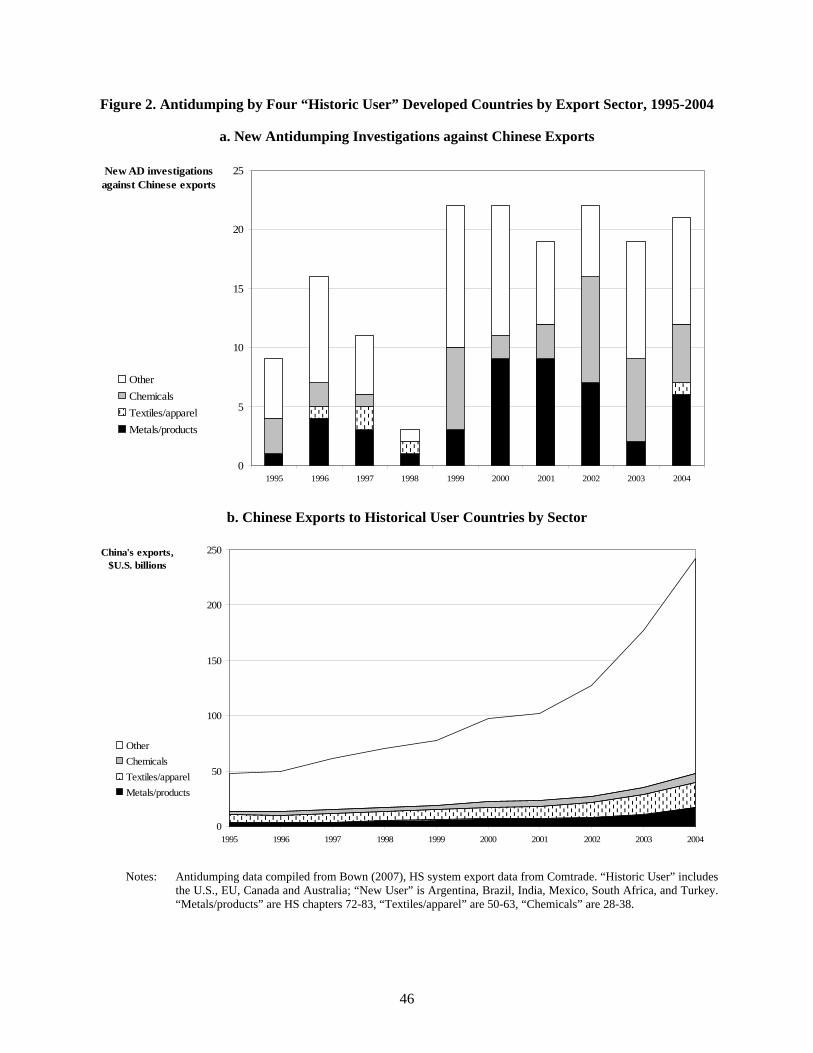
46
Figure 2. Antidumping by Four “Historic User” Developed Countries by Export Sector, 1995-2004
a. New Antidumping Investigations against Chinese Exports
0
5
10
15
20
25
1995 1996 1997 1998 1999 2000 2001 2002 2003 2004
New AD investigations against Chinese exports
OtherChemicalsTextiles/apparelMetals/products
b. Chinese Exports to Historical User Countries by Sector
0
50
100
150
200
250
1995 1996 1997 1998 1999 2000 2001 2002 2003 2004
China's exports,$U.S. billions
OtherChemicalsTextiles/apparelMetals/products
Notes: Antidumping data compiled from Bown (2007), HS system export data from Comtrade. “Historic User” includes the U.S., EU, Canada and Australia; “New User” is Argentina, Brazil, India, Mexico, South Africa, and Turkey. “Metals/products” are HS chapters 72-83, “Textiles/apparel” are 50-63, “Chemicals” are 28-38.
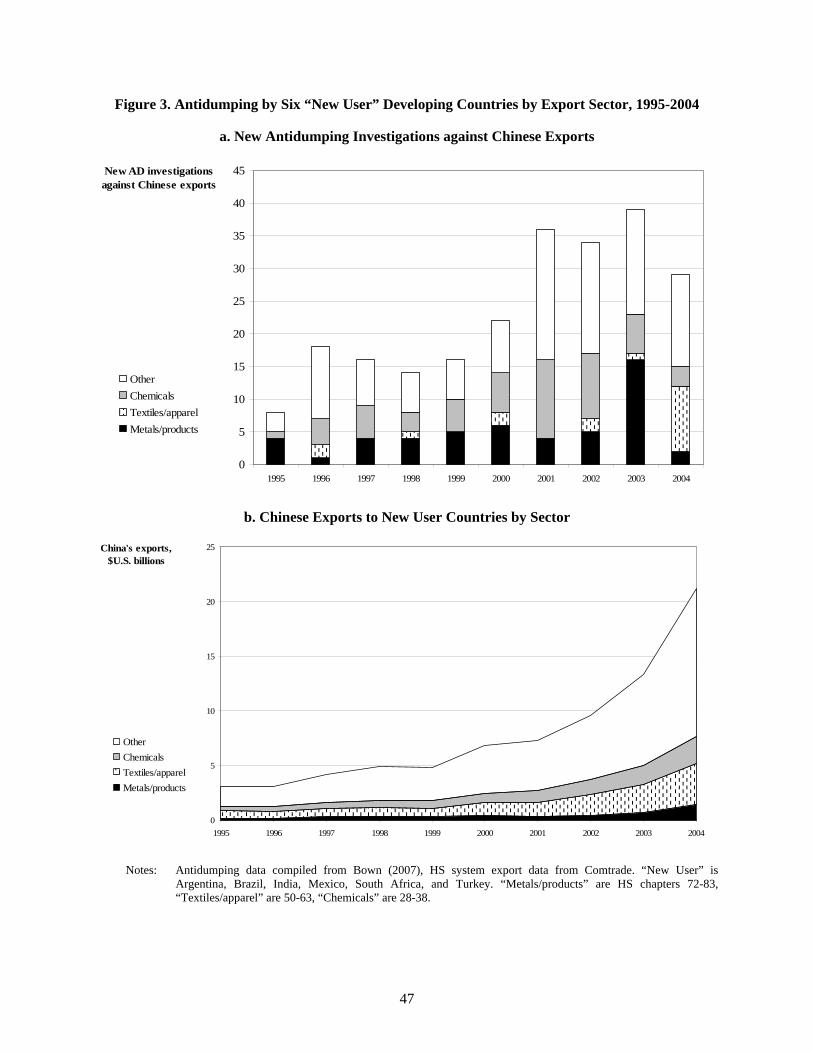
47
Figure 3. Antidumping by Six “New User” Developing Countries by Export Sector, 1995-2004
a. New Antidumping Investigations against Chinese Exports
0
5
10
15
20
25
30
35
40
45
1995 1996 1997 1998 1999 2000 2001 2002 2003 2004
New AD investigations against Chinese exports
OtherChemicalsTextiles/apparelMetals/products
b. Chinese Exports to New User Countries by Sector
0
5
10
15
20
25
1995 1996 1997 1998 1999 2000 2001 2002 2003 2004
China's exports,$U.S. billions
OtherChemicalsTextiles/apparelMetals/products
Notes: Antidumping data compiled from Bown (2007), HS system export data from Comtrade. “New User” is Argentina, Brazil, India, Mexico, South Africa, and Turkey. “Metals/products” are HS chapters 72-83, “Textiles/apparel” are 50-63, “Chemicals” are 28-38.
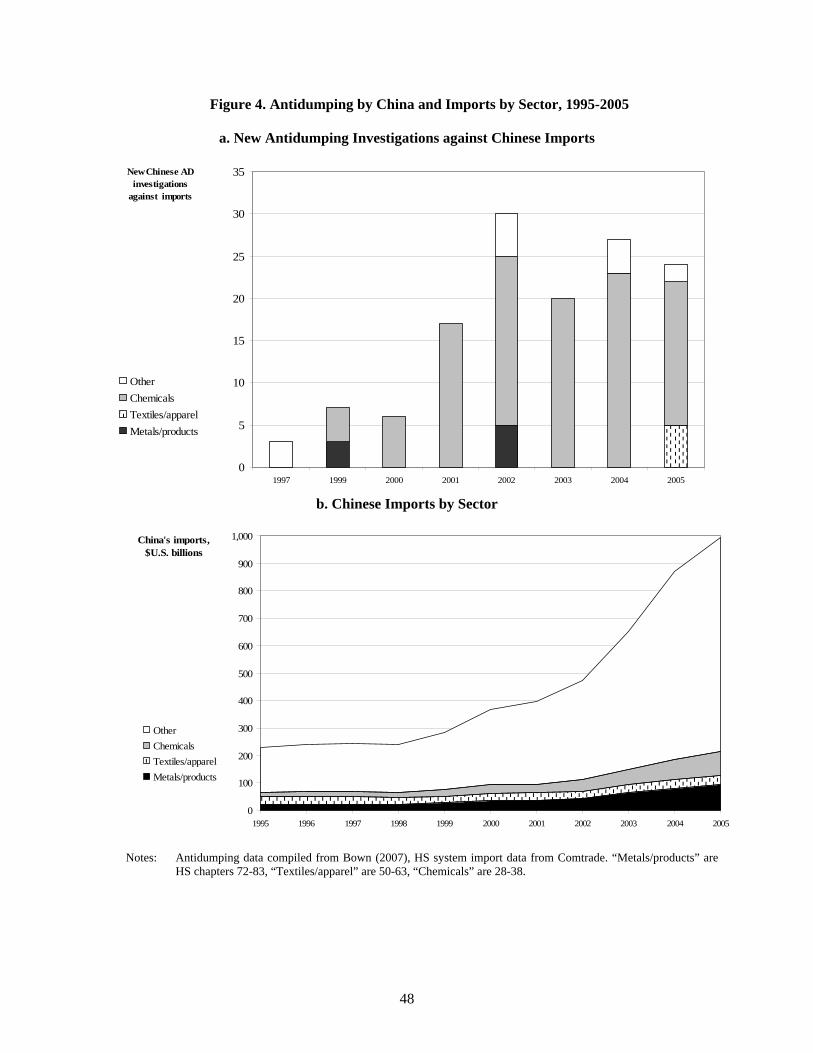
48
Figure 4. Antidumping by China and Imports by Sector, 1995-2005
a. New Antidumping Investigations against Chinese Imports
0
5
10
15
20
25
30
35
1997 1999 2000 2001 2002 2003 2004 2005
New Chinese AD investigations
against imports
OtherChemicalsTextiles/apparelMetals/products
b. Chinese Imports by Sector
0
100
200
300
400
500
600
700
800
900
1,000
1995 1996 1997 1998 1999 2000 2001 2002 2003 2004 2005
China's imports, $U.S. billions
OtherChemicalsTextiles/apparelMetals/products
Notes: Antidumping data compiled from Bown (2007), HS system import data from Comtrade. “Metals/products” are
HS chapters 72-83, “Textiles/apparel” are 50-63, “Chemicals” are 28-38.
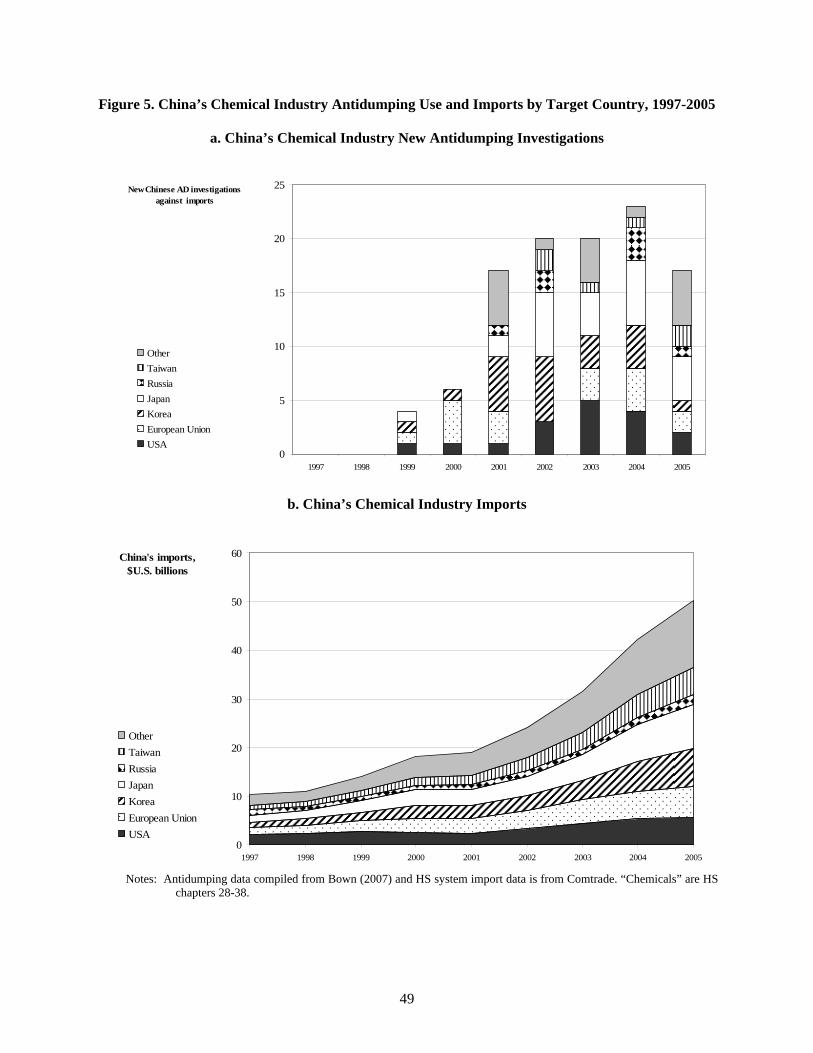
49
Figure 5. China’s Chemical Industry Antidumping Use and Imports by Target Country, 1997-2005
a. China’s Chemical Industry New Antidumping Investigations
0
5
10
15
20
25
1997 1998 1999 2000 2001 2002 2003 2004 2005
New Chinese AD investigations against imports
OtherTaiwanRussiaJapanKoreaEuropean UnionUSA
b. China’s Chemical Industry Imports
0
10
20
30
40
50
60
1997 1998 1999 2000 2001 2002 2003 2004 2005
China's imports, $U.S. billions
OtherTaiwanRussiaJapanKoreaEuropean UnionUSA
Notes: Antidumping data compiled from Bown (2007) and HS system import data is from Comtrade. “Chemicals” are HS
chapters 28-38.
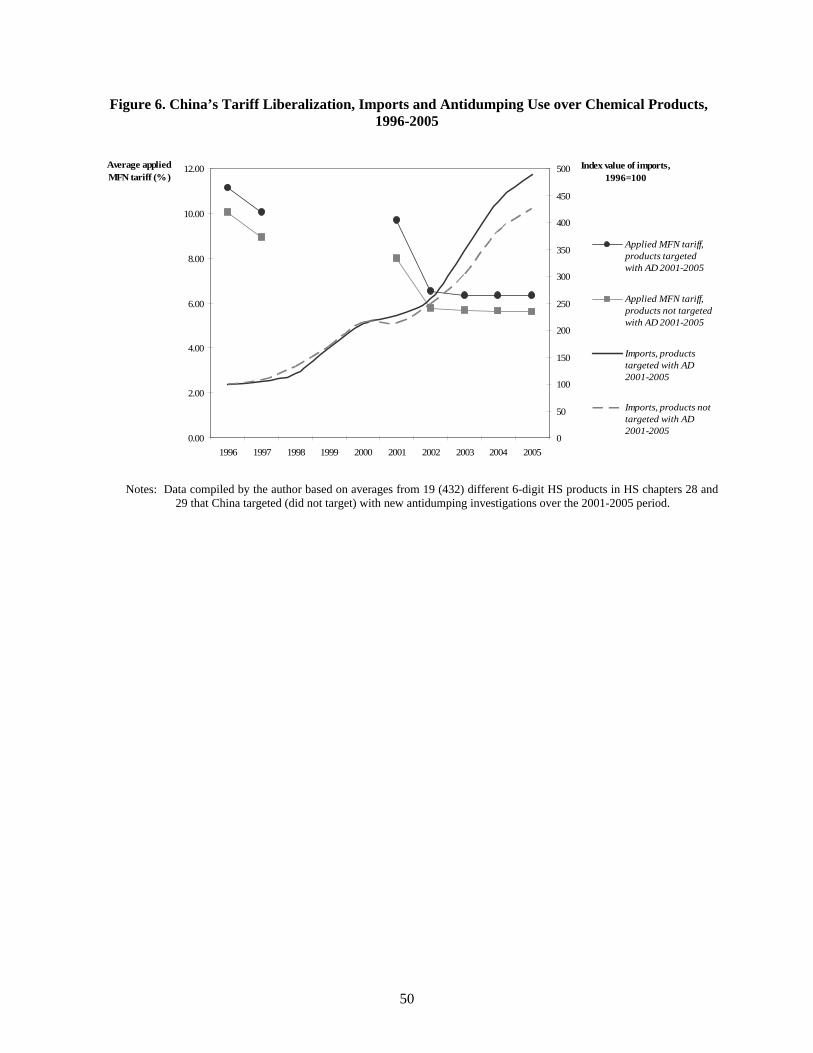
50
Figure 6. China’s Tariff Liberalization, Imports and Antidumping Use over Chemical Products, 1996-2005
0.00
2.00
4.00
6.00
8.00
10.00
12.00
1996 1997 1998 1999 2000 2001 2002 2003 2004 2005
Average applied MFN tariff (%)
0
50
100
150
200
250
300
350
400
450
500 Index value of imports, 1996=100
Applied MFN tariff,products targetedwith AD 2001-2005
Applied MFN tariff,products not targetedwith AD 2001-2005
Imports, productstargeted with AD2001-2005
Imports, products nottargeted with AD2001-2005
Notes: Data compiled by the author based on averages from 19 (432) different 6-digit HS products in HS chapters 28 and 29 that China targeted (did not target) with new antidumping investigations over the 2001-2005 period.
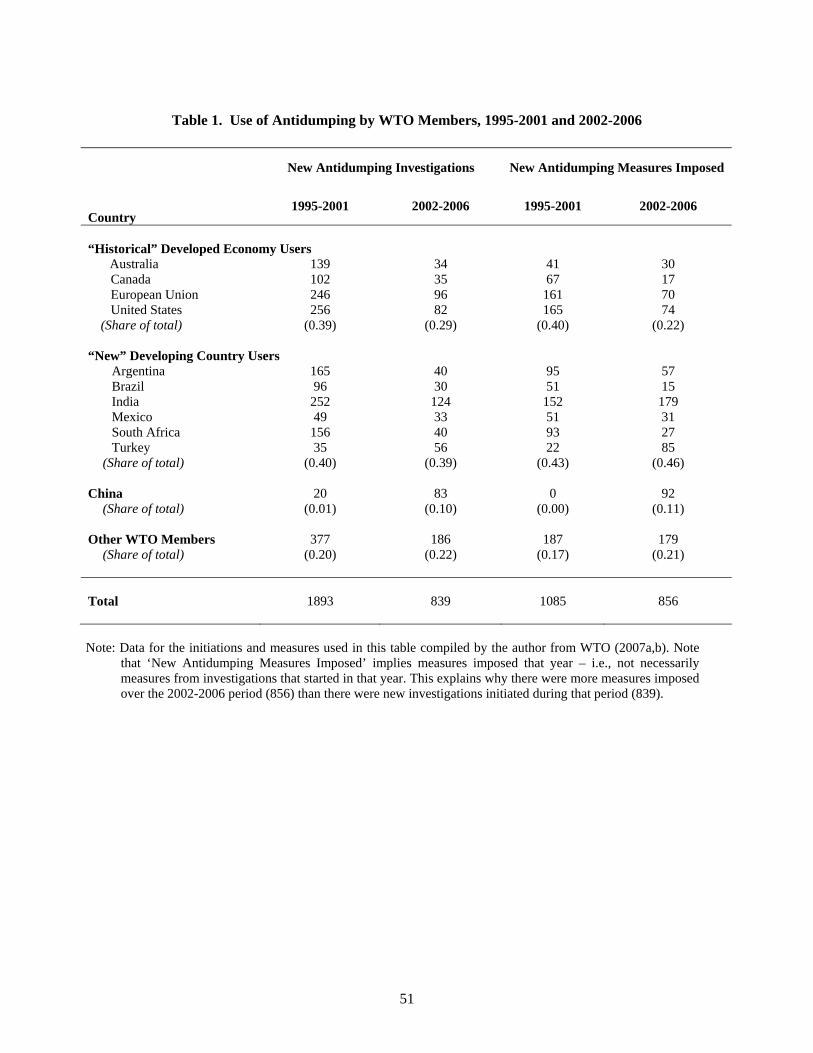
51
Table 1. Use of Antidumping by WTO Members, 1995-2001 and 2002-2006
New Antidumping Investigations New Antidumping Measures Imposed
Country 1995-2001 2002-2006 1995-2001 2002-2006
“Historical” Developed Economy Users Australia 139 34 41 30 Canada 102 35 67 17 European Union 246 96 161 70 United States 256 82 165 74 (Share of total) (0.39) (0.29) (0.40) (0.22)
“New” Developing Country Users Argentina 165 40 95 57 Brazil 96 30 51 15 India 252 124 152 179 Mexico 49 33 51 31 South Africa 156 40 93 27 Turkey 35 56 22 85 (Share of total) (0.40) (0.39) (0.43) (0.46) China 20 83 0 92 (Share of total) (0.01) (0.10) (0.00) (0.11) Other WTO Members 377 186 187 179 (Share of total) (0.20) (0.22) (0.17) (0.21)
Total 1893 839 1085 856
Note: Data for the initiations and measures used in this table compiled by the author from WTO (2007a,b). Note
that ‘New Antidumping Measures Imposed’ implies measures imposed that year – i.e., not necessarily measures from investigations that started in that year. This explains why there were more measures imposed over the 2002-2006 period (856) than there were new investigations initiated during that period (839).
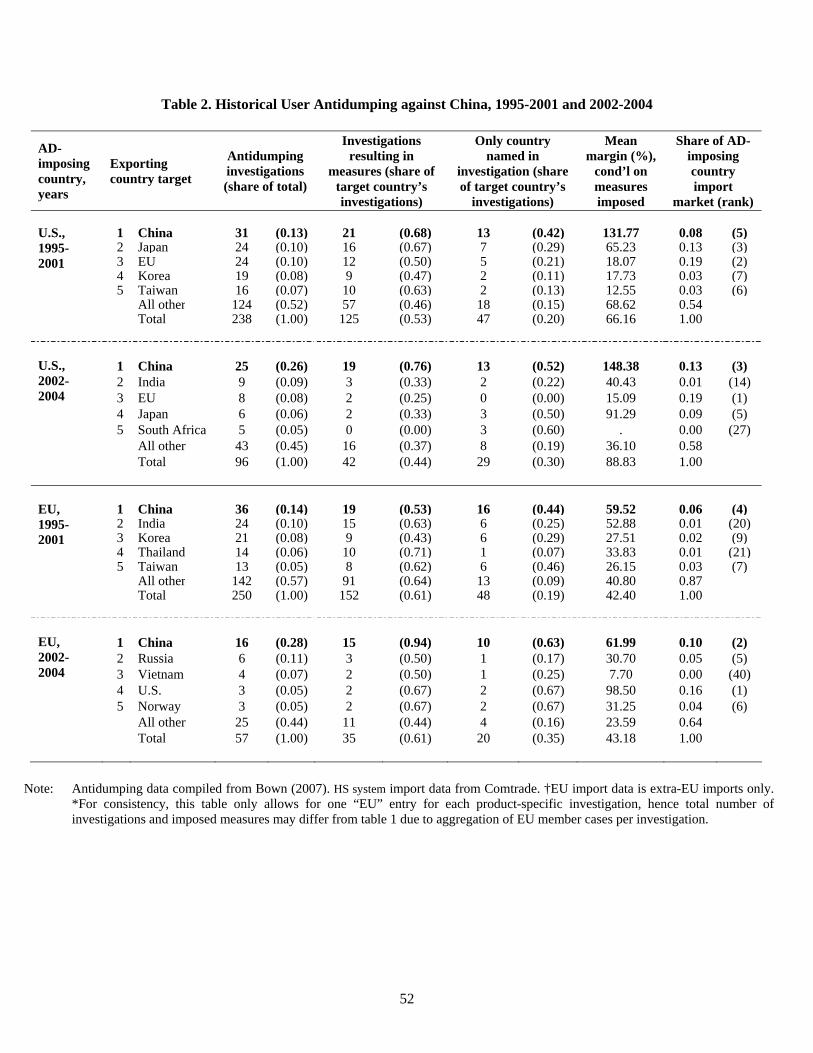
52
Table 2. Historical User Antidumping against China, 1995-2001 and 2002-2004
AD-imposing country, years
Exporting country target
Antidumping investigations (share of total)
Investigations resulting in
measures (share of target country’s investigations)
Only country named in
investigation (share of target country’s
investigations)
Mean margin (%),
cond’l on measures imposed
Share of AD-imposing country import
market (rank)
1 China 31 (0.13) 21 (0.68) 13 (0.42) 131.77 0.08 (5)2 Japan 24 (0.10) 16 (0.67) 7 (0.29) 65.23 0.13 (3)
U.S., 1995-2001 3 EU 24 (0.10) 12 (0.50) 5 (0.21) 18.07 0.19 (2) 4 Korea 19 (0.08) 9 (0.47) 2 (0.11) 17.73 0.03 (7) 5 Taiwan 16 (0.07) 10 (0.63) 2 (0.13) 12.55 0.03 (6) All other 124 (0.52) 57 (0.46) 18 (0.15) 68.62 0.54 Total 238 (1.00) 125 (0.53) 47 (0.20) 66.16 1.00
1 China 25 (0.26) 19 (0.76) 13 (0.52) 148.38 0.13 (3) 2 India 9 (0.09) 3 (0.33) 2 (0.22) 40.43 0.01 (14)
U.S., 2002-2004 3 EU 8 (0.08) 2 (0.25) 0 (0.00) 15.09 0.19 (1) 4 Japan 6 (0.06) 2 (0.33) 3 (0.50) 91.29 0.09 (5) 5 South Africa 5 (0.05) 0 (0.00) 3 (0.60) . 0.00 (27) All other 43 (0.45) 16 (0.37) 8 (0.19) 36.10 0.58 Total 96 (1.00) 42 (0.44) 29 (0.30) 88.83 1.00
1 China 36 (0.14) 19 (0.53) 16 (0.44) 59.52 0.06 (4)2 India 24 (0.10) 15 (0.63) 6 (0.25) 52.88 0.01 (20)
EU, 1995-2001 3 Korea 21 (0.08) 9 (0.43) 6 (0.29) 27.51 0.02 (9) 4 Thailand 14 (0.06) 10 (0.71) 1 (0.07) 33.83 0.01 (21) 5 Taiwan 13 (0.05) 8 (0.62) 6 (0.46) 26.15 0.03 (7) All other 142 (0.57) 91 (0.64) 13 (0.09) 40.80 0.87 Total 250 (1.00) 152 (0.61) 48 (0.19) 42.40 1.00
1 China 16 (0.28) 15 (0.94) 10 (0.63) 61.99 0.10 (2) 2 Russia 6 (0.11) 3 (0.50) 1 (0.17) 30.70 0.05 (5)
EU, 2002-2004 3 Vietnam 4 (0.07) 2 (0.50) 1 (0.25) 7.70 0.00 (40) 4 U.S. 3 (0.05) 2 (0.67) 2 (0.67) 98.50 0.16 (1) 5 Norway 3 (0.05) 2 (0.67) 2 (0.67) 31.25 0.04 (6) All other 25 (0.44) 11 (0.44) 4 (0.16) 23.59 0.64 Total 57 (1.00) 35 (0.61) 20 (0.35) 43.18 1.00
Note: Antidumping data compiled from Bown (2007). HS system import data from Comtrade. †EU import data is extra-EU imports only.
*For consistency, this table only allows for one “EU” entry for each product-specific investigation, hence total number of investigations and imposed measures may differ from table 1 due to aggregation of EU member cases per investigation.
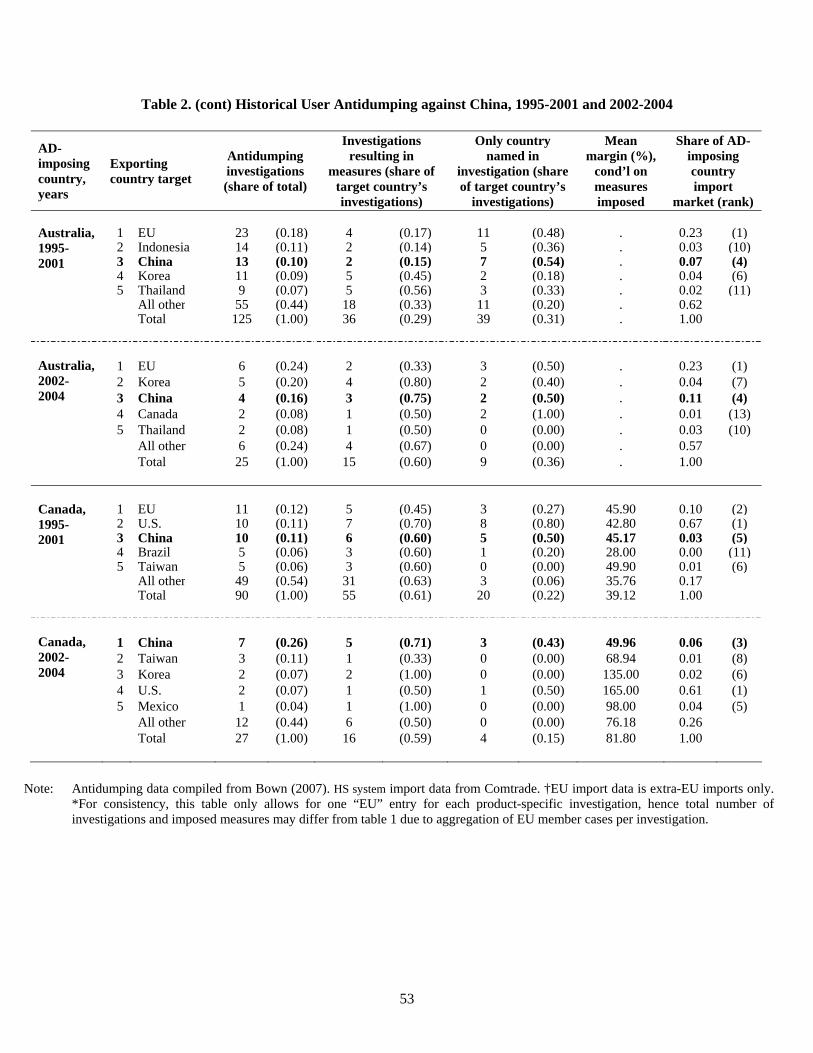
53
Table 2. (cont) Historical User Antidumping against China, 1995-2001 and 2002-2004
AD-imposing country, years
Exporting country target
Antidumping investigations (share of total)
Investigations resulting in
measures (share of target country’s investigations)
Only country named in
investigation (share of target country’s
investigations)
Mean margin (%),
cond’l on measures imposed
Share of AD-imposing country import
market (rank)
1 EU 23 (0.18) 4 (0.17) 11 (0.48) . 0.23 (1)2 Indonesia 14 (0.11) 2 (0.14) 5 (0.36) . 0.03 (10)
Australia, 1995-2001 3 China 13 (0.10) 2 (0.15) 7 (0.54) . 0.07 (4) 4 Korea 11 (0.09) 5 (0.45) 2 (0.18) . 0.04 (6) 5 Thailand 9 (0.07) 5 (0.56) 3 (0.33) . 0.02 (11) All other 55 (0.44) 18 (0.33) 11 (0.20) . 0.62 Total 125 (1.00) 36 (0.29) 39 (0.31) . 1.00
1 EU 6 (0.24) 2 (0.33) 3 (0.50) . 0.23 (1) 2 Korea 5 (0.20) 4 (0.80) 2 (0.40) . 0.04 (7)
Australia, 2002-2004 3 China 4 (0.16) 3 (0.75) 2 (0.50) . 0.11 (4) 4 Canada 2 (0.08) 1 (0.50) 2 (1.00) . 0.01 (13) 5 Thailand 2 (0.08) 1 (0.50) 0 (0.00) . 0.03 (10) All other 6 (0.24) 4 (0.67) 0 (0.00) . 0.57 Total 25 (1.00) 15 (0.60) 9 (0.36) . 1.00
1 EU 11 (0.12) 5 (0.45) 3 (0.27) 45.90 0.10 (2)2 U.S. 10 (0.11) 7 (0.70) 8 (0.80) 42.80 0.67 (1)
Canada, 1995-2001 3 China 10 (0.11) 6 (0.60) 5 (0.50) 45.17 0.03 (5) 4 Brazil 5 (0.06) 3 (0.60) 1 (0.20) 28.00 0.00 (11) 5 Taiwan 5 (0.06) 3 (0.60) 0 (0.00) 49.90 0.01 (6) All other 49 (0.54) 31 (0.63) 3 (0.06) 35.76 0.17 Total 90 (1.00) 55 (0.61) 20 (0.22) 39.12 1.00
1 China 7 (0.26) 5 (0.71) 3 (0.43) 49.96 0.06 (3) 2 Taiwan 3 (0.11) 1 (0.33) 0 (0.00) 68.94 0.01 (8)
Canada, 2002-2004 3 Korea 2 (0.07) 2 (1.00) 0 (0.00) 135.00 0.02 (6) 4 U.S. 2 (0.07) 1 (0.50) 1 (0.50) 165.00 0.61 (1) 5 Mexico 1 (0.04) 1 (1.00) 0 (0.00) 98.00 0.04 (5) All other 12 (0.44) 6 (0.50) 0 (0.00) 76.18 0.26 Total 27 (1.00) 16 (0.59) 4 (0.15) 81.80 1.00
Note: Antidumping data compiled from Bown (2007). HS system import data from Comtrade. †EU import data is extra-EU imports only.
*For consistency, this table only allows for one “EU” entry for each product-specific investigation, hence total number of investigations and imposed measures may differ from table 1 due to aggregation of EU member cases per investigation.

54
Table 3. New User Antidumping against China, 1995-2001 and 2002-2004
AD-imposing country, years
Exporting country target
Antidumping investigations (share of total)
Investigations resulting in
measures (share of target country’s investigations)
Only country named in
investigation (share of target country’s
investigations)
Share of AD-imposing country import
market (rank)
1 China 32 (0.21) 28 (0.88) 22 (0.69) 0.04 (5)2 Brazil 30 (0.20) 20 (0.67) 17 (0.57) 0.23 (2)
Argentina, 1995-2001
3 EU 19 (0.13) 9 (0.47) 10 (0.53) 0.27 (1) 4 Taiwan 9 (0.06) 9 (1.00) 0 (0.00) 0.01 (11) 5 South Africa 9 (0.06) 5 (0.56) 1 (0.11) 0.00 (23) All other 50 (0.34) 35 (0.70) 18 (0.36) 0.44 Total 149 (1.00) 106 (0.71) 68 (0.46) 1.00
1 China 6 (0.22) 5 (0.83) 6 (1.00) 0.05 (4) 2 Brazil 3 (0.11) 2 (0.67) 2 (0.67) 0.33 (1)
Argentina, 2002-2004
3 U.S. 2 (0.07) 2 (1.00) 0 (0.00) 0.17 (3) 4 Korea 2 (0.07) 2 (1.00) 0 (0.00) 0.01 (10) 5 Mexico 2 (0.07) 2 (1.00) 0 (0.00) 0.03 (7) All other 12 (0.44) 9 (0.75) 3 (0.25) 0.42 Total 27 (1.00) 22 (0.81) 11 (0.41) 1.00
1 China 15 (0.16) 12 (0.80) 14 (0.93) 0.02 (7)2 EU 13 (0.14) 8 (0.62) 3 (0.23) 0.27 (1)
Brazil, 1995-2001
3 U.S. 13 (0.14) 6 (0.46) 5 (0.38) 0.23 (2) 4 South Africa 4 (0.04) 3 (0.75) 1 (0.25) 0.00 (25) 5 Mexico 3 (0.03) 3 (1.00) 0 (0.00) 0.02 (12) All other 45 (0.48) 22 (0.49) 10 (0.22) 0.45 Total 93 (1.00) 54 (0.58) 33 (0.35) 1.00
1 China 9 (0.28) 6 (0.67) 8 (0.89) 0.05 (4) 2 India 5 (0.16) 4 (0.80) 2 (0.40) 0.01 (17)
Brazil, 2002-2003
3 EU 5 (0.16) 3 (0.60) 2 (0.40) 0.25 (1) 4 U.S. 5 (0.16) 1 (0.20) 2 (0.40) 0.20 (2) 5 Romania 1 (0.03) 1 (1.00) 1 (1.00) 0.00 (73) All other 7 (0.22) 4 (0.57) 0 (0.00) 0.49 Total 32 (1.00) 19 (0.59) 15 (0.47) 1.00
Note: Antidumping data compiled from Bown (2007). HS system import data from Comtrade. *For consistency, this table only allows for one “EU” entry for each product-specific investigation, hence total number of investigations and imposed measures may differ from table 1 due to aggregation of EU member cases per investigation. **Brazil and Mexico only contain detailed information on antidumping investigations completed through 2003.
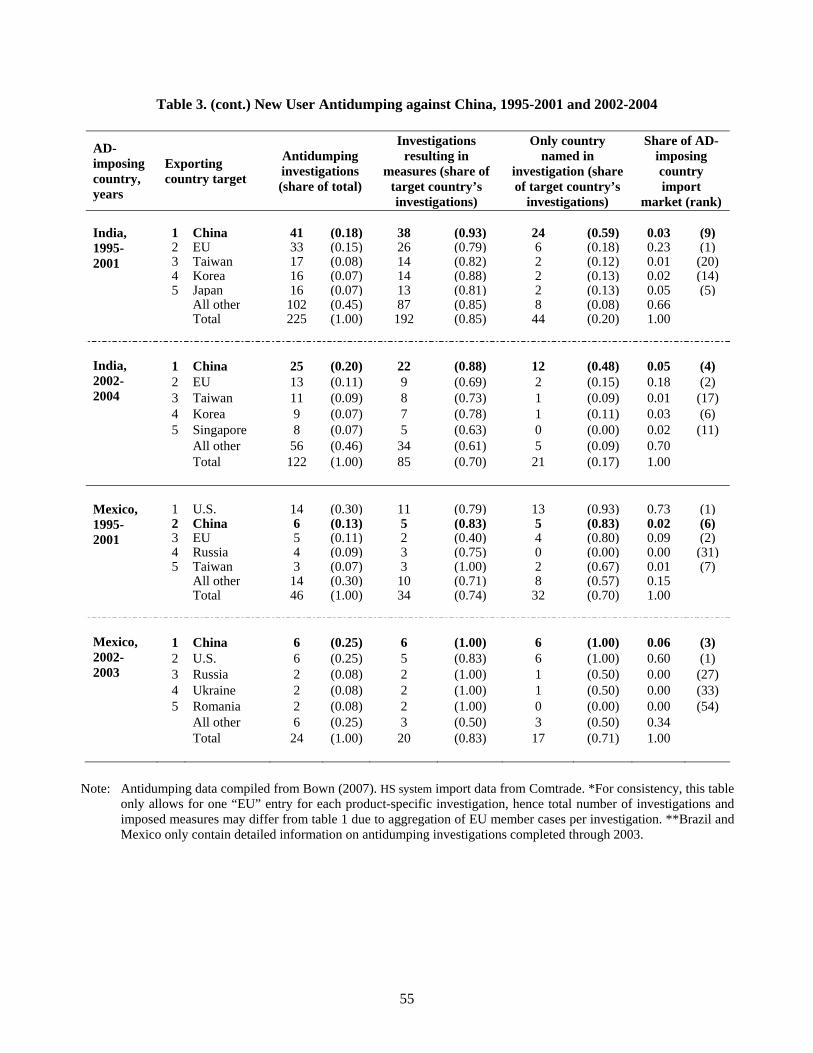
55
Table 3. (cont.) New User Antidumping against China, 1995-2001 and 2002-2004 AD-imposing country, years
Exporting country target
Antidumping investigations (share of total)
Investigations resulting in
measures (share of target country’s investigations)
Only country named in
investigation (share of target country’s
investigations)
Share of AD-imposing country import
market (rank)
1 China 41 (0.18) 38 (0.93) 24 (0.59) 0.03 (9)2 EU 33 (0.15) 26 (0.79) 6 (0.18) 0.23 (1)
India, 1995-2001 3 Taiwan 17 (0.08) 14 (0.82) 2 (0.12) 0.01 (20) 4 Korea 16 (0.07) 14 (0.88) 2 (0.13) 0.02 (14) 5 Japan 16 (0.07) 13 (0.81) 2 (0.13) 0.05 (5) All other 102 (0.45) 87 (0.85) 8 (0.08) 0.66 Total 225 (1.00) 192 (0.85) 44 (0.20) 1.00
1 China 25 (0.20) 22 (0.88) 12 (0.48) 0.05 (4) 2 EU 13 (0.11) 9 (0.69) 2 (0.15) 0.18 (2)
India, 2002-2004 3 Taiwan 11 (0.09) 8 (0.73) 1 (0.09) 0.01 (17) 4 Korea 9 (0.07) 7 (0.78) 1 (0.11) 0.03 (6) 5 Singapore 8 (0.07) 5 (0.63) 0 (0.00) 0.02 (11) All other 56 (0.46) 34 (0.61) 5 (0.09) 0.70 Total 122 (1.00) 85 (0.70) 21 (0.17) 1.00
1 U.S. 14 (0.30) 11 (0.79) 13 (0.93) 0.73 (1)2 China 6 (0.13) 5 (0.83) 5 (0.83) 0.02 (6)
Mexico, 1995-2001 3 EU 5 (0.11) 2 (0.40) 4 (0.80) 0.09 (2) 4 Russia 4 (0.09) 3 (0.75) 0 (0.00) 0.00 (31) 5 Taiwan 3 (0.07) 3 (1.00) 2 (0.67) 0.01 (7) All other 14 (0.30) 10 (0.71) 8 (0.57) 0.15 Total 46 (1.00) 34 (0.74) 32 (0.70) 1.00
1 China 6 (0.25) 6 (1.00) 6 (1.00) 0.06 (3) 2 U.S. 6 (0.25) 5 (0.83) 6 (1.00) 0.60 (1)
Mexico, 2002-2003 3 Russia 2 (0.08) 2 (1.00) 1 (0.50) 0.00 (27) 4 Ukraine 2 (0.08) 2 (1.00) 1 (0.50) 0.00 (33) 5 Romania 2 (0.08) 2 (1.00) 0 (0.00) 0.00 (54) All other 6 (0.25) 3 (0.50) 3 (0.50) 0.34 Total 24 (1.00) 20 (0.83) 17 (0.71) 1.00
Note: Antidumping data compiled from Bown (2007). HS system import data from Comtrade. *For consistency, this table only allows for one “EU” entry for each product-specific investigation, hence total number of investigations and imposed measures may differ from table 1 due to aggregation of EU member cases per investigation. **Brazil and Mexico only contain detailed information on antidumping investigations completed through 2003.
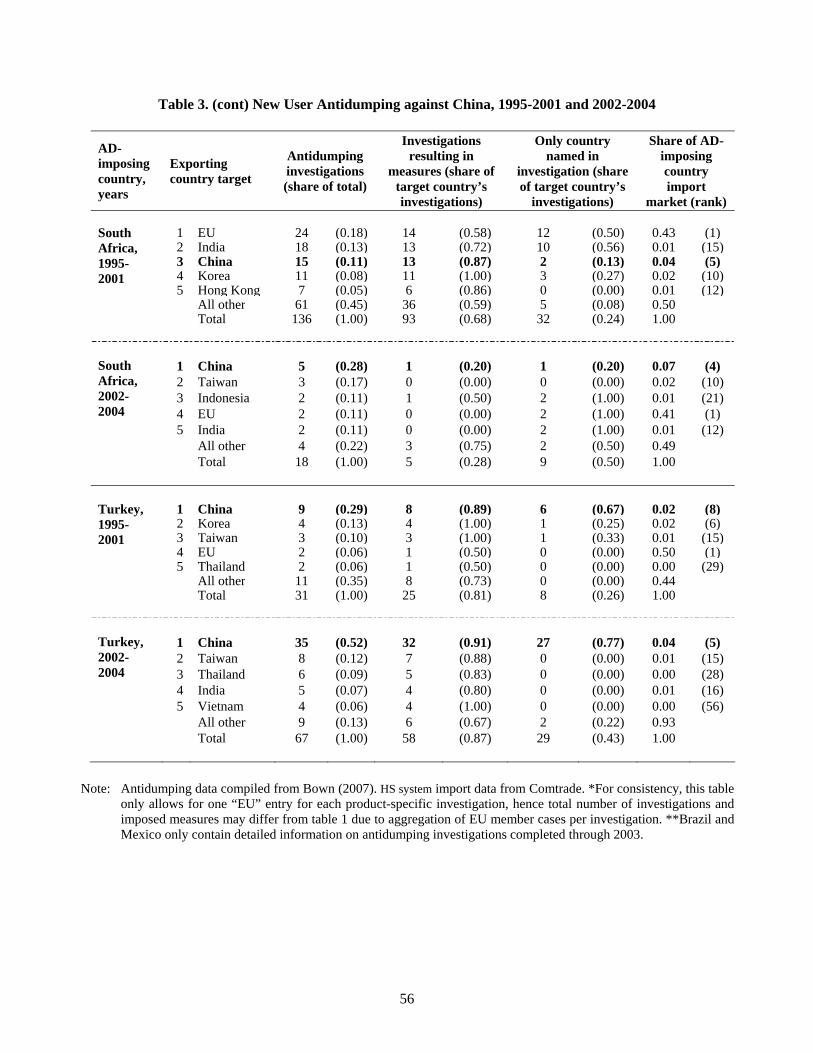
56
Table 3. (cont) New User Antidumping against China, 1995-2001 and 2002-2004 AD-imposing country, years
Exporting country target
Antidumping investigations (share of total)
Investigations resulting in
measures (share of target country’s investigations)
Only country named in
investigation (share of target country’s
investigations)
Share of AD-imposing country import
market (rank)
1 EU 24 (0.18) 14 (0.58) 12 (0.50) 0.43 (1)2 India 18 (0.13) 13 (0.72) 10 (0.56) 0.01 (15)3 China 15 (0.11) 13 (0.87) 2 (0.13) 0.04 (5)4 Korea 11 (0.08) 11 (1.00) 3 (0.27) 0.02 (10)
South Africa, 1995-2001
5 Hong Kong 7 (0.05) 6 (0.86) 0 (0.00) 0.01 (12) All other 61 (0.45) 36 (0.59) 5 (0.08) 0.50 Total 136 (1.00) 93 (0.68) 32 (0.24) 1.00
1 China 5 (0.28) 1 (0.20) 1 (0.20) 0.07 (4) 2 Taiwan 3 (0.17) 0 (0.00) 0 (0.00) 0.02 (10) 3 Indonesia 2 (0.11) 1 (0.50) 2 (1.00) 0.01 (21) 4 EU 2 (0.11) 0 (0.00) 2 (1.00) 0.41 (1)
South Africa, 2002-2004
5 India 2 (0.11) 0 (0.00) 2 (1.00) 0.01 (12) All other 4 (0.22) 3 (0.75) 2 (0.50) 0.49 Total 18 (1.00) 5 (0.28) 9 (0.50) 1.00
1 China 9 (0.29) 8 (0.89) 6 (0.67) 0.02 (8)2 Korea 4 (0.13) 4 (1.00) 1 (0.25) 0.02 (6)3 Taiwan 3 (0.10) 3 (1.00) 1 (0.33) 0.01 (15)4 EU 2 (0.06) 1 (0.50) 0 (0.00) 0.50 (1)
Turkey, 1995-2001
5 Thailand 2 (0.06) 1 (0.50) 0 (0.00) 0.00 (29) All other 11 (0.35) 8 (0.73) 0 (0.00) 0.44 Total 31 (1.00) 25 (0.81) 8 (0.26) 1.00
1 China 35 (0.52) 32 (0.91) 27 (0.77) 0.04 (5) 2 Taiwan 8 (0.12) 7 (0.88) 0 (0.00) 0.01 (15) 3 Thailand 6 (0.09) 5 (0.83) 0 (0.00) 0.00 (28) 4 India 5 (0.07) 4 (0.80) 0 (0.00) 0.01 (16)
Turkey, 2002-2004
5 Vietnam 4 (0.06) 4 (1.00) 0 (0.00) 0.00 (56) All other 9 (0.13) 6 (0.67) 2 (0.22) 0.93 Total 67 (1.00) 58 (0.87) 29 (0.43) 1.00
Note: Antidumping data compiled from Bown (2007). HS system import data from Comtrade. *For consistency, this table only allows for one “EU” entry for each product-specific investigation, hence total number of investigations and imposed measures may differ from table 1 due to aggregation of EU member cases per investigation. **Brazil and Mexico only contain detailed information on antidumping investigations completed through 2003.
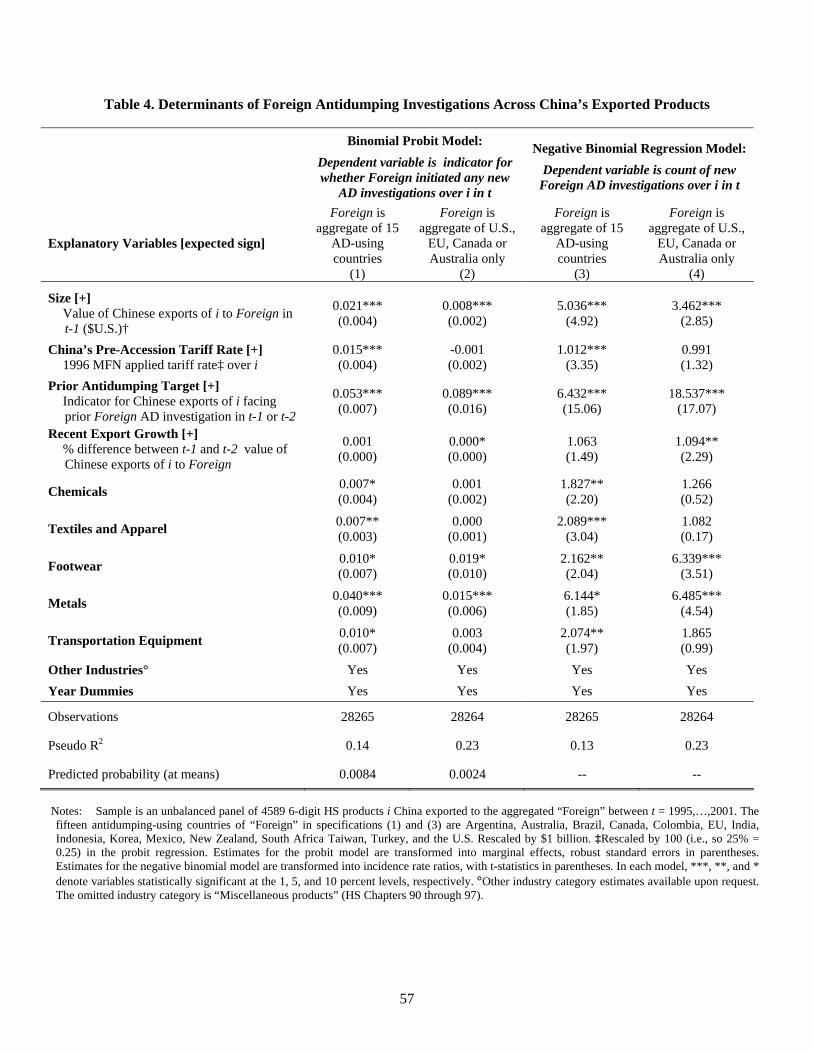
57
Table 4. Determinants of Foreign Antidumping Investigations Across China’s Exported Products
Binomial Probit Model:
Dependent variable is indicator for whether Foreign initiated any new
AD investigations over i in t
Negative Binomial Regression Model:
Dependent variable is count of new Foreign AD investigations over i in t
Explanatory Variables [expected sign]
Foreign is aggregate of 15
AD-using countries
(1)
Foreign is aggregate of U.S.,
EU, Canada or Australia only
(2)
Foreign is aggregate of 15
AD-using countries
(3)
Foreign is aggregate of U.S.,
EU, Canada or Australia only
(4)
Size [+] Value of Chinese exports of i to Foreign in
t-1 ($U.S.)†
0.021*** (0.004)
0.008*** (0.002)
5.036*** (4.92)
3.462*** (2.85)
China’s Pre-Accession Tariff Rate [+] 1996 MFN applied tariff rate‡ over i
0.015*** (0.004)
-0.001 (0.002)
1.012*** (3.35)
0.991 (1.32)
Prior Antidumping Target [+] Indicator for Chinese exports of i facing
prior Foreign AD investigation in t-1 or t-2
0.053*** (0.007)
0.089*** (0.016)
6.432*** (15.06)
18.537*** (17.07)
Recent Export Growth [+] % difference between t-1 and t-2 value of
Chinese exports of i to Foreign
0.001 (0.000)
0.000* (0.000)
1.063 (1.49)
1.094** (2.29)
Chemicals 0.007* (0.004)
0.001 (0.002)
1.827** (2.20)
1.266 (0.52)
Textiles and Apparel 0.007** (0.003)
0.000 (0.001)
2.089*** (3.04)
1.082 (0.17)
Footwear 0.010* (0.007)
0.019* (0.010)
2.162** (2.04)
6.339*** (3.51)
Metals 0.040*** (0.009)
0.015*** (0.006)
6.144* (1.85)
6.485*** (4.54)
Transportation Equipment 0.010* (0.007)
0.003 (0.004)
2.074** (1.97)
1.865 (0.99)
Other Industries° Yes Yes Yes Yes Year Dummies Yes Yes Yes Yes
Observations 28265 28264 28265 28264
Pseudo R2 0.14 0.23 0.13 0.23
Predicted probability (at means) 0.0084 0.0024 -- --
Notes: Sample is an unbalanced panel of 4589 6-digit HS products i China exported to the aggregated “Foreign” between t = 1995,…,2001. The fifteen antidumping-using countries of “Foreign” in specifications (1) and (3) are Argentina, Australia, Brazil, Canada, Colombia, EU, India, Indonesia, Korea, Mexico, New Zealand, South Africa Taiwan, Turkey, and the U.S. Rescaled by $1 billion. ‡Rescaled by 100 (i.e., so 25% = 0.25) in the probit regression. Estimates for the probit model are transformed into marginal effects, robust standard errors in parentheses. Estimates for the negative binomial model are transformed into incidence rate ratios, with t-statistics in parentheses. In each model, ***, **, and * denote variables statistically significant at the 1, 5, and 10 percent levels, respectively. °Other industry category estimates available upon request. The omitted industry category is “Miscellaneous products” (HS Chapters 90 through 97).
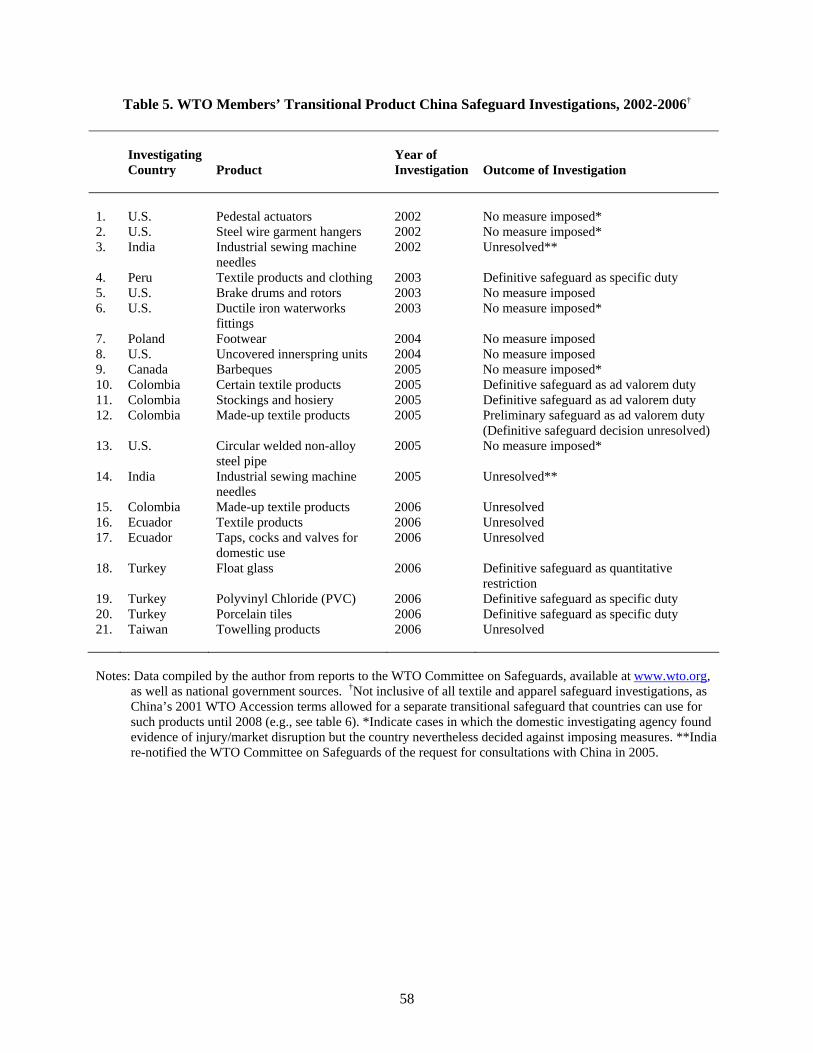
58
Table 5. WTO Members’ Transitional Product China Safeguard Investigations, 2002-2006† Investigating
Country Product Year of Investigation Outcome of Investigation
1. U.S. Pedestal actuators 2002 No measure imposed* 2. U.S. Steel wire garment hangers 2002 No measure imposed* 3. India Industrial sewing machine
needles 2002 Unresolved**
4. Peru Textile products and clothing 2003 Definitive safeguard as specific duty 5. U.S. Brake drums and rotors 2003 No measure imposed 6. U.S. Ductile iron waterworks
fittings 2003 No measure imposed*
7. Poland Footwear 2004 No measure imposed 8. U.S. Uncovered innerspring units 2004 No measure imposed 9. Canada Barbeques 2005 No measure imposed* 10. Colombia Certain textile products 2005 Definitive safeguard as ad valorem duty 11. Colombia Stockings and hosiery 2005 Definitive safeguard as ad valorem duty 12. Colombia Made-up textile products 2005 Preliminary safeguard as ad valorem duty
(Definitive safeguard decision unresolved) 13. U.S. Circular welded non-alloy
steel pipe 2005 No measure imposed*
14. India Industrial sewing machine needles
2005 Unresolved**
15. Colombia Made-up textile products 2006 Unresolved 16. Ecuador Textile products 2006 Unresolved 17. Ecuador Taps, cocks and valves for
domestic use 2006 Unresolved
18. Turkey Float glass 2006 Definitive safeguard as quantitative restriction
19. Turkey Polyvinyl Chloride (PVC) 2006 Definitive safeguard as specific duty 20. Turkey Porcelain tiles 2006 Definitive safeguard as specific duty 21. Taiwan Towelling products 2006 Unresolved Notes: Data compiled by the author from reports to the WTO Committee on Safeguards, available at www.wto.org,
as well as national government sources. †Not inclusive of all textile and apparel safeguard investigations, as China’s 2001 WTO Accession terms allowed for a separate transitional safeguard that countries can use for such products until 2008 (e.g., see table 6). *Indicate cases in which the domestic investigating agency found evidence of injury/market disruption but the country nevertheless decided against imposing measures. **India re-notified the WTO Committee on Safeguards of the request for consultations with China in 2005.
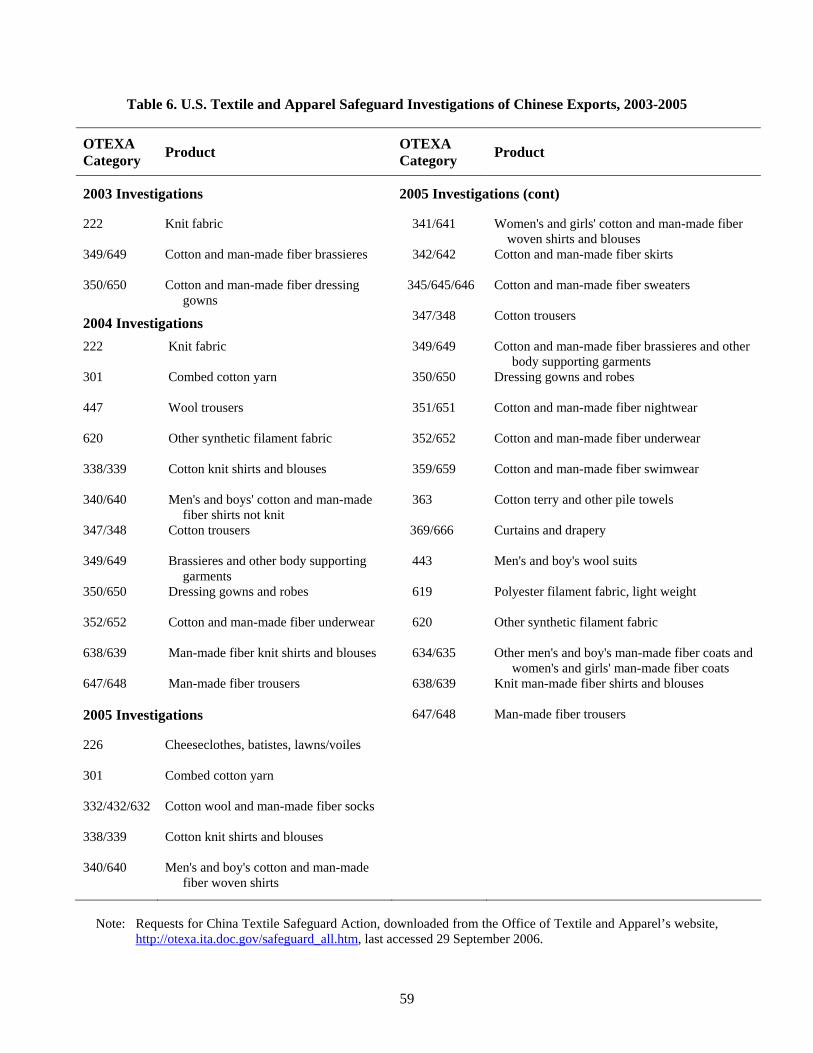
59
Table 6. U.S. Textile and Apparel Safeguard Investigations of Chinese Exports, 2003-2005
OTEXA Category Product OTEXA
Category Product
2003 Investigations 2005 Investigations (cont)
222 Knit fabric 341/641 Women's and girls' cotton and man-made fiber woven shirts and blouses
349/649 Cotton and man-made fiber brassieres 342/642 Cotton and man-made fiber skirts
350/650 Cotton and man-made fiber dressing gowns
345/645/646 Cotton and man-made fiber sweaters
2004 Investigations 347/348 Cotton trousers
222 Knit fabric 349/649 Cotton and man-made fiber brassieres and other body supporting garments
301 Combed cotton yarn 350/650 Dressing gowns and robes
447 Wool trousers 351/651 Cotton and man-made fiber nightwear
620 Other synthetic filament fabric 352/652 Cotton and man-made fiber underwear
338/339 Cotton knit shirts and blouses 359/659 Cotton and man-made fiber swimwear
340/640 Men's and boys' cotton and man-made fiber shirts not knit
363 Cotton terry and other pile towels
347/348 Cotton trousers 369/666 Curtains and drapery
349/649 Brassieres and other body supporting garments
443 Men's and boy's wool suits
350/650 Dressing gowns and robes 619 Polyester filament fabric, light weight
352/652 Cotton and man-made fiber underwear 620 Other synthetic filament fabric
638/639 Man-made fiber knit shirts and blouses 634/635 Other men's and boy's man-made fiber coats and women's and girls' man-made fiber coats
647/648 Man-made fiber trousers 638/639 Knit man-made fiber shirts and blouses
2005 Investigations 647/648 Man-made fiber trousers
226 Cheeseclothes, batistes, lawns/voiles
301 Combed cotton yarn
332/432/632 Cotton wool and man-made fiber socks
338/339 Cotton knit shirts and blouses
340/640 Men's and boy's cotton and man-made fiber woven shirts
Note: Requests for China Textile Safeguard Action, downloaded from the Office of Textile and Apparel’s website,
http://otexa.ita.doc.gov/safeguard_all.htm, last accessed 29 September 2006.
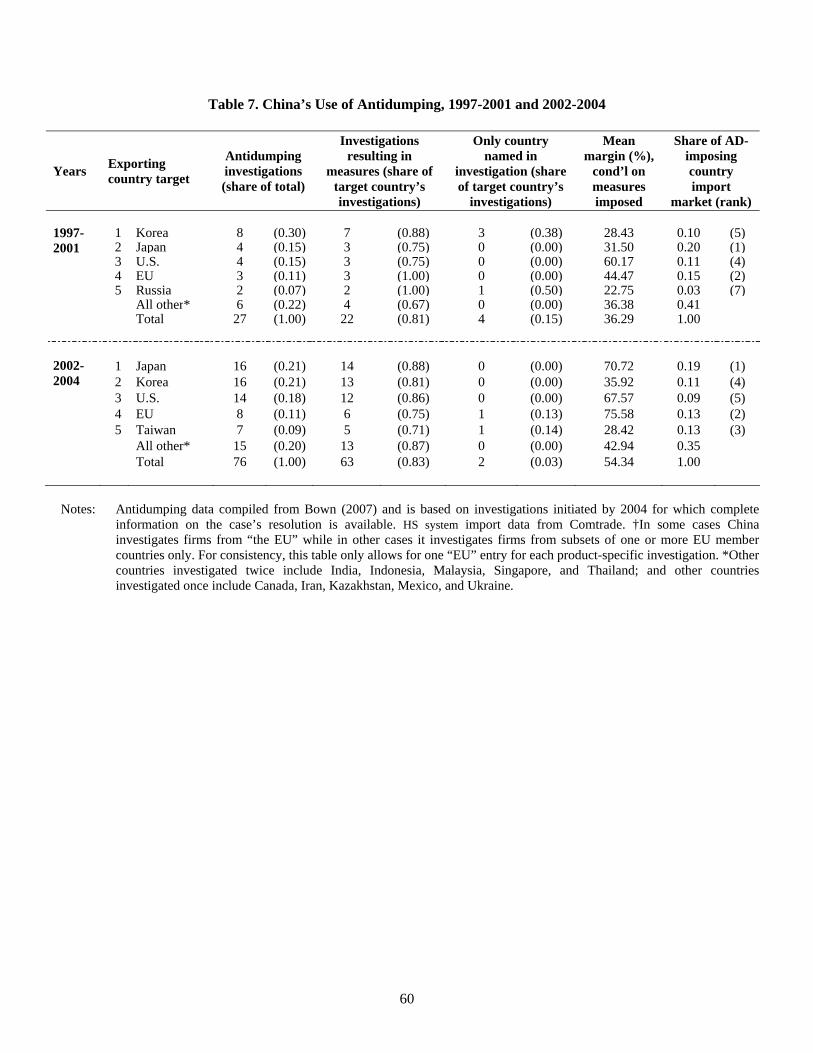
60
Table 7. China’s Use of Antidumping, 1997-2001 and 2002-2004
Years Exporting country target
Antidumping investigations (share of total)
Investigations resulting in
measures (share of target country’s investigations)
Only country named in
investigation (share of target country’s
investigations)
Mean margin (%),
cond’l on measures imposed
Share of AD-imposing country import
market (rank)
1 Korea 8 (0.30) 7 (0.88) 3 (0.38) 28.43 0.10 (5)2 Japan 4 (0.15) 3 (0.75) 0 (0.00) 31.50 0.20 (1)3 U.S. 4 (0.15) 3 (0.75) 0 (0.00) 60.17 0.11 (4)4 EU 3 (0.11) 3 (1.00) 0 (0.00) 44.47 0.15 (2)
1997-2001
5 Russia 2 (0.07) 2 (1.00) 1 (0.50) 22.75 0.03 (7) All other* 6 (0.22) 4 (0.67) 0 (0.00) 36.38 0.41 Total 27 (1.00) 22 (0.81) 4 (0.15) 36.29 1.00
1 Japan 16 (0.21) 14 (0.88) 0 (0.00) 70.72 0.19 (1) 2 Korea 16 (0.21) 13 (0.81) 0 (0.00) 35.92 0.11 (4) 3 U.S. 14 (0.18) 12 (0.86) 0 (0.00) 67.57 0.09 (5) 4 EU 8 (0.11) 6 (0.75) 1 (0.13) 75.58 0.13 (2)
2002-2004
5 Taiwan 7 (0.09) 5 (0.71) 1 (0.14) 28.42 0.13 (3) All other* 15 (0.20) 13 (0.87) 0 (0.00) 42.94 0.35 Total 76 (1.00) 63 (0.83) 2 (0.03) 54.34 1.00
Notes: Antidumping data compiled from Bown (2007) and is based on investigations initiated by 2004 for which complete
information on the case’s resolution is available. HS system import data from Comtrade. †In some cases China investigates firms from “the EU” while in other cases it investigates firms from subsets of one or more EU member countries only. For consistency, this table only allows for one “EU” entry for each product-specific investigation. *Other countries investigated twice include India, Indonesia, Malaysia, Singapore, and Thailand; and other countries investigated once include Canada, Iran, Kazakhstan, Mexico, and Ukraine.
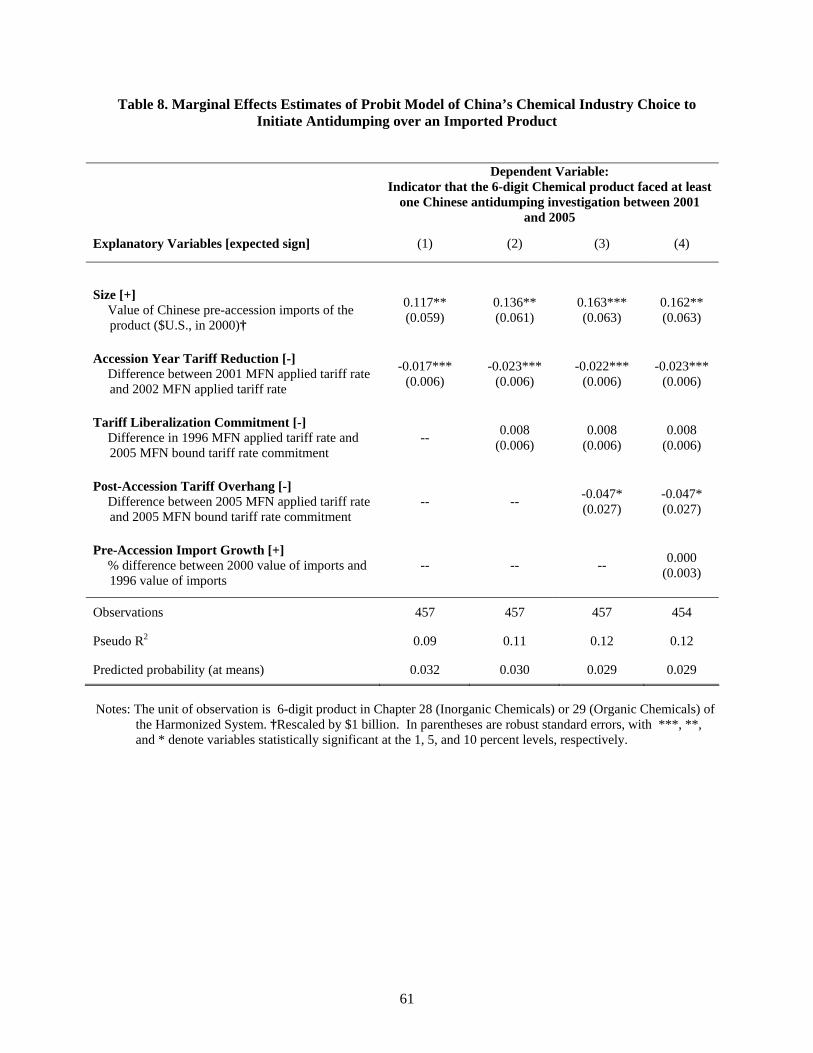
61
Table 8. Marginal Effects Estimates of Probit Model of China’s Chemical Industry Choice to Initiate Antidumping over an Imported Product
Dependent Variable: Indicator that the 6-digit Chemical product faced at least
one Chinese antidumping investigation between 2001 and 2005
Explanatory Variables [expected sign] (1) (2) (3) (4)
Size [+] Value of Chinese pre-accession imports of the
product ($U.S., in 2000)†
0.117** (0.059)
0.136** (0.061)
0.163*** (0.063)
0.162** (0.063)
Accession Year Tariff Reduction [-] Difference between 2001 MFN applied tariff rate
and 2002 MFN applied tariff rate
-0.017*** (0.006)
-0.023*** (0.006)
-0.022*** (0.006)
-0.023*** (0.006)
Tariff Liberalization Commitment [-] Difference in 1996 MFN applied tariff rate and
2005 MFN bound tariff rate commitment -- 0.008
(0.006) 0.008
(0.006) 0.008
(0.006)
Post-Accession Tariff Overhang [-] Difference between 2005 MFN applied tariff rate
and 2005 MFN bound tariff rate commitment -- -- -0.047*
(0.027) -0.047* (0.027)
Pre-Accession Import Growth [+] % difference between 2000 value of imports and
1996 value of imports -- -- -- 0.000
(0.003)
Observations 457 457 457 454
Pseudo R2 0.09 0.11 0.12 0.12
Predicted probability (at means) 0.032 0.030 0.029 0.029
Notes: The unit of observation is 6-digit product in Chapter 28 (Inorganic Chemicals) or 29 (Organic Chemicals) of
the Harmonized System. †Rescaled by $1 billion. In parentheses are robust standard errors, with ***, **, and * denote variables statistically significant at the 1, 5, and 10 percent levels, respectively.
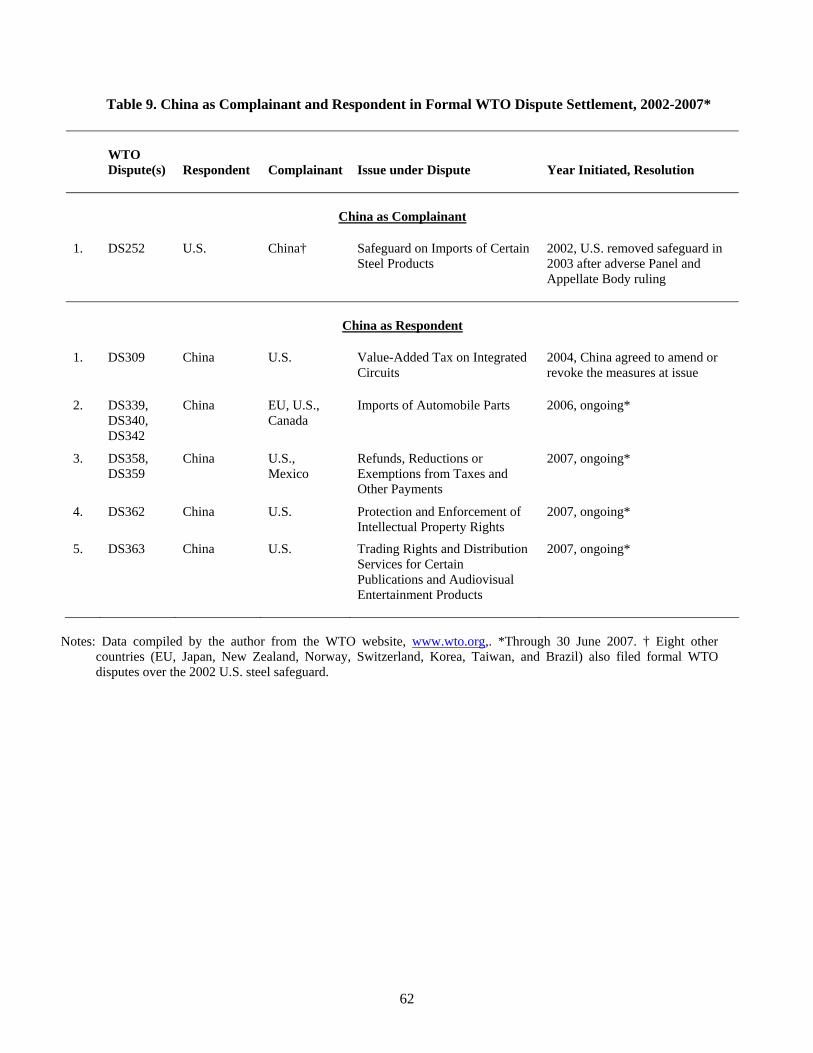
62
Table 9. China as Complainant and Respondent in Formal WTO Dispute Settlement, 2002-2007*
WTO
Dispute(s) Respondent Complainant Issue under Dispute Year Initiated, Resolution
China as Complainant
1. DS252 U.S. China† Safeguard on Imports of Certain Steel Products
2002, U.S. removed safeguard in 2003 after adverse Panel and Appellate Body ruling
China as Respondent
1. DS309 China U.S. Value-Added Tax on Integrated Circuits
2004, China agreed to amend or revoke the measures at issue
2. DS339, DS340, DS342
China EU, U.S., Canada
Imports of Automobile Parts 2006, ongoing*
3. DS358, DS359
China U.S., Mexico
Refunds, Reductions or Exemptions from Taxes and Other Payments
2007, ongoing*
4. DS362 China U.S. Protection and Enforcement of Intellectual Property Rights
2007, ongoing*
5. DS363 China U.S. Trading Rights and Distribution Services for Certain Publications and Audiovisual Entertainment Products
2007, ongoing*
Notes: Data compiled by the author from the WTO website, www.wto.org,. *Through 30 June 2007. † Eight other countries (EU, Japan, New Zealand, Norway, Switzerland, Korea, Taiwan, and Brazil) also filed formal WTO disputes over the 2002 U.S. steel safeguard.
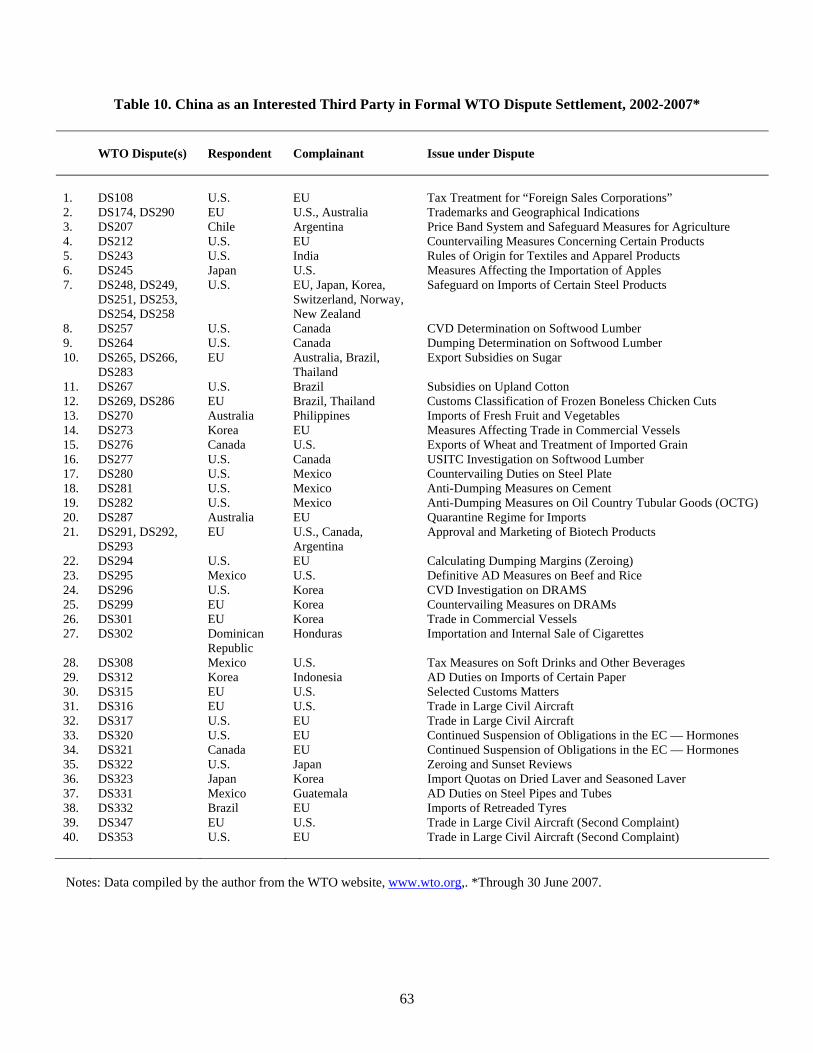
63
Table 10. China as an Interested Third Party in Formal WTO Dispute Settlement, 2002-2007*
WTO Dispute(s) Respondent Complainant Issue under Dispute 1. DS108 U.S. EU Tax Treatment for “Foreign Sales Corporations” 2. DS174, DS290 EU U.S., Australia Trademarks and Geographical Indications 3. DS207 Chile Argentina Price Band System and Safeguard Measures for Agriculture 4. DS212 U.S. EU Countervailing Measures Concerning Certain Products 5. DS243 U.S. India Rules of Origin for Textiles and Apparel Products 6. DS245 Japan U.S. Measures Affecting the Importation of Apples 7. DS248, DS249,
DS251, DS253, DS254, DS258
U.S. EU, Japan, Korea, Switzerland, Norway, New Zealand
Safeguard on Imports of Certain Steel Products
8. DS257 U.S. Canada CVD Determination on Softwood Lumber 9. DS264 U.S. Canada Dumping Determination on Softwood Lumber 10. DS265, DS266,
DS283 EU Australia, Brazil,
Thailand Export Subsidies on Sugar
11. DS267 U.S. Brazil Subsidies on Upland Cotton 12. DS269, DS286 EU Brazil, Thailand Customs Classification of Frozen Boneless Chicken Cuts 13. DS270 Australia Philippines Imports of Fresh Fruit and Vegetables 14. DS273 Korea EU Measures Affecting Trade in Commercial Vessels 15. DS276 Canada U.S. Exports of Wheat and Treatment of Imported Grain 16. DS277 U.S. Canada USITC Investigation on Softwood Lumber 17. DS280 U.S. Mexico Countervailing Duties on Steel Plate 18. DS281 U.S. Mexico Anti-Dumping Measures on Cement 19. DS282 U.S. Mexico Anti-Dumping Measures on Oil Country Tubular Goods (OCTG) 20. DS287 Australia EU Quarantine Regime for Imports 21. DS291, DS292,
DS293 EU U.S., Canada,
Argentina Approval and Marketing of Biotech Products
22. DS294 U.S. EU Calculating Dumping Margins (Zeroing) 23. DS295 Mexico U.S. Definitive AD Measures on Beef and Rice 24. DS296 U.S. Korea CVD Investigation on DRAMS 25. DS299 EU Korea Countervailing Measures on DRAMs 26. DS301 EU Korea Trade in Commercial Vessels 27. DS302 Dominican
Republic Honduras Importation and Internal Sale of Cigarettes
28. DS308 Mexico U.S. Tax Measures on Soft Drinks and Other Beverages 29. DS312 Korea Indonesia AD Duties on Imports of Certain Paper 30. DS315 EU U.S. Selected Customs Matters 31. DS316 EU U.S. Trade in Large Civil Aircraft 32. DS317 U.S. EU Trade in Large Civil Aircraft 33. DS320 U.S. EU Continued Suspension of Obligations in the EC — Hormones 34. DS321 Canada EU Continued Suspension of Obligations in the EC — Hormones 35. DS322 U.S. Japan Zeroing and Sunset Reviews 36. DS323 Japan Korea Import Quotas on Dried Laver and Seasoned Laver 37. DS331 Mexico Guatemala AD Duties on Steel Pipes and Tubes 38. DS332 Brazil EU Imports of Retreaded Tyres 39. DS347 EU U.S. Trade in Large Civil Aircraft (Second Complaint) 40. DS353 U.S. EU Trade in Large Civil Aircraft (Second Complaint)
Notes: Data compiled by the author from the WTO website, www.wto.org,. *Through 30 June 2007.