Embed Size (px)
Citation preview

Impact factorcillin®: hype or hope for treatment of ac
ademititis?
Acknowledgement
Seglen O Per (BMJ 1997; 134:497)
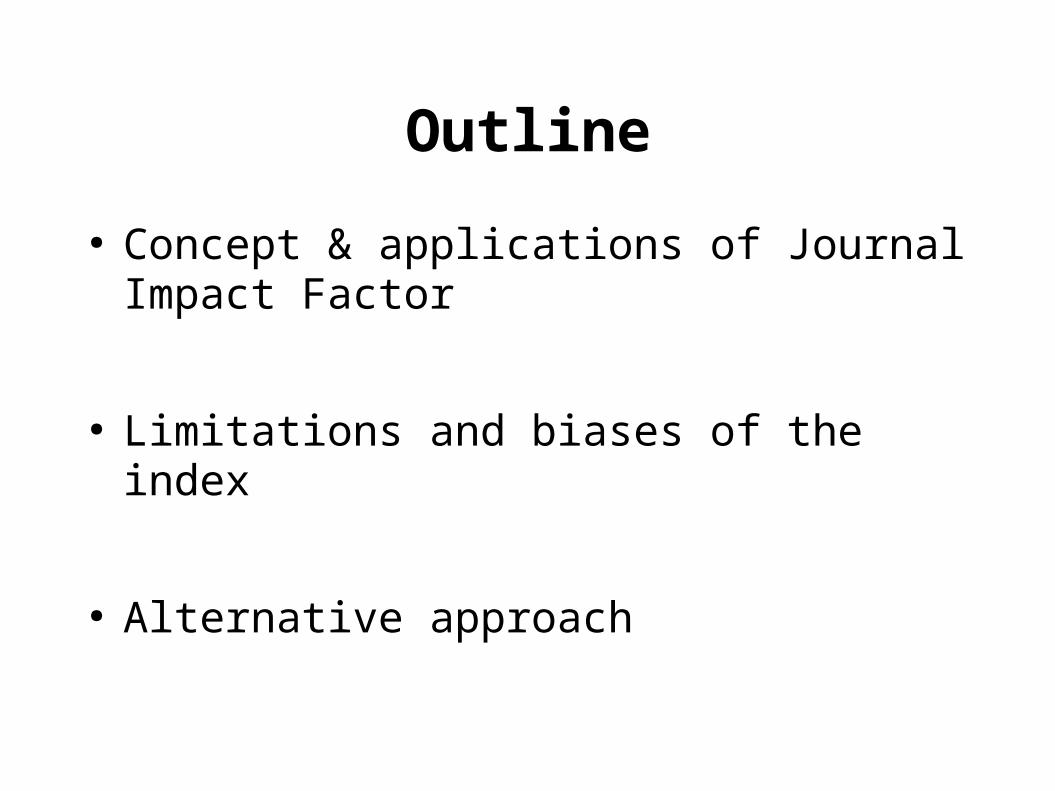
Outline
● Concept & applications of Journal Impact Factor
● Limitations and biases of the index
● Alternative approach

Journal Impact Factor
● introduced by Eugene Garfield (1955) as a simple method for comparing journals
● later be used for evaluating quality of scientific works
● evaluating individual researchers (academics)
● ranking schools or universities● also be used for resource allocation in
academic circle e.g. granting proposals, budget allocation among departments or universities

Journal Impact Factor
● Calculation– Numerator: number of citations in a
certain year to papers in the same journal in the two years before
– Denominator: number of ‘citable’ items published in that journal in the same two years

Impact Factor Calculations
Cites in 2005 to articles published in:
2004 =118
Number of articles published in:
2004 =
123
2003 =134
2003 =
69
Sum:
252
Sum: 192
Calculation: Cites to recent articles 252 1.312
Number of recent articles
192
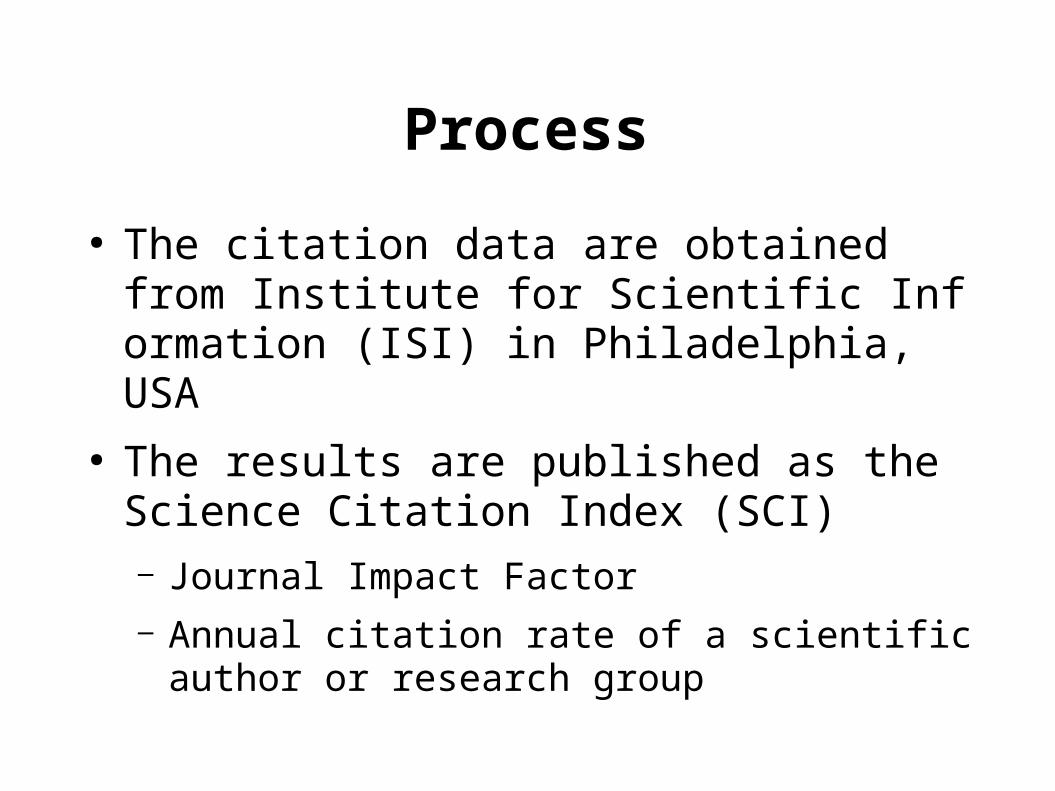
Process
● The citation data are obtained from Institute for Scientific Information (ISI) in Philadelphia, USA
● The results are published as the Science Citation Index (SCI)– Journal Impact Factor– Annual citation rate of a scientific author
or research group

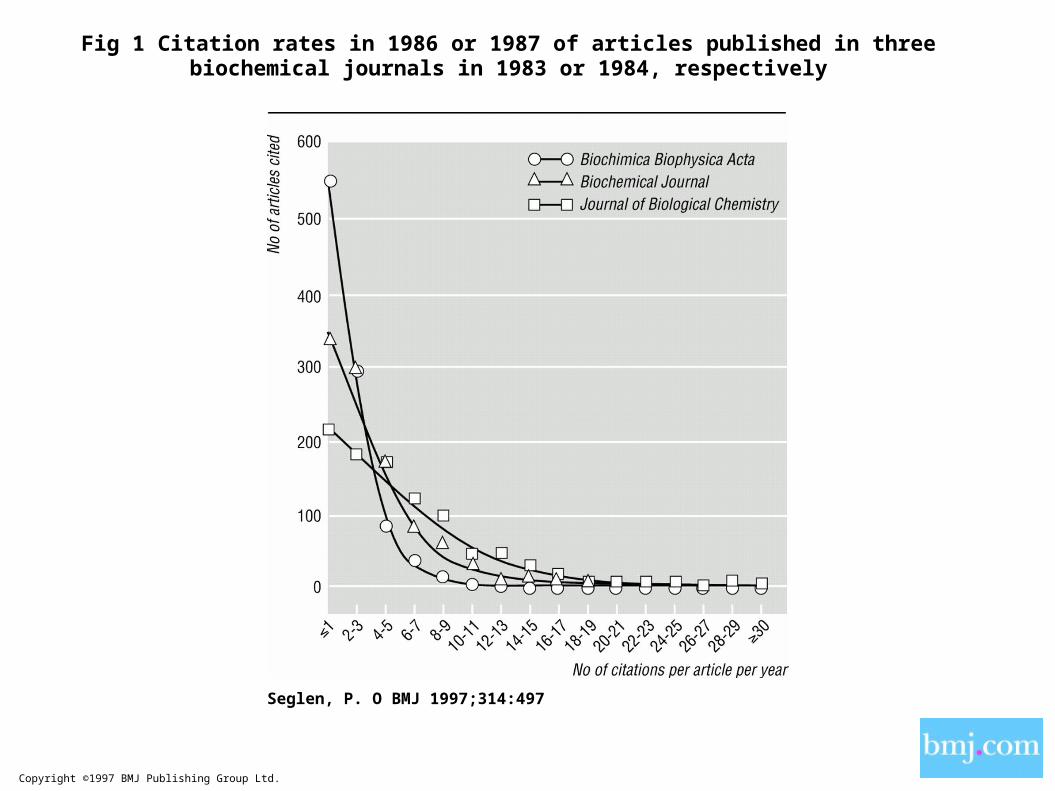
Problems associated with the use of journal impact factors ● Journal impact factors are not statistic
ally representative of individual journal articles
● Journal impact factors correlate poorly with actual citations of individual articles

Is the journal impact factor really representative of the individual journal articles
?
Copyright ©1997 BMJ Publishing Group Ltd.
Seglen, P. O BMJ 1997;314:497
Fig 1 Citation rates in 1986 or 1987 of articles published in three biochemical journals in 1983 or 1984, respectively

Copyright ©1997 BMJ Publishing Group Ltd.
Seglen, P. O BMJ 1997;314:497
Fig 2 Cumulative contribution of articles with different citation rates (beginning with most cited 5%) to total journal impact. Values are mean (SE) of journals in fig 1; dotted lines indicate contributions
of 15% and 50% most cited articles

Copyright ©1997 BMJ Publishing Group Ltd.
Seglen, P. O BMJ 1997;314:497
Fig 3 Correlation between article citation rate and journal impact for four authors

‘Citable’ items
● Not all published items are counted● Research papers and short reports are
defined as ‘citable’● excluding editorials, reviews, or letters

Flawed computations
● no correction for self citations editorials, lively correspondences, review articles, long articles (30-40% inflation)
● the use of an extremely short term index short publication lags, online-first articles (press articles)
● Basic sciences and dynamic research field e.g. biology, biochemistry VS. Ecology, mathematics

Limitation of the database (ISI)
● Books are not included in the database as a source for citations
● Non English journals● American journals
– the mean journal impact of American science was 30% above the world average
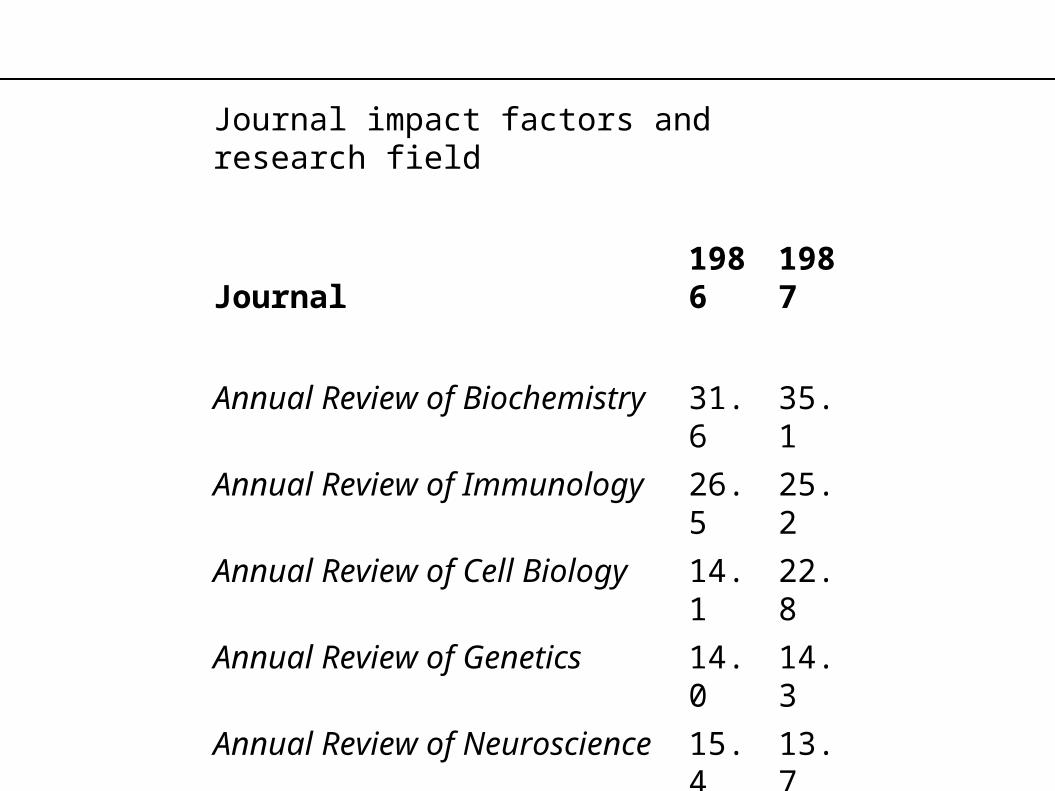
Journal impact factors and research field
Journal 1986 1987
Annual Review of Biochemistry 31.6 35.1
Annual Review of Immunology 26.5 25.2
Annual Review of Cell Biology 14.1 22.8
Annual Review of Genetics 14.0 14.3
Annual Review of Neuroscience 15.4 13.7
Annual Review of Pharmacology 10.1 9.9
Annual Review of Physiology 7.8 9.1
Annual Review of Biophysics 7.2 7.7
Annual Review of Microbiology 4.9 6.4

Field correction factors
• e.g. the article’s citation rate/the impact factor of the journal
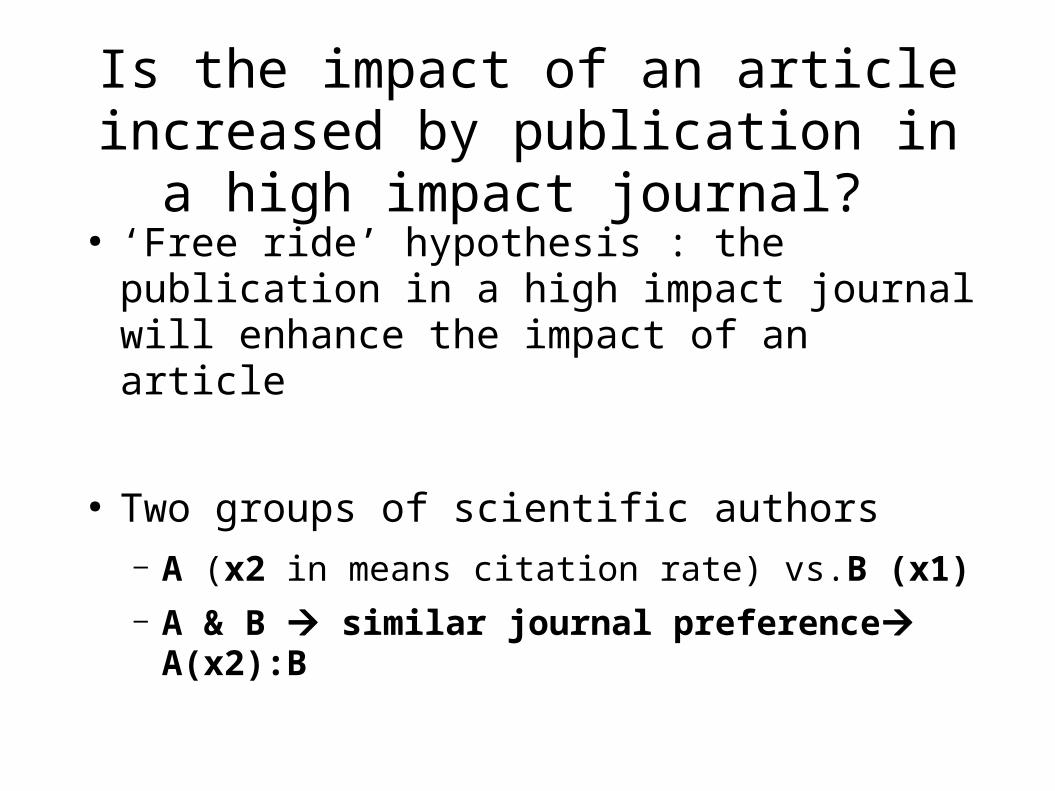
Is the impact of an article increased by publication in a high impa
ct journal? ● ‘Free ride’ hypothesis : the publication
in a high impact journal will enhance the impact of an article
● Two groups of scientific authors– A (x2 in means citation rate) vs.B (x1)– A & B similar journal preference
A(x2):B
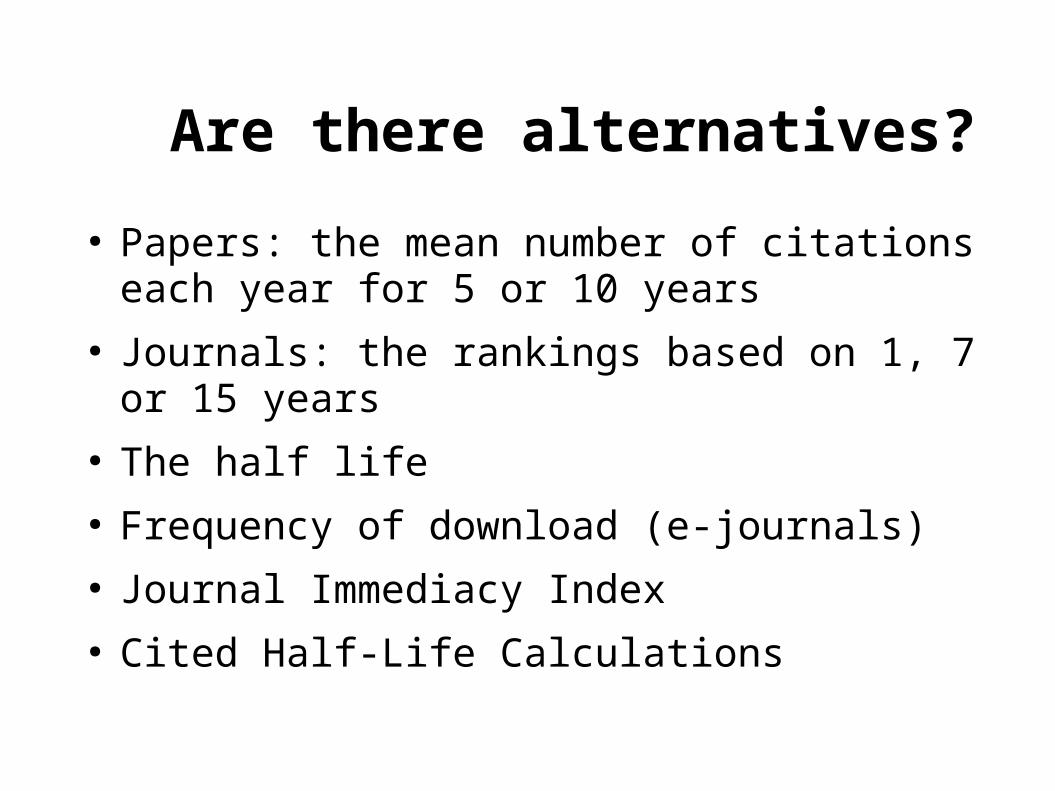
Are there alternatives?
● Papers: the mean number of citations each year for 5 or 10 years
● Journals: the rankings based on 1, 7 or 15 years
● The half life● Frequency of download (e-journals)● Journal Immediacy Index● Cited Half-Life Calculations

Breakdown of the citations to the journal by the cumulative percent of 2005 cites to articles published in the following years:
Cited Half-Life: 5.2 years
CitedYear
2005 2004 2003 2002 2001 2000 1999 1998 1997 1996 1995-all
# Cites from 2005
41 118 134 93 114 69 111 54 38 39 212
Cumulative %
4.01 15.54 28.64 37.73 48.88 55.62 66.47 71.75 75.46 79.28 100

Back to the basic
● Research Readers Users Population (Patients)
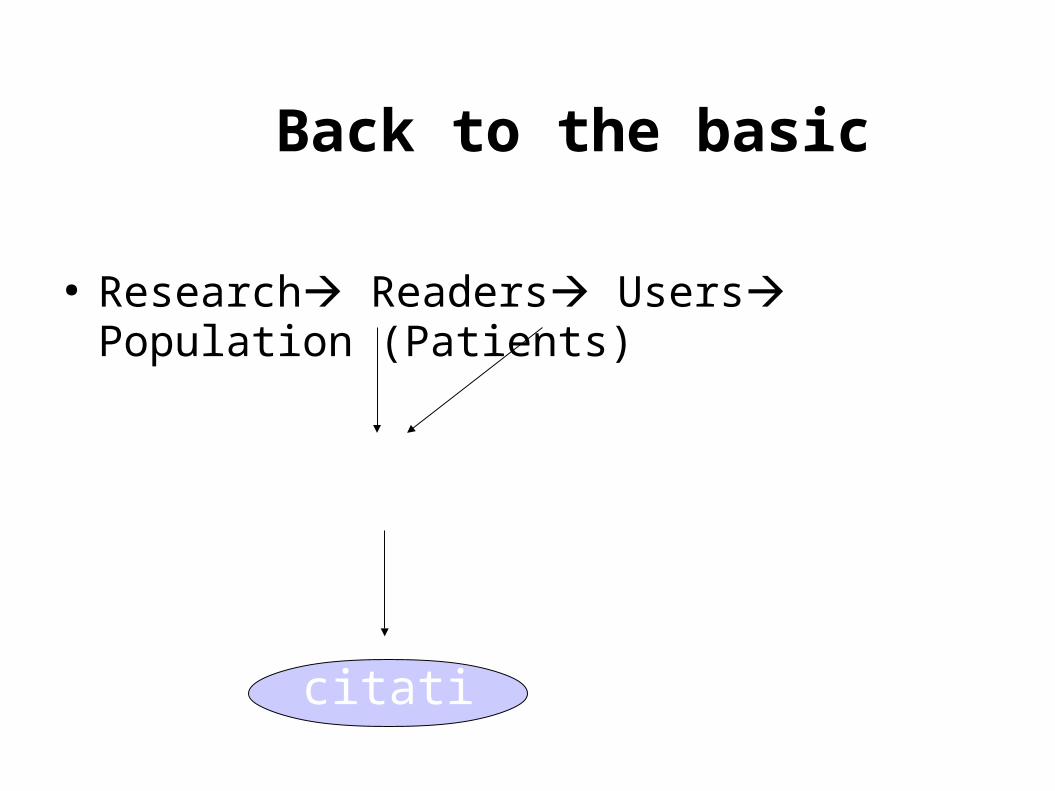
Back to the basic
● Research Readers Users Population (Patients)
research
citations

Back to the basic
● Other factors might influence the submission

E N D