Embed Size (px)
Citation preview

Impact Assessment of National andRegional Policies:An Application of the Philippine RegionalGeneral Equilibrium Model (PRGEM)
Roehl BrionesSenior Research Fellow, PIDSWith:
Ella Antonio (Brain Trust Inc.)Grace Borja Kristine Villarino, Matthew Sibayan, OrvhilCardenas (National Economic Development Authority)
6th CBMS Philippines National ConferenceDecember 8-10, 2009 Manila Diamond Hotel
What to expect
Overview of the issuesModel structure and dataScenarios and resultsImplications
Overview

Per capita realGDP index
Povertyincidence ofpopulation
(2006)
Agricultureshare in GDP in
% (2008)
Philippines 100 26.9 18NCR 251 7.1 0CAR 130 28.8 14Region X - Northern Mindanao 111 36.1 31Region VII - Central Visayas 99 30.3 10Region XI - Davao 96 30.6 26Region IVB - MIMAROPA 95 43.7 38Region VI - Western Visayas 94 31.1 25Region IVA - CALABARZON 91 16.7 19Region XII -SOCCSKSARGEN 81 33.8 43Region III - Central Luzon 76 16.8 24Region IX - ZamboangaPeninsula 70 40.2 49Region I - Ilocos 58 26.2 42Region II - Cagayan Valley 58 20.5 50CARAGA 51 45.5 34Region V - Bicol 48 41.8 31Region VIII - Eastern Visayas 48 40.7 34ARMM 19 55.3 58
Some regionalindicators
Development: regional dimension
Welfare disparities across regions Regions with lower income tend to
have higher poverty Economic structure varies across
regions Government moving towards
decentralization
Overview

Development: regional dimension
Geography raises marketing costsand inefficiency
Better infrastructure - faster growth Economywide policy:
Liberalization promotes dispersal ofmanufacturing
Remaining protection now skewedtowards domestic agriculture (rice, corn,sugar, meat)
Sources: Ordoñez and Associates (2005); Llanto (2007); Tecson(2007); David et al (2009)
Overview
Policy concerns
Decentralization and regionalization(“Super-regions”)
Need for agricultural modernization Trade liberalization Distribution of investments
(concentrate or disperse?) “Level playing field” by investing in
competitiveness

Objectives
Examine various scenarios oneconomywide and regional policies,related to: Removal of agricultural protection Investments in market integration
across regions
Discuss implications for the nationaland regional development strategy
Overview
Regional CGEs
Extends usual CGE to regionaloutcomes and regional shocks
Two approaches:- Top-down: ad hoc disaggregation –most
common- Bottom-up: better, but data-intensive
o PRGEM is bottom-up
Overview

Sectors
Cereals Livestock and Poultry Fisheries Other agriculture Agro-processing Other industry Trade, Transport and Storage Services Other services
Model structure and data
Regions
Leading region: Metro Luzon: NCR,Southern Tagalog, Central Luzon
Lagging regions: Other Luzon – rest of Luzon Visayas Mindanao
Model structure and data
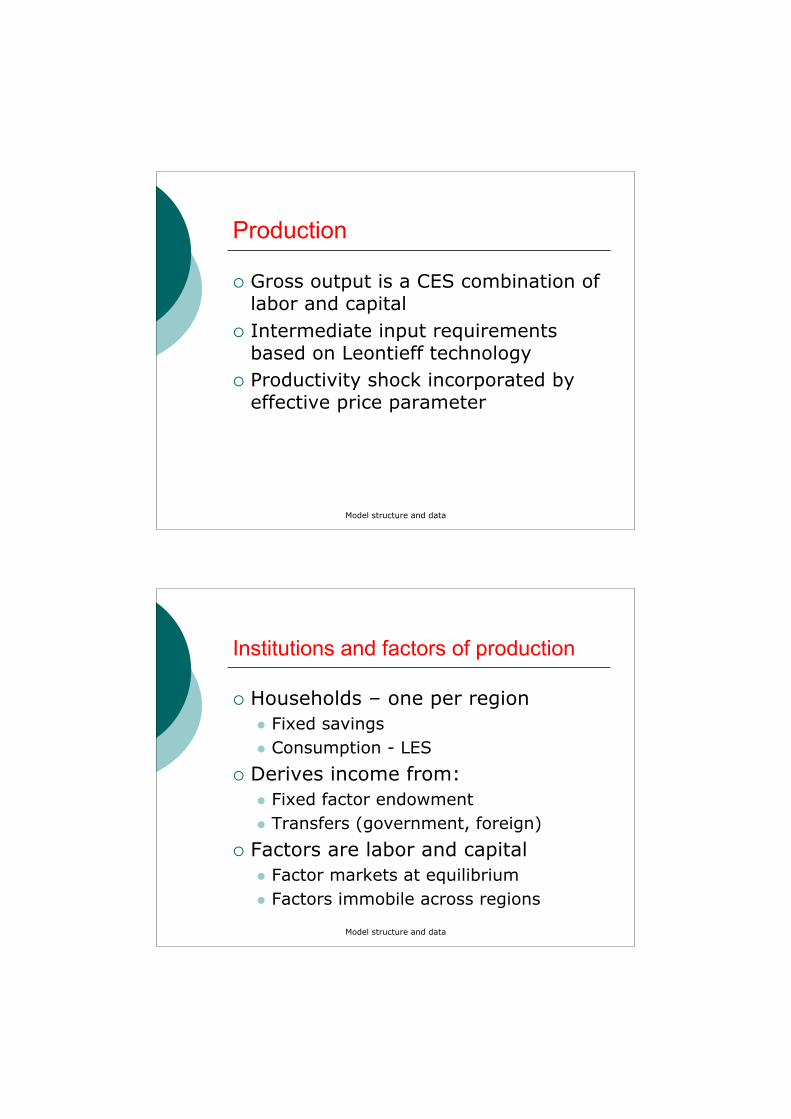
Production
Gross output is a CES combination oflabor and capital
Intermediate input requirementsbased on Leontieff technology
Productivity shock incorporated byeffective price parameter
Model structure and data
Institutions and factors of production
Households – one per region Fixed savings Consumption - LES
Derives income from: Fixed factor endowment Transfers (government, foreign)
Factors are labor and capital Factor markets at equilibrium Factors immobile across regions
Model structure and data

Institutions
Government – one per region Collects taxes (income, sales, imports) Fixed budget and spending shares Provides (receives) transfers
Firms – one per sector and region Intermediate input demand Investment demand (Dervis et al ‘82)
Total savings from HH, G, Foreign
Model structure and data
Interregional and international trade
,G RQD
, ,G RJ R
RJ
QDRR!
,G RQDT
,G RQDH
,G RQDRF
CES
,G RQDR
,G RQDF
, ,G R RJQDRR
, ,G R RJQDRR
CES
CES

Interregional and international trade
,G RQS
, ,G RJ R
RJ
QDRR!
,G RQST
,G RQSH
,G RQSF
CET
Model structure and data
PRGEM incorporates unittransaction costs in movinggoods across regions
Closure
Flexible exchange rate Factor endowment = factor demand By region: internal supply = internal
demand Normalized prices (fixed value of
CPI by region)
Model structure and data

Regional data set
1. National social accounting matrix(SAM)
2. Regional accounts3. Regional foreign trade and trade taxes4. Disaggregate GVA by sector and region5. Decompose GVA into factors and
indirect taxes6. Interregional trade data set
Model structure and data
Regional data
7. Aggregate regional SAM8. Step 8: regional SAM
Transaction cost computed fromunit ratios
Share allocation for initial sectordisaggregation by region
Balancing of SAM by adjustingintermediate inputs via RAS
Model structure and data

Scenarios
1. Reform: reduce agriculture sectortariffs to 5%
Catch-up: the following are appliedonly in lagging regions Shock unit transaction costs of
importing (-20%) Shock productivity in Trans (5%)
Scenarios and results
Scenarios
3. Concentration: apply the sameshocks in Catch-up, but only to theleading region
4. Reform with catch-up: combineCatch-up with Reform scenarios
Scenarios and results
Scenarios and results
Scenarios and results

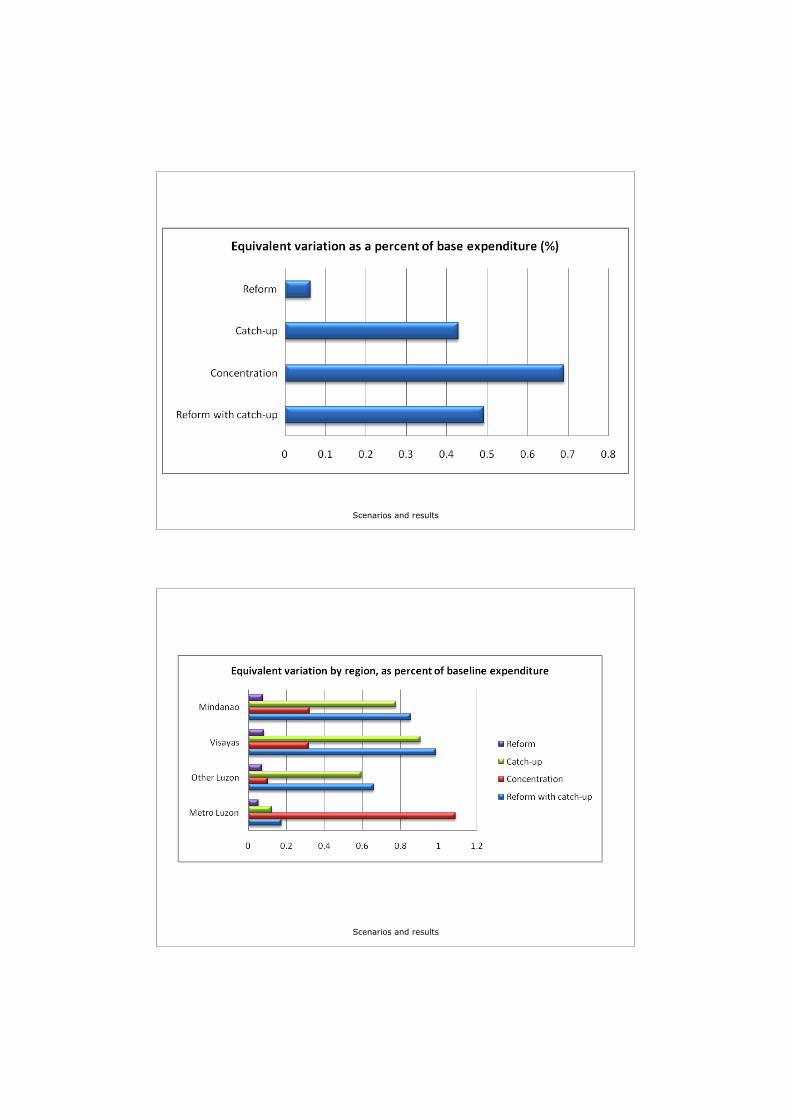
Results: Reform
Reform is beneficial across regions There is a trade-off between size and
distribution of welfare gain Concentration most beneficial Catch-up spreads benefits around
No additional welfare benefitsfrom combining investment withreform
Scenarios and results
Scenarios and results

Scenarios and results
Scenarios and results

Scenarios and results
Scenarios and results

Scenarios and results
Scenarios and results

Scenarios and results
Scenarios and results

Results
Reform: import expansion, esp. in agriculture Decline in import-competing sectors
Investment: Output of Trans responds most Other sectors mixed; even Concentration
can raise output outside Metro Luzon(some sectors)
Reform + catch-up additively combinesindividual scenarios
Scenarios and results
Implications
Proceed with tariff reform given householdbenefits, even for the lagging regions.However, the scope for further welfareimprovement is limited.
Given considerable scope for welfare gain,promote improvements in productivity andmarket integration.
Confront the trade-off between size anddistribution of gains is a big issue intargeting investments.
Implications
Implications
Can mitigate contractionary impacts fromtariff reform by expansionary effects frominvestment in productivity and integration.
But - no welfare “synergies” from doingboth reform and investment.
Reform need not be delayed by of absenceof sector or regional competitivenessinvestments – unless distributional impactsare paramount
Implications