Embed Size (px)
Citation preview
REGIONAL ECONOMIC IMPACT OF TEXAS MOTOR SPEEDWAY:
A SIMULATION
Laura E. Rattner, B.B.A.
Problem in Lieu of Thesis Prepared for the Degree of
MASTER OF SCIENCE
UNIVERSITY OF NORTH TEXAS
August 2000
APPROVED:
Terry Clower, Major Professor and GraduateAdvisor
Bernard Weinstein, Department ChairDavid W. Hartman, Dean of the School of
Community ServiceC. Neal Tate, Dean of the Robert B. Toulouse
School of Graduate Studies
Rattner, Laura E., Regional economic impact of Texas Motor Speedway: a
simulation. Master of Science (Applied Economics), August 2000, 29 pp., 7 tables,
reference list, 24 titles.
This study proposes a method for measuring the regional economic impact of a
relatively new sport: stock car racing. Although research on the economic impact of most
major league sports is abundant, little has been written on stock car racing. The purpose
of this paper is to estimate, through a simulation, the regional economic impact of Texas
Motor Speedway.
The study finds that the Texas Motor Speedway boosted regional economic
activity by $87,179,367 in 1998 from racetrack operations, and supported 5,300 jobs
paying $22,293,135 in earnings. In addition, expenditures by speedway visitor from
outside the region are estimated at $ 22,985,200, futher increasing total local economic
activity by $49 million.
ii
TABLE OF CONTENTS
Page
LIST OF TABLES................................................................................................... iii
Chapter
I. INTRODUCTION.......................................................................................... 1
II. THE NASCAR BUSINESS........................................................................... 4
A Brief HistoryWhat Makes NASCAR so Successful?The Business Side of the Sport
III. LITERATURE REVIEW............................................................................. 12
IV. METHODOLOGY ...................................................................................... 15
Regional Input-Output Modeling SystemMultipliers
V. DATA ANALYSIS....................................................................................... 17
Texas Motor SpeedwaySimulation AssumptionsEstimated Impact
VI. CONCLUSION ........................................................................................... 24
REFERENCE LIST................................................................................................. 27
iii
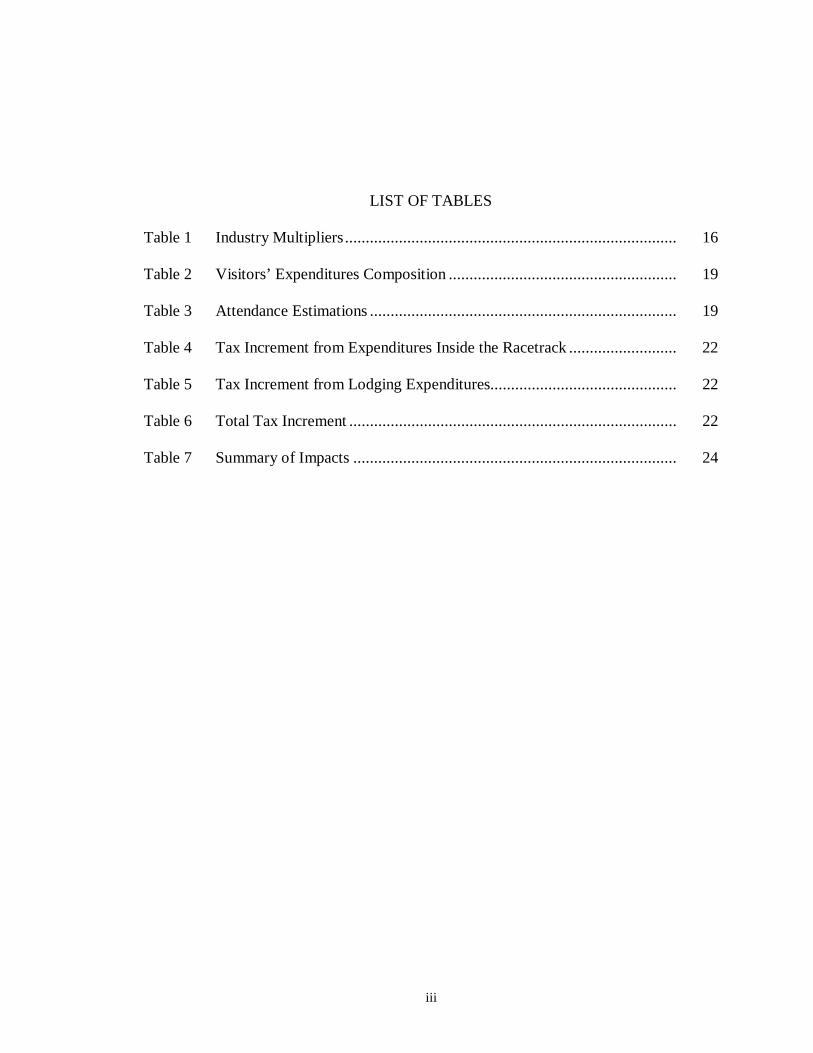
LIST OF TABLES
Table 1 Industry Multipliers................................................................................ 16
Table 2 Visitors’ Expenditures Composition ....................................................... 19
Table 3 Attendance Estimations .......................................................................... 19
Table 4 Tax Increment from Expenditures Inside the Racetrack.......................... 22
Table 5 Tax Increment from Lodging Expenditures............................................. 22
Table 6 Total Tax Increment ............................................................................... 22
Table 7 Summary of Impacts .............................................................................. 24
1
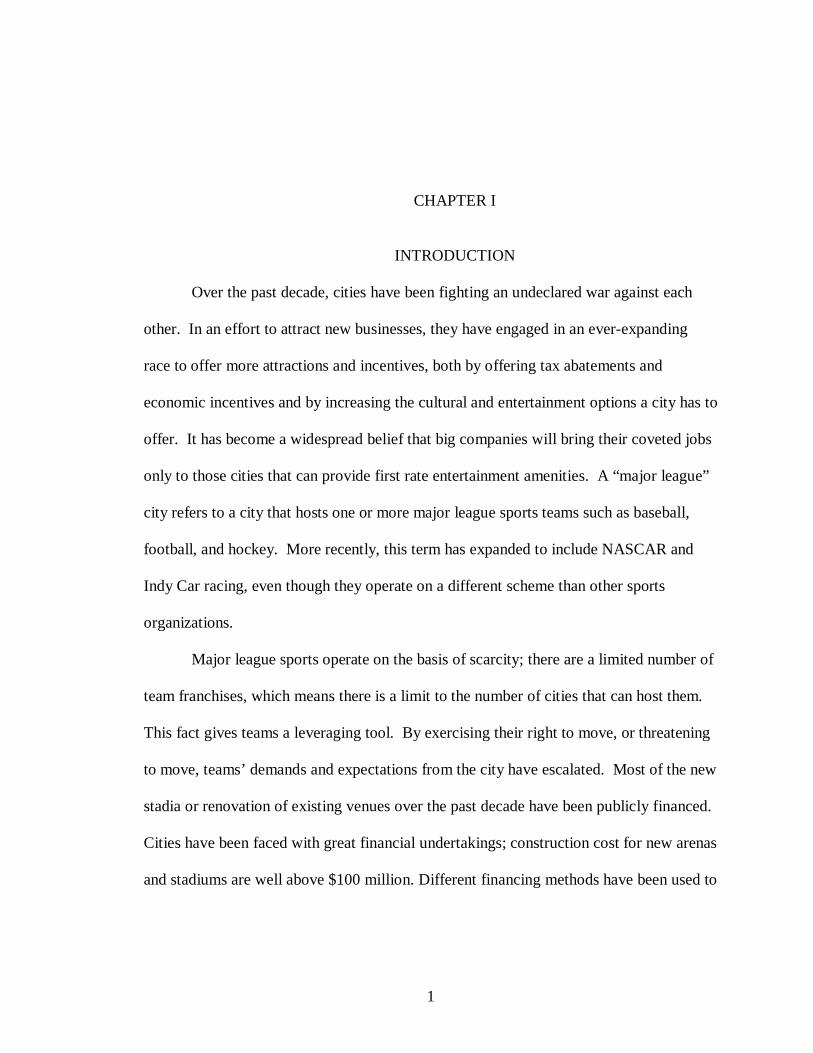
CHAPTER I
INTRODUCTION
Over the past decade, cities have been fighting an undeclared war against each
other. In an effort to attract new businesses, they have engaged in an ever-expanding
race to offer more attractions and incentives, both by offering tax abatements and
economic incentives and by increasing the cultural and entertainment options a city has to
offer. It has become a widespread belief that big companies will bring their coveted jobs
only to those cities that can provide first rate entertainment amenities. A “major league”
city refers to a city that hosts one or more major league sports teams such as baseball,
football, and hockey. More recently, this term has expanded to include NASCAR and
Indy Car racing, even though they operate on a different scheme than other sports
organizations.
Major league sports operate on the basis of scarcity; there are a limited number of
team franchises, which means there is a limit to the number of cities that can host them.
This fact gives teams a leveraging tool. By exercising their right to move, or threatening
to move, teams’ demands and expectations from the city have escalated. Most of the new
stadia or renovation of existing venues over the past decade have been publicly financed.
Cities have been faced with great financial undertakings; construction cost for new arenas
and stadiums are well above $100 million. Different financing methods have been used to
2
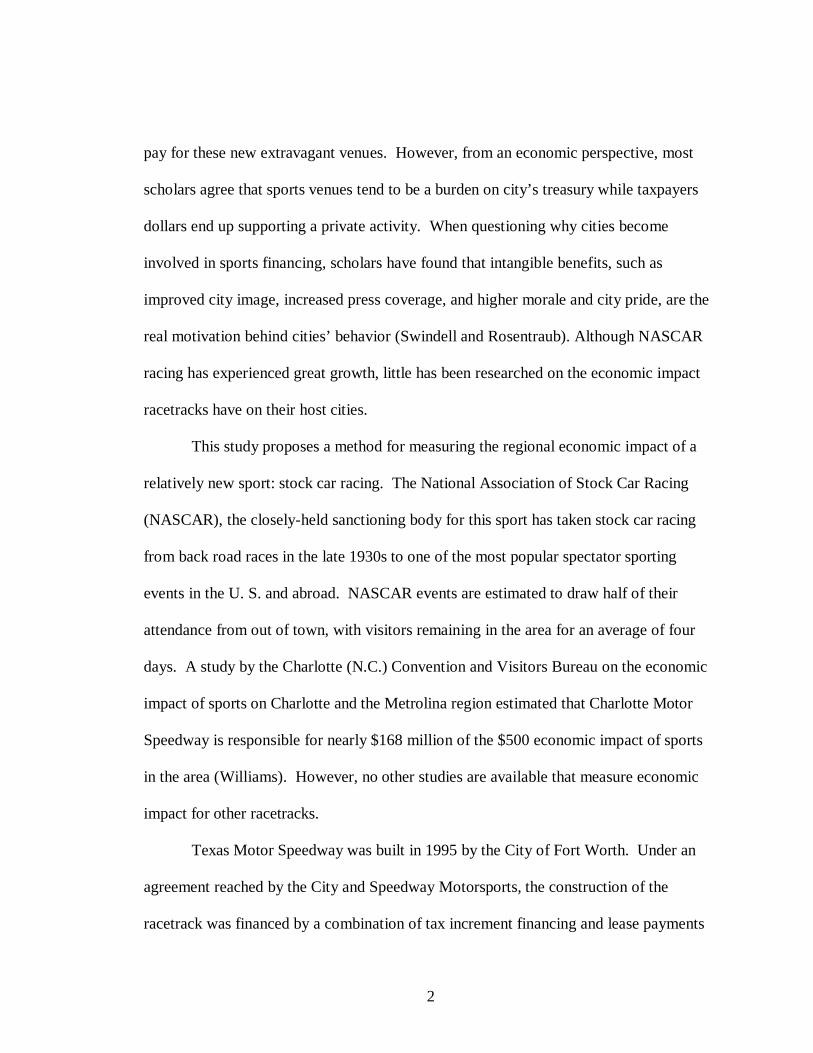
pay for these new extravagant venues. However, from an economic perspective, most
scholars agree that sports venues tend to be a burden on city’s treasury while taxpayers
dollars end up supporting a private activity. When questioning why cities become
involved in sports financing, scholars have found that intangible benefits, such as
improved city image, increased press coverage, and higher morale and city pride, are the
real motivation behind cities’ behavior (Swindell and Rosentraub). Although NASCAR
racing has experienced great growth, little has been researched on the economic impact
racetracks have on their host cities.
This study proposes a method for measuring the regional economic impact of a
relatively new sport: stock car racing. The National Association of Stock Car Racing
(NASCAR), the closely-held sanctioning body for this sport has taken stock car racing
from back road races in the late 1930s to one of the most popular spectator sporting
events in the U. S. and abroad. NASCAR events are estimated to draw half of their
attendance from out of town, with visitors remaining in the area for an average of four
days. A study by the Charlotte (N.C.) Convention and Visitors Bureau on the economic
impact of sports on Charlotte and the Metrolina region estimated that Charlotte Motor
Speedway is responsible for nearly $168 million of the $500 economic impact of sports
in the area (Williams). However, no other studies are available that measure economic
impact for other racetracks.
Texas Motor Speedway was built in 1995 by the City of Fort Worth. Under an
agreement reached by the City and Speedway Motorsports, the construction of the
racetrack was financed by a combination of tax increment financing and lease payments
3
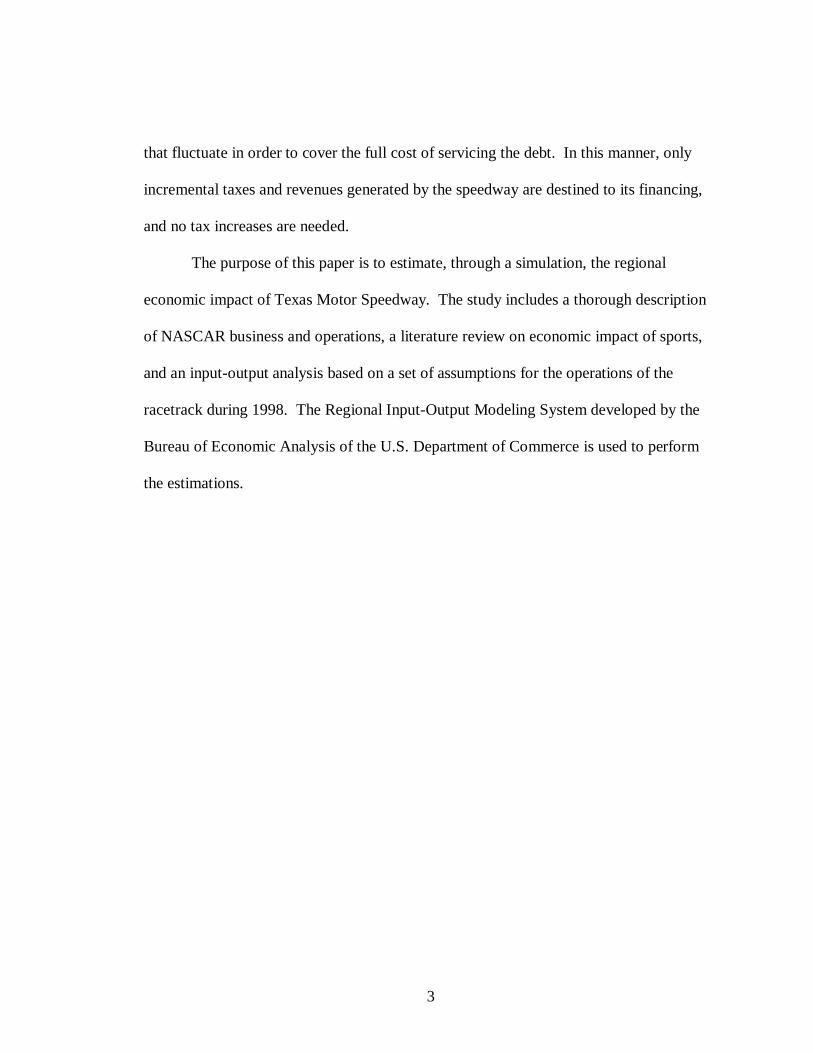
that fluctuate in order to cover the full cost of servicing the debt. In this manner, only
incremental taxes and revenues generated by the speedway are destined to its financing,
and no tax increases are needed.
The purpose of this paper is to estimate, through a simulation, the regional
economic impact of Texas Motor Speedway. The study includes a thorough description
of NASCAR business and operations, a literature review on economic impact of sports,
and an input-output analysis based on a set of assumptions for the operations of the
racetrack during 1998. The Regional Input-Output Modeling System developed by the
Bureau of Economic Analysis of the U.S. Department of Commerce is used to perform
the estimations.
4
CHAPTER II
THE NASCAR BUSINESS
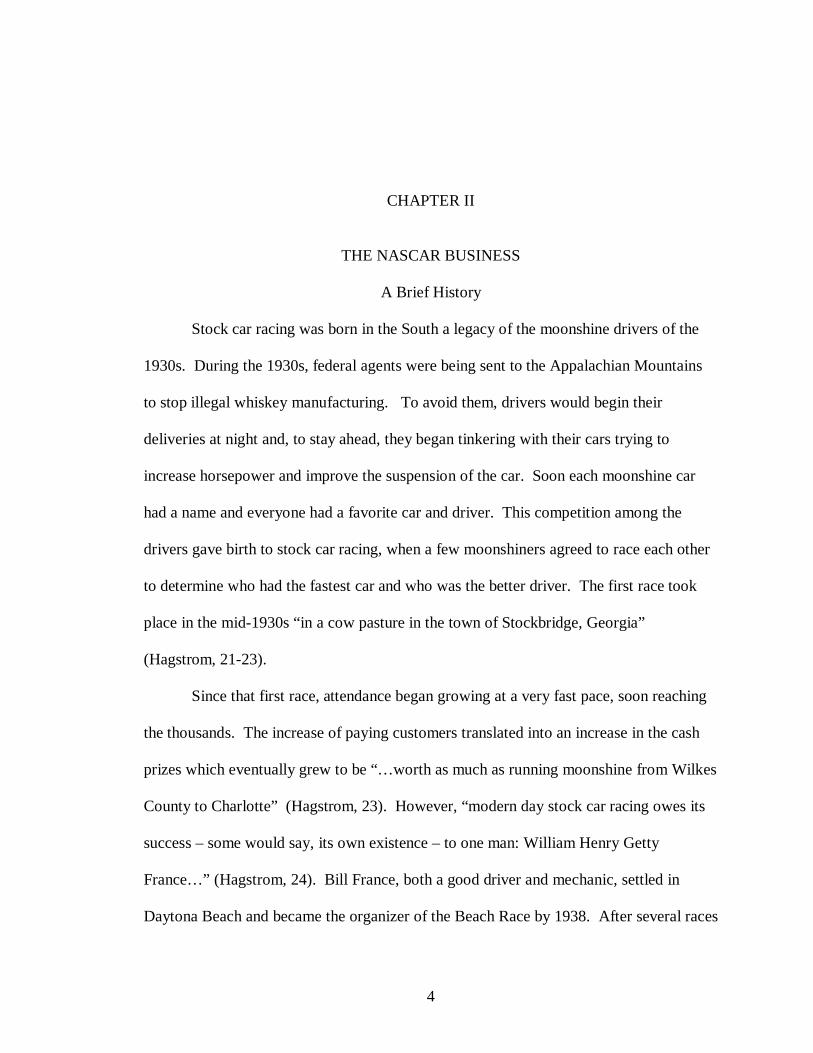
A Brief History
Stock car racing was born in the South a legacy of the moonshine drivers of the
1930s. During the 1930s, federal agents were being sent to the Appalachian Mountains
to stop illegal whiskey manufacturing. To avoid them, drivers would begin their
deliveries at night and, to stay ahead, they began tinkering with their cars trying to
increase horsepower and improve the suspension of the car. Soon each moonshine car
had a name and everyone had a favorite car and driver. This competition among the
drivers gave birth to stock car racing, when a few moonshiners agreed to race each other
to determine who had the fastest car and who was the better driver. The first race took
place in the mid-1930s “in a cow pasture in the town of Stockbridge, Georgia”
(Hagstrom, 21-23).
Since that first race, attendance began growing at a very fast pace, soon reaching
the thousands. The increase of paying customers translated into an increase in the cash
prizes which eventually grew to be “…worth as much as running moonshine from Wilkes
County to Charlotte” (Hagstrom, 23). However, “modern day stock car racing owes its
success – some would say, its own existence – to one man: William Henry Getty
France…” (Hagstrom, 24). Bill France, both a good driver and mechanic, settled in
Daytona Beach and became the organizer of the Beach Race by 1938. After several races
5
and the end of World War II, he decided to organize a sanctioning body, the National
Championship Stock Car Circuit (NCSCC). It would sponsor races every month at
different locations, with a cumulative point system and winners’ fund. This organization
would eventually evolve into the National Association for Stock Car Auto Racing
(NASCAR). NASCAR was created to develop a unified set of rules and to set up a
national point system with only one car driver to be crowned National Champion.
France’s vision was to bring credibility and stability to the sport and promote a racing
division dedicated solely to standard street stock cars. NASCAR was officially
incorporated in February 15, 1948 and had, at the time, four investors. During the years,
the France family bought all the shares and it is now the sole owner of the corporation
(Hagstrom, 26-29).
Throughout the years, the France family has built on the original idea, creating
what NASCAR is today, an extremely successful business. Bill France’s sons increased
corporate sponsorship and convinced CBS to broadcast the first live race, the 1979
Daytona 500. Today ESPN devotes 460 hours a year to NASCAR events and there is
talk of a NASCAR channel (Sandomir). The final push in NASCAR’s success has
occurred in third France generation. They created the licensing program, placing the
NASCAR name on all kinds of products. Their latest project is to consolidate the
Winston Cup’s television broadcast rights, which is expected to quadruple revenues from
this source (Spiegel). The Winston Cup series is the most competitive and popular of the
NASCAR series, which includes 32 races and a system of cumulative points to determine
6
the series champion. The series is sponsored by RJR Reynolds Tobacco company,
makers of Winston cigarettes.
The growth of NASCAR has been tremendous. The organization currently
sanctions around 2,000 events each year within twelve separate divisions at more than
100 tracks located all throughout the country. NASCAR today has over 25,000 members,
and it has been estimated that, in 1996, 15,430,000 people attended the events while
130,000,000 watched them on TV (Hagstrom, 32). NASCAR’s business has evolved,
from stock car racing, into a complete entertainment business philosophy that includes
theme parks, restaurants and retail centers.
What Makes NASCAR so successful?
NASCAR’s success can be explained with just one word: Sponsorship.
According to Lindsey Young, what sets NASCAR apart from other professional sports is
the relationship and balance among the sport, its fans and the corporate sponsor. Not
only has attendance and number of fans increased exponentially over the years;
NASCAR fans are extremely loyal to their favorite driver’s sponsors. A study conducted
by Performance Research found that stock-car fans are very aware of who sponsors their
sport. “When polled, fans were 99 percent correct in matching driver and sponsor”
(Young). The study also reported that three out of four fans consciously purchase
products of sponsors and that over 40 percent of NASCAR fans purposely switched
brands when a manufacturer became a NASCAR sponsor.
In order to increase sponsor’s return and create stronger financial foundation for
drivers, teams, and tracks, NASCAR uses integrated marketing. This acts as a facilitator,
7
setting up linkages among prospective sponsors and teams, tracks and drivers.
Advertisers’ support is derived from consumer power. “Fans are not only increasingly
fanatical, they are also increasingly female, with almost half of attendees and spectators
women” (Economaki). To illustrate the returns generated by NASCAR sponsorship,
Mike Martin, Dr. Pepper/Seven Up spokesman, indicated that despite their racing team’s
poor record in 1998, the company recouped the investment in primary sponsorship of
NASCAR cars “and teams are seven figures and up, so we’re talking significant
investment” and returns (Holleran).
The number of fans and their demographic characteristics have increasingly been
attracting sponsorship from a very varied set of products, from cigarettes to soft drinks
and household items. Another characteristic that makes sponsorship so attractive is the
abundance of opportunities and a very affordable and flexible sponsorship make up.
Each racing division offers companies different economic levels in which to participate.
Furthermore, there is a wide range of options within each series, from naming a race or
circuit after the product to a simple mention in the race program (Hagstrom, 61-71).
The Business Side of the Sport
There are several players in the business behind the sport of stock car racing:
NASCAR, the teams, and the track owners. The teams’ operations are both complicated
and very expensive. To compete in the Winston Cup series requires a fast car, a capable
driver, and a responsive crew. The team owner bears all the financial risk. The
administrative side of the operations is in the hands of the team manager and includes
secretarial, clerical and accounting duties, as well as public relations. The race shop
8
operations are run by the crew chief and involve all technical matters, from building the
car to monitoring its performance and testing. Finally, there are the race-day operations.
The crew chief is still in charge, planning the race strategy, pit stops, and coordinating the
crew. Putting all the divisions together, a NASCAR Winston Cup team includes between
twenty and thirty people (Hagstrom, 162-165).
Racetracks are owned and operated by individuals or corporations, not by
NASCAR. The first step in building a racetrack, once the location has been selected, is
to enlist local officials. City government needs to understand not only the economic
impact the project will bring to the community but also the infrastructure requirements.
In the case of Texas Motor Speedway, located on Interstate 35 in the outskirts of the City
of Fort Worth, it implies the mobilization and accommodation of 200,000 fans. The cost
of building a track that can hold at least 100,000 fans is over $100 million. Reportedly,
Texas Motor Speedway cost between $120 and $140 million (Hagstrom, 116-120).
Operating a racetrack involves the organization of a wide range of events other
than races, such as auto shows, car auctions, driving schools, and concerts. However, the
primary business is to promote races. There are several sources of revenue for the track
owners, the most relevant are:
• General admission and luxury suites: ticket prices vary, depending on the event,
the type of accommodation and the track. The options range from a seat in the
grandstands, luxurious air-conditioned suites, or the infield. Suites are usually
leased on a yearly basis and contain between 40 and 100 seats. Admission
revenues also include tickets for parking and camping in the infield. For the first
9
Winston Cup race in Texas Motor Speedway, infield tickets sold at $50 each and
the grandstand seats at prices ranging from $5 to $80. Luxury suites were priced
between $65,000 and $100,000. These sources account for almost 70 percent of
the track’s revenue.
• Television and radio broadcast fees: can contribute almost 10 percent of the
track’s revenue. Each racetrack negotiates its own deal with broadcasters, passing
along a percentage to NASCAR. Reportedly, TV broadcasting fees for the first
race at Texas Motor Speedway were $4 million.
• Sponsorship fees and advertising: racetracks have abundant opportunities for
sponsorship and advertising, including signage and race programs. These account
for about 10 percent of the track’s revenue.
• Concession, program, and merchandise sales: food and beverage concessions and
souvenir sales, such as T-shirts and caps, generate about 5 percent of the track’s
revenue.
• Hospitality tents and souvenir trailers: hospitality tents are rented by corporations
in order to entertain guests, both customers and employees. There is usually a
souvenir trailer per team and/or driver located on the property surrounding the
track. The rental fee can be up to $5,000 a day, and sometimes also sign over a
percentage of their souvenir sales. Together, these produce about 5 percent of the
track’s revenue.
There are only three major expense categories for racetrack owners: sanctioning
fee, prize money, and operating costs. About 75 percent of the owner’s expense is
10
directed toward prize money and sanctioning fees. Sanctioning fees vary, depending on
the size of the track and the event, larger speedways may spend up to $500,000. The
prize money comprises the race purse, television awards, and qualifying and special
awards. The race purse is a track expense that comes from ticket sales and concession
profits and is set by the track’s owner. Television awards are also an expense of the
track’s owner and represents 25 percent of the television broadcast rights. The qualifying
and special awards are paid by sponsors.
“Although NASCAR manages the race itself, the track owner is responsible for
everything beyond the racetrack walls, including adequate parking space an getting the
fans smoothly into and out of the track ground” (Hagstrom, 113). On average, the ratio
of employees to fans is 1 to 75 on a race day. Operating costs represent about 25 percent
of the track’s total expenses. Overall, a major Winston Cup race held at a facility such as
Texas Motor Speedway generates around $10 million in revenue. “Direct expenses total
approximately $5 to $6 million (…) it is not unusual for a racetrack to generate 50 to 60
percent operating margins, with net margins of 30 to 40 percent” (Hagstrom, 115).
Obtaining one of the much-coveted Winston Cup race dates is the major challenge
facing a new racetrack. The series has only 32 races and it is not likely that the number
will increase. In the case of Texas Motor Speedway, the racetrack “secured its April race
only by acquiring a smaller track and moving the event” (Anderson Forest). The
scheduling decision is in the hands of just one person, Bill France, Jr. However, the
Winston Cup schedule does not change much, it is mostly based on tradition and loyalty.

11
Overall, the business of operating a racetrack can be very profitable. Even with
only one Winston Cup race, a speedway can realize profits. It all depends on the
expertise of the operator and a number of alternative uses that can keep the racetrack
booked throughout the year.
12
CHAPTER III
LITERATURE REVIEW
Much has been written and researched about sports and their impact on local and
regional economies. The following is a summary of the main points found throughout
most of the literature. The arguments traditionally set forth in favor of public funding for
construction of sports venues are invariably repeated in all the consulted works.
Proponents of sports argue that the stadium or arena will generate economic growth
through high levels of new spending, create large number of jobs directly and indirectly,
revitalize declining central business districts, change land use patterns, and enhance the
image and overall economic development of the city. Furthermore, the intangible
benefits of civic pride and morale boosting also make up the argument (Swindell and
Rosentraub, Owen and Beitsch, Noll and Zimbalist, Bain).
However, extensive research has shown that most of these arguments are
somewhat specious. Economists argue that expenditures by fans are merely a transfer of
discretionary dollars. In his book “Major League Losers”, Mark Rosentraub explains:
“Suppose you go to a Texas Ranger (…) game. In addition to your ticket, whatelse are you likely to buy? Well, you might have lunch or dinner or buy somerefreshments at the game. You might pay for parking at the game, and you mighteven buy a souvenir. Now, suppose you don’t go to the game. What are youlikely to do instead? You will probably still eat lunch or dinner, so thatexpenditure of a meal purchased before or after the game still takes place.Suppose you also decided to go to the movies instead of the ball game, or to see ashow. There would still be a ticket purchase, so that spending on your (…)Ranger ticket is not additional spending. What about those souvenirs? Well, thatmight be additional spending, but if you buy an Oriole shirt instead of a shirt at a
13
mall later that week, then your souvenir is not new spending either. Whateconomic impact was created if you attended the game instead of a movie?” (154)
In short, economic activity is not the same as economic impact, and benefits are
meaningful only if they are incremental to the local economy. New spending brings
positive economic impact and that can be achieved in only two ways: people from outside
the area attending the events or people from the area who decide to stay instead of
attending an event elsewhere (Swindell and Rosentraub, Rosentraub, Owen and Beitsch).
It has also been proved that even with the presence of a sports venue, growth
occurs elsewhere and the distribution of jobs is unaffected as well (Owen and Beitsch).
Furthermore it has been shown that teams are relatively small business and could not
possibly become the economic engines they are portrayed. Swindell and Rosentraub
make the case that neither the teams nor the facilities they use are a source of meaningful
economic development. However, all studies agree there are intangible benefits to the
city.
Swindell and Rosentraub conducted a study with the intent to measure the extent
of these benefits. In a survey of randomly selected households in Indianapolis, the
authors learned that sports teams were clearly critical in establishing the sense of pride
respondents had in living in Indianapolis. They also found there was a positive
relationship between the times an asset was used or event attended and how the person
regarded it in determining pride. Interestingly, when measuring what venue brought the
most international prestige to the city, auto racing was first, as well as it was the first
reason for out of town visitors.
14
A word of warning is found throughout the literature when the venues are
publicly sponsored and the government becomes a necessary player in order to attract
and/or retain a team or event in the city. On one extreme, proponents of sports emphasize
the intangible benefits the city and its citizens derive from it as justification for
government financing. On the other extreme, it has been argued that sports are not public
goods and therefore should not be financed by government (Swindell and Rosentraub).
Furthermore, Black and Pape argue that if the business of building and operating sports
venues were profitable, it would be privately funded. They also point out that several
input-output analyses fail to recognize the costs incurred by the government, and
ultimately the taxpayers, in generating the benefits of additional spending.
A middle-ground position is also found in the literature. Howard and Crompton
find that there can be justification for investing public resources in sports venues. They
focus on the intangible benefits of increased pride and city image, media exposure, and
the possible stimulation of other development (35-47). Some agreements between cities
and teams can be financially sound for the city, without necessarily imposing an
incremental burden on taxpayers. In sum, many of the benefits are intangible and their
value cannot be measured in monetary terms. “In essence, proponents of such facilities
place a very high subjective value on the external benefits derived from the facility, while
opponents do not” (Noll, 327).
15
CHAPTER IV
METHODOLOGY
The methodology used in an economic impact analysis of the scope of the present
one is limited and determined by the data availability and its level of detail. The more
complete the set of data, the more methods available to analyze it. Given the lack of data
available for this study, the methodology chosen to estimate the regional economic
impact of the Texas Motor Speedway in the Dallas/ Fort Worth area is the Regional
Input-Output Modeling System.
Regional Input-Output Modeling System
The Regional Input-Output Modeling System was developed by the Bureau of
Economic Analysis in the 1970’s as a method for estimating regional Input-Output
multipliers, and improved into RIMS II in the 1980’s. Its third edition is based on data
for 1987. There are several advantages to using RIMS II multipliers for impact analyses:
RIMS II multipliers can be estimated for any region composed of one or more counties
and for any industry or group of industries, its cost is relatively low, and the resulting
estimates have been shown to be consistent with more time-consuming and expensive
methodologies (Handbook).
RIMS II provides users with five types of multipliers: final demand multipliers for
output, earnings, and employment and direct effect multipliers for earnings and
employment. For the scope of the present study, a generalized model of final demand
16
multipliers will be used, while direct effect multipliers will also be applied to
employment and earnings. Given the limitation of the data, earnings generated by Texas
Motor Speedway will be used in the estimation of the final demand impact. Following
the methodology described in the RIMS II Handbook, three steps are employed. First,
the change in earnings per dollar of final demand is calculated, by dividing the final-
demand multiplier for earnings by the direct-effect multiplier for earnings. Second, the
change in final demand is estimated by dividing the change in earnings by the previously
calculated change in earnings per dollar of final demand. Finally, the final-demand
output multiplier is applied to the change in final demand to yield the impact on output
(Handbook).
Multipliers
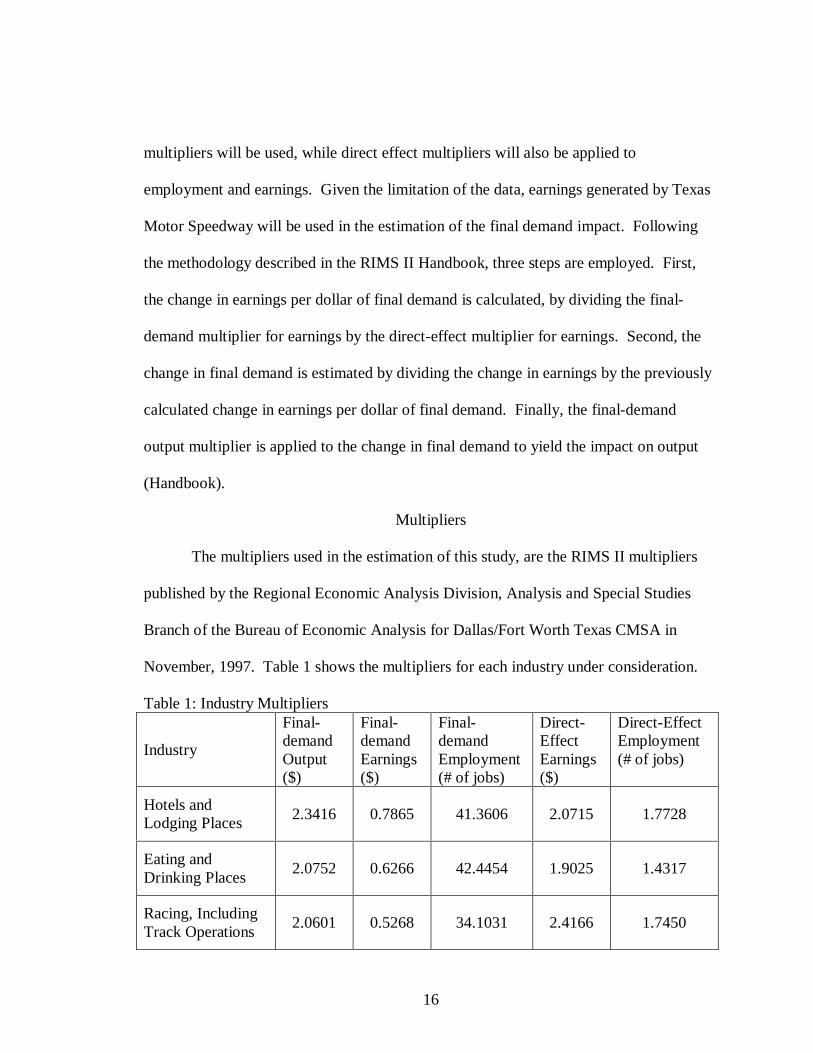
The multipliers used in the estimation of this study, are the RIMS II multipliers
published by the Regional Economic Analysis Division, Analysis and Special Studies
Branch of the Bureau of Economic Analysis for Dallas/Fort Worth Texas CMSA in
November, 1997. Table 1 shows the multipliers for each industry under consideration.
Table 1: Industry Multipliers
Industry
Final-demandOutput($)
Final-demandEarnings($)
Final-demandEmployment(# of jobs)
Direct-EffectEarnings($)
Direct-EffectEmployment(# of jobs)
Hotels andLodging Places
2.3416 0.7865 41.3606 2.0715 1.7728
Eating andDrinking Places
2.0752 0.6266 42.4454 1.9025 1.4317
Racing, IncludingTrack Operations
2.0601 0.5268 34.1031 2.4166 1.7450
17
CHAPTER V
DATA ANALYSIS
Texas Motor Speedway
Texas Motor Speedway is the second largest sports facility in the US. The track
is an oval of 1.5 miles, with double banking at 24 and 8 degrees, which allow NASCAR
and Indy-style racing. Its first Winston Cup race was held on April 5, 1997. The
grandstands have permanent seating for 154,861 people, and the infield has a capacity of
approximately 53,000. Additionally, there are 194 luxury suites with aggregate seating
for 13,192. The complex is much more than just a racetrack; it also includes the Lil’
Texas Motor Speedway, a 1/5 mile oval track for Legends Car racing, a 4/10 mile oval
dirt track, with 15,000 permanent seats and 20 luxury suites, and a Drag Racing strip is
currently under construction.
In addition to the traditional structures found in racetracks, Texas Motor
Speedway counts with the Speedway Club and the Lone Star Tower. The Speedway
Club is a $30 million nine-story full-scale complex offering a state-of-the-art health club,
five-star private dining, and business conference facilities. It includes a 200-foot crystal
tower that overlooks the Speedway. The Lone Star Tower is a ten-story building located
above Turn Two. It contains office space for lease, which is located in the first through
the fourth levels. The 76 luxury condominiums are located on floors five
18
through ten and range in size from 1,000 to 2,000 square feet. They have all been sold at
prices ranging from $325,000 to over $500,000.
Texas Motor Speedway hosts night racing, utilizing a lighting system process
using mirrors to simulate daylight, without glare and shadows. Given the variety and
flexibility of its amenities, the facility is used nearly every day of the year for racing
schools, television commercial production, motion picture production, race introductions,
sales meetings, auto shows, Legends Car racing, car club meetings and, of course,
NASCAR and Indy racing. At present, the facility hosts only one Winston Cup race,
which is the biggest event in terms of revenue, attendance, and impact for the area.
The racetrack is a publicly financed venture. The City of Fort Worth, through its
sports authority, financed the construction of the $107 million facility with a bond issue.
The agreement stipulates that Speedway Motorsports, Inc. would operate the facility.
The lease payments were set to be the difference between the amount generated by tax
increment financing and the cost of servicing the debt. The City would only finance the
construction of the racetrack and probably a future seating expansion. Any other
improvements, such as the Lone Star Tower, would have to be privately financed. The
facility was granted a property tax exemption; however the operator still pays taxes on
the lease value and the condos and office building is not included in the exemption.
Simulation Assumptions
In order to perform the present simulation, several assumptions were made. The
purpose is to estimate the economic and fiscal impact the racetrack had during the 1998
year. The underlying assumptions are as follows:
19
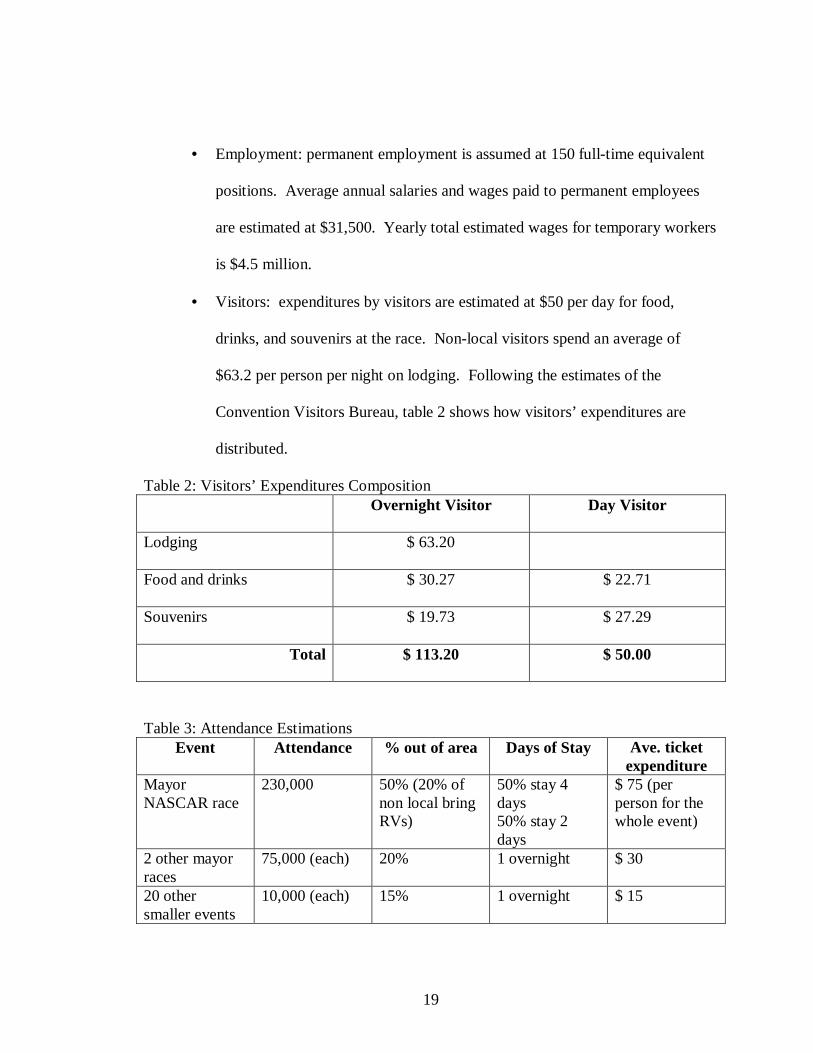
• Employment: permanent employment is assumed at 150 full-time equivalent
positions. Average annual salaries and wages paid to permanent employees
are estimated at $31,500. Yearly total estimated wages for temporary workers
is $4.5 million.
• Visitors: expenditures by visitors are estimated at $50 per day for food,
drinks, and souvenirs at the race. Non-local visitors spend an average of
$63.2 per person per night on lodging. Following the estimates of the
Convention Visitors Bureau, table 2 shows how visitors’ expenditures are
distributed.
Table 2: Visitors’ Expenditures CompositionOvernight Visitor Day Visitor
Lodging $ 63.20
Food and drinks $ 30.27 $ 22.71
Souvenirs $ 19.73 $ 27.29
Total $ 113.20 $ 50.00
Table 3: Attendance EstimationsEvent Attendance % out of area Days of Stay Ave. ticket
expenditureMayorNASCAR race
230,000 50% (20% ofnon local bringRVs)
50% stay 4days50% stay 2days
$ 75 (perperson for thewhole event)
2 other mayorraces
75,000 (each) 20% 1 overnight $ 30
20 othersmaller events
10,000 (each) 15% 1 overnight $ 15
20
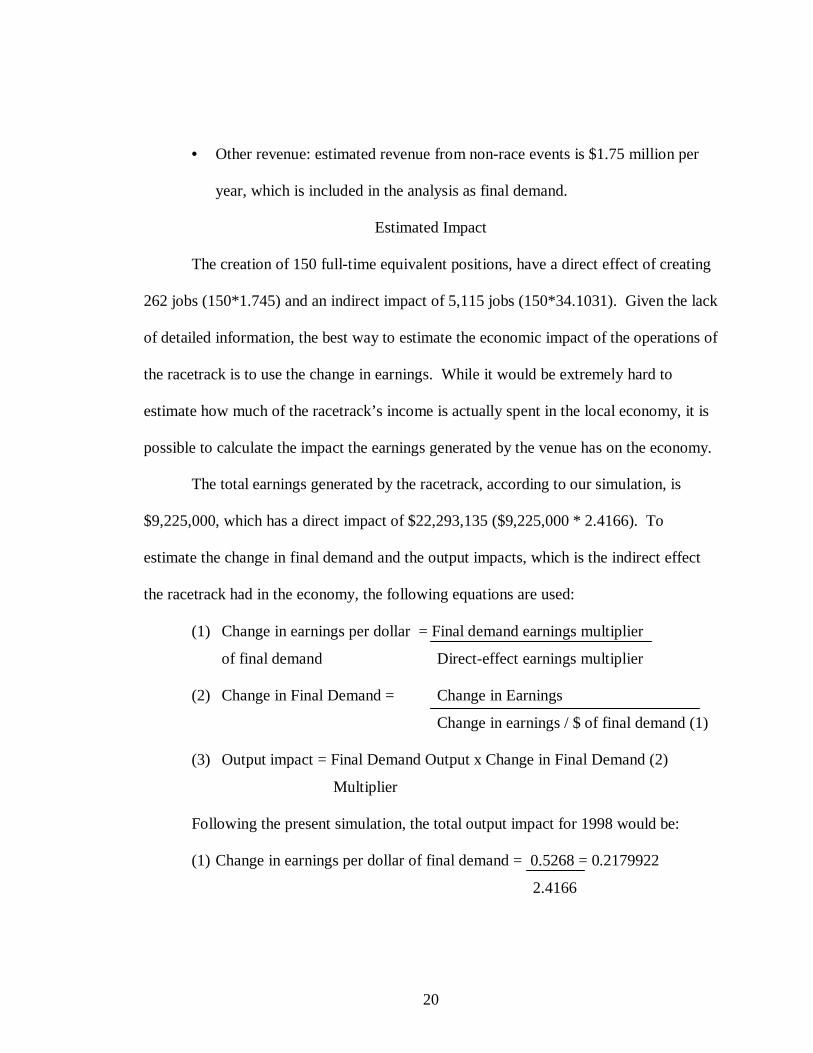
• Other revenue: estimated revenue from non-race events is $1.75 million per
year, which is included in the analysis as final demand.
Estimated Impact
The creation of 150 full-time equivalent positions, have a direct effect of creating
262 jobs (150*1.745) and an indirect impact of 5,115 jobs (150*34.1031). Given the lack
of detailed information, the best way to estimate the economic impact of the operations of
the racetrack is to use the change in earnings. While it would be extremely hard to
estimate how much of the racetrack’s income is actually spent in the local economy, it is
possible to calculate the impact the earnings generated by the venue has on the economy.
The total earnings generated by the racetrack, according to our simulation, is
$9,225,000, which has a direct impact of $22,293,135 ($9,225,000 * 2.4166). To
estimate the change in final demand and the output impacts, which is the indirect effect
the racetrack had in the economy, the following equations are used:
(1) Change in earnings per dollar = Final demand earnings multiplier
of final demand Direct-effect earnings multiplier
(2) Change in Final Demand = Change in Earnings
Change in earnings / $ of final demand (1)
(3) Output impact = Final Demand Output x Change in Final Demand (2)
Multiplier
Following the present simulation, the total output impact for 1998 would be:
(1) Change in earnings per dollar of final demand = 0.5268 = 0.2179922
2.4166
21
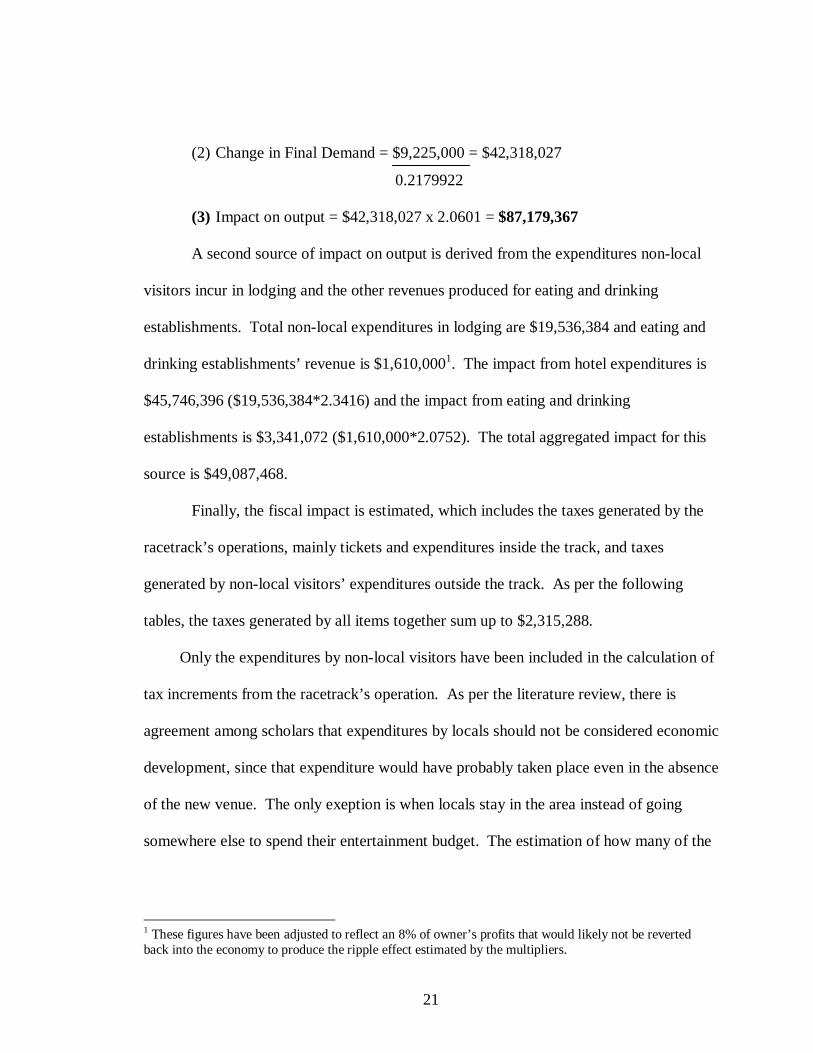
(2) Change in Final Demand = $9,225,000 = $42,318,027
0.2179922
(3) Impact on output = $42,318,027 x 2.0601 = $87,179,367
A second source of impact on output is derived from the expenditures non-local
visitors incur in lodging and the other revenues produced for eating and drinking
establishments. Total non-local expenditures in lodging are $19,536,384 and eating and
drinking establishments’ revenue is $1,610,0001. The impact from hotel expenditures is
$45,746,396 ($19,536,384*2.3416) and the impact from eating and drinking
establishments is $3,341,072 ($1,610,000*2.0752). The total aggregated impact for this
source is $49,087,468.
Finally, the fiscal impact is estimated, which includes the taxes generated by the
racetrack’s operations, mainly tickets and expenditures inside the track, and taxes
generated by non-local visitors’ expenditures outside the track. As per the following
tables, the taxes generated by all items together sum up to $2,315,288.
Only the expenditures by non-local visitors have been included in the calculation of
tax increments from the racetrack’s operation. As per the literature review, there is
agreement among scholars that expenditures by locals should not be considered economic
development, since that expenditure would have probably taken place even in the absence
of the new venue. The only exeption is when locals stay in the area instead of going
somewhere else to spend their entertainment budget. The estimation of how many of the
1 These figures have been adjusted to reflect an 8% of owner’s profits that would likely not be revertedback into the economy to produce the ripple effect estimated by the multipliers.
22
locals would have gone elsewhere is not possible with the present data, so the
expenditures by locals have been excluded from the estimation altogether.
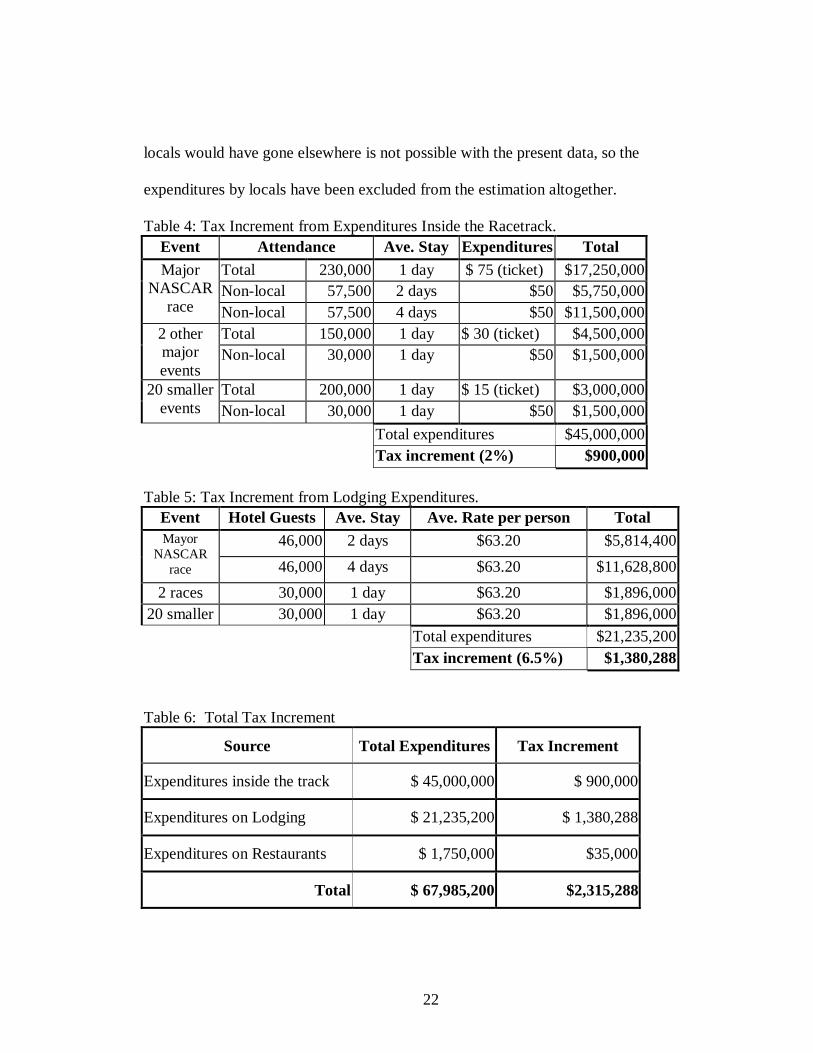
Table 4: Tax Increment from Expenditures Inside the Racetrack.Event Attendance Ave. Stay Expenditures Total
Total 230,000 1 day $ 75 (ticket) $17,250,000Non-local 57,500 2 days $50 $5,750,000
MajorNASCAR
race Non-local 57,500 4 days $50 $11,500,000Total 150,000 1 day $ 30 (ticket) $4,500,0002 other
majorevents
Non-local 30,000 1 day $50 $1,500,000
Total 200,000 1 day $ 15 (ticket) $3,000,00020 smallerevents Non-local 30,000 1 day $50 $1,500,000
Total expenditures $45,000,000Tax increment (2%) $900,000
Table 5: Tax Increment from Lodging Expenditures.Event Hotel Guests Ave. Stay Ave. Rate per person Total
46,000 2 days $63.20 $5,814,400MayorNASCAR
race 46,000 4 days $63.20 $11,628,800
2 races 30,000 1 day $63.20 $1,896,00020 smaller 30,000 1 day $63.20 $1,896,000
Total expenditures $21,235,200Tax increment (6.5%) $1,380,288
Table 6: Total Tax Increment
Source Total Expenditures Tax Increment
Expenditures inside the track $ 45,000,000 $ 900,000
Expenditures on Lodging $ 21,235,200 $ 1,380,288
Expenditures on Restaurants $ 1,750,000 $35,000
Total $ 67,985,200 $2,315,288
23
Part of the fiscal impact would also be the ad valorem paid by the property.
Although, as previously mentioned, the racetrack is publicly owned and tax exempt, the
surrounding amenities that constitute part of the complex are not included in the
exemption. According to the Denton County Appraisal District, the Motor Speedway
Club and the Lone Star Tower have a combined appraised value for 1999 of
approximately $65 million, which means property tax liability of $ 1.1 million for
Northwest Independent School District (according to 1999 tax rate of 1.70472%) and
$150,000 for Denton County (according to 1999 tax rate of 0.23504%).
Given the special financing designed for this venue, where the only tax dollars
destined to service the debt are those incrementally generated by the venue, it is easy to
conclude that the construction of the Texas Motors Speedway has been both successful
and profitable, both for the City of FortWorth and Denton County. The Northwest
Independent School District has seen its tax revenue from the land where the speedway
is located increase over 3,000 percent, from $35,000 in 1995 to $1.1 million in 1999.
24
CHAPTER VI
CONCLUSION
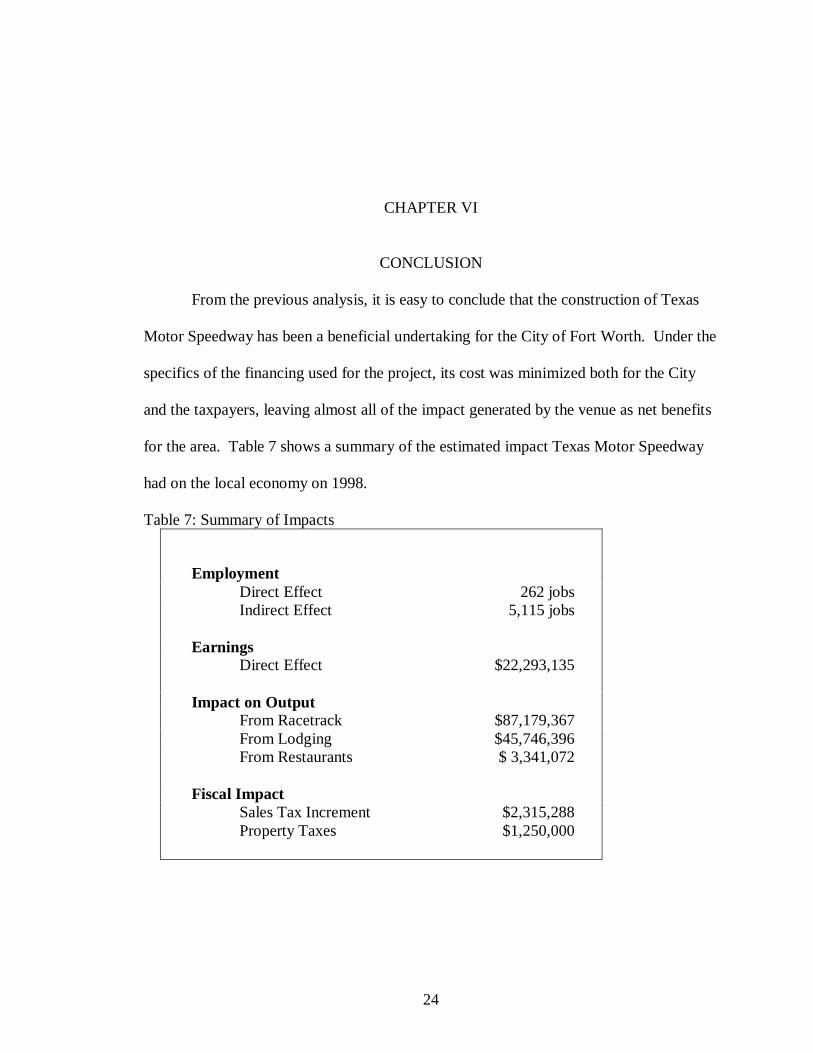
From the previous analysis, it is easy to conclude that the construction of Texas
Motor Speedway has been a beneficial undertaking for the City of Fort Worth. Under the
specifics of the financing used for the project, its cost was minimized both for the City
and the taxpayers, leaving almost all of the impact generated by the venue as net benefits
for the area. Table 7 shows a summary of the estimated impact Texas Motor Speedway
had on the local economy on 1998.
Table 7: Summary of Impacts
EmploymentDirect Effect 262 jobsIndirect Effect 5,115 jobs
EarningsDirect Effect $22,293,135
Impact on OutputFrom Racetrack $87,179,367From Lodging $45,746,396From Restaurants $ 3,341,072
Fiscal ImpactSales Tax Increment $2,315,288Property Taxes $1,250,000
25
It is important to emphasize that there is still room for growth for Texas Motor
Speedway. The drag racing strip under construction will bring more business to the
racetrack, and the possibility of obtaining another Winston Cup race should not be totally
ruled out. The Speedway Club has not reached full capacity and nor has the main
racetrack. There is still opportunity for growth and further related developments, such as
plans for hotel construction and business relocation. In all likelihood, the future impact
of the racetrack will surpass 1998 achievements, increasing its importance for the area.
Under this simulation, the opportunity costs incurred should not be overlooked.
At the time of construction, no alternative uses for the land where the racetrack is located
were available. And, while the short-term horizon remains bleak for the area, the entire
length of the project should be taken into consideration when forming conclusions about
its results. The tax exemption for the speedway is a long-term status, which represents
unrealized income for the school district, the public health care system, and other local
taxing entities in the area for as long as the venue exists. If the area continues to attract
residents but fails to increase its tax base through new related developments, a future
analysis may find a net negative economic impact.
The literature review tells a story of unrealized economic benefits from most sport
venues analyzed, while proving the existence of intangible benefits. Texas Motor
Speedway and stock car racing embody unique characteristics that set them apart from
other sports and may be the reason for the success it has had. Stock car racing draws a
much larger number of attendants than other major league sports, a large proportion of
which are non-locals, and events progress through an average of four days, increasing the
26
potential economic impact. Furthermore, the racetrack and its related buildings can be
used for non-racing activities year-round.
This simulation findings point to Texas Motor Speedway as a successful
economic development tool, creating a tangible and positive impact on job creation,
earnings, and output and increasing the overall tax base. However, the scope of the study
is limited to a one-year horizon and the venue itself has only been operating for less than
four years. Future research is necessary to determine the long-term effect of the venue on
the local economy and its viability as an economic development tool.
27
REFERENCE LIST
Anderson Forest, S. and Walczak, L. (1997, August 11). A Gamble as Big as
Texas. Business Week, pp. 90.
Baim, Dean V. (1994). The Sports Stadium as Municipal Investment. Westport,
CT: Greenwood Press.
Black, T. and Pape, A. (1998). The IndyCar Grand Prix: Costs & Benefits.
Australian Accountant. 65(8), 25-28.
Denton County Appraisal District (2000, May 31) [WWW Document]. URL
http://www.dentoncad.com (visited 6/12/00).
Economaki, Corinne. (1997, November 24). Brandweek.
Fainstein, S. and Stokes, R. (1998). Spaces for Play: The Impacts of
Entertainment Development on New York City. Economic Development Quarterly,
12(2), 150-165.
Gross, H. and Weinstein B. (1996, January). The Texas Motor Speedway: an
Assessment of Regional Economic Impacts. Center for Economic Development and
Research. Denton, TX.
Hagstrom, Robert G. (1998). The NASCAR Way, the business that drives the
sport. New York: John Wiley & Sons, Inc.
Holleran, Joan. (1999). Sponsorships Grow More Than Sales. Beverage
Industry, 90(3),49-51.
28
Howard, D. and Crompton, J. (1995). Financing Sport. Morgantown, WV:
Fitness Information Technology, Inc.
Johnson, A. and Sack A. (1996). Assessing the Value of Sports Facilities: The
importance of noneconomic factors. Economic Development Quarterly, 10(4), 369-381.
Levy, Mike. (1999, July). Winning Formula. Director, 52(12), 44-48.
Noll, Roger. (1974). Government and the Sports Business. Washington, DC:
The Brookings Institution.
Noll, R. and Zimbalist, A. (1997). Sports, Jobs & Taxes, The Economic Impact
of Sports Teams and Stadiums. Washington, DC: The Brookings Institution.
Owen, W. and Beitsch, O. (1997, April). Some Perspectives on Sports Facilities
as Tools for Economic Activity. Real Estate Issues, 22(1), 16-23.
Rosentraub, Mark S. (1950). Major League Losers: The Real Cost of Sports and
Who’s paying for It. New York: BasicBooks.
Sandomir, Richard. (1999, November 21). Nascar Expands on Its Popularity.
The New York Times, pp. 8-6.
Spiegel, Peter. (1999, October 11). Southern-fried Dynasty. Forbes, 164(9),
132-136.
Swindell, D. and Rosentraub, M. (1998). Who Benefits From the Presence of
Professional Sports Teams? The Implications for Public Funding of Stadiums and
Arenas. Public Administration Review, 58(1), 11-20.
Texas Motor Speedway [WWW Document]. URL
http://www.texasmotorspeedway.com (visited 5/4/00).
29
US Department of Commerce (1997), Regional Multipliers: A User Handbook for
the Regional Input-Output Modeling System (RIMS II), US Government Printing Office.
Williams, Deb. (1990, May 25). Track Accelerates Charlotte Economy. USA
Today, pp. 13E.
Young, Lindsey. (1998, March 15). Explaining NASCAR’s Explosion.
Chattanooga News, pp.H7.
Zimmerman, Dennis. (1990). The Private Use of Tax-Exempt Bonds:
Controlling Public Subsidy of Private Activity . Washington, DC: The Urban Institute
Press.