Embed Size (px)
Citation preview
IMMUNIZED INTERNATIONAL ALLIANCES:A SEQUENTIAL GAME OF ALLIANCE FORMATION
IN THE AIRLINE INDUSTRY
MIGUEL-ANGEL ALCOBENDAS*
Yahoo! Inc.
January 1, 2015
Abstract. This paper analyzes the incentives of competing airlines to form international
alliances, and the concerns that competition authorities may have in granting such agree-
ments. We consider a sequential game where a carrier (leader) first decides if it wants to
establish a complementary international alliance with a foreign carrier. This agreement
improves partners’ coordination on international routes where both operate, letting them
benefit from joint fares and capacity on these routes. Then, a competitor (follower) deter-
mines whether allying with another foreign carrier is its best response to the action taken by
the leader. The alliance affects not only the international markets where airlines coordinate,
but also the nature of competition in domestic markets. Several equilibria arise depending
on the strength of the brand loyalty of travelers, economies of traffic density, and synergies
derived from the alliance. Welfare analysis suggests that when forming an international al-
liance belongs to the set of equilibria, total surplus does not always increase. In some cases
the leader decides to coordinate even if the alliance creates negative synergies, with the
objective of deterring the alliance formation of the follower. In this scenario, competition
authorities should be concerned about granting antitrust immunity to the alliance.
Keywords: Airline Industry, Antitrust Immunity, Antitrust Policy, Industrial Organi-
zation
1. Introduction:
International alliances in the airline industry are a common practice nowadays. By far,
the most controversial type is the one created when competition authorities grant antitrust
immunity to allied carriers (ATI). Granting exemption from antitrust laws allows participants
*This paper is part of my PhD dissertation at Toulouse School of Economics.
Email: [email protected].
I wish to thank Professors Marc Ivaldi and Jan Brueckner for guidance and support. I also thank Professors
Miguel Urdanoz and Robin Lindsey for their insightful comments.
1
to agree on prices and capacity. The scope of the agreement is determined by the interest of
airlines and limited by competition authorities. ATI may have several pro-competitive and
anti-competitive effects and depending on which effects dominate, granting an ATI can be
desirable from a welfare point of view.
We present a theoretical model of alliance formation where we examine the strategic
behavior of airlines as a reaction to decisions taken by competitors. The main paper’s
contribution is to provide an analysis of the incentives of competing airlines to create rival
alliances using an extension of the model presented by Brueckner and Whalen (2000), and
the welfare impact of international agreements. We consider a sequential game where there is
a leader (airline 1) which first decides if it wants to form an alliance with a carrier operating
in another country and ask for ATI. If ATI is granted by competition authorities, allied
carriers are allowed to jointly determine the price of their flights operating in international
markets and share the revenues derived from them. Then, in a second stage of the game, the
competitor (airline 2) decides whether an agreement with another foreign carrier is its best
response to the action taken by the leader. Finally, airlines simultaneously decide on prices.
We can imagine the leader as a carrier which has already a tight relationship with airlines
operating in the other country (for instance, codesharing or joint frequent flyer programs).
In such a case, it would be easier for it to establish an alliance with a foreign airline than
for airlines without such ties (follower). We will see that these decisions not only have
consequences on the international routes, but also on domestic markets.
The model captures three important features of the airline industry: travelers brand-
loyalty, existence of economies of traffic density, and synergies from airline cooperation. The
first effect accounts for preferences of travelers for one carrier, the second takes into account
decreasing marginal costs, and the third is related to possible efficiency gains (or losses)
derived from sharing activities. Airline cooperation may reduce fixed costs of partners (e.g.
more efficient scheduling or integration of ground activities), or increase them (e.g. cost of
coordination). Moreover, we assume that such synergies may be asymmetric across airlines.
While previous theoretical work has considered the existence of brand-loyalty and economies
of traffic density, we are not aware of any study that captures synergies as a result of alliance
formation.
The main results of the paper are: first, ATI not only affects the international markets
where airlines coordinate, but also the strategic behavior of carriers in domestic markets.
Second, if low brand loyalty of travelers is accompanied by high economies of traffic density
and positive synergies, airlines may find it profitable to ally. However, if carriers benefit from
very loyal customers and the magnitude of economies of traffic density and synergies are not
2
high enough, carriers may find it desirable to operate on their own rather than sharing part
of their profits with a partner. Third, we can have asymmetric decision outcomes where
a company may be willing to ally and the competitor does not find it profitable. Finally,
welfare analysis suggests that if asking for ATI belongs to the set of equilibria, total surplus
does not always increase. In some cases, the leader decides to coordinate even if the alliance
creates negative synergies, with the objective of deterring the alliance formation by the
follower. In this scenario, competition authorities should be concerned about granting ATI
to the leader.
ATI may have several pro-competitive and anti-competitive effects. However, empirical
evidence from the US-Europe Transatlantic market suggests, overall, a positive impact of
ATI on consumer welfare. Good examples are the reports presented by the US Department
of Transportation (1999, 2000). Such studies concluded that antitrust immunity expands the
service offered by carriers and does not significantly increase fares in markets where immune
alliances operate. Similar conclusions have been derived by other authors such as Brueckner
(2003), Whalen (2007) and Willig, Israel and Keating (2009).
There exist several reasons that justify granting ATI. First, the airline industry bene-
fits from economies of traffic density (Brueckner and Spiller 1994). This effect reduces the
carrier marginal cost when the number of passengers increases. The greater the network,
the greater is the impact of this effect. Second, when passengers need to use several carri-
ers to reach their international destination, the joint fare offered by the alliance eliminates
double marginalization (Brueckner 2001). That is, cooperative pricing internalizes the neg-
ative externality that arises when each partner chooses its own subfare without taking into
account the consequences for the other carrier. Third, alliances offer “seamless services” by
increasing scheduling coordination for connecting flights and integration of ground activities.
Additionally, customers can benefit from attractive frequent flyer programs, due to the in-
cremental destinations offered by the agreement. Finally, international alliances can also be
seen as an alternative to overcome restrictions in some markets. For example, some countries
have bilateral agreements that limit the number of carriers and airports operating between
both countries. In some other cases, regulations limit the ownership by foreign investors of
domestic airlines. For instance, in the US, the foreign ownership of voting shares in airline
companies is limited to 25% of the total.
There also exist other effects of ATI that may reduce total welfare and harm con-
sumers. According to Stuart (2006), the agreements have two main negative effects: first,
a direct effect which results from a reduction in competition between partners, and second,
an indirect effect due to the strategic barriers that alliances may impose on rivals’ entry
3
decisions. The direct effect is strongly connected to the degree of overlapping routes of
partners. Park (1997) distinguishes between alliances with no overlapping routes prior the
agreement (complementary alliances) and the scenario where partners compete on some of
the routes (parallel alliances). His results suggest that alliances between companies with
a high degree of overlapped routes raise airlines profits but reduce consumer welfare. The
second result mentioned by Stuart (2006) is linked to airport dominance. The larger the
presence of allied carriers in one airport, the more difficult it is for rivals to operate at such
an airport. As a result, carriers can deter entry of non-allied airlines and discriminate on
interline access to benefit allied partners. A good example is the strategy followed by Air
France (AF) at Charles De Gaule Airport (CDG). In 2004, Continental Airlines (CO) allied
with AF through the “Skyteam Alliance”. Reitzes and Moss (2008) noticed that after the
agreement, CO increased its connecting passengers beyond CDG. At the same time, the non-
allied Northwest (NW) and United Airlines (UA) experienced a decrement in the number of
passengers originated in the US and terminating beyond CDG.
There exists important theoretical work on alliances. Zhang and Czerny (2012) present
an excellent review of recent research about the topic. Close to our work, the aforemen-
tioned paper by Brueckner and Whalen (2000) analyzes the effects of alliances on fares.
However, their model does not endogenize the decision regarding the formation of alliances.
In this regard, Bilotkach (2005) addresses the carriers’ incentives to ally. While in his set-
ting products offered by airlines are vertically differentiated by number of stops, we capture
horizontal differentiation (brand-loyalty of travelers). His model also allows for competition
between members of the alliance prior the agreement (our model does not). However, his
complex setting does not capture economies of traffic density, which are important in the
airline industry. In a more general setting, Zhang and Zhang (2006) examine rivalry between
alliances where the profit function of each member depends on its own profit and a share
of its partner’s profit. Despite this feature, their model does not explicitly introduce the
aforementioned specificities of the airline industry.
The closest works to our paper are Flores-Fillol and Moner-Colonques (2007), and Jiang,
Wan, and D’Alfonso (2014). Flores-Fillol and Moner-Colonques (2007) present an interest-
ing exercise where carriers operating as monopolists on their respective domestic markets
may not find it desirable to ally even if there exist economies of traffic density, product
differentiation, and market size effects. There are significant differences with respect to our
study: first, Flores-Fillol and Moner-Colonques (2007) propose a two stage-game in which
carriers first simultaneously decide if they want to cooperate, and then, in a second stage,
set fares. In our work, the decision regarding the alliance formation is made sequentially:
4
first, the leader airline decides if it wants to form an international alliance. Then, in a
second stage, the follower observes the action taken by the leader and decides according to
its best response function. Our approach is more consistent with the formation of interna-
tional alliances connecting the US and Europe. On the other hand, the recent Transpacific
agreements between United Airlines (UA) and All Nippon Airways (NH), and American
Airlines (AA) and Japan Airlines (JL) can be seen as a result of a simultaneous game.1
Second, Flores-Fillol and Moner-Colonques (2007) assume that fares for international inter-
line trips are just the sum of the nonstop segment fares, whereas we allow interline trips to
have individual prices in a more-realistic fashion. Third, in their model, allied airlines jointly
maximize profits from domestic and international markets. In our paper, partners only share
revenues from international markets, while independently deciding on domestic fares. This
is more in line with observed agreements, since airlines are only able to jointly determine
fares and share revenues in markets where competition authorities grant ATI (e.g. Delta
(DL) and Virgin Australia (VA) on flights connecting the US, Australia and New Zealand,
or American Airlines (AA), British Airways (BA), and Iberia (IB) on routes between the US
and Europe). Four, in their model, competition only arises in international markets, which
include trips with two segments operated by different carriers. Our work, in this regard, is
more general, since we assume that carriers compete in both types of markets: domestic and
international. Lastly, one of the distinctive features of our model is its ability to capture
efficiency gains (losses) as a result of alliance formation.
Finally, Jiang, Wan, and D’Alfonso (2014) develop a theoretical model of cooperation
between domestic carriers and global alliances, in which domestic airlines are able to choose
which alliance to partner with. Their model includes overlapping routes between members
and introduces differences between domestic airlines and global alliances. Our model uses a
much simpler network but allows for differences between domestic airlines and, as previously
stated, variation in fixed costs as a result of synergies. Another important difference is that
while our results clearly depend on the parameter linked to economies of traffic density, Jiang
et al (2014) assume, instead, constant marginal costs.2 Finally, their paper does not study
the welfare implications of the equilibrium outcomes. As a result, policy suggestions cannot
be made as we do.
The structure of the paper is as follows: section 2 introduces the model. Section 3
analyzes the airlines’ profit maximization problem. Section 4 describes the subgame perfect
Nash equilibria. Section 5 presents a welfare analysis. Finally, section 6 concludes.
1Both immunized alliances were granted on April 2011.2They claim that including economies of traffic density does not have a qualitative impact on their results.
5
2. Model
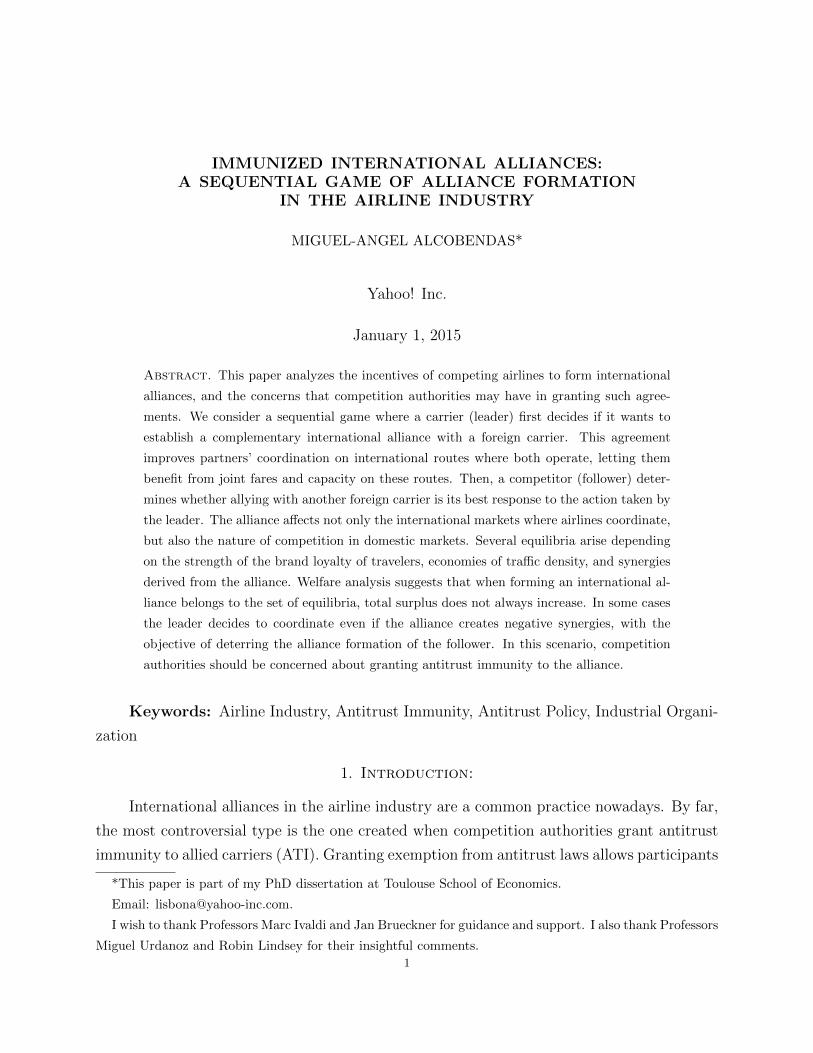
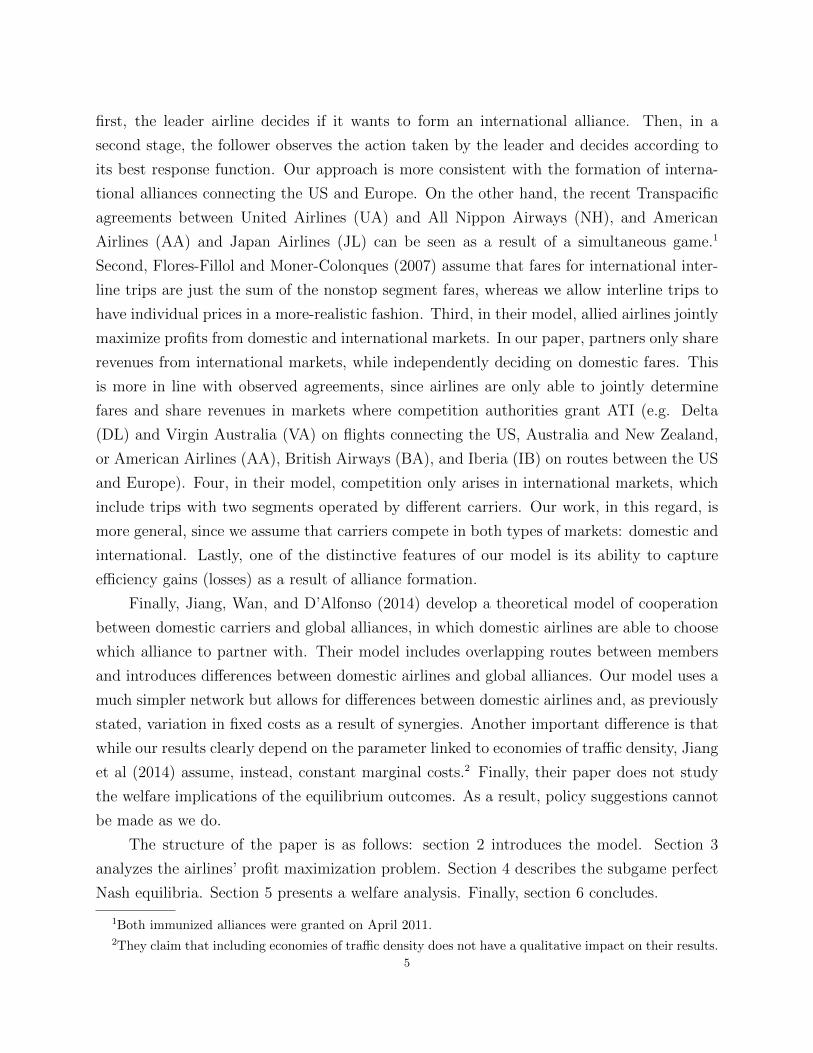
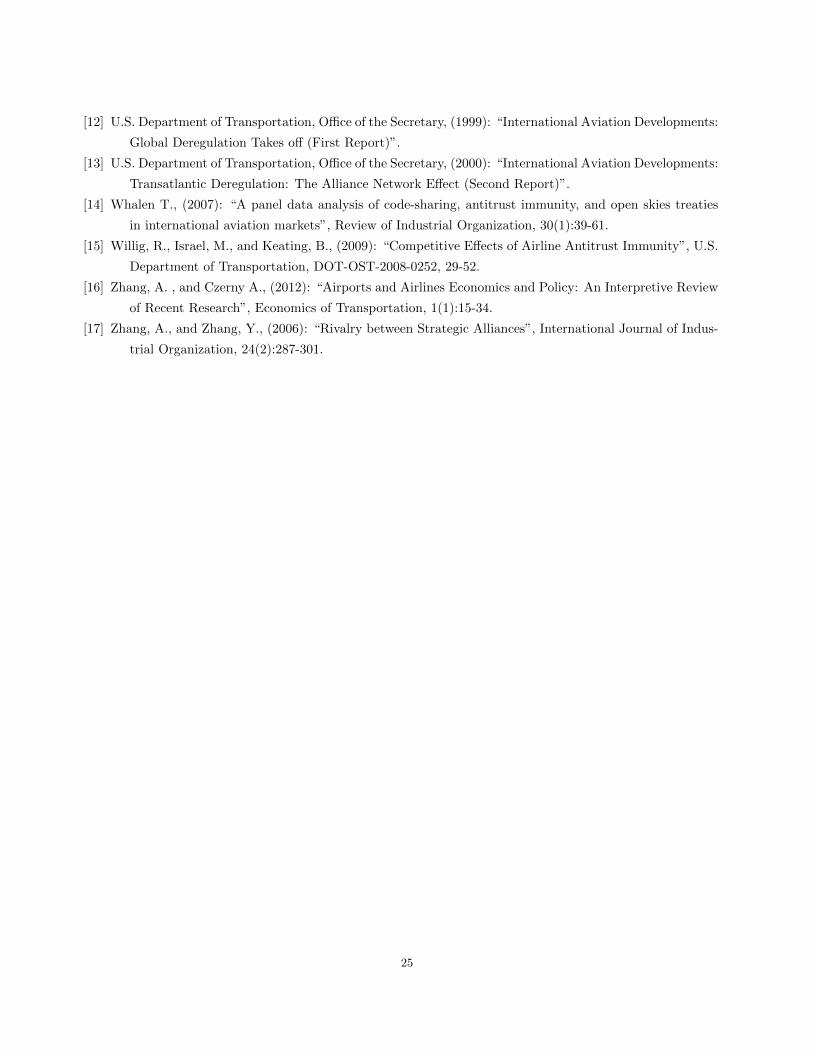
2.1. Network and Timing of the Game. Similar to the network presented by Brueckner
and Whalen (2000), we consider two countries (M and V ) with two spokes each sharing the
same hub airport (H) (Figure 1). In each market there are two competing airlines: 1 and
2 in country M , and 3 and 4 in country V . Carriers 1 and 2 fly in country M connecting
the cities A, B and H. On the other hand, carriers 3 and 4 operate in country V offering
flights between the cities C, D and H. There are no direct connections for city-pairs AB
and CD. Passengers willing to travel between these cities necessarily have to stop at H.
Similarly, passengers traveling from one country to the other have to stop at H and change
carrier (interline connection). Whereas the model assumes a unique hub for all companies, it
would be more realistic to introduce two international hubs, one in each country. However,
introducing a network with a hub-to-hub route would make the model more complex since
we would have a route where carriers from different countries compete against each other. As
a result, our model only captures the effects of complementary alliances, alliances between
airlines with no overlapping routes prior to the agreement.
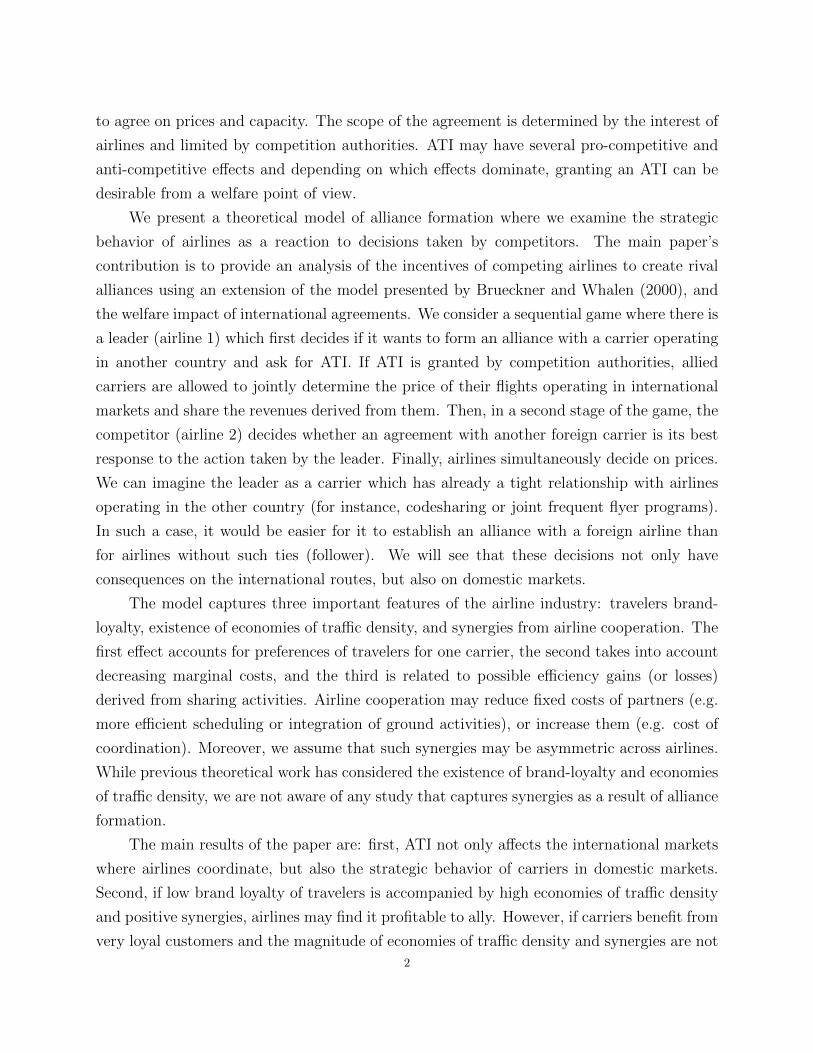
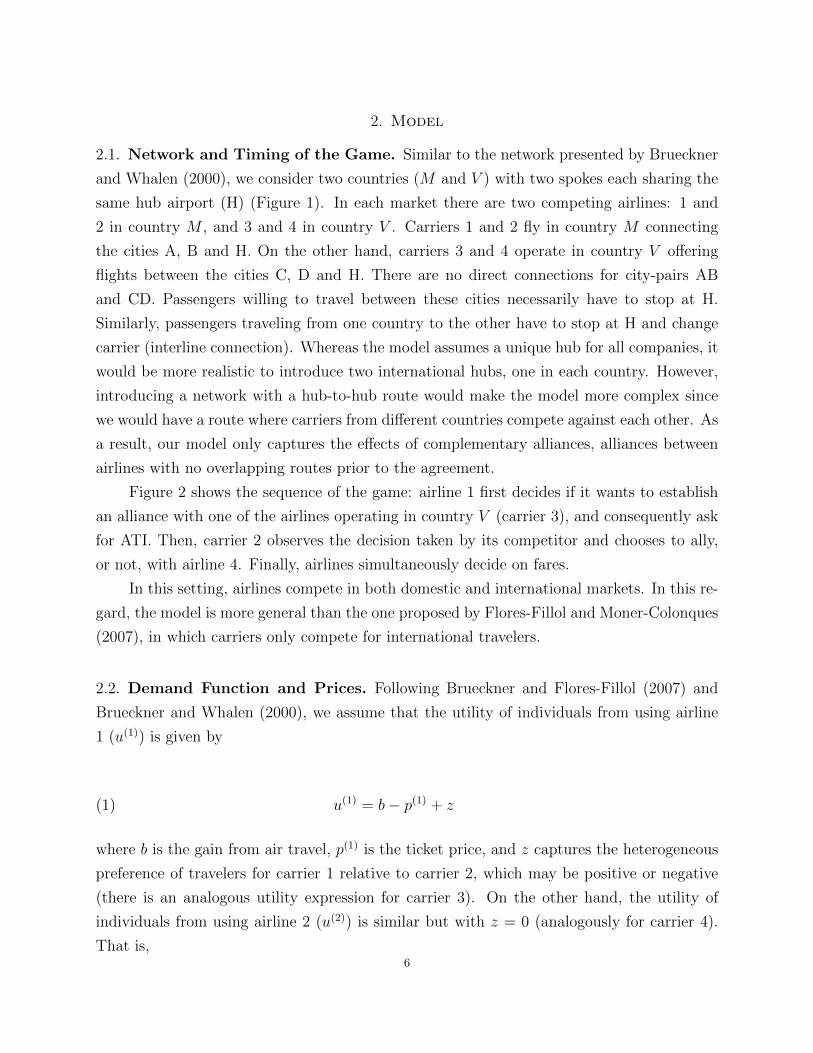
Figure 2 shows the sequence of the game: airline 1 first decides if it wants to establish
an alliance with one of the airlines operating in country V (carrier 3), and consequently ask
for ATI. Then, carrier 2 observes the decision taken by its competitor and chooses to ally,
or not, with airline 4. Finally, airlines simultaneously decide on fares.
In this setting, airlines compete in both domestic and international markets. In this re-
gard, the model is more general than the one proposed by Flores-Fillol and Moner-Colonques
(2007), in which carriers only compete for international travelers.
2.2. Demand Function and Prices. Following Brueckner and Flores-Fillol (2007) and
Brueckner and Whalen (2000), we assume that the utility of individuals from using airline
1 (u(1)) is given by
u(1) = b− p(1) + z(1)
where b is the gain from air travel, p(1) is the ticket price, and z captures the heterogeneous
preference of travelers for carrier 1 relative to carrier 2, which may be positive or negative
(there is an analogous utility expression for carrier 3). On the other hand, the utility of
individuals from using airline 2 (u(2)) is similar but with z = 0 (analogously for carrier 4).
That is,6
u(2) = b− p(2)(2)
Travelers will choose airline 1 as long as the ticket price (p(1)) is not higher than the
one offered by competitor 2 (p(2)) plus the constant z (i.e. p(1) < p(2) + z). If we assume that
z is uniformly distributed over the interval [− δ2, δ2], then we can derive the traffic for carrier
1 as follows:
q(1) =
∫ δ2
p(1)−p(2)
1
δdz =
1
2− p(1) − p(2)
δ(3)
where we assume that 1 ≥ δ > 0 in order to guarantee positive prices in the optimality
conditions. δ can be seen as a brand loyalty parameter which captures the effort of carriers
to keep customers using, for instance, frequent flyer programs. The higher is δ, the greater is
the dispersion of consumer preferences for particular carriers. We assume that total demand
equals 1. As a result, the demand for carrier 2 is equal to
q(2) = 1− q(1)(4)
We also assume that the gain from air traveling (b) in (1) and (2) is high enough to
avoid the existence of an outside option. That is, travelers always find it preferable to fly
rather than using other modes of transportation or to stay at home. This type of demand
fits reasonably well for business customers that must travel between cities located far away.
In such a case, flying is the most attractive option.
The domestic traffic that company i faces for connecting the city-pair (l,m) is denoted
by q(i)lm where i ∈ {1, 2}, l ∈ {A,B} and m ∈ {A,B,H}. For example, airline 1 traffic
between the cities A and H is denoted q(1)AH . Similarly, q
(ij)ln is the demand for interline flights
connecting city-pairs located in different countries, where i ∈ {1, 2}, j = 3 if i = 1, j = 4
if i = 2, and n ∈ {C,D}. That means that international travelers using carrier 1 in market
M use carrier 3 in market V (similar reasoning for carriers 2 and 4). For instance, q(13)AC is
the demand that carriers 1 and 3 face for traveling between cities A and C. In such a case,
carrier 1 flies between A and H, and carrier 3 operates in the spoke HC (see Figure 1).3
Regarding the network, we assume that all spokes have the same characteristics. This
assumption implies that q(i)AH = q
(i)BH ≡ q
(i)XH where X ∈ {A,B}. Analogously for the interna-
tional demand, q(ij)AC = q
(ij)AD = q
(ij)BC = q
(ij)BD ≡ q
(ij)XY where Y ∈ {C,D}.
3Jiang et al (2014) propose a more flexible model in which carriers are allowed to choose their partner.
7
Fares for city-pairs located in the domestic market are denoted by P(i)AH = P
(i)BH ≡ P
(i)XH
for non-stop markets, and P(i)AB for the market AB. Given the previously stated assumptions,
P(1)XH = P
(3)XH and P
(1)AB = P
(3)AB (similar reasoning applies for carriers 2 and 4). The price
scheme for trips between city-pairs located in different countries changes depending on the
existence of alliances. P(ij)XY denotes the interline fare when carriers are allied. On the other
hand, if companies do not coordinate, the interline fare will be the sum of the subfares offered
by each carrier for traveling between the city located in its country and the hub H. Let S(i)XY
denote the subfare offered by i for the trip segment XH, and S(j)XY the subfare set by j for
the spoke HY , where i ∈ {1, 2}, j = 3 if i = 1, j = 4 if i = 2. In such a case, the final price
of the international trip is the sum of the corresponding subfares offered by the two carriers
(S(i)XY + S
(j)XY ). For example, the joint price offered by airlines 1 and 3 for connecting A and
C is P(13)AC . On the other hand, the price paid by international travelers would be the sum of
the two subfares if both carriers do not ally (S(1)AC +S
(3)AC). Given the structure of the network
and carriers, the ticket price offered by i and j will be the same for any international route.
That is, P(ij)AC = P
(ij)BC = P
(ij)AD = P
(ij)BD ≡ P
(ij)XY if i and j cooperate, and S
(i)XY = S
(j)XY if carriers
i and j do not ally.
2.3. Cost Function. The cost function captures two effects present in the airline industry:
economies of traffic density and synergies derived from the alliance. That is, the marginal
cost is decreasing with demand (economies of traffic density), and there may be efficiency
gains, or losses, derived from the alliance (synergies). As we previously stated, previous
literature has neglected changes in fixed costs due to the existence of alliance synergies.
The spoke cost function of carrier i is similar to the one appearing in Brueckner and
Whalen (2000) except for the existence of synergies as a result of the alliance, and it is given
by
c(i)(Q(i)) = Q(i) − 1
2θQ(i)2 − F (i)
21I(i){Alliance}+
G
2(5)
where Q(i) corresponds to the spoke traffic of carrier i. θ is interpreted as the strength of
the economies of traffic density: the higher the value of θ > 0, the lower is the cost of an
additional passenger. The constant F (i) captures the possible synergies (positive or negative)
as a result of the alliance, and it is multiplied by the indicator function 1I{·} which takes
the value 1 if airlines i and j coordinate and zero otherwise. If F (i) > 0, airline cooperation
reduces the fixed costs of allied carriers as a result of gains in efficiency (e.g. more efficient
scheduling or integration of ground activities). On the other hand, F (i) < 0 leads to an8
increase in fixed costs. It can be interpreted as a cost of coordination, and it may arise when
allied companies are too asymmetric. We assume that these synergies are not necessarily
equal for carriers 1 and 2, but we impose that F (1) = F (3) and F (2) = F (4). Finally, G
denotes other fixed costs, which are assumed to be the same for all carriers.
As previously noted, Q(i) equals total demand (domestic and international) using one
of the spokes in country M and carrier i, and is given by
Q(i) = q(i)XH + q
(i)AB + 2q
(ij)XY(6)
where q(i)XH is the demand for carrier i in city-pair XH, q
(i)AB is the domestic demand for the
market AB, whose passengers necessarily stop at the hub H to reach destination, and q(ij)XY
is the international traffic in city-pair XY and using carriers i and j in the spokes XH and
HY respectively. Note that the term q(ij)XY is multiplied by 2 because any spoke in country
M is fed by demand coming from the spokes HC and HD located in country V .
3. Solving the Model
Airlines are assumed to be profit maximizing firms with respect to fares, and they decide
if it is profitable to establish an international alliance, and consequently ask for ATI from
the competition authorities. We assume that airline 1 decides first (leader). Afterwards,
airline 2 (follower) observes the action taken by the leader and decides according to its
best response function. Finally, airlines simultaneously decide on prices. The equilibrium
concept used to solve the model is the subgame perfect Nash equilibrium. This type of
model is solved backwards, we first find the optimal fares and profits for each of the possible
alliance scenarios, then we solve for the follower (carrier 2) taking as given the decision of
the leader (carrier 1), and finally solve for carrier 1’s decision knowing the response of the
follower.
This section characterizes the optimal ticket prices and profits for each of the possible
strategy profiles of carriers. First, we study the case where airlines 1 and 3 do not ally, and
airline 2 decides if it wants to reach an agreement with airline 4. Afterwards, we repeat the
same analysis where airlines 1 and 3 find it profitable to cooperate offering a joint price for
international city-pairs.
As we previously mentioned, the model is similar to the one presented by Brueckner
and Whalen (2000) except for the existence of synergies (F (i)). Given the assumptions on
F (i), both papers lead to the same optimal fares for each of the possible scenarios.9
3.1. Airlines 1 and 3: Non-Alliance. Assuming that airline 1 is not interested in a deal
with airline 3, carrier 2 compares the profit that obtains depending on its decision (ally vs
not to ally).
3.1.1. Airlines 2 and 4: Non-Alliance. In this case, no one makes a deal. Hence, there are no
joint fares for trips connecting international city-pairs. Airline 1 maximizes its profits with
respect to prices in the domestic market (P(1)XH , P
(1)AB), and with respect to the subfare S
(1)XY
for connecting cities located in different countries without taking into account the effects of
its decision on airline 3 (similar reasoning for carrier 2).
In this scenario, we just need to solve the maximization problem of one airline to get
the profits and fares offered by the others. Note that the only element differentiating carriers
(F (i)) only appears when there exist alliances.
The revenue function for carrier i is
R(i) = 2P(i)XHq
(i)XH + P
(i)ABq
(i)AB + 4S
(i)XY q
(ij)XY(7)
where i ∈ {1, 2}, j = 3 if i = 1, and j = 4 if i = 2.
The sum of revenues from operating the spokes AH and BH is equal to 2P(i)XHq
(i)XH , the
revenues from the city-pair AB are P(i)ABq
(i)AB, and the revenues from international routes are
4S(i)XY q
(ij)XY .
As we already noted, q(i)lm depends negatively on the price offered by carrier i, and it is
positively correlated with the price offered by its competitor. Using (3), the non-stop traffic
for the domestic city-pair XH is
q(i)XH =
1
2− (P
(i)XH − P
(i′)XH)
δ(8)
where i′ ∈ {1, 2} and i′ 6= i. Similarly, the domestic demand for the city-pair AB is equal to
q(i)AB =
1
2− (P
(i)AB − P
(i′)AB )
δ(9)
and the demand for the international route XY is
q(ij)XY =
1
2− (S
(i)XY + S
(j)XY )− (S
(i′)XY + S
(j′)XY )
δ(10)
where i′ ∈ {1, 2}, j′ ∈ {3, 4}, i′ 6= i, j′ 6= j, j = 3 if i = 1, and j = 4 if i = 2.10
Using the revenue function (7) and the spoke cost function (5), carrier i decides fares
according to the following maximization problem:
maxP
(i)XH ,S
(i)XY ,P
(i)AB
R(i) − 2c(Q(i))(11)
Remember that the cost function c(Q(i)) refers to a single spoke, and carriers are assumed
to operate on two spokes.
Given the maximization problem, the corresponding optimal fare for trips between the
cities X and H is
P(i)XHna1na2 =
1
2(2 + δ − 4θ)(12)
Note that the sub-index of the optimal fare does not only denote markets but also the
strategy profile of carriers: a1 means that carrier 1 allies, and na1 denotes carrier 1 does not
cooperate with carrier 3 (analogously for carrier 2).
Similarly, the optimal fare for domestic flights connecting A and B is
P(i)ABna1na2 =
1
2(4 + δ − 8θ)(13)
Remember that when airlines do not cooperate, the interline fare for the international
trip is the sum of the two subfares offered by the corresponding carrier in each country. In
this scenario, the optimal subfare equals
S(i)XY na1na2 =
1
2(2 + δ − 4θ)(14)
The solution is the same for both carriers since both use the same strategy (not to ally).
Given the optimal fares, the corresponding profits are
Π(i)na1na2 =
7δ
4− 4θ −G(15)
We observe that prices and profits depend on δ and θ. Such exogenous parameters will
determine the responses of airlines. As we previously stated, δ captures the dispersion of
preferences for particular airlines. The higher the value of δ, the lower is the probability that
a traveler switches carrier. That explains why profits and prices are positively correlated
with the preference parameter. On the other hand, there is a negative correlation of prices
and profits with respect to the parameter linked to economies of traffic density (θ). This11
relationship is explained by the competitive environment of the sector. The higher the value
of θ, the lower is the cost of providing services. Since carriers are competing, that creates
downward pressure on prices and, consequently, on profits.
3.1.2. Airlines 2 and 4: Alliance. Assume now the asymmetric case where airlines 1 and
3 do not ally, and airlines 2 and 4 decide to cooperate in international markets. In this
case, carriers 2 and 4 (followers) offer a joint price for connecting cities located in different
countries (P(24)XY ).
The revenue function of carrier 1 has the same structure as the previous case (Equation
7), but the revenue function for carrier 2 is
R(2) = 2P(2)XHq
(2)XH + P
(2)ABq
(2)AB + 2P
(24)XY q
(24)XY(16)
and the demand for international markets is given by
q(13)XY =
1
2− (S
(1)XY + S
(3)XY )− P (24)
XY
δ(17)
q(24)XY =
1
2− P
(24)XY − (S
(1)XY + S
(3)XY )
δ(18)
Note that the only part of the revenues shared by cooperating carriers is the one generated by
the international routes, not the domestic ones.4 For simplicity, we assume that carriers do
not have bargaining power and split the revenues from interline trips in the same proportion.
That explains why the last term on the right hand side in (16) is multiplied by 2.
Given the revenue and cost functions, carriers solve the following maximization prob-
lems. For carrier 1,
maxP
(1)XH ,S
(1)XY ,P
(1)AB
R(1) − 2c(Q(1))(19)
Carrier 2 solves a similar expression, but fares for international trips are jointly set with
carrier 4,
maxP
(2)XH ,P
(24)XY ,P
(2)AB
R(2) − 2c(Q(2))(20)
4Other papers use a less realistic approach assuming that partners share both domestic and international
revenues (e.g. Flores-Fillol and Moner-Colonques (2007)).
12
Given the optimization problem, the corresponding optimal domestic fares for carrier 1
are
P(1)XHna1a2 = 1 +
23δ
48+
δ2
48(δ − 4θ)− 2θ(21)
P(1)ABna1a2 =
3δ(4 + δ)− (48 + 35δ)θ + 96θ2
6(δ − 4θ)(22)
and the optimal subfare charged for the spoke operated by carrier 1 in the corresponding
international trip is
S(1)XY na1a2 =
1
8(8 + 3δ − 16θ)(23)
As previously noted, one of the limitations of the model presented by Flores-Fillol and
Moner-Colonques (2007) is the assumption that fares for international interline trips equal
the sum of the nonstop segment fares. Our model is more realistic, since we allow interline
trips to have different prices (i.e. S(1)XY na1a2 6= P
(1)XHna1a2).
For carrier 2, the optimal ticket prices are given by
P(2)XHna1a2 = 1 +
δ(6δ − 25θ)
12(δ − 4θ)− 2θ(24)
P(2)ABna1a2 = 2 +
δ(3δ − 13θ)
6(δ − 4θ)− 4θ(25)
P(24)XY na1a2 = 2 +
δ(5δ − 22θ)
8(δ − 4θ)− 4θ(26)
Note that optimal fares do not depend on the synergies generated from the alliance
(F (i)).
Given fares, the corresponding profits are
Π(1)na1a2 =
63δ2 − 719δ2θ + 2644δθ2 − 3072θ3
48(δ − 4θ)2−G(27)
Π(2)na1a2 =
147δ2 − 1538δ2θ + 5340δθ2 − 6144θ3
96(δ − 4θ)2+ F (2) −G(28)
13
where, as we previously noted, F (2) captures possible synergies generated by the alliance
between carriers 2 and 4.
3.2. Airlines 1 and 3: Alliance. In this section, we analyze the optimal fares and profits
when airlines 1 and 3 ask for antitrust immunity.
3.2.1. Airlines 2 and 4: Non-Alliance. Consider the case where airline 1 agrees with carrier
3, and airlines 2 and 4 do not cooperate. This case is already solved above (section 3.1.2).
By symmetry, we just need to exchange carrier 1 for carrier 2 and vice versa. Consequently,
the optimal fares for carrier 1 are
P(13)XY a1na2 = 2 +
δ(5δ − 22θ)
8(δ − 4θ)− 4θ(29)
P(1)XHa1na2 = 1 +
δ(6δ − 25θ)
12(δ − 4θ)− 2θ(30)
P(1)ABa1na2 = 2 +
δ(3δ − 13θ)
6(δ − 4θ)− 4θ(31)
and the optimal decisions for carrier 2 with respect to ticket prices are
S(2)XY a1na2 =
1
8(8 + 3δ − 16θ)(32)
P(2)XHa1na2 = 1 +
23δ
48+
δ2
48(δ − 4θ)− 2θ(33)
P(2)ABa1na2 =
3δ(4 + δ)− (48 + 35δ)θ + 96θ2
6(δ − 4θ)(34)
Finally, the corresponding profits are given by
Π(1)a1na2 =
147δ2 − 1538δ2θ + 5340δθ2 − 6144θ3
96(δ − 4θ)2+ F (1) −G(35)
Π(2)a1na2 =
63δ2 − 719δ2θ + 2644δθ2 − 3072θ3
48(δ − 4θ)2−G(36)
14
3.2.2. Airline 2 and 4: Alliance. The last case is when everybody joins an alliance. Both
airlines in country M set a joint fare with their respective partner in country V (P(13)XY and
P(24)XY ). Then, the revenue function is equal to
R(i) = 2P(i)XHq
(i)XH + P
(i)ABq
(i)AB + 2P
(ij)XY q
(ij)XY
for i ∈ {1, 2}, j = 3 if i = 1 and j = 4 if i = 2.
Under this scenario, carriers set fares according to the following maximization problem:
maxP
(i)XH ,P
(ij)XY ,P
(i)AB
R(i) − 2c(Q(i))(37)
The solution of the problem is
P(13)XY a1a2 = P
(24)XY a1a2 =
1
2(4 + δ − 8θ)(38)
P(1)ABa1a2 = P
(2)ABa1a2 =
1
2(4 + δ − 8θ)(39)
P(1)XHa1a2 = P
(2)XHa1a2 =
1
2(2 + δ − 4θ)(40)
and the corresponding profits are
Π(1)a1a2 =
5δ
4− 4θ + F (1) −G(41)
Π(2)a1a2 =
5δ
4− 4θ + F (2) −G(42)
By construction, the maximization problems are well defined (profit function concave
and positive prices) for values 1 ≥ δ > 4θ > 0. Appendix 1 shows further details about the
necessary conditions on θ and δ to guarantee strict concavity of the profit functions.
3.3. Price Behavior. Following Brueckner and Whalen (2000), we compare the fares for
each of the discussed scenarios and observe the following relationships:
P(i)XY a1a2 < P
(13)XY a1na2 < S
(2)XY a1na2 + S
(4)XY a1na2 < S
(i)XY na1na2 + S
(j)XY na1na2(43)
P(1)ABa1na2 < P
(i)ABa1a2 = P
(i)ABna1na2 < P
(2)ABa1na2(44)
15
P(1)XHa1na2 < P
(i)XHa1a2 = P
(i)XHna1na2 < P
(2)XHa1na2(45)
where i ∈ {1, 2}, j = 3 if i = 1, and j = 4 if i = 2. For simplicity in the exposition, we only
consider asymmetric cases where airline 1 allies and airline 2 does not. Similar results are
obtained if we do it the other way around.
For international city-pairs, the interline fare when there are no alliances is higher than
in any other scenario (Equation 43). In this case, each airline maximizes profits without
taking into account the corresponding foreign carrier. As a result, double markups lead to
higher prices. On the other hand, prices when both carriers are allied are lower because air-
lines internalize the partner profits, eliminating double marginalization. In between, we have
prices in asymmetric scenarios where one of the airlines maximizes the joint international
revenues with its partner, and its competitor does not.
As we previously noted, the extent of the alliances is not only limited to international
routes, but also affects the behavior of airlines in domestic markets. We observe that prices in
the domestic market do not change when the strategy of carriers is the same (see Equations
44 and 45). This is a direct consequence of the assumption on demand (Equation 3). By
construction, total demand is always equal to 1 and does not depend on fares. However,
when the decisions of players are different, the one which decides to ally in the international
market is able to take advantage of economies of traffic density and offer a lower fare than
its competitor. We already saw that when a carrier cooperates, it offers lower fares on the
international routes. That leads to a reduction in marginal costs via incremental passengers,
making profitable lower prices in the domestic market. On the other hand, the carrier
which decides to operate on its own has an increment to marginal costs due to the business
stealing effect by its competitor. Consequently, it has to raise prices in both international
and domestic markets. However, the brand loyalty of travelers prevents all passengers from
changing carrier.
4. Subgame Perfect Nash Equilibria
In this section we study the set of subgame perfect Nash equilibria of the game. As
we previously mentioned, the leader first decides to ally knowing the response of carrier
2. Afterwards, the follower chooses. This leader-follower structure is clearly different from
the simultaneous-move assumption of other papers (e.g. Flores-Fillol and Moner-Colonques
(2007)).16
The model is solved backwards: first, knowing the optimal fares and profits for each of
the possible scenarios, we analyze the best response of airline 2 (follower) taking as given
the decision of carrier 1. Then, we study the equilibrium behavior of carrier 1 knowing the
reaction of carrier 2.
We characterize the set of equilibria as a function of the brand loyalty of travelers
(δ), economies of traffic density (θ), and synergies derived from the agreement (F (i)). For
comparative reasons, we assume that the fixed costs of carriers 2 and 4 are not a function
of their level of cooperation (F (2) = F (4)=0). In line with previous results (e.g. Flores-Fillol
and Moner-Colonques (2007) and Jiang et al (2014)), we will see that creating an alliance is
not always the best carrier’s strategy given the response of the competitor.
4.1. 2nd Stage of the Game: Best Response of Carrier 2 (follower). We solve the
second stage of the game and characterize the best response function of the follower (carrier
2) given the decision of the leader (carrier 1).
If carriers 1 and 3 do not cooperate, we ask what is the best response of carrier 2 as
a function of the strength of the brand loyalty of travelers (δ) and the parameter linked to
economies of traffic density (θ).
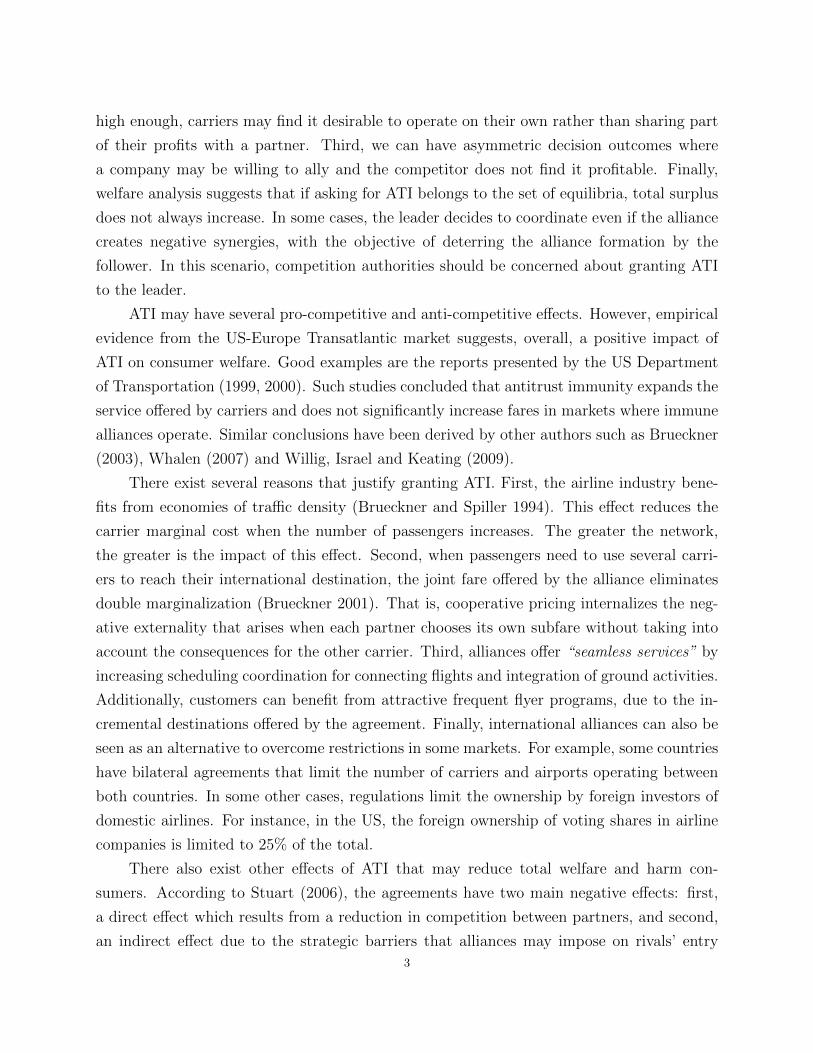
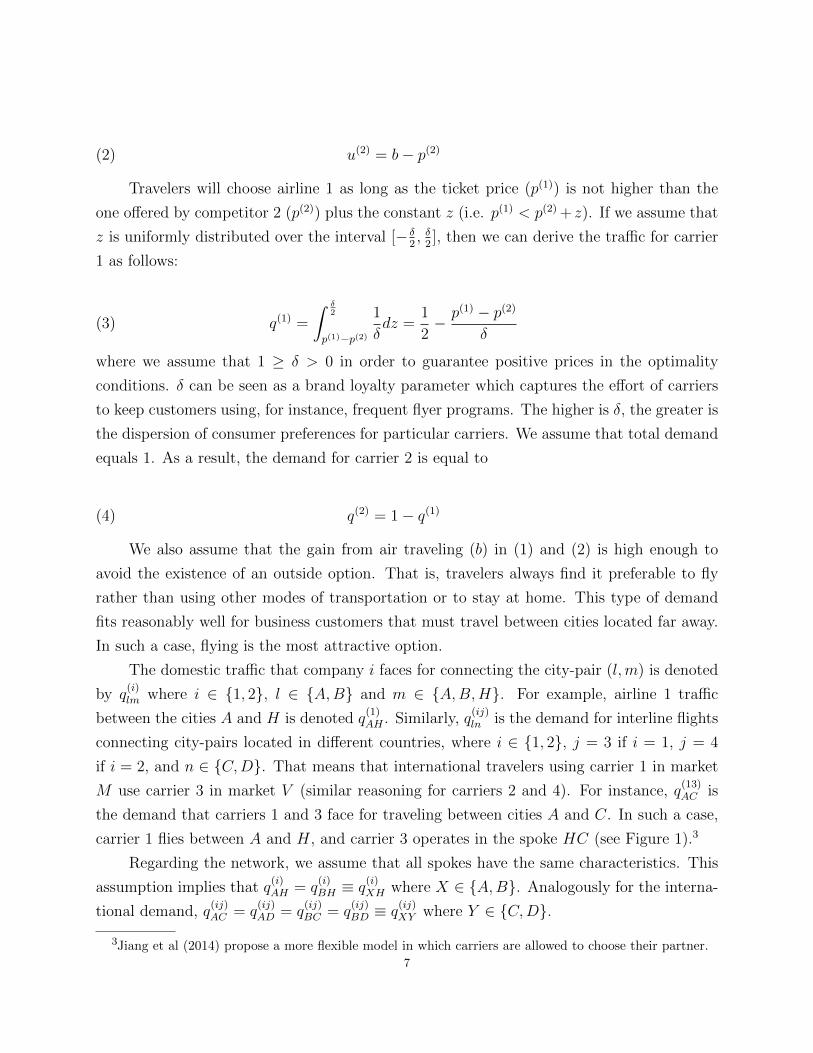
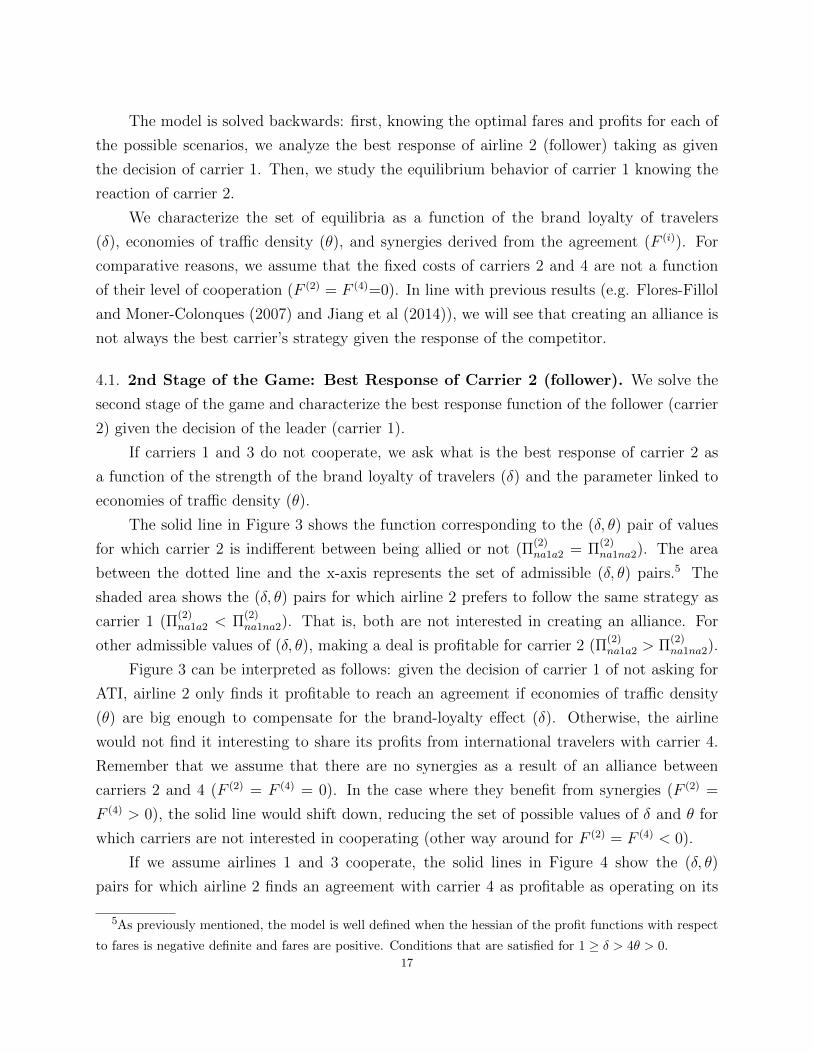
The solid line in Figure 3 shows the function corresponding to the (δ, θ) pair of values
for which carrier 2 is indifferent between being allied or not (Π(2)na1a2 = Π
(2)na1na2). The area
between the dotted line and the x-axis represents the set of admissible (δ, θ) pairs.5 The
shaded area shows the (δ, θ) pairs for which airline 2 prefers to follow the same strategy as
carrier 1 (Π(2)na1a2 < Π
(2)na1na2). That is, both are not interested in creating an alliance. For
other admissible values of (δ, θ), making a deal is profitable for carrier 2 (Π(2)na1a2 > Π
(2)na1na2).
Figure 3 can be interpreted as follows: given the decision of carrier 1 of not asking for
ATI, airline 2 only finds it profitable to reach an agreement if economies of traffic density
(θ) are big enough to compensate for the brand-loyalty effect (δ). Otherwise, the airline
would not find it interesting to share its profits from international travelers with carrier 4.
Remember that we assume that there are no synergies as a result of an alliance between
carriers 2 and 4 (F (2) = F (4) = 0). In the case where they benefit from synergies (F (2) =
F (4) > 0), the solid line would shift down, reducing the set of possible values of δ and θ for
which carriers are not interested in cooperating (other way around for F (2) = F (4) < 0).
If we assume airlines 1 and 3 cooperate, the solid lines in Figure 4 show the (δ, θ)
pairs for which airline 2 finds an agreement with carrier 4 as profitable as operating on its
5As previously mentioned, the model is well defined when the hessian of the profit functions with respect
to fares is negative definite and fares are positive. Conditions that are satisfied for 1 ≥ δ > 4θ > 0.
17
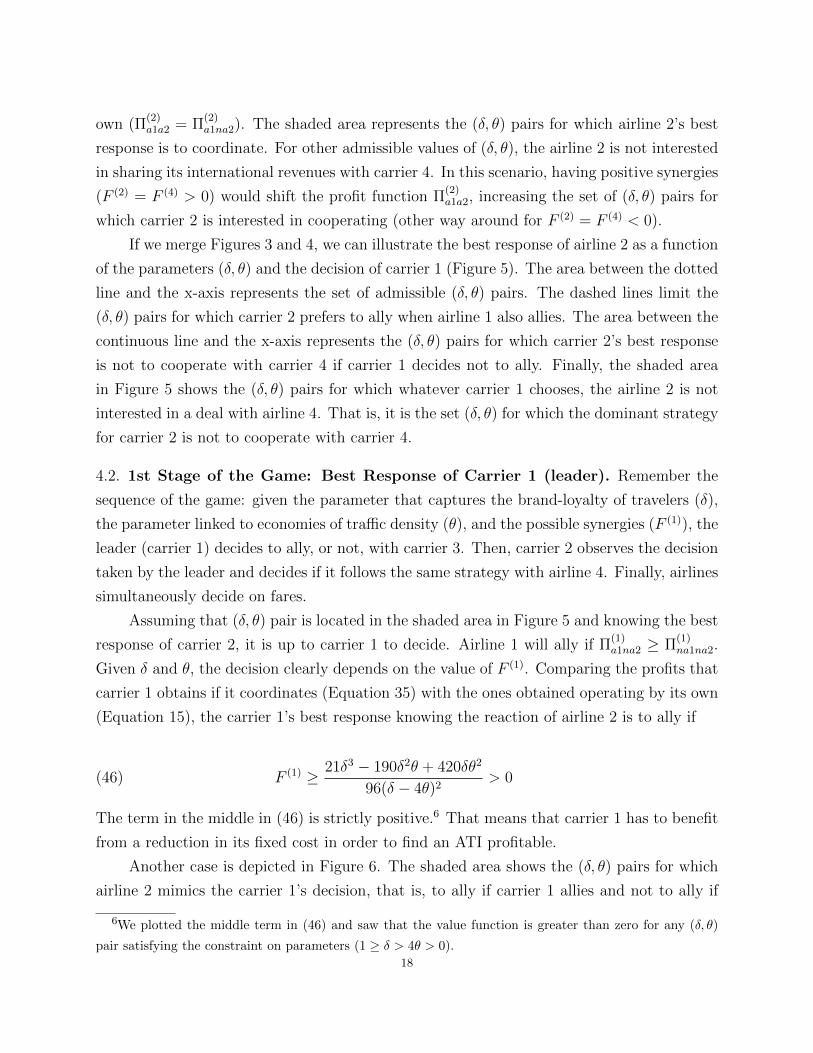
own (Π(2)a1a2 = Π
(2)a1na2). The shaded area represents the (δ, θ) pairs for which airline 2’s best
response is to coordinate. For other admissible values of (δ, θ), the airline 2 is not interested
in sharing its international revenues with carrier 4. In this scenario, having positive synergies
(F (2) = F (4) > 0) would shift the profit function Π(2)a1a2, increasing the set of (δ, θ) pairs for
which carrier 2 is interested in cooperating (other way around for F (2) = F (4) < 0).
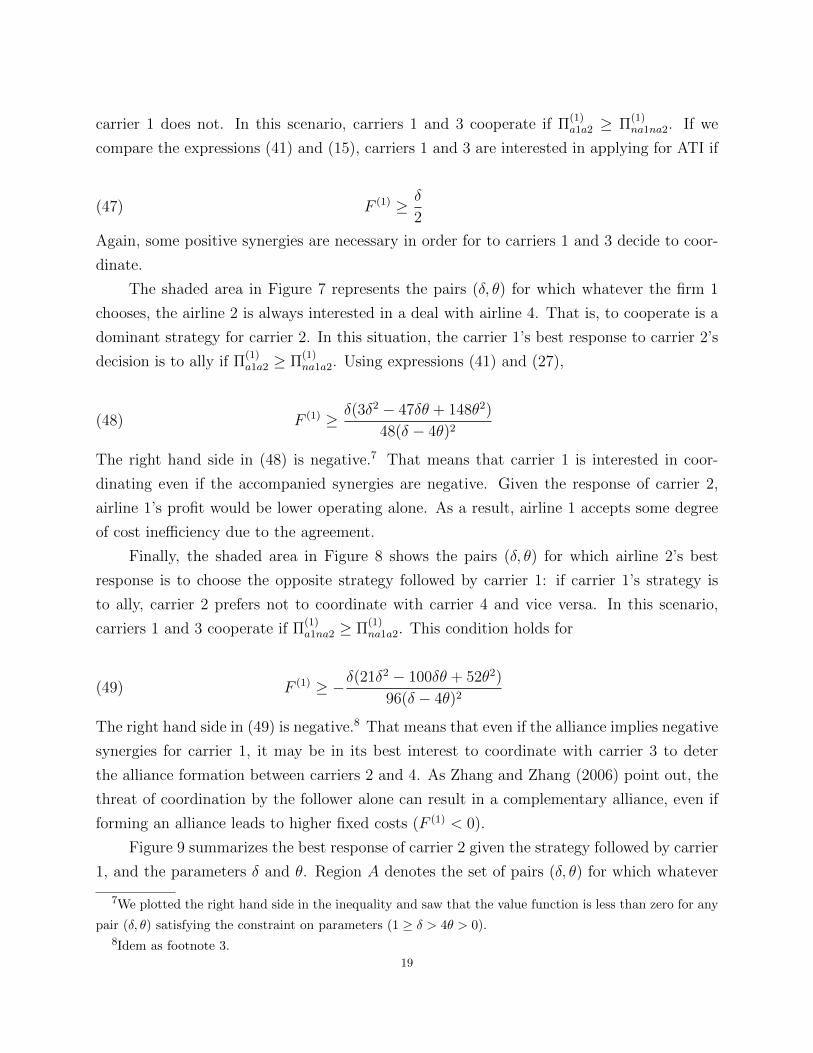
If we merge Figures 3 and 4, we can illustrate the best response of airline 2 as a function
of the parameters (δ, θ) and the decision of carrier 1 (Figure 5). The area between the dotted
line and the x-axis represents the set of admissible (δ, θ) pairs. The dashed lines limit the
(δ, θ) pairs for which carrier 2 prefers to ally when airline 1 also allies. The area between the
continuous line and the x-axis represents the (δ, θ) pairs for which carrier 2’s best response
is not to cooperate with carrier 4 if carrier 1 decides not to ally. Finally, the shaded area
in Figure 5 shows the (δ, θ) pairs for which whatever carrier 1 chooses, the airline 2 is not
interested in a deal with airline 4. That is, it is the set (δ, θ) for which the dominant strategy
for carrier 2 is not to cooperate with carrier 4.
4.2. 1st Stage of the Game: Best Response of Carrier 1 (leader). Remember the
sequence of the game: given the parameter that captures the brand-loyalty of travelers (δ),
the parameter linked to economies of traffic density (θ), and the possible synergies (F (1)), the
leader (carrier 1) decides to ally, or not, with carrier 3. Then, carrier 2 observes the decision
taken by the leader and decides if it follows the same strategy with airline 4. Finally, airlines
simultaneously decide on fares.
Assuming that (δ, θ) pair is located in the shaded area in Figure 5 and knowing the best
response of carrier 2, it is up to carrier 1 to decide. Airline 1 will ally if Π(1)a1na2 ≥ Π
(1)na1na2.
Given δ and θ, the decision clearly depends on the value of F (1). Comparing the profits that
carrier 1 obtains if it coordinates (Equation 35) with the ones obtained operating by its own
(Equation 15), the carrier 1’s best response knowing the reaction of airline 2 is to ally if
F (1) ≥ 21δ3 − 190δ2θ + 420δθ2
96(δ − 4θ)2> 0(46)
The term in the middle in (46) is strictly positive.6 That means that carrier 1 has to benefit
from a reduction in its fixed cost in order to find an ATI profitable.
Another case is depicted in Figure 6. The shaded area shows the (δ, θ) pairs for which
airline 2 mimics the carrier 1’s decision, that is, to ally if carrier 1 allies and not to ally if
6We plotted the middle term in (46) and saw that the value function is greater than zero for any (δ, θ)
pair satisfying the constraint on parameters (1 ≥ δ > 4θ > 0).
18
carrier 1 does not. In this scenario, carriers 1 and 3 cooperate if Π(1)a1a2 ≥ Π
(1)na1na2. If we
compare the expressions (41) and (15), carriers 1 and 3 are interested in applying for ATI if
F (1) ≥ δ
2(47)
Again, some positive synergies are necessary in order for to carriers 1 and 3 decide to coor-
dinate.
The shaded area in Figure 7 represents the pairs (δ, θ) for which whatever the firm 1
chooses, the airline 2 is always interested in a deal with airline 4. That is, to cooperate is a
dominant strategy for carrier 2. In this situation, the carrier 1’s best response to carrier 2’s
decision is to ally if Π(1)a1a2 ≥ Π
(1)na1a2. Using expressions (41) and (27),
F (1) ≥ δ(3δ2 − 47δθ + 148θ2)
48(δ − 4θ)2(48)
The right hand side in (48) is negative.7 That means that carrier 1 is interested in coor-
dinating even if the accompanied synergies are negative. Given the response of carrier 2,
airline 1’s profit would be lower operating alone. As a result, airline 1 accepts some degree
of cost inefficiency due to the agreement.
Finally, the shaded area in Figure 8 shows the pairs (δ, θ) for which airline 2’s best
response is to choose the opposite strategy followed by carrier 1: if carrier 1’s strategy is
to ally, carrier 2 prefers not to coordinate with carrier 4 and vice versa. In this scenario,
carriers 1 and 3 cooperate if Π(1)a1na2 ≥ Π
(1)na1a2. This condition holds for
F (1) ≥ −δ(21δ2 − 100δθ + 52θ2)
96(δ − 4θ)2(49)
The right hand side in (49) is negative.8 That means that even if the alliance implies negative
synergies for carrier 1, it may be in its best interest to coordinate with carrier 3 to deter
the alliance formation between carriers 2 and 4. As Zhang and Zhang (2006) point out, the
threat of coordination by the follower alone can result in a complementary alliance, even if
forming an alliance leads to higher fixed costs (F (1) < 0).
Figure 9 summarizes the best response of carrier 2 given the strategy followed by carrier
1, and the parameters δ and θ. Region A denotes the set of pairs (δ, θ) for which whatever
7We plotted the right hand side in the inequality and saw that the value function is less than zero for any
pair (δ, θ) satisfying the constraint on parameters (1 ≥ δ > 4θ > 0).8Idem as footnote 3.
19
airline 1 does, carrier 2 prefers not to ally. If the (δ, θ) pair is located in region B, carrier
2 will follow the same strategy adopted by carrier 1. In region C, airline 2 always prefers
to ally. Finally, if the (δ, θ) pair is in region D, carrier 2’s best response is to choose the
opposite strategy followed by carrier 1.
The next proposition summarizes the subgame perfect Nash equilibria of the game:
Proposition 1: Given the vector (δ, θ) and F (1), with δ ∈ (0, 1] being the parameter
that determines the traveler loyalty to a carrier, θ ∈ (0, δ4) the parameter that characterizes
the economies of traffic density, and F (1) the possible synergies derived from the alliance:
(1) If carrier 2 always finds it more profitable to not ask for antitrust immunity, carrier
1’s best response is to ask for antitrust immunity if F (1) ≥ 21δ3−190δ2θ+420δθ2
96(δ−4θ)2 , and
operate on its own otherwise.
(2) If carrier 2’s best response is to mimic the strategy adopted by carrier 1, carrier 1’s
best response is to ask for antitrust immunity if F (1) ≥ δ2, and operate on its own
otherwise.
(3) If carrier 2 always finds it more profitable to ask for antitrust immunity, carrier 1’s
best response is to ask for antitrust immunity if F (1) ≥ δ(3δ2−47δθ+148θ2)48(δ−4θ)2 , and operate
on its own otherwise.
(4) If carrier 2’s best response is to follow the opposite to the strategy adopted by carrier 1,
carrier 1’s best response is to ask for antitrust immunity if F (1) ≥ − δ(21δ2−100δθ+52θ2)96(δ−4θ)2 ,
and operate on its own otherwise.
5. Welfare Analysis
In the previous section we analyzed the subgame perfect Nash equilibria of carriers
given the parameters (θ,δ,F (1)). These strategies are the result of the profit maximization
behavior of carriers. However, it is the decision of competition authorities to grant antitrust
immunity to the international alliances (ATI).
This section analyzes the decisions of the competition authorities given the strategy
followed by carriers. We discuss under which circumstances granting ATI increases total
welfare.
We define the welfare of country M (Ws1s2) as the total traveler benefits net of the
airline costs on the spokes located in the country. After some algebraic manipulations and
using expressions (1), (2) and (5), the total welfare is equal to
Ws1s2 =
∫ δ2
p(1)−p(2)[b+ z]
1
δdz +
∫ p(1)−p(2)
− δ2
b1
δdz − 2(c
(1)s1s2 + c
(2)s1s2)(50)
20
where s1 ∈ {a1, na1} and s2 ∈ {a2, na2} denote the strategies followed by airlines 1 and
2 respectively. Given that both countries (M ,V ) have similar characteristics, the welfare
analysis in country M is equivalent for country V .
5.1. Case 1: airline 2 mimics airline 1. The simplest case is when airline 2 follows the
strategy adopted by airline 1 (region B in Figure 9). In this scenario, the regulator prefers
both companies to ally rather than none if Wa1a2 ≥ Wna1na2. Using Equation (50) evaluated
at the corresponding optimal fares, Wa1a2 ≥ Wna1na2 holds for F (1) ≥ 0. Hence, competition
authorities should grant ATI to both carriers if the alliance of carriers 1 and 3 generates
positive synergies. Remember that in this scenario firms ally if F (1) ≥ δ2
(see Equation 47).
Hence, if the best response of airline 1 is to ally and the best response of airline 2 is to mimic
the leader’s strategy, total welfare increases if authorities grant ATI to both carriers.
5.2. Case 2: airline 2 does not ally whatever airline 1 does. A different case is when
whatever airline 1 does, airline 2 is not interested in a deal with airline 4 (region A in Figure
9). Given the equilibrium prices found in the previous section, regulators will be interested
in having one alliance (airline 1) rather than none if Wa1na2 ≥ Wna1,na2. After some algebraic
manipulation, this condition leads to
F (1) ≥ δ (255δ2 − 2028δθ + 4052θ2)
96(δ − 4θ)2> 0(51)
The middle term in (51) is positive for any pair (δ, θ) given the constraints on parameters.9
That means that carrier 1 must benefit from positive synergies in order for the alliance to
be interesting from a welfare point of view.
In the previous section we saw that under this scenario, airline 1 is willing to ally if
Equation (46) holds. Given the set of feasible values for θ and δ, the lowest bound for F (1)
in (46) is positive but smaller than the lowest bound in the welfare condition (51).10 Hence,
small benefits from synergies can trigger cooperation between airlines 1 and 3. However,
we need bigger positive synergies in order to have the agreement welfare improving. In this
case, carrier 1 benefits from positive synergies and more travelers. On the other hand carrier
2 loses traffic, decreasing its profits. As a result, we need higher positive synergies in the
total welfare condition to compensate carrier 2’s losses.
9We plotted the middle term in (51) and saw that the value function is greater than zero for any (δ, θ)
pair satisfying the constraint on parameters (1 ≥ δ > 4θ > 0).10We plotted both functions and compared them.
21
Hence, if the best response of airline 1 is to ally, the decision of airline 2 is not to
coordinate whatever airline 1 does, and condition (51) holds for the generated synergies,
total welfare increases if competition authorities grant ATI to airline 1. If condition (51) is
not satisfied, it is better from a total welfare point of view to ban the alliance.
5.3. Case 3: airline 2 allies whatever airline 1 does. In this case whatever carrier
1 does, carrier 2 is interested in reaching an agreement with the foreign airline 4 (region
C in Figure 9). Again, both alliances would be welfare improving if Wa1a2 ≥ Wna1a2 and
Wa1a2 ≥ Wna1na2. These two conditions hold for positive synergies (F (1) ≥ 0).
Remember that in this scenario airline 1 is willing to ally if the generated synergies
satisfy (48). The lowest value of F (1) for (48) being satisfied is negative, but the total
welfare condition requires positive synergies. As a result, if both carriers’ best response is
to ask for antitrust immunity and the generated synergies are positive, then granting ATI
increases total welfare.
On the other hand, if carrier 1 is not interested in a deal or the alliance synergies are
negative, then competition authorities should be concerned about granting ATI. In this case,
total welfare is greater having one alliance (carrier 2) than two. However, we have to see if
it is better to grant ATI to carrier 2 than not to do so. This case is already discussed in
section (5.2). Since the synergies generated by the alliance of carrier 2 and 4 are assumed
to be equal to zero, condition (51) does not hold. Hence, competition authorities should not
grant ATI to either carrier 1 or carrier 2.
5.4. Case 4: airline 2 follows the opposite to the strategy adopted by airline 1.
In this last case, the best response of carrier 2 is doing the opposite of what carrier 1 does
(region D in Figure 9). That is, if carrier 1 allies, carrier 2 prefers not to ally and vice
versa. In this scenario, the total welfare condition is Wa1,na2 ≥ Wna1,a2, which is equivalent
to F (1) ≥ F (2) = 0. At the same time, we have to see if it is better to have one alliance
than none. We saw in section (5.2) that the only case in which having one alliance is better
than none is when condition (51) is satisfied. Hence, in this scenario competition authorities
should grant ATI to carrier 1 only if Equation (51) holds for the generated synergies, and
none otherwise.
The following proposition summarizes the previous analysis:
Proposition 2: Given the vector (δ, θ) and F (1), with δ ∈ (0, 1] being the parameter that
determines the loyalty of travelers to a carrier, θ ∈ (0, δ4) the parameter that characterizes
the economies of traffic density, and F (1) the possible synergies derived from the alliance:22
(1) If carrier 2’s best response is to mimic the strategy adopted by carrier 1, and carrier
1’s best response is to ask for antitrust immunity, then granting ATI to both carriers
increases total welfare.
(2) If carrier 2 always finds it more profitable to operate on its own, carrier 1’s best
response is to ask for antitrust immunity, and F (1) ≥ δ(255δ2−2028δθ+4052θ2)96(δ−4θ)2 , then
granting ATI to carrier 1 increases total welfare. On the other hand, if F (1) <δ(255δ2−2028δθ+4052θ2)
96(δ−4θ)2 , competition authorities should ban the agreement between carri-
ers 1 and 3.
(3) If carrier 2 always finds it more profitable to ask for antitrust immunity, carrier 1’s
best response is also to ask for antitrust immunity and F (1) ≥ 0, then granting ATI to
both carriers increases total welfare. On the other hand, if carrier 1 is not interested
in a deal or the alliance synergies are negative, then competition authorities should
ban both alliances.
(4) If carrier 2’s best response is to follow the opposite to the strategy adopted by
carrier 1, carrier 1’s best response is to ask for antitrust immunity, and F (1) ≥δ(255δ2−2028δθ+4052θ2)
96(δ−4θ)2 , then granting ATI to carrier 1 increases total welfare. On the
other hand, if F (1) <δ(255δ2−2028δθ+4052θ2)
96(δ−4θ)2 , competition authorities should ban any
type of agreement between carriers.
6. Conclusion
This paper analyzes the mechanisms that lead airlines to apply for an immunized al-
liance (ATI) in international markets. ATI removes restrictions in capacity and pricing on
international markets operated by the allied carriers.
Our sequential game shows that depending on the brand-loyalty of travelers, economies
of traffic density, and the synergies derived from the agreement, carriers might or might not
be interested in looking for an international partner. Moreover, the extent of the alliance
will not only affect the international markets where airlines coordinate, but also the nature
of competition in domestic markets. If economies of traffic density and synergies are not
large relative to the brand-loyalty dispersion of travelers, then allying may not belong to the
equilibrium. This outcome would occur when the leader applies for ATI and then triggers a
price war with competitors, leading to lower expected profits compared to the case where no
one is allied. We also saw that asymmetric equilibria might arise because of the heterogeneity
of carriers with respect to efficiency gains. In such a setting, alliances might offer lower prices.23
However, brand loyalty ensures demand for non-allied companies even if they offer higher
prices.
Welfare analysis suggests that if the efficiency gains are high enough, carriers may be
interested in reaching an agreement, increasing total welfare. However, in some cases the
leader decides to coordinate even if the alliance creates negative synergies, with the objective
of deterring the alliance formation by the follower. In this case, competition authorities
should be concerned about granting ATI to the leader.
Our simple model can accommodate interesting extensions. For instance, further re-
search could study the incentives of airlines to form alliances as a function of the number of
spokes in the domestic market relative to the network of partners in the foreign country. We
expect that the equilibrium behavior of carriers depends on how important the international
demand is with respect to the domestic one. The model can also be extended introducing
other decision variables as frequency of flights.
References
[1] Bilotkach V., (2005): “Price Competition between International Airline Alliances”, Journal of Transport
Economics and Policy, 39(2):167-189.
[2] Brueckner J.K., and Flores-Fillol R., (2007): “Airline Schedule Competition”, Review of Industrial Orga-
nization, 30(3):161-177.
[3] Brueckner J.K., (2003): “International Airfares in the Age of Alliances: The Effects of Codesharing and
Antitrust Immunity”, The Review of Economics and Statistics, 85(1):105-118.
[4] Brueckner J.K., (2001): “The economics of international codesharing: an analysis of airline alliances”,
International Journal of Industrial Organization, 19(10):1475-1498.
[5] Brueckner J.K., and Whalen T., (2000): “The Price Effects of International Airline Alliances”, Journal
of Law and Economics, 43(2):503-545.
[6] Brueckner J.K., and Spiller P.T., (1994): “Economies of Traffic Density in the Deregulated Airline Indus-
try”, Journal of Law and Economics, 37(2):379-415.
[7] Flores-Fillol R., and Moner-Colonques R., (2007): “Strategic Formation of Airline Alliances”, Journal of
Transport Economics and Policy, 41(3):427:449.
[8] Park J., (1997): “The effects of airline alliances on markets and economic welfare”, Transportation
Research-E (Logistics and Transportation Rev), 33(3):181-195.
[9] Jiang C., Wan Y., and D’Alfonso T., (2014): “Strategic Choice of Alliance Membership under Local
Competition and Global Networks”, forthcoming in Journal of Transport Economics and Policy.
[10] Reitzes J., and Moss D., (2008): “Airline alliances and systems competition”, Houston Law Review,
45(2):293-309.
[11] Stuart D., (2006): “International Airline Code Sharing and Entry Deterrence”, Advances in Airline Eco-
nomics, Volume 1.24
[12] U.S. Department of Transportation, Office of the Secretary, (1999): “International Aviation Developments:
Global Deregulation Takes off (First Report)”.
[13] U.S. Department of Transportation, Office of the Secretary, (2000): “International Aviation Developments:
Transatlantic Deregulation: The Alliance Network Effect (Second Report)”.
[14] Whalen T., (2007): “A panel data analysis of code-sharing, antitrust immunity, and open skies treaties
in international aviation markets”, Review of Industrial Organization, 30(1):39-61.
[15] Willig, R., Israel, M., and Keating, B., (2009): “Competitive Effects of Airline Antitrust Immunity”, U.S.
Department of Transportation, DOT-OST-2008-0252, 29-52.
[16] Zhang, A. , and Czerny A., (2012): “Airports and Airlines Economics and Policy: An Interpretive Review
of Recent Research”, Economics of Transportation, 1(1):15-34.
[17] Zhang, A., and Zhang, Y., (2006): “Rivalry between Strategic Alliances”, International Journal of Indus-
trial Organization, 24(2):287-301.
25
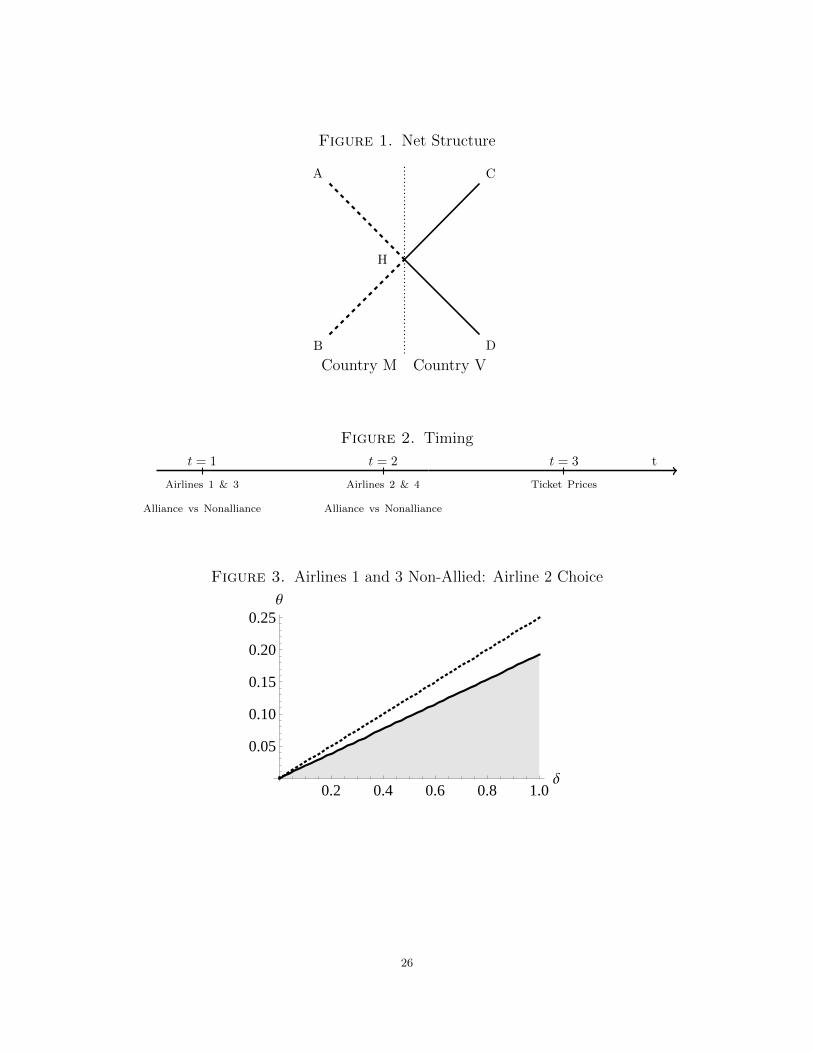
Figure 1. Net Structure
B
H
D
A C
Country M Country V
Figure 2. Timing
Airlines 1 & 3
Alliance vs Nonalliance
t = 1
Ticket Prices
t = 3 tt = 2
Airlines 2 & 4
Alliance vs Nonalliance
Figure 3. Airlines 1 and 3 Non-Allied: Airline 2 Choice
0.2 0.4 0.6 0.8 1.0∆
0.05
0.10
0.15
0.20
0.25Θ
26
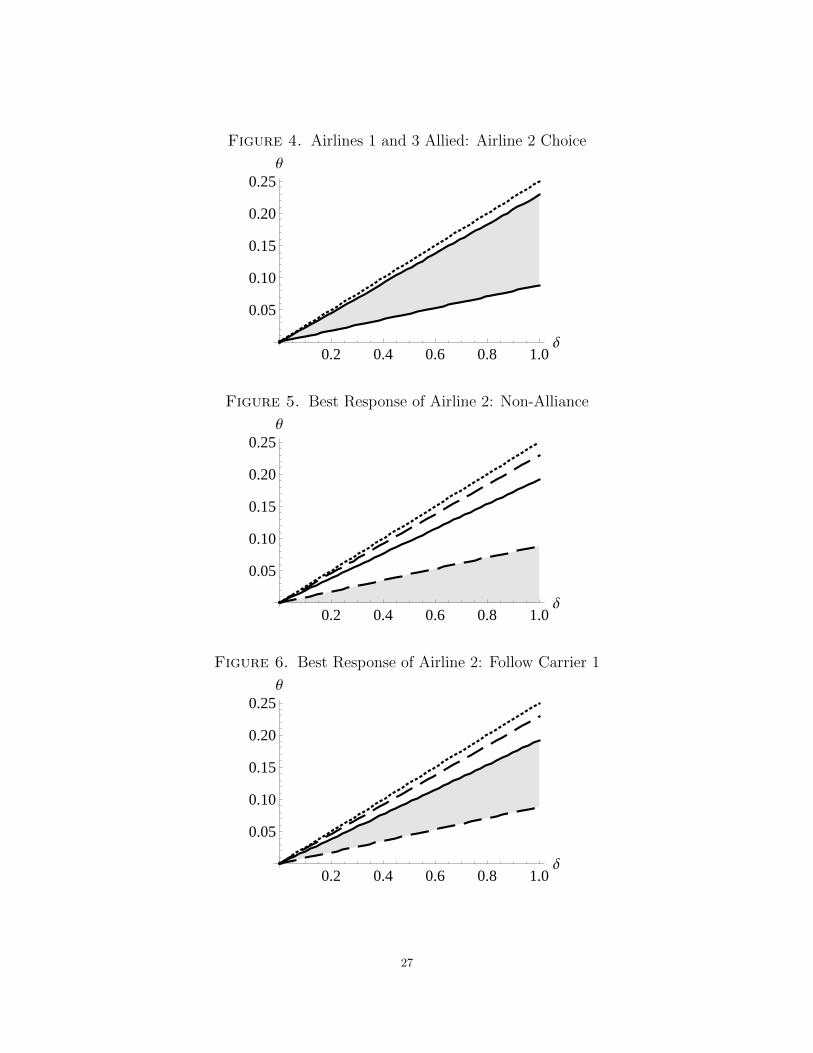
Figure 4. Airlines 1 and 3 Allied: Airline 2 Choice
0.2 0.4 0.6 0.8 1.0∆
0.05
0.10
0.15
0.20
0.25Θ
Figure 5. Best Response of Airline 2: Non-Alliance
0.2 0.4 0.6 0.8 1.0∆
0.05
0.10
0.15
0.20
0.25Θ
Figure 6. Best Response of Airline 2: Follow Carrier 1
0.2 0.4 0.6 0.8 1.0∆
0.05
0.10
0.15
0.20
0.25Θ
27
Figure 7. Best Response of Airline 2: Alliance
0.2 0.4 0.6 0.8 1.0∆
0.05
0.10
0.15
0.20
0.25Θ
Figure 8. Best Response of Airline 2: Opposite Reaction
0.2 0.4 0.6 0.8 1.0∆
0.05
0.10
0.15
0.20
0.25Θ
Figure 9. Best Response of Airline 2
0.2 0.4 0.6 0.8 1.0∆
0.05
0.10
0.15
0.20
0.25Θ
D
C
B
A
28
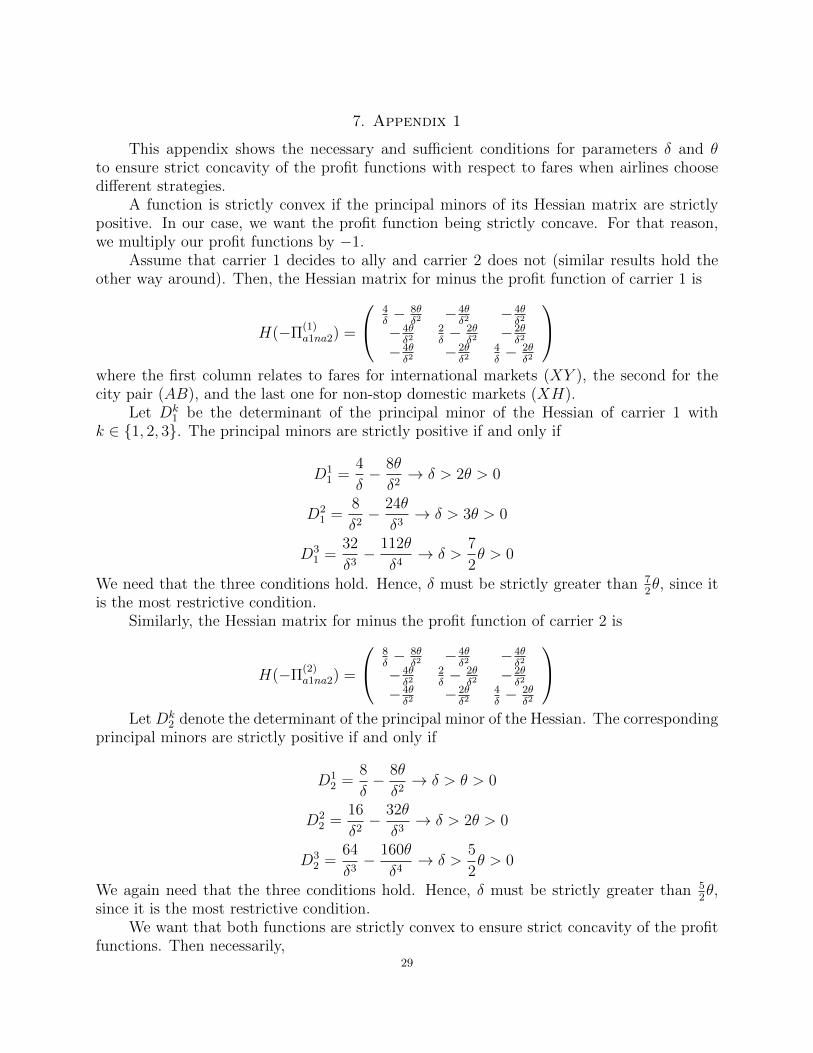
7. Appendix 1
This appendix shows the necessary and sufficient conditions for parameters δ and θto ensure strict concavity of the profit functions with respect to fares when airlines choosedifferent strategies.
A function is strictly convex if the principal minors of its Hessian matrix are strictlypositive. In our case, we want the profit function being strictly concave. For that reason,we multiply our profit functions by −1.
Assume that carrier 1 decides to ally and carrier 2 does not (similar results hold theother way around). Then, the Hessian matrix for minus the profit function of carrier 1 is
H(−Π(1)a1na2) =
4δ− 8θ
δ2−4θδ2
−4θδ2
−4θδ2
2δ− 2θ
δ2−2θδ2
−4θδ2
−2θδ2
4δ− 2θ
δ2
where the first column relates to fares for international markets (XY ), the second for thecity pair (AB), and the last one for non-stop domestic markets (XH).
Let Dk1 be the determinant of the principal minor of the Hessian of carrier 1 with
k ∈ {1, 2, 3}. The principal minors are strictly positive if and only if
D11 =
4
δ− 8θ
δ2→ δ > 2θ > 0
D21 =
8
δ2− 24θ
δ3→ δ > 3θ > 0
D31 =
32
δ3− 112θ
δ4→ δ >
7
2θ > 0
We need that the three conditions hold. Hence, δ must be strictly greater than 72θ, since it
is the most restrictive condition.Similarly, the Hessian matrix for minus the profit function of carrier 2 is
H(−Π(2)a1na2) =
8δ− 8θ
δ2−4θδ2
−4θδ2
−4θδ2
2δ− 2θ
δ2−2θδ2
−4θδ2
−2θδ2
4δ− 2θ
δ2
Let Dk
2 denote the determinant of the principal minor of the Hessian. The correspondingprincipal minors are strictly positive if and only if
D12 =
8
δ− 8θ
δ2→ δ > θ > 0
D22 =
16
δ2− 32θ
δ3→ δ > 2θ > 0
D32 =
64
δ3− 160θ
δ4→ δ >
5
2θ > 0
We again need that the three conditions hold. Hence, δ must be strictly greater than 52θ,
since it is the most restrictive condition.We want that both functions are strictly convex to ensure strict concavity of the profit
functions. Then necessarily,29
δ >7
2θ > 0
For simplicity in computations we are still more restrictive by imposing
δ > 4θ > 0
Finally, to ensure non-negative prices we assume δ ≤ 1. Hence,
1 ≥ δ > 4θ > 0
30


![A History of [Un]Immunized Diseases](https://img.pdfslide.us/doc/110x75/55a75a391a28ab71458b4756/a-history-of-unimmunized-diseases.jpg)