Embed Size (px)
Citation preview

IMMIGRATION, EDUCATION, IMMIGRATION, EDUCATION, AND THE CHANGING AND THE CHANGING SUBURBSSUBURBS
MARCELO M. SUÁREZ-OROZCO, Ph.D.The Richard Fisher Membership Fellow, Institute for Advanced Study, Princeton, NJ & The Courtney Sale Ross University Professor at New York UniversityCo-Director, Immigration Studies @ NYU www.nyu.education/immigration
Changing Suburbs Institute, Manhattanville College
Friday March 5, 2010

Migration and Our Changing Migration and Our Changing Suburbs Suburbs

Culture and IdentityCulture and Identity

http://www.migrationinformation.org/datahub/charts/6.1.shtml
CComparative Transnational omparative Transnational MigrationMigration

The New Immigration and the The New Immigration and the New, New Immigration New, New Immigration Top Countries Top Countries of Birth, 2008of Birth, 2008
Country of Birth 2006 %
1. Mexico 11,534,972 30.8
2. Philippines 1,634,117 4.4
3. India 1,505,351 4.0
4. China 1,357,482 3.6
5. Vietnam 1,116,156 3.0
6. El Salvador 1,042,218 2.8
7. Korea 1,021,212 2.7
8. Cuba 932,563 2.5
9. Canada 847,228 2.3
10. Dominican Republic 764,930 2.0
11. Guatemala 740,986 2.0
12. Jamaica 643,067 1.7
Adapted from Pew Hispanic Center, 2008
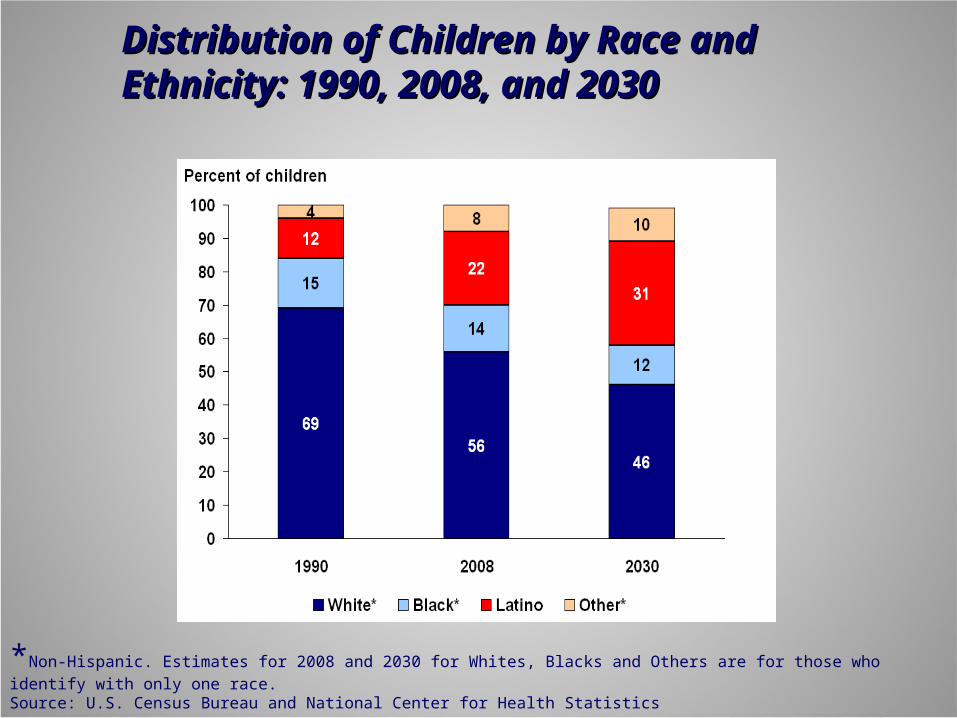
Distribution of Children by Race and Distribution of Children by Race and Ethnicity: 1990, 2008, and 2030Ethnicity: 1990, 2008, and 2030
*Non-Hispanic. Estimates for 2008 and 2030 for Whites, Blacks and Others are for those who identify with only one race.
Source: U.S. Census Bureau and National Center for Health Statistics

Transgenerational Asymmetry Transgenerational Asymmetry Age-Sex Pyramid for Non-Hispanic Whites in the United States, 2006 Age-Sex Pyramid for Non-Hispanic Whites in the United States, 2006 Current Population SurveyCurrent Population Survey
-6 -5 -4 -3 -2 -1 0 1 2 3 4 5 6
0-4
5-9
10-14
15-19
20-24
25-29
30-34
35-39
40-44
45-49
50-54
55-59
60-64
65-69
70-74
75-79
80-84
85+
Male Female

Transgenerational Asymmetry Transgenerational Asymmetry Age-Sex Pyramid for Native-Born Hispanics in the United States, Age-Sex Pyramid for Native-Born Hispanics in the United States, 20062006Current Population SurveyCurrent Population Survey
-10 -9 -8 -7 -6 -5 -4 -3 -2 -1 0 1 2 3 4 5 6 7 8 9 10
0-4
5-9
10-14
15-19
20-24
25-29
30-34
35-39
40-44
45-49
50-54
55-59
60-64
65-69
70-74
75-79
80-84
85+
Male Female

Challenge of Learning EnglishChallenge of Learning English Highly motivated to learn
99% said it was very important to learn English 93% liked learning But 1/3 though it was “very hard”
English is _________~ very important for the future~ important to succeed~ important to get ahead
Open Ended tasks Main impediment for getting ahead in the US? — 56% said English Main impediment for going to college — 45% said English
TAT Card 1-- Many told narratives of struggles of learning
0%
10%
20%
30%
40%
50%
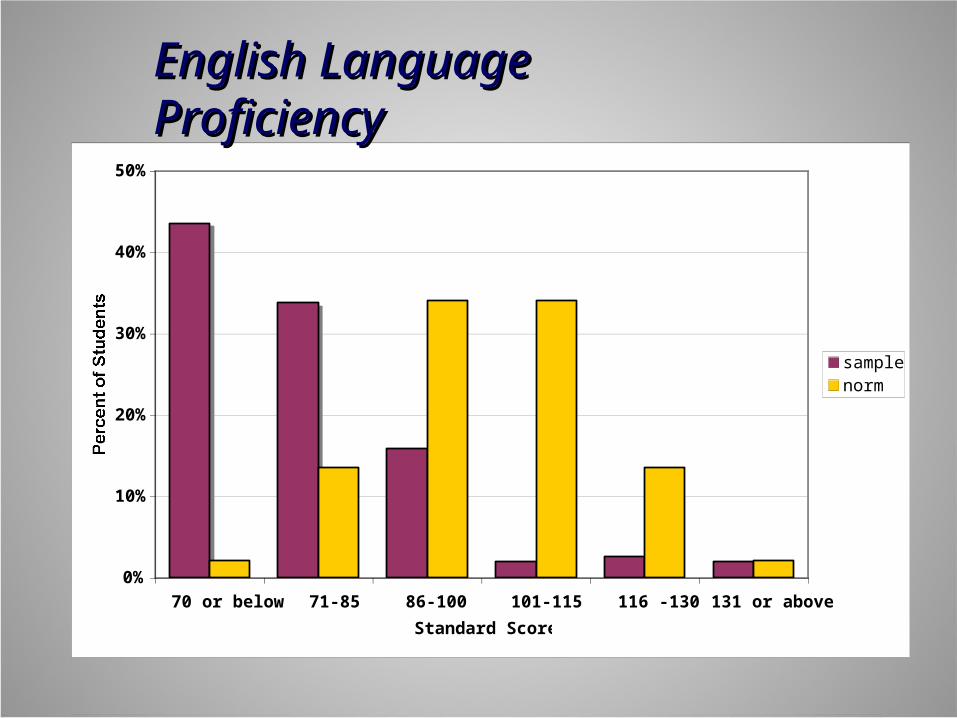
70 or below 71-85 86-100 101-115 116 -130 131 or above
Standard Scores
Percent of Students
samplenorm
English Language English Language ProficiencyProficiency

TATTAT

Academic English Academic English Country Country Comparisons Year 5Comparisons Year 5
English Language Proficiency
0
10
20
30
40
50
60
70
80
90
China DominicanRepublic
Central America Haiti Mexico
Average Standard Score

Academic Performance PathwaysAcademic Performance Pathways
1.00
2.00
3.00
4.00
Low [14.4%] 2.08 1.99 1.58 1.41 1.45
Improving [10.9%] 2.32 2.27 2.34 2.64 3.06
Precipitous Decline [26.8 %]
2.91 2.89 2.55 2.01 1.68
SlowDecline [24.3%]
2.96 3.02 3.02 2.73 2.47
High [23.6 %] 3.47 3.63 3.61 3.50 3.46
Year 1 Mean
Year 2 Mean
Year 3 Mean
Year 4 Mean
Year 5 Mean
A
B
C
D

Characteristics of PathwaysCharacteristics of Pathways Decliners
Less educated parents Attending poor quality schools Gaps in English language proficiency Most family conflict More likely to have protracted separations Endorsed psychological symptoms Undocumented Few supportive school relations Low behavioral engagement Difficulty sustaining incoming hope & drive
Low Achievers Come in with gaps in literacy & schooling Attended worst schools Significant family problems Few supportive school relations Lure of work Never find their academic bearings

Characteristics of PathwaysCharacteristics of Pathways Improving
Initial transplant shock Often had undergone pre-migration trauma Attended better schools than decliners or low achievers More likely to have intact families & working parents More likely to connect with a mentor
High Achievers Most educated parents Least family separations Better family relations Best emotional wellbeing Attended best schools Most supportive school based relationships Best English language skills Highest behavioral engagement

Is Education Relevant to Is Education Relevant to
Immigration?Immigration? Education is now more important than ever before in
human history, it will be more important to immigrants now than in other previous wave in history and the future belongs, literally, to the children of immigrants
Each additional year of school is associated with powerful long-term virtuous cycles including lowered fertility, increased health, and financial well-being
Is College is the new high school?
The problems of today -- from to threats to the environment, war, deep poverty require smarter global solutions -- demanding more of education
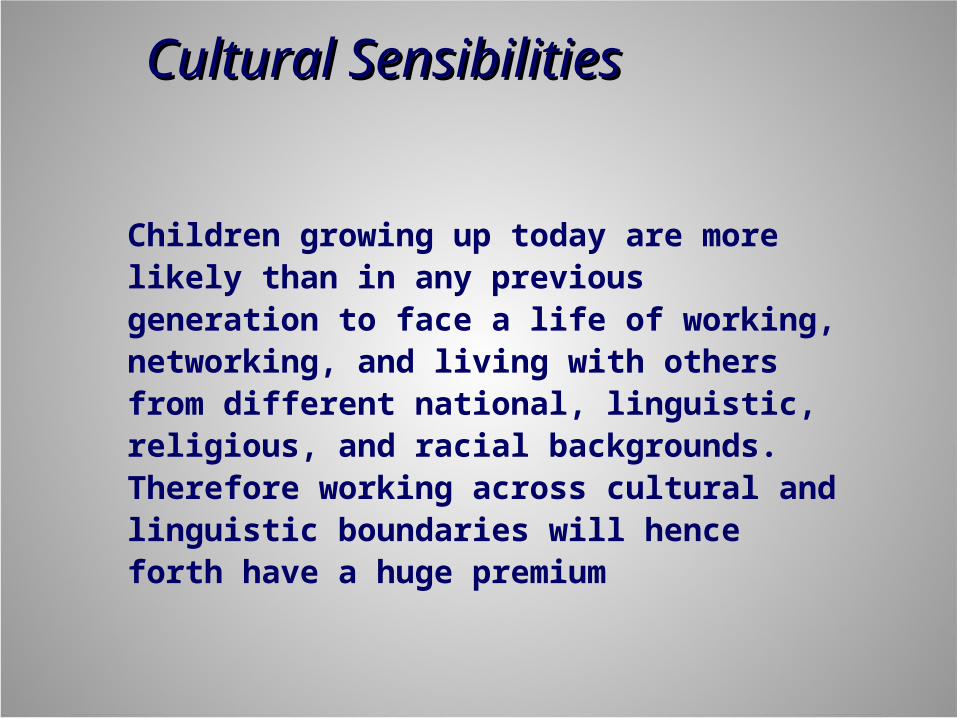
Cultural Sensibilities Cultural Sensibilities
Children growing up today are more likely than in any previous generation to face a life of working, networking, and living with others from different national, linguistic, religious, and racial backgrounds. Therefore working across cultural and linguistic boundaries will hence forth have a huge premium
Paradigm of Complexity Paradigm of Complexity
Managing Complexity in the 21 st Century will require an education for life-long cognitive, behavioral, and relational engagement with the world. The skills needed for identifying, analyzing and mobilizing to solve problems from multiple perspectives will require individuals who are intellectually curious and cognitively flexible, tolerant of ambiguity, able to synthesize knowledge within and across disciplines, culturally and linguistically sophisticated, and able to work collaboratively in groups made up of diverse individuals
Promising Practices with Promising Practices with Immigrant Students Immigrant Students
Language Learning Accommodations
Ease Culture Shock & Negotiating Transitions
Accommodate for longer time required to graduate (for newcomer adolescents)
Accommodations required to prepare for High Stakes Tests
Engage families & communities
Provide Explicit College Pathway Knowledge
Provide Tutoring/After-school/Summer academic supports

An Educational Agenda for All An Educational Agenda for All YouthYouth
Well Grounded in Core Subjects with Strong Language Supports, L1 and L2 Capacity for synthetic and interdisciplinary thinking Consciousness - Global Consciousness Cultural Sensibilities Self-awareness
Health & wellbeing & self-knowledge Critical Thinking & Lifelong Learning Skills Communication Skills
Writing & Public Speaking Collaborative skills
Interpersonal skills and ability to work with those different than oneself Information, Media Skills/ICT Literacy Life Skills
Leadership Adaptability & flexibility Personal accountability & Self-Regulation