Embed Size (px)
Citation preview

©2013 International Monetary Fund
IMF Country Report No. 13/375
UGANDA
FIRST REVIEW UNDER THE POLICY SUPPORT INSTRUMENT
In the context of the First Review Under The Policy Support Instrument, the following documents have been released and are included in this package: Staff Report for the First Review Under The Policy Support Instrument, prepared by a staff team of the IMF for the Executive Board’s consideration on December 18, 2013(LOT), following discussions that ended on November 7, 2013, with the officials of Uganda on economic developments and policies underpinning the IMF arrangement under the Policy Support Instrument. Based on information available at the time of these discussions, the staff report was completed on December 3, 2013.
Informational Annex prepared by the IMF in consultation with the World Bank.
A Press Release including a statement by the Chair of the Executive Board.
The documents listed below has been or will be separately released. Letter of Intent sent to the IMF by the authorities of Uganda*
Memorandum of Economic and Financial Policies by the authorities of Uganda* Technical Memorandum of Understanding* *Also included in the Staff Report
The policy of publication of staff reports and other documents allows for the deletion of market-sensitive information.
Copies of this report are available to the public from
International Monetary Fund Publication Services 700 19th Street, N.W. Washington, D.C. 20431
Telephone: (202) 623-7430 Telefax: (202) 623-7201 E-mail: [email protected] Internet: http://www.imf.org
Price: $18.00 a copy
International Monetary Fund
Washington, D.C.
December 2013
UGANDA
FIRST REVIEW UNDER THE POLICY SUPPORT INSTRUMENT
KEY ISSUES
Growth has continued to recover from the 2011/12 low. In an environment of declining inflation—recently halted by a drought-driven food price shock—the fiscal stimulus has been successful in driving economic activity, and a planned program of infrastructure investment is expected to boost growth further.
Monetary policy was appropriately tightened to abate the impact of the price shock on core inflation. Consolidating its credibility as an inflation-targeting central bank, the Bank of Uganda (BoU) raised the policy rate in reaction to the shock, and subsequently signaled a neutral monetary stance until the updated inflation forecast adjusts to the 5 percent medium-term target. Exchange rate flexibility continued to support the regime.
Construction of two large hydropower projects is expected to address Uganda’s electricity deficit. The economy would absorb these investments with limited impact on inflation and the exchange rate. Nonetheless, efficiency and transparency in managing the projects are crucial to mitigating potential fiscal risks.
The external accounts remain sustainable. The current account deficit declined mainly owing to a temporary slowdown of foreign direct investment (FDI)-related imports. International reserves would remain at a comfortable level despite the high import component of the hydropower projects. External debt will remain at low risk of distress notwithstanding the non-concessional borrowing (NCB) requirements to finance the projects.
The fiscal stance has remained broadly consistent with the program, but spending pressures need to be resisted. With output closer to potential and the recent inflation pickup, expenditure needs to adhere to the budget. Although there is space for raising the domestic debt-to-GDP ratio somewhat this year, it needs to start declining thereafter because domestic debt service accounts for a large share of government revenue.
With satisfactory program performance, staff supports completing the first PSI review and increasing the ceiling on NCB. Quantitative assessment criteria (QAC) were met and structural benchmarks partially observed. Operation of a treasury single account started, public accounting systems were improved, and the central bank was recapitalized. Progress on increasing tax revenues and reducing arrears, however, are key remaining challenges.
December 3, 2013

UGANDA
2 INTERNATIONAL MONETARY FUND
Approved by Roger Nord (AFR) and Dhaneshwar Ghura (SPR)
IMF team: A. L. Coronel (head, senior resident representative), A. Aisen and C. Mira (all AFR), P. Wingender (FAD), and Y. Bal Gündüz (SPR).
Discussions: Held in Washington, D.C. and Kampala October 23–November 7, 2013. The mission met with senior government officials and economic authorities, as well as representatives of the private sector, civil society, the international community, and the media.
CONTENTS
RECENT ECONOMIC DEVELOPMENTS ___________________________________________________________ 4
PROGRAM PERFORMANCE ______________________________________________________________________ 7
ECONOMIC OUTLOOK ____________________________________________________________________________ 7
FISCAL POLICY: EMPHASIS ON INFRASTRUCTURE _____________________________________________ 8 A. Tax Revenue _____________________________________________________________________________________ 8 B. Investment Plans ______________________________________________________________________________ 10 C. Current Spending _____________________________________________________________________________ 12
MONETARY POLICY: DEALING WITH RISING INFLATION ____________________________________ 13
STRUCTURAL REFORMS ________________________________________________________________________ 16
STAFF APPRAISAL ______________________________________________________________________________ 17
BOXES 1. Revenue-Enhancing Plan ________________________________________________________________________ 9 2. Planned Infrastructure Projects and Their Financing Modalities _______________________________ 12 3. Inflation Forecasting Techniques ______________________________________________________________ 14 FIGURES 1. Recent Macroeconomic Developments _________________________________________________________ 5 2. Fiscal Developments and Outlook _______________________________________________________________ 6 3. Monetary and Financial Sector Developments and Outlook___________________________________ 15 TABLES 1. Selected Economic and Financial Indicators, FY2009/10–2017/181 ___________________________ 19 2a. Fiscal Operations of the Central Government, FY2009/10–2017/181 _________________________ 20 2b. Fiscal Operations of the Central Government, FY2009/10–2017/18 __________________________ 21 2c. Quarterly Fiscal Operations of the Central Government, 2013/14 -2014/2015 _______________ 22

UGANDA
INTERNATIONAL MONETARY FUND 3
3. Monetary Accounts, FY2009/10-FY2017/18 ___________________________________________________ 23 4. Balance of Payments, FY2009/10-2017/18 ____________________________________________________ 24 5. Banking Sector Indicators, March 2010-June 2013 ____________________________________________ 25 APPENDIX I. Letter of Intent _________________________________________________________________________________ 40 ATTACHMENTS Attachment I. Memorandum of Economic and Financial Policies ________________________________ 42 Attachment II. Technical Memorandum of Understanding _______________________________________ 53 ANNEX 1. Debt Sustainability Analysis Update ___________________________________________________________ 26

UGANDA
4 INTERNATIONAL MONETARY FUND
RECENT ECONOMIC DEVELOPMENTS 1. With low inflation and slow credit expansion, the economic recovery continued to gain momentum in FY2012/13 (Figure 1).
Real GDP growth was driven by public investment and consumption, exports, and private investment in telecommunications. The contribution of household consumption was negative, affected by low credit growth and declining real wages. Growth is officially estimated at 5¾ percent, higher than projected.
Headline inflation continued its downward trend reaching 3.6 percent in June, but reversed its decline since August driven by drought-related food price increases and picked up to 8 percent in October. Average core inflation rose to 5.9 percent.
The current account deficit declined owing to a temporary slowdown of imports and strong growth in remittances and private transfers. Lower-than-anticipated FDI inflows, possibly related to delays in approval of oil legislation, contributed to a slightly weaker-than-expected reserve accumulation, but import coverage remained high at 3.9 months.
With stubbornly high lending rates, private sector credit remained subdued and largely comprised foreign currency loans to manufacturing, agriculture and construction. Bank capital was raised to meet the new mandatory minimum level, nonperforming loans reversed somewhat the recent increase, and profitability remained high.
2. Fiscal policy drove the growth recovery. The overall deficit in FY2012/13 was slightly more expansive than programmed (Figure 2). Higher-than-anticipated project loans allowed for sustained levels of capital expenditure despite a supplementary budget that shifted the spending composition in favor of current outlays. Execution of the budget during the first quarter of FY2013/14 was faster than expected, notably on domestically financed road construction, but tax revenue is expected to underperform slightly this year as the approved budget omitted measures for about ¼ percent of GDP, including the dismantling of income tax exemptions for agro-processing and some value-added tax (VAT) exemptions and the strengthening of capital gains tax policies. Pressures from civil servants led to a two-year agreement that will compensate workers for past inflation starting next year. Progress on addressing financial impropriety following the end-2012 scandal has improved the outlook for resumption of budget support, possibly starting in the next financial year.
3. The food price hike prompted the BoU to tighten monetary policy for the first time in 22 months. An increase in the inflation forecast as a result of the shock led the BoU to raise the central bank rate (CBR) by 100 basis points to 12 percent in September. The interbank, deposit, and lending rates generally followed the CBR move (Figure 3). In subsequent months, based on modeling and trends in historical data, the BoU monitored the impact of still-high food prices on projected core inflation to detect possible second round effects. On that basis, it kept the CBR constant in October and November. In parallel, the central bank increased the amount of daily dollar purchases

UGANDA
INTERNATIONAL MONETARY FUND 5
in the market to build up international reserves in anticipation of higher public sector imports. The BoU is largely sterilizing these interventions, and the shilling has remained broadly stable.
Figure 1: Uganda: Recent Macroeconomic Developments The economic rebound continues, with services and
industry leading growth.
Despite a significant decline, inflation increased recently
because of a drought.
Private sector credit growth remains subdued. Despite a recent mild deceleration in reserve
accumulation, reserve coverage remains adequate.
The current account deficit declined compared to the
previous FY on account of a less negative trade balance,… … and FDI inflows were lower than expected.
Sources: Ministry of Finance; Bank of Uganda; UBOS; and IMF staff calculations.
-1
0
1
2
3
4
5
6
7
8
2008/09 2009/10 2010/11 2011/12 2012/13
Contribution to GDP growth(percent, y-o-y)
Agriculture Industry Services Indirect Taxes Total
-10
-5
0
5
10
15
20
Inflation Rate(eop)
Headline
Food crops
Core
-10
0
10
20
30
40
50
Jun-
11Ju
l-11
Aug-
11Se
p-11
Oct
-11
Nov
-11
Dec
-11
Jan-
12Fe
b-12
Mar
-12
Apr-
12M
ay-1
2Ju
n-12
Jul-1
2Au
g-12
Sep-
12O
ct-1
2N
ov-1
2D
ec-1
2Ja
n-13
Feb-
13M
ar-1
3Ap
r-13
May
-13
Jun-
13Ju
l-13
Aug-
13Se
p-13
Contribution to Private Credit Growth(percent)
Other
Private consumption
Construction/ real estate
Trade
Manufacturing
Agriculture
0
0.5
1
1.5
2
2.5
3
3.5
4
4.5
5
1500
1700
1900
2100
2300
2500
2700
2900
3100
3300
3500Ja
n-11
Mar
-11
May
-11
Jul-1
1
Sep-
11
Nov
-11
Jan-
12
Mar
-12
May
-12
Jul-1
2
Sep-
12
Nov
-12
Jan-
13
Mar
-13
May
-13
Jul-1
3
Sep-
13
Mon
ths
of im
port
s
Mill
ions
US$
International Reserve Buffers
Gross Reserves (LHS) Months of next year's imports
-5000
-4000
-3000
-2000
-1000
0
1000
2000
2008 2009 2010 2011 2012 2013
Current Account(millions US$)
Goods and services balance Income (net) Current transfers (net)
-500
0
500
1000
1500
2000
2500
3000
2008 2009 2010 2011 2012 2013
Capital and Financial Account(millions US$)
Capital Account Direct investment
Portfolio investment Other investment (net)

UGANDA
6 INTERNATIONAL MONETARY FUND
0
3
6
9
0
3
6
9
Rwanda Uganda Tanzania Kenya SSA average
Burundi
Compensation of Employees in the EAC (2012, general government, percent of GDP)
Figure 2. Uganda: Fiscal Developments and Outlook The fiscal stance was slightly eased in 2012/13,… …and tax revenue remains low.
Compensation of employees in Uganda is below levels in
neighboring countries.
Despite the expected increase, capital expenditure in
Uganda would remain lower than in other EAC countries.
Financing of the deficit is skewed toward external
sources,… …as is government debt.
Sources: Ministry of Finance; WEO and IMF staff calculations.
0
5
10
15
20
25
2008/09 2009/10 2010/11 2011/12 2012/13
Central Government Fiscal Accounts(percent of GDP)
Total revenueTotal spending (excl. exceptional security)Deficit (Incl. grants, excl. exceptional security)
0
5
10
15
20
2008/09 2009/10 2010/11 2011/12 2012/13
Total Revenue(percent of GDP)
Tax revenue Non-tax revenueOil revenue Budget support grantsProject grants
0
2
4
6
8
10
12
14
16
18
1999/00 2002/03 2005/06 2008/09 2011/12 2014/15 2017/18
Capital Expenditure in the EAC(percent of GDP)
Uganda Kenya Tanzania Rwanda Burundi
0
1
2
3
4
5
6
7
8
Fiscal Deficit(percent of GDP)
Domestic financing (net)External financing (net)Total Financing
0
5
10
15
20
25
30
35
40
45
Government Debt(percent of GDP)
Stock of Domestic Public DebtStock of External DebtTotal Debt
UGANDA
INTERNATIONAL MONETARY FUND 7
PROGRAM PERFORMANCE 4. Program performance during the first six months of the PSI has been broadly positive. At 6.6 percent and 5.7 percent in June and September, respectively, 12-month average core inflation was in line with 6.8 and 6 percent foreseen under the PSI inflation consultation clause. The net international reserve floor and the ceiling on net domestic financing for end-June 2013 were also met. Indicative targets on tax revenue (June and September 2013) and on poverty reduction spending were missed in June by small margins of 0.1 and 2 percent of the targets, respectively, without significant impact on the program objectives.
5. Reforms on the structural front have advanced. The first stage of BoU recapitalization was completed. Measures to introduce the treasury single account (TSA), including restructuring bank accounts and payment systems, were launched in October. The Public Finance Management Bill (PFMB) is being discussed by parliament. Meanwhile the Ministry of Finance, Planning and Economic Development (MoFPED) is upgrading the integrated financial management system (IFMS) and the integrated personnel and payroll system (IPPS). Rollout of the latter helped identify ghost workers and pensioners. However, progress on enhancing tax revenues has been slow. The VAT gap analysis was delayed because gathering the necessary input data proved challenging. The practice of running arrears continues, and the commitment to send to cabinet quarterly reports on unpaid bills of nine key ministries was once again missed.1
ECONOMIC OUTLOOK 6. The economic outlook remains favorable but there are risks. Growth is expected to reach 6¼ percent this year and 6½ percent in FY2014/15 with some recovery of private activity as business confidence seems to be improving.2 With output still below potential and low credit growth, the revised inflation forecast points to only a slightly slower convergence to the 5 percent medium-term inflation target. Average core inflation is projected at 6.9 percent in FY2013/14—within the inner upper limit of the consultation band. The construction of roads and electricity infrastructure projects, the start of oil production in 2018, and a renewed emphasis on East African Community (EAC) regional integration bring favorable medium-term growth and external stability prospects. Key challenges remain making growth inclusive by integrating lagging regions to the economy, improving agricultural productivity, and strengthening institutions. Uganda is also vulnerable to political instability in the region and to risks from governance weaknesses, overspending pressures, and capacity constraints.
1 Audited arrears were not available, but preliminary data on unpaid bills points to an accumulation of about 0.2 percent of GDP between June 2012 and March 2013, the latest available data. The authorities have indicated that the end-year stock would be lower. 2 Fitch revised its rating from stable to positive in September on account of prudent macroeconomic policies. However, S&P has maintained a B+/B, negative outlook, since end-2012, when relations with donors became strained.

UGANDA
8 INTERNATIONAL MONETARY FUND
FISCAL POLICY: EMPHASIS ON INFRASTRUCTURE 7. Fiscal policy is expected to continue to support growth. With available fiscal space, the authorities see scope for scaling up public investment. While this expansion would lead to an overall deficit of about 7 percent of GDP in FY 2013/14 (up from 4 percent of GDP in FY 2012/13), the underlying balance, which better reflects demand pressures on the domestic economy because it is measured net of one-off factors, would increase only marginally this year and decline thereafter.3 Staff supported this strategy provided that it is accompanied by a strengthening of tax revenue of 1 percent of GDP in the next two years and financed by a sustainable combination of external and domestic borrowing and the use of government savings earmarked to infrastructure investment, as currently envisaged.
Text Table 1. Uganda: Fiscal Operations of the Central Government, FY 2012/13-2015/16 (Percent of GDP)
A. Tax Revenue
8. The PSI envisages tax revenue enhancement through policy refinements and administration improvements. An increase in tax revenue of ½ percent of GDP a year in the next three years would narrow the gap with the regional average and reduce reliance on borrowing. Some ad hoc revenue measures, notably increasing excise duties on fuels and introducing levies on
3 Capital gain taxes on oil transactions envisaged at the time of the PSI approval are now not expected to materialize this fiscal year owing to procedural delays. Staff discussions also covered plans for FY 2014/15 as an eventual approval of the PFMB this year would bring forward the budget cycle, compelling the authorities to send the budget to parliament in early 2014 (and not mid-year as in the past).
2012/13 2013/14 2014/15 2015/16Total revenue and grants 14.8 15.1 15.8 15.8
Revenue 13.2 13.7 14.3 14.8Tax 12.6 13.1 13.6 14.1
Expenditures 18.2 18.7 18.8 18.6Current expenditures 10.5 10.2 10.6 11.0Development expenditures 7.6 8.4 8.1 7.5Other spending 0.1 0.1 0.2 0.2
Underlying balance (excl. one-off items) -3.4 -3.6 -3.0 -2.8
Net lending and investment 0.7 3.5 2.1 2.2Of which: HPP projects 0.0 3.5 1.7 2.0Of which: Bank of Uganda recapitalization 0.7 0.0 0.4 0.3
Overall balance -4.1 -7.1 -5.1 -5.1
Financing 3.8 7.1 5.1 5.1External financing (net) 2.6 4.2 3.9 4.2Domestic financing (net) 1.3 2.9 1.3 0.9
Government securities 1.4 1.6 1.2 1.0
Errors and Omissions 0.3 0.0 0.0 0.0
Sources: Ugandan authorities and IMF staff estimates and projections.
UGANDA
INTERNATIONAL MONETARY FUND 9
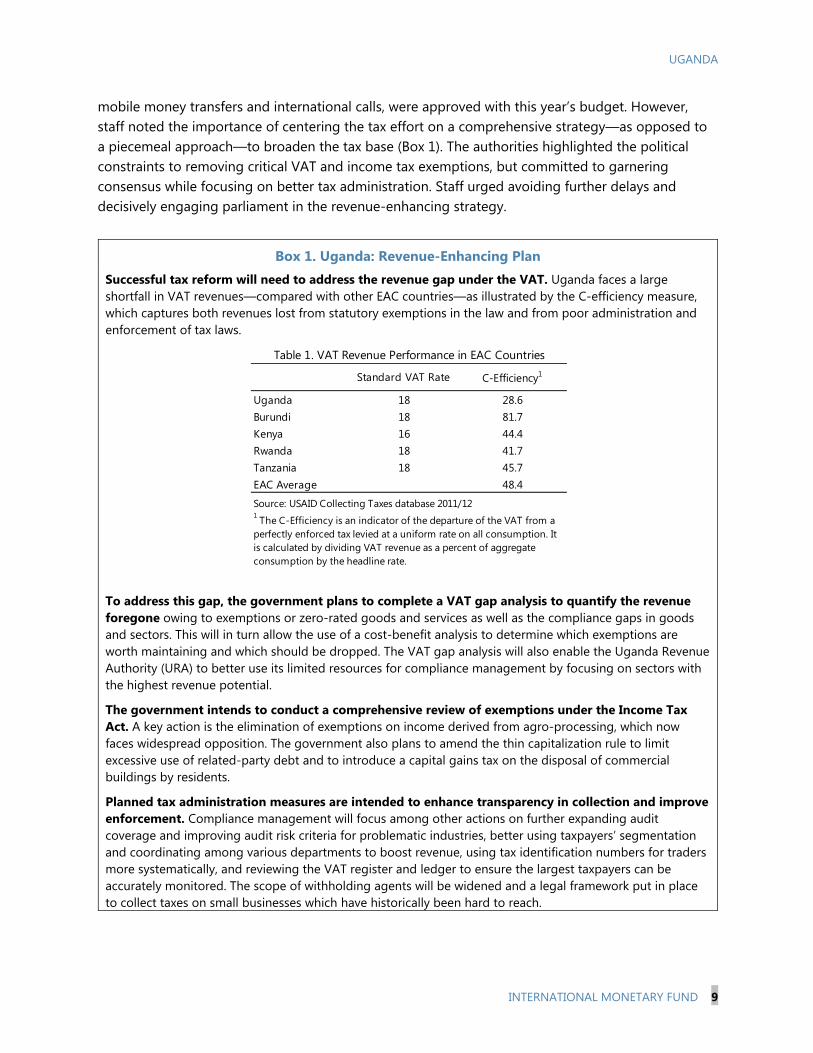
mobile money transfers and international calls, were approved with this year’s budget. However, staff noted the importance of centering the tax effort on a comprehensive strategy—as opposed to a piecemeal approach—to broaden the tax base (Box 1). The authorities highlighted the political constraints to removing critical VAT and income tax exemptions, but committed to garnering consensus while focusing on better tax administration. Staff urged avoiding further delays and decisively engaging parliament in the revenue-enhancing strategy.
Box 1. Uganda: Revenue-Enhancing Plan Successful tax reform will need to address the revenue gap under the VAT. Uganda faces a large shortfall in VAT revenues—compared with other EAC countries—as illustrated by the C-efficiency measure, which captures both revenues lost from statutory exemptions in the law and from poor administration and enforcement of tax laws.
To address this gap, the government plans to complete a VAT gap analysis to quantify the revenue foregone owing to exemptions or zero-rated goods and services as well as the compliance gaps in goods and sectors. This will in turn allow the use of a cost-benefit analysis to determine which exemptions are worth maintaining and which should be dropped. The VAT gap analysis will also enable the Uganda Revenue Authority (URA) to better use its limited resources for compliance management by focusing on sectors with the highest revenue potential.
The government intends to conduct a comprehensive review of exemptions under the Income Tax Act. A key action is the elimination of exemptions on income derived from agro-processing, which now faces widespread opposition. The government also plans to amend the thin capitalization rule to limit excessive use of related-party debt and to introduce a capital gains tax on the disposal of commercial buildings by residents.
Planned tax administration measures are intended to enhance transparency in collection and improve enforcement. Compliance management will focus among other actions on further expanding audit coverage and improving audit risk criteria for problematic industries, better using taxpayers’ segmentation and coordinating among various departments to boost revenue, using tax identification numbers for traders more systematically, and reviewing the VAT register and ledger to ensure the largest taxpayers can be accurately monitored. The scope of withholding agents will be widened and a legal framework put in place to collect taxes on small businesses which have historically been hard to reach.
Standard VAT Rate C-Efficiency1
Uganda 18 28.6Burundi 18 81.7Kenya 16 44.4Rwanda 18 41.7Tanzania 18 45.7EAC Average 48.4
Table 1. VAT Revenue Performance in EAC Countries
1 The C-Efficiency is an indicator of the departure of the VAT from a perfectly enforced tax levied at a uniform rate on all consumption. It is calculated by dividing VAT revenue as a percent of aggregate consumption by the headline rate.
Source: USAID Collecting Taxes database 2011/12

UGANDA
10 INTERNATIONAL MONETARY FUND
B. Investment Plans
9. The authorities will launch the construction of hydroelectric projects and oil-related infrastructure upgrades. At a cost of $2.35 billion spread over the next five years, two hydropower projects, the Karuma and Isimba dams and their related industrial substations, are expected to address the electricity deficit—a critical bottleneck to growth. An additional investment of $200 million on the needed connectivity (e.g. roads, bridges) for the start of oil production in 2018 is also anticipated (Box 2). The World Bank supports these projects because they would lower production costs, enhance trade, and ultimately contribute to poverty reduction. A multiplier analysis shows a growth impact of about 1 percentage point during the construction phase and further gains in potential output from narrowing the infrastructure gap. Given the high import content, the economy is anticipated to absorb the investment without significant impact on inflation or the real exchange rate. However, international reserves are projected to decline in line with the up-front use of the equivalent to $253 million of shilling denominated deposits of the government to cofinance the projects, dropping to 3.5 months of imports in FY2013/14— still an adequate level for Uganda. Excluding such deposit withdrawals, international reserves would increase by $113 million in FY2013/14, keeping the reserve coverage at 3.9 months of imports.4
Text Table 2. Uganda: Financing of Key Infrastructure Projects
10. Based on the information made available to staff, the projects look commercially viable. Independent feasibility studies conducted for the two dams and an updated preliminary cash flow analysis performed by staff based on available information on capital and operating costs and expected production suggests that, in the absence of subsidies to electricity tariffs, the exploitation
4 The revised TMU incorporates an adjustor to the NIR target such as if deposit withdrawals fall short of projections owing to delays in projects or foreign currency inflows to the petroleum fund the NIR accumulation floor will be adjusted upward (TMU ¶20-21).
Cost EF&PF 1 NCB PPP
Karuma hydro power project 1.7 0.3 1.4
Isimba hydro power project 0.6 0.1 0.5
Industrial substations for transmission 0.1 0.1
Oil-related infrastructure projects 0.2 0.2
Kampala-Mpigi highway 0.4 0.4
Kampala-Jinja highway 0.5 0.5
Total 3.5 0.3 2.2 0.9
1 Drawdown of the Energy Fund and the Petroleum Fund.
Financing Modality
(Billions of US$)
Source: Ugandan authorities.

UGANDA
INTERNATIONAL MONETARY FUND 11
of the dams would allow recovery of the bulk of the investment and financial costs.5 Nonetheless, the budget may need to cover interest payments during the construction period. To address concerns about preexisting operating losses of the electricity generation and transmission companies, the authorities indicated they will create a performance-oriented special unit within the companies to manage the new projects and ensure their viability. They also intend to implement institutional reforms in the electricity sector in the medium term.
11. Changes in project financing modalities would result in higher NCB than earlier envisaged. At the time of PSI approval, Karuma was expected to be financed with government savings and issuance of domestic debt. The Isimba dam and the road program were to be financed with NCB. The financing modalities have changed as now a Chinese company and China Eximbank will construct and finance 85 percent of both projects. The remaining 15 percent, as well as any insurance and fees, are to be financed by a drawing of government savings. At the same time, use of public-private partnership (PPP) schemes instead of NCB is now envisaged for the road program. All together, these plans would require an increase in the NCB ceiling from $1.5 billion to $2.2 billion, which the authorities have requested.
12. Based on economic considerations, staff supported the request to increase NCB to finance the projects. First, the projects are macro critical, they look commercially viable if well managed, and are consistent with the absorptive capacity of the economy. Second, external debt would remain at low levels of distress with an estimated increase in the NPV of external debt of 8¾ percent of GDP (Annex 1 in the DSA).6 Third, it is unlikely that the required financing could be mobilized from concessional sources given the size of the projects. Fourth, the terms of financing, still under negotiation, would likely involve a combined grant element of at least 10 percent, resulting in lower costs than floating a market bond or issuing domestic debt. Fifth, concerns about weak implementation capacity are mitigated by the recent favorable experience with road construction.
13. Nonetheless, staff warned the authorities about possible risks. The planned borrowing is large and subject to delays in implementation that could raise costs, suboptimal public financial management that could derail funds and still weak institutional arrangements that could raise fiscal liabilities. Furthermore, the potential volatility in financing terms in international markets could raise debt service costs. Staff urged the MoFPED to ensure efficiency and transparency in the management of the projects, including by institutional building of the electricity companies, as well as by publishing feasibility studies, terms of the contracts, and cash flows of financing and operations. Moreover, the investment program and its financing modalities must be included in the
5 Feasibility studies have also been conducted for the highways, but not yet for the oil-related infrastructure projects. 6 Uganda is expected to receive substantial inflows from oil revenue starting in 2018, which would further improve the debt outlook. A scenario that reflects the planned cross-border railway connecting landlocked Uganda and Rwanda to the Mombasa port also maintains debt at low levels of distress.

UGANDA
12 INTERNATIONAL MONETARY FUND
medium-term fiscal strategy to ensure efficiency in electricity generation, transmission, and distribution and guarantee the envisaged cost recovery.
C. Current Spending
14. Staff made the case for resisting pressures and limiting current spending to sustainable levels. Compensating civil servants in FY2014/15 for the decline in purchasing power of salaries is warranted given that past increases have not kept up with inflation, and the overall wage bill is below levels in neighboring countries (Figure 2). Nonetheless, staff emphasized the need to accompany these increases with a strengthening in tax revenue mobilization consistent with the plan supported by the PSI, and with a medium-term civil service reform ideally supported by development partners. On spending related to the forthcoming presidential and legislative elections, the authorities intend to limit it to essential outlays. Staff urged avoiding squeezing resources available for development spending. Staff also supported a renewed interest to move faster with the plan of issuing the long awaited national identification cards and accommodate the related spending in the budget.
Box 2. Uganda: Planned Infrastructure Projects and Their Financing Modalities
Hydropower plants. The 600 MW Karuma dam will double current production capacity. Construction is expected to start in FY2013/14 and take five years, at a cost of $1.7 billion. Uganda would finance 15 percent from its savings in the oil and energy funds and borrow the rest non-concessionally from China. At the smaller Isimba hydropower plant ($570 million) construction would also start in FY2013/14 with Chinese involvement and a similar financing scheme.
Roads. The program mainly includes construction of roads linking Kampala with Jinja and with Mpigi, expected to start in FY2013/14 and be completed in five years at a cost of about $500 million each. With support from International Finance Corporation (IFC), the authorities are working on the design of PPPs to finance and manage these highways.
Regional railway. To step up progress towards regional integration, a new railway between Kenya, Rwanda and Uganda is being planned. Total costs would reach $13 billion, with a Ugandan share of $3 billion. Discussions on execution and financing are at an early stage.
Refinery and pipeline. Construction is planned to start in FY2015/16, and total capital expenditure is estimated at $15–20 billion financed primarily through FDI. The government would increase external borrowing only marginally to meet its expected equity commitments. In preparation, an investment of about $200 million in oil-related infrastructure works, financed from non-concessional sources, is planned.

UGANDA
INTERNATIONAL MONETARY FUND 13
MONETARY POLICY: DEALING WITH RISING INFLATION 15. Discussions centered on the potential impact of ongoing food price increases and fiscal spending pressures on the policy rate. While the pass-through to core inflation has so far been moderate, the BoU acknowledged potential second-round effects if the shock persists. This risk was viewed as being mitigated by the remaining output gap and likely effect on demand of the September CBR hike. On this basis, the BoU is expected to keep an unchanged policy stance in the next few months, but it emphasized its willingness to tighten policies if incoming data suggest a rise in core inflation.
16. Staff supported the BoU’s stance, but stressed the importance of being prepared to respond to developments in the fiscal front. In particular, the BoU’s announced foreign exchange purchasing plan is expected to help offset the impact on international reserves of the government’s infrastructure financing needs. Staff emphasized the need to continue to communicate clearly to the market the rationale for such purchases and fully sterilize them—allowing interest rates to adjust accordingly—in line with the inflation objective. Staff also recommended maintaining a close watch over base money developments in line with the program indicative target, without distracting attention from the need to ensure sound implementation of the authorities’ inflation targeting lite regime.
17. Ongoing refinements in operational and institutional arrangements to support inflation targeting are crucial in consolidating the BoU’s credibility. Improvements in inflation forecasting techniques are proving a useful tool in assessing the sources of inflation and the impact of shocks (Box 3). Staff recommended adapting the BoU’s organization and processes to the IT framework, including through revisions of the decision-making process, improvements in communication, and legal amendments of the BoU Act to strengthen central bank independence. A macro-critical element within these reforms is the completion of central bank recapitalization to further bolster the BoU’s credibility and align its capital to monetary liabilities, providing the BoU with needed additional marketable securities of diverse maturities to be used in monetary policy operations. A serious streamlining of the BoU’s non-monetary policy related costs is at the center of this decision, and ongoing negotiations between the MoFPED and the BoU point to gradual capital injections in the next few years (structural benchmark).

UGANDA
14 INTERNATIONAL MONETARY FUND
Box 3. Uganda: Inflation Forecasting Techniques The BoU is refining its forecasting system. The Forecasting and Policy Analysis System (FPAS) incorporates a model with four behavioral equations to project real GDP, inflation, real interest rate, and real exchange rate—all in terms of deviations from equilibrium levels. In its basic form, the model includes an aggregate demand or IS curve for real GDP; a price-setting or Phillips curve; an uncovered interest parity condition for the exchange rate; and a Taylor rule for setting the policy rate as a function of the output gap and expected inflation. The model does not explain movements in equilibrium real output or in real exchange rates or interest rates. Rather, these are taken from filtering methodologies and judgmental analysis. The transparency and simplicity of the model is an advantage.
The model incorporates features to account for country-specific characteristics. In particular, it disaggregates food and oil prices, both of which have traditionally exerted pressures on inflation; and differentiates between non-core and core inflation to allow for quick detection of second round effects. Another attractive application of the model is its ability to identify trends in historical data and detect the impact of shocks to get deeper insights about inflation drivers.
Most inflation variability is related to a few determinants. In the last several years, the exchange rate and food prices have been the main determinants of inflation. Delayed responses to these shocks are likely to have a toll on inflation by leaving inflation expectations unanchored.
Inflation (YoY) Historical Decomposition of Shocks (2006-2013)

UGANDA
INTERNATIONAL MONETARY FUND 15
Figure 3. Uganda: Monetary and Financial Sector Developments and Outlook
Movements in the CBR affect the interbank rates… …and also other interest rates.
Despite the negative accumulation in the fourth quarter, the
NIR target was met.
The financial sector continues to be well capitalized,
profitable, and liquid.
Inflation forecasts are aligned to the 5% core inflation target
in the medium term,… …consistent with growth of reserve money and M2.
Sources: Bank of Uganda; and IMF staff calculations.
0
5
10
15
20
25
Jun-12 Sep-12 Dec-12 Mar-13 Jun-13 Sep-13
Central Bank and Interbank Rate
7-day interbank rateCentral bank rate
0
10
20
30
40
0
10
20
30
40
Jul-11 Jan-12 Jul-12 Jan-13 Jul-13
Interest Rate Structure
Lending Rate CB Rate91 Day T-bill 364 Days T-billTime Deposits 7 Day InterbankOverall Interbank
-100
0
100
200
300
400
500
Sep-12 Dec-12 Mar-13 Jun-13 Jun-13, Annual
Adjusted
Net International Reserves: Targets and Actuals June 2012 - June 2013
Target Actual
Quarterly Change Annual Change
6th Rev.
6th Rev.
6th Rev.
6th Rev.
6th Rev.
5th Rev.
0
5
10
15
20
25
30
35
40
45
2010Q4 2011Q2 2011Q4 2012Q2 2012Q4 2013Q2
Selected Financial Sector Indicators, Dec 2010-June 2013
Regulatory Capital (percent of risk-weighted assets)Return on equity (percent)Liquid assets (percent of total deposits)
0
2
4
6
8
10
12
0
2
4
6
8
10
12
Jun-
13
Sep-
13
Dec
-13
Mar
-14
Jun-
14
Sep-
14
Dec
-14
Mar
-15
Jun-
15
Core inflation forecast, June 2013-June 2015(annual y-o-y percentage change)
Medium Term Target Target bounds
Inflation consultation Updated Forecast 0
1
2
3
4
5
6
7
8
9
0
5
10
15
20
25
Jun-
13
Aug-
13
Oct
-13
Dec
-13
Feb-
14
Apr-
14
Jun-
14
Aug-
14
Oct
-14
Dec
-14
Feb-
15
Apr-
15
Jun-
15
Reserve Money and M2 June 2012 - June 2015(billions of Uganda Shillings)
Reserve Money
M2 (RHS)

UGANDA
16 INTERNATIONAL MONETARY FUND
STRUCTURAL REFORMS 18. Follow–up discussions on the following main topics took place:
PFM and arrears management. Efforts to increase budget credibility are underway. The TSA is expected to become operational soon and the MoFPED—with support from a U.S. Treasury advisor—plans to set up cash and debt management units. Staff urged avoiding a supplementary budget this year, paying bills timely, and reducing the stock of arrears—all aspects that require substantial progress. The government is confident that IFMS and IPPS improvements, complemented by the ongoing imposition of sanctions, will result in arrears reduction, and they introduced an indicative target in the program to reflect this commitment. Despite some parliamentary resistance, the authorities expect approval of the PFMB in the next few months and plan to start preparing for its implementation.
Improving legal frameworks to increase transparency. Staff welcomed the approval of the Anti-Money Laundering Act aimed at improving financial transparency, fighting tax evasion and corruption. It recommended a well thought out and careful approach to the envisaged PPP Law to ensure efficiency in project implementation and minimize contingent liabilities.
Deepening financial markets and supervision. The weak intermediation role of banks (with credit under 15 percent of GDP) calls for efforts to deepen the sector and make it more inclusive. The authorities explained that recent actions to reduce information asymmetries, improve financial literacy and regulate the growing mobile money industry (with a total transaction value equivalent to about 30 percent of GDP) to mitigate potential operational risks are expected to bear fruit soon. They are also closely monitoring foreign exchange lending to un-hedged borrowers and are prepared to upgrade their prudential and supervisory tools in case currency mismatch risks arise.
Progress on EAC Integration. Rwanda, Kenya, and Uganda agreed on a single customs territory in October and have discussed regional infrastructure plans with clear opportunities for economies of scale in the water, power, transport, and oil sectors. Aided by an open capital account, Uganda has made progress on meeting its commitments under the customs union and common market protocols. Nonetheless, some non-tariff barriers persist such as cumbersome procedures for testing goods, unnecessary weigh bridge stations, restrictions on imports of beef, and difficulties in issuing rule of origin certificates. The issuance of national identity cards is expected to facilitate free movement of workers, and the authorities are committed to homogenizing regimes on access to property and on licensing and registration requirements.

UGANDA
INTERNATIONAL MONETARY FUND 17
STAFF APPRAISAL 19. Policies continue to support the economic recovery. Mainly driven by public investment, growth continues its successful return to potential. Nonetheless, the private sector’s contribution to the expansion is still sluggish as highly leveraged corporations are delaying investment plans owing to a fall in real incomes, worsening terms of trade, and credit constraints from the damaging impact of high lending rates on bank balance sheets. Ongoing efforts to improve the business environment should underpin further private investment.
20. Action to control inflation in the face of recent food price hikes is commendable. The BoU struck the right balance between signaling its commitment to low inflation, avoiding excessive exchange rate volatility, and keeping consistency with the fiscal policy stance. The BoU’s action to accumulate international reserves should also be helpful in meeting anticipated needs related to government infrastructure investment, but it will be important to ensure that these interventions are fully sterilized and to allow interest rates to adjust in response to fiscal and other developments in a manner consistent with meeting the inflation objective. Institutional reforms to strengthen inflation targeting, including streamlining the BoU’s non-monetary policy related costs to secure the needed recapitalization and gain independence, are essential.
21. While accommodating important infrastructure plans, fiscal policy needs to be supportive of low inflation. The planned electricity and road projects are consistent with fiscal and debt sustainability and critical to closing the infrastructure gap and contributing to job creation and poverty reduction. To ensure efficient use of resources—largely borrowed—it is imperative that projects be subject to timely implementation, strong financial practices, transparent management of funds, and an appropriate cost recovery strategy. Since infrastructure spending will use large fiscal space, it is also essential that the MoFPED closely coordinates with the BoU the pace of other spending to prevent an upsurge of domestic debt beyond the expected levels.
22. The tax revenue enhancement strategy, a key pillar of the program, has suffered some setbacks that need to be overcome soon. The authorities are encouraged to build consensus to remove tax exemptions that have outlived their usefulness, and bring the tax-to-GDP ratio closer to regional levels. A broader tax base will reduce reliance on borrowing and donor financing.
23. Progress in strengthening PFM systems and governance is welcome but challenges remain. The introduction of a TSA and upgrade of accounting systems should help improve efficiency and deter mishandling of public funds. However, accumulation of payment arrears is a serious concern because it hampers policy analysis and creates perceptions of weak governance. The authorities are therefore encouraged to implement their commitments to reinforce control over unpaid bills, issue national identification cards, and publish unspent balances of government accounts. Approval of the PFMB is critical to ensuring sound management of revenues and the budget process.

UGANDA
18 INTERNATIONAL MONETARY FUND
24. Staff recommends completing the first review of the PSI. The attached MEFP outlines the macroeconomic objectives and policies for the period ahead and proposes rescheduling some structural benchmarks to take account of ongoing progress. To reflect recent economic developments and outlook, modifications are proposed to the end-December 2013 Quantitative Assessment Criteria and end-March 2014 targets, and an increase from $1.5 billion to $2.2 billion in the NCB limit is recommended. These amendments mainly reflect the impact on the fiscal and external accounts of the use of government resources to finance the envisaged large infrastructure projects.

Table 1. Uganda: Selected Economic and Financial Indicators, FY2009/10–2017/181
6th Rev Est. 6th Rev Proj. Proj. Proj. Proj. Proj.
GDP and prices (percent change)Real GDP 5.9 6.6 3.4 5.3 5.8 6.0 6.2 6.5 7.1 7.2 7.2GDP Deflator 9.5 5.0 24.1 7.3 4.7 5.8 7.8 6.9 4.7 4.8 5.0CPI (end of period) 4.2 15.7 18.0 5.7 3.6 5.7 7.6 6.3 5.0 5.0 5.0CPI (average) 9.4 6.5 23.5 6.0 5.8 6.2 7.9 6.9 5.0 5.0 5.0Core inflation (average) 7.8 6.3 24.6 6.8 6.6 6.3 6.9 5.7 5.0 5.0 5.0Core inflation (end of period) 4.6 12.1 19.6 6.7 5.8 5.2 6.7 5.3 5.0 5.0 5.0
External sector (percent change)Terms of trade (based on all exports, deterioration -) -8.1 4.3 1.6 -0.5 1.0 -1.7 -3.7 -3.3 -2.0 -0.4 -0.3Real effective exchange rate (depreciation –) 4.8 -0.9 4.5 … 5.4 … … … … … …
Money and credit (percent change)Broad money (M3) 33.2 25.7 7.2 10.3 6.6 16.1 11.3 16.3 13.4 13.6 14.9Private sector credit 30.6 43.6 11.5 14.5 6.4 15.1 15.4 14.4 12.8 13.6 13.8Bank of Uganda's policy rate2 … … 20.0 11.0 11.0 … … … … … …
Savings and investment gap (excluding grants, percent of GDP) -10.8 -13.1 -14.5 -10.7 -10.3 -12.6 -13.8 -12.7 -13.2 -12.6 -11.1Gross Domestic Savings 12.6 11.9 10.1 … 14.3 … 14.6 13.4 13.7 13.5 14.8Domestic investment 23.5 25.0 24.6 26.1 24.5 27.9 28.1 26.9 27.4 26.8 26.7
Public 5.6 5.9 5.7 5.8 6.1 8.1 9.2 7.9 7.6 7.2 6.9Private 17.9 19.1 18.8 20.2 18.4 19.8 19.0 19.1 19.8 19.6 19.8
External sector (percent of GDP)
Current account balance (including grants) -9.5 -11.8 -13.3 -10.4 -9.9 -12.2 -13.4 -12.4 -13.0 -12.4 -10.8Current account balance (excluding grants) -10.8 -13.1 -14.5 -10.7 -10.3 -12.6 -13.8 -12.7 -13.2 -12.6 -11.1Public external debt (including IMF) 13.6 17.3 16.2 17.0 17.5 20.3 20.2 22.6 25.4 26.2 26.9External debt-service ratio3 1.8 1.4 1.4 1.6 1.5 1.8 1.6 1.9 2.3 2.7 3.0
Government budget and debt (percent of GDP)Revenue 12.2 16.2 13.2 13.0 13.2 15.0 13.7 14.3 14.8 15.1 15.4Total expenditure and net lending 19.6 22.8 18.5 18.6 18.9 20.2 22.2 21.0 20.8 20.0 19.5Overall balance (including grants) -4.9 -4.3 -3.0 -3.9 -4.1 -3.6 -7.1 -5.1 -5.1 -3.9 -3.2Overall balance (excluding grants) -7.3 -6.6 -5.3 -5.6 -5.8 -5.2 -8.5 -6.7 -6.1 -4.8 -4.1Net Domestic Financing 2.1 3.4 0.0 1.5 1.3 1.7 2.9 1.3 0.9 0.9 0.4Public Domestic Debt 9.3 13.7 13.4 13.0 15.4 12.7 14.7 14.3 13.8 12.7 11.4
Memorandum items:Nominal GDP (Ush billions) 34,909 39,086 50,172 56,287 55,574 63,122 63,679 72,474 81,267 91,233 102,678Nominal GDP (US$ millions) 17,206 16,822 19,620 21,689 21,448 … … … … … …Average exchange rate (Ush/US$) 2,029 2,323 2,557 2,595 2,591 … … … … … …End of period exchange rate (Ush/US$) 2,283 2,623 2,472 2,631 2,593 … … … … … …Gross foreign exchange reserves (US$ millions) 2,385 2,044 2,644 3,044 2,912 3,264 2,772 3,102 3,502 3,832 4,182
(months of next year's imports of goods and services) 4.2 3.2 4.2 4.2 3.9 4.1 3.5 3.6 3.9 4.0 4.0
Social and poverty indicators Population: 34.1 million in 2012; GDP per capita of US$487 in 2011; Population below poverty line of 24.5 percent
Sources: Ugandan authorities and IMF staff estimates and projections.
1 Fiscal year runs from July 1 to June 30.
3 Percent of exports of goods and nonfactor services.
2012/13
2 The CBR was introduced following the start of Inflation Targeting Lite in July 2011. End of year CBR.
2009/10 2010/11 2011/12 2013/14 2014/15 2015/16 2016/17 2017/18
UG
AND
A
INTERN
ATION
AL MO
NETARY FU
ND
19
UGANDA
20 INTERNATIONAL MONETARY FUND
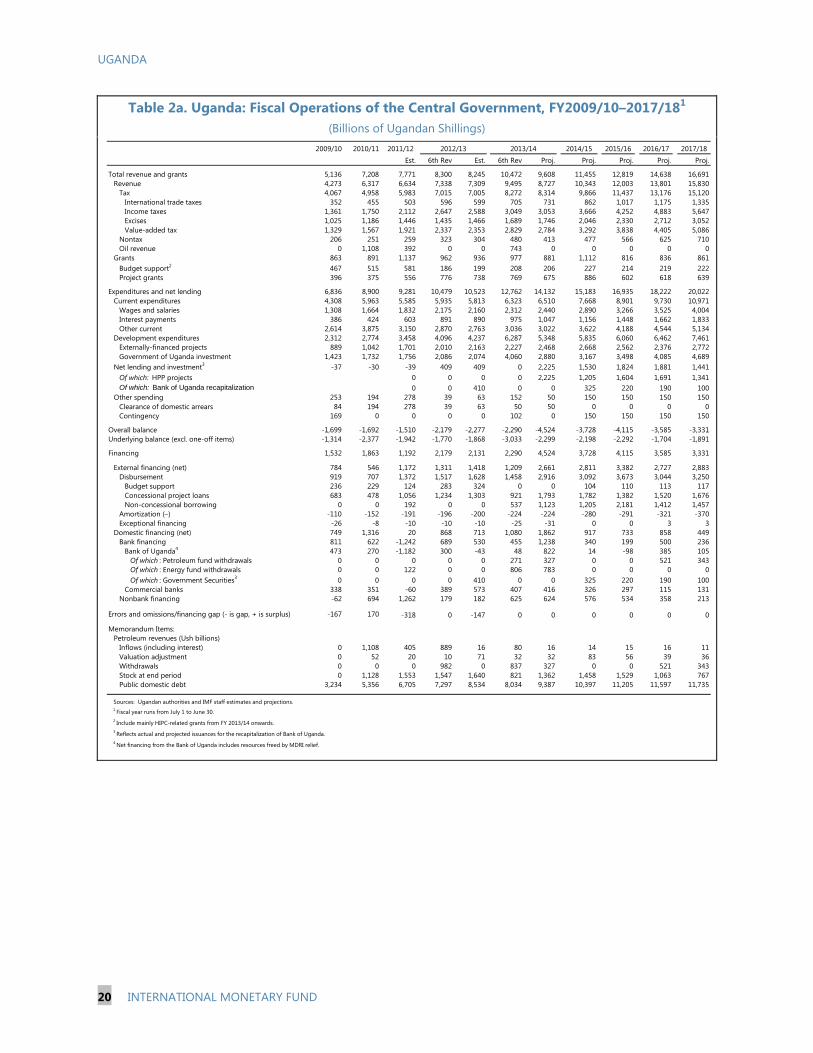
Table 2a. Uganda: Fiscal Operations of the Central Government, FY2009/10–2017/181
(Billions of Ugandan Shillings)
Est. 6th Rev Est. 6th Rev Proj. Proj. Proj. Proj. Proj.
Total revenue and grants 5,136 7,208 7,771 8,300 8,245 10,472 9,608 11,455 12,819 14,638 16,691Revenue 4,273 6,317 6,634 7,338 7,309 9,495 8,727 10,343 12,003 13,801 15,830
Tax 4,067 4,958 5,983 7,015 7,005 8,272 8,314 9,866 11,437 13,176 15,120International trade taxes 352 455 503 596 599 705 731 862 1,017 1,175 1,335Income taxes 1,361 1,750 2,112 2,647 2,588 3,049 3,053 3,666 4,252 4,883 5,647Excises 1,025 1,186 1,446 1,435 1,466 1,689 1,746 2,046 2,330 2,712 3,052Value-added tax 1,329 1,567 1,921 2,337 2,353 2,829 2,784 3,292 3,838 4,405 5,086
Nontax 206 251 259 323 304 480 413 477 566 625 710Oil revenue 0 1,108 392 0 0 743 0 0 0 0 0
Grants 863 891 1,137 962 936 977 881 1,112 816 836 861Budget support2 467 515 581 186 199 208 206 227 214 219 222Project grants 396 375 556 776 738 769 675 886 602 618 639
Expenditures and net lending 6,836 8,900 9,281 10,479 10,523 12,762 14,132 15,183 16,935 18,222 20,022Current expenditures 4,308 5,963 5,585 5,935 5,813 6,323 6,510 7,668 8,901 9,730 10,971
Wages and salaries 1,308 1,664 1,832 2,175 2,160 2,312 2,440 2,890 3,266 3,525 4,004Interest payments 386 424 603 891 890 975 1,047 1,156 1,448 1,662 1,833Other current 2,614 3,875 3,150 2,870 2,763 3,036 3,022 3,622 4,188 4,544 5,134
Development expenditures 2,312 2,774 3,458 4,096 4,237 6,287 5,348 5,835 6,060 6,462 7,461Externally-financed projects 889 1,042 1,701 2,010 2,163 2,227 2,468 2,668 2,562 2,376 2,772Government of Uganda investment 1,423 1,732 1,756 2,086 2,074 4,060 2,880 3,167 3,498 4,085 4,689
Net lending and investment3 -37 -30 -39 409 409 0 2,225 1,530 1,824 1,881 1,441Of which: HPP projects 0 0 0 0 2,225 1,205 1,604 1,691 1,341Of which: Bank of Uganda recapitalization 0 0 410 0 0 325 220 190 100
Other spending 253 194 278 39 63 152 50 150 150 150 150Clearance of domestic arrears 84 194 278 39 63 50 50 0 0 0 0Contingency 169 0 0 0 0 102 0 150 150 150 150
Overall balance -1,699 -1,692 -1,510 -2,179 -2,277 -2,290 -4,524 -3,728 -4,115 -3,585 -3,331Underlying balance (excl. one-off items) -1,314 -2,377 -1,942 -1,770 -1,868 -3,033 -2,299 -2,198 -2,292 -1,704 -1,891
Financing 1,532 1,863 1,192 2,179 2,131 2,290 4,524 3,728 4,115 3,585 3,331
External financing (net) 784 546 1,172 1,311 1,418 1,209 2,661 2,811 3,382 2,727 2,883Disbursement 919 707 1,372 1,517 1,628 1,458 2,916 3,092 3,673 3,044 3,250
Budget support 236 229 124 283 324 0 0 104 110 113 117Concessional project loans 683 478 1,056 1,234 1,303 921 1,793 1,782 1,382 1,520 1,676Non-concessional borrowing 0 0 192 0 0 537 1,123 1,205 2,181 1,412 1,457
Amortization (–) -110 -152 -191 -196 -200 -224 -224 -280 -291 -321 -370Exceptional financing -26 -8 -10 -10 -10 -25 -31 0 0 3 3
Domestic financing (net) 749 1,316 20 868 713 1,080 1,862 917 733 858 449Bank financing 811 622 -1,242 689 530 455 1,238 340 199 500 236
Bank of Uganda4 473 270 -1,182 300 -43 48 822 14 -98 385 105Of which : Petroleum fund withdrawals 0 0 0 0 0 271 327 0 0 521 343Of which : Energy fund withdrawals 0 0 122 0 0 806 783 0 0 0 0Of which : Government Securities3 0 0 0 0 410 0 0 325 220 190 100
Commercial banks 338 351 -60 389 573 407 416 326 297 115 131Nonbank financing -62 694 1,262 179 182 625 624 576 534 358 213
Errors and omissions/financing gap (- is gap, + is surplus) -167 170 -318 0 -147 0 0 0 0 0 0
Memorandum Items: Petroleum revenues (Ush billions)
Inflows (including interest) 0 1,108 405 889 16 80 16 14 15 16 11Valuation adjustment 0 52 20 10 71 32 32 83 56 39 36Withdrawals 0 0 0 982 0 837 327 0 0 521 343Stock at end period 0 1,128 1,553 1,547 1,640 821 1,362 1,458 1,529 1,063 767Public domestic debt 3,234 5,356 6,705 7,297 8,534 8,034 9,387 10,397 11,205 11,597 11,735
Sources: Ugandan authorities and IMF staff estimates and projections.
3 Reflects actual and projected issuances for the recapitalization of Bank of Uganda.
1 Fiscal year runs from July 1 to June 30.
2012/13
2 Include mainly HIPC-related grants from FY 2013/14 onwards.
4 Net financing from the Bank of Uganda includes resources freed by MDRI relief.
2009/10 2010/11 2011/12 2013/14 2014/15 2015/16 2016/17 2017/18

UGANDA
INTERNATIONAL MONETARY FUND 21
Table 2b. Uganda: Fiscal Operations of the Central Government, FY2009/10–2017/181
(Percent of GDP)
Est. 6th Rev Est. 6th Rev Proj. Proj. Proj. Proj. Proj.
Total revenue and grants 14.7 18.4 15.5 14.7 14.8 16.6 15.1 15.8 15.8 16.0 16.3Revenue 12.2 16.2 13.2 13.0 13.2 15.0 13.7 14.3 14.8 15.1 15.4
Tax 11.7 12.7 11.9 12.5 12.6 13.1 13.1 13.6 14.1 14.4 14.7International trade taxes 1.0 1.2 1.0 1.1 1.1 1.1 1.1 1.2 1.3 1.3 1.3Income taxes 3.9 4.5 4.2 4.7 4.7 4.8 4.8 5.1 5.2 5.4 5.5Excises 2.9 3.0 2.9 2.5 2.6 2.7 2.7 2.8 2.9 3.0 3.0Value-added tax 3.8 4.0 3.8 4.2 4.2 4.5 4.4 4.5 4.7 4.8 5.0
Nontax 0.6 0.6 0.5 0.6 0.5 0.8 0.6 0.7 0.7 0.7 0.7Oil revenue 0.0 2.8 0.8 0.0 0.0 1.2 0.0 0.0 0.0 0.0 0.0
Grants 2.5 2.3 2.3 1.7 1.7 1.5 1.4 1.5 1.0 0.9 0.8Budget support2 1.3 1.3 1.2 0.3 0.4 0.3 0.3 0.3 0.3 0.2 0.2Project grants 1.1 1.0 1.1 1.4 1.3 1.2 1.1 1.2 0.7 0.7 0.6
Expenditures and net lending 19.6 22.8 18.5 18.6 18.9 20.2 22.2 21.0 20.8 20.0 19.5Current expenditures 12.3 15.3 11.1 10.5 10.5 10.0 10.2 10.6 11.0 10.7 10.7
Wages and salaries 3.7 4.3 3.7 3.9 3.9 3.7 3.8 4.0 4.0 3.9 3.9Interest payments 1.1 1.1 1.2 1.6 1.6 1.5 1.6 1.6 1.8 1.8 1.8Other current 7.5 9.9 6.3 5.1 5.0 4.8 4.7 5.0 5.2 5.0 5.0
Development expenditures 6.6 7.1 6.9 7.3 7.6 10.0 8.4 8.1 7.5 7.1 7.3Externally-financed projects 2.5 2.7 3.4 3.6 3.9 3.5 3.9 3.7 3.2 2.6 2.7Government of Uganda investment 4.1 4.4 3.5 3.7 3.7 6.4 4.5 4.4 4.3 4.5 4.6
Net lending and investment3 -0.1 -0.1 -0.1 0.7 0.7 0.0 3.5 2.1 2.2 2.1 1.4Of which: HPP projects 0.0 0.0 0.0 0.0 3.5 1.7 2.0 1.9 1.3Of which: Bank of Uganda recapitalization 0.0 0.0 0.7 0.0 0.0 0.4 0.3 0.2 0.1
Other spending 0.7 0.5 0.6 0.1 0.1 0.2 0.1 0.2 0.2 0.2 0.1Clearance of domestic arrears 0.2 0.5 0.6 0.1 0.1 0.1 0.1 0.0 0.0 0.0 0.0Contingency 0.5 0.0 0.0 0.0 0.0 0.2 0.0 0.2 0.2 0.2 0.1
Overall balance -4.9 -4.3 -3.0 -3.9 -4.1 -3.6 -7.1 -5.1 -5.1 -3.9 -3.2Underlying balance (excl. one-off items) -3.8 -6.1 -3.9 -3.1 -3.4 -4.8 -3.6 -3.0 -2.8 -1.9 -1.8
Financing 4.4 4.8 2.4 3.9 3.8 3.6 7.1 5.1 5.1 3.9 3.2
External financing (net) 2.2 1.4 2.3 2.3 2.6 1.9 4.2 3.9 4.2 3.0 2.8Disbursement 2.6 1.8 2.7 2.7 2.9 2.3 4.6 4.3 4.5 3.3 3.2
Budget support 0.7 0.6 0.2 0.5 0.6 0.0 0.0 0.1 0.1 0.1 0.1Concessional project loans 2.0 1.2 2.1 2.2 2.3 1.5 2.8 2.5 1.7 1.7 1.6Non-concessional borrowing 0.0 0.0 0.4 0.0 0.0 0.9 1.8 1.7 2.7 1.5 1.4
Amortization (–) -0.3 -0.4 -0.4 -0.3 -0.4 -0.4 -0.4 -0.4 -0.4 -0.4 -0.4Exceptional financing -0.1 0.0 0.0 0.0 0.0 0.0 0.0 0.0 0.0 0.0 0.0
Domestic financing (net) 2.1 3.4 0.0 1.5 1.3 1.7 2.9 1.3 0.9 0.9 0.4Bank financing 2.3 1.6 -2.5 1.2 1.0 0.7 1.9 0.5 0.2 0.5 0.2
Bank of Uganda4 1.4 0.7 -2.4 0.5 -0.1 0.1 1.3 0.0 -0.1 0.4 0.1Of which : Petroleum fund withdrawals 0.0 0.0 0.0 0.0 0.0 0.4 0.5 0.0 0.0 0.6 0.3Of which : Energy fund withdrawals 0.0 0.0 0.2 0.0 0.0 1.3 1.2 0.0 0.0 0.0 0.0Of which : Government Securities3 0.0 0.0 0.0 0.7 0.0 0.0 0.4 0.3 0.2 0.1
Commercial banks 1.0 0.9 -0.1 0.7 1.0 0.6 0.7 0.4 0.4 0.1 0.1Nonbank financing -0.2 1.8 2.5 0.3 0.3 1.0 1.0 0.8 0.7 0.4 0.2
Errors and omissions/financing gap (- is gap, + is surplus) -0.5 0.4 -0.6 0.0 -0.3 0.0 0.0 0.0 0.0 0.0 0.0
Memorandum Items: Petroleum revenues (Ush billions)
Inflows (including interest) 0.0 2.8 0.8 1.6 0.0 0.1 0.0 0.0 0.0 0.0 0.0Valuation adjustment 0.0 0.1 0.0 0.0 0.1 0.1 0.1 0.1 0.1 0.0 0.0Withdrawals 0.0 0.0 0.0 1.7 0.0 1.3 0.5 0.0 0.0 0.6 0.3Stock at end period 0.0 2.9 3.1 2.7 3.0 1.3 2.1 2.0 1.9 1.2 0.7Public domestic debt 9.3 13.7 13.4 13.0 15.4 12.7 14.7 14.3 13.8 12.7 11.4
Sources: Ugandan authorities and IMF staff estimates and projections.
4 Net financing from the Bank of Uganda includes resources freed by MDRI relief.
2016/17 2017/18
1 Fiscal year runs from July 1 to June 30.
2014/15 2015/16
2 Include mainly HIPC-related grants from FY 2013/14 onwards.3 Reflects actula and projected issuances for the recapitalization of Bank of Uganda.
2009/10 2010/11 2011/12 2012/13 2013/14

UGANDA
22 INTERNATIONAL MONETARY FUND
Table 2c: Uganda: Quarterly Fiscal Operations of the Central Government, 2013/14–2014/20151
(Billions of Ugandan Shillings)
Q1 Q2 Q3 Q4 Annual Q1 Q2 Q3 Q4 AnnualProj. Proj. Proj. Proj. Proj. Proj. Proj. Proj. Proj. Proj.
Total revenue and grants 1,971 2,605 2,385 2,648 9,608 2,527 3,132 2,637 3,160 11,455Revenue 1,860 2,319 2,101 2,447 8,727 2,299 2,645 2,498 2,901 10,343
Tax 1,779 2,208 1,984 2,342 8,314 2,185 2,519 2,382 2,779 9,866International trade taxes 185 180 176 190 731 204 208 204 246 862Income taxes 540 882 671 960 3,053 733 1,013 781 1,138 3,666Excises 428 456 443 419 1,746 478 500 556 512 2,046Value-added tax 626 691 695 772 2,784 769 797 842 883 3,292
Nontax 81 110 117 105 413 114 126 116 122 477Oil revenue 0 0 0 0 0 0 0 0 0 0
Grants 110 286 284 201 881 228 487 139 259 1,112Budget support2 47 28 50 81 206 76 84 28 39 227Project grants 63 258 235 119 675 152 403 111 219 886
Expenditures and net lending 2,608 3,438 3,102 4,985 14,132 3,067 3,713 3,421 4,983 15,183Current expenditures 1,560 1,749 1,672 1,528 6,510 1,699 1,939 2,040 1,990 7,668
Wages and salaries 615 598 601 626 2,440 691 718 729 752 2,890Interest payments 244 259 270 273 1,047 252 285 302 318 1,156Other current 701 892 800 630 3,022 756 936 1,009 920 3,622
Development expenditures 1,048 1,689 1,406 1,205 5,348 1,308 1,720 1,366 1,442 5,835Externally-financed projects 285 935 696 551 2,468 581 892 632 563 2,668Government of Uganda investment 763 754 709 654 2,880 727 828 733 879 3,167
Net lending and investment3 0 0 0 2,225 2,225 0 0 0 1,530 1,530Other spending 0 0 24 26 50 60 54 15 21 150
Overall balance -637 -833 -716 -2,337 -4,524 -540 -581 -783 -1,824 -3,728Underlying balance (excl. one-off items) -637 -833 -716 -112 -2,299 -540 -581 -783 -293 -2,198
Financing 579 891 716 2,337 4,524 540 581 783 1,824 3,728External financing (net) 120 615 399 1,528 2,661 370 461 460 1,521 2,811
Disbursement 173 677 462 1,605 2,916 431 559 521 1,580 3,092Of which : Budget support 0 0 0 0 0 3 70 0 31 104
Amortization (–) -48 -62 -57 -57 -224 -62 -98 -62 -59 -280Exceptional financing -5 0 -6 -20 -31 0 0 0 0 0
Domestic financing (net) 460 276 317 809 1,862 170 120 324 302 917Bank financing 338 -140 157 883 1,238 84 -24 180 100 340
Bank of Uganda3 90 -224 78 879 822 35 -106 98 -14 14Commercial banks 248 85 79 4 416 49 82 82 114 326
Nonbank financing 122 416 160 -74 624 86 144 144 202 576
Errors and omissions/financing gap (- is gap, + is surplus) -58 58 0 0 0 0 0 0 0 0
Source: Ugandan authorities and IMF staff estimates and projections.
2 Include mainly HIPC-related grants from FY 2013/14 onwards.
1 Fiscal year runs from July 1 to June 30.
2013/14 2014/15
UGANDA
INTERNATIONAL MONETARY FUND 23
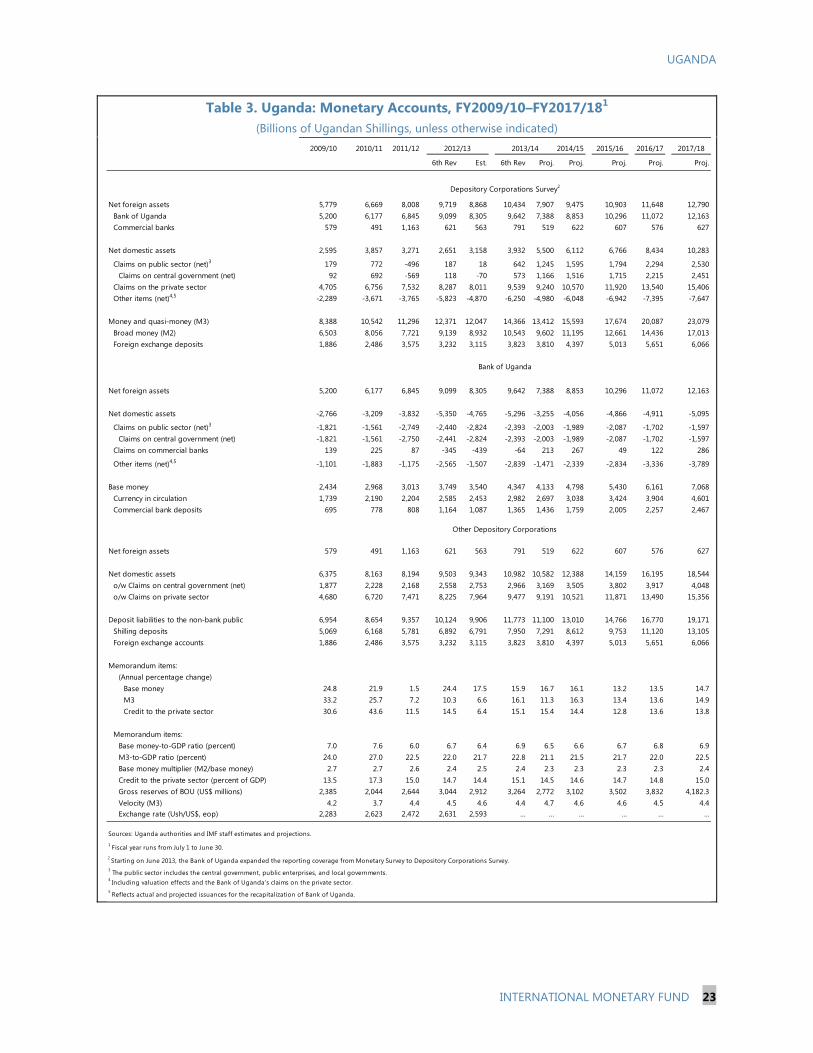
Table 3. Uganda: Monetary Accounts, FY2009/10–FY2017/181
(Billions of Ugandan Shillings, unless otherwise indicated)
6th Rev Est. 6th Rev Proj. Proj. Proj. Proj. Proj.
Net foreign assets 5,779 6,669 8,008 9,719 8,868 10,434 7,907 9,475 10,903 11,648 12,790Bank of Uganda 5,200 6,177 6,845 9,099 8,305 9,642 7,388 8,853 10,296 11,072 12,163Commercial banks 579 491 1,163 621 563 791 519 622 607 576 627
Net domestic assets 2,595 3,857 3,271 2,651 3,158 3,932 5,500 6,112 6,766 8,434 10,283
Claims on public sector (net)3 179 772 -496 187 18 642 1,245 1,595 1,794 2,294 2,530Claims on central government (net) 92 692 -569 118 -70 573 1,166 1,516 1,715 2,215 2,451
Claims on the private sector 4,705 6,756 7,532 8,287 8,011 9,539 9,240 10,570 11,920 13,540 15,406Other items (net)4,5 -2,289 -3,671 -3,765 -5,823 -4,870 -6,250 -4,980 -6,048 -6,942 -7,395 -7,647
Money and quasi-money (M3) 8,388 10,542 11,296 12,371 12,047 14,366 13,412 15,593 17,674 20,087 23,079Broad money (M2) 6,503 8,056 7,721 9,139 8,932 10,543 9,602 11,195 12,661 14,436 17,013Foreign exchange deposits 1,886 2,486 3,575 3,232 3,115 3,823 3,810 4,397 5,013 5,651 6,066
Net foreign assets 5,200 6,177 6,845 9,099 8,305 9,642 7,388 8,853 10,296 11,072 12,163
Net domestic assets -2,766 -3,209 -3,832 -5,350 -4,765 -5,296 -3,255 -4,056 -4,866 -4,911 -5,095
Claims on public sector (net)3 -1,821 -1,561 -2,749 -2,440 -2,824 -2,393 -2,003 -1,989 -2,087 -1,702 -1,597Claims on central government (net) -1,821 -1,561 -2,750 -2,441 -2,824 -2,393 -2,003 -1,989 -2,087 -1,702 -1,597
Claims on commercial banks 139 225 87 -345 -439 -64 213 267 49 122 286
Other items (net)4,5 -1,101 -1,883 -1,175 -2,565 -1,507 -2,839 -1,471 -2,339 -2,834 -3,336 -3,789
Base money 2,434 2,968 3,013 3,749 3,540 4,347 4,133 4,798 5,430 6,161 7,068Currency in circulation 1,739 2,190 2,204 2,585 2,453 2,982 2,697 3,038 3,424 3,904 4,601Commercial bank deposits 695 778 808 1,164 1,087 1,365 1,436 1,759 2,005 2,257 2,467
Net foreign assets 579 491 1,163 621 563 791 519 622 607 576 627
Net domestic assets 6,375 8,163 8,194 9,503 9,343 10,982 10,582 12,388 14,159 16,195 18,544o/w Claims on central government (net) 1,877 2,228 2,168 2,558 2,753 2,966 3,169 3,505 3,802 3,917 4,048o/w Claims on private sector 4,680 6,720 7,471 8,225 7,964 9,477 9,191 10,521 11,871 13,490 15,356
Deposit liabilities to the non-bank public 6,954 8,654 9,357 10,124 9,906 11,773 11,100 13,010 14,766 16,770 19,171Shilling deposits 5,069 6,168 5,781 6,892 6,791 7,950 7,291 8,612 9,753 11,120 13,105Foreign exchange accounts 1,886 2,486 3,575 3,232 3,115 3,823 3,810 4,397 5,013 5,651 6,066
Memorandum items:(Annual percentage change)
Base money 24.8 21.9 1.5 24.4 17.5 15.9 16.7 16.1 13.2 13.5 14.7M3 33.2 25.7 7.2 10.3 6.6 16.1 11.3 16.3 13.4 13.6 14.9Credit to the private sector 30.6 43.6 11.5 14.5 6.4 15.1 15.4 14.4 12.8 13.6 13.8
Memorandum items:Base money-to-GDP ratio (percent) 7.0 7.6 6.0 6.7 6.4 6.9 6.5 6.6 6.7 6.8 6.9M3-to-GDP ratio (percent) 24.0 27.0 22.5 22.0 21.7 22.8 21.1 21.5 21.7 22.0 22.5Base money multiplier (M2/base money) 2.7 2.7 2.6 2.4 2.5 2.4 2.3 2.3 2.3 2.3 2.4Credit to the private sector (percent of GDP) 13.5 17.3 15.0 14.7 14.4 15.1 14.5 14.6 14.7 14.8 15.0Gross reserves of BOU (US$ millions) 2,385 2,044 2,644 3,044 2,912 3,264 2,772 3,102 3,502 3,832 4,182.3Velocity (M3) 4.2 3.7 4.4 4.5 4.6 4.4 4.7 4.6 4.6 4.5 4.4Exchange rate (Ush/US$, eop) 2,283 2,623 2,472 2,631 2,593 … … … … … …
Sources: Uganda authorities and IMF staff estimates and projections.1 Fiscal year runs from July 1 to June 30.2 Starting on June 2013, the Bank of Uganda expanded the reporting coverage from Monetary Survey to Depository Corporations Survey. 3 The public sector includes the central government, public enterprises, and local governments.4 Including valuation effects and the Bank of Uganda's claims on the private sector. 5 Reflects actual and projected issuances for the recapitalization of Bank of Uganda.
Bank of Uganda
Other Depository Corporations
2016/17 2017/18
Depository Corporations Survey2
2011/12 2013/14 2014/15 2015/162009/10 2010/11 2012/13

UGANDA
24 INTERNATIONAL MONETARY FUND
Table 4. Uganda: Balance of Payments, FY2009/10–2017/181
(Millions of U.S. Dollars, unless otherwise indicated)
6th Rev 6th Rev 6th Rev Est. 6th Rev Proj. Proj. Proj. Proj. Proj.
Current account -1,630 -1,984 -2,611 -2,250 -2,134 -2,874 -3,292 -3,284 -3,647 -3,812 -3,630Trade balance -1,800 -2,383 -2,604 -2,250 -2,061 -2,861 -2,765 -2,834 -3,051 -3,062 -2,806
Exports, f.o.b. 2,317 2,298 2,660 2,910 2,982 3,059 3,132 3,330 3,588 3,841 4,328Of which: coffee 262 371 444 436 423 435 388 356 336 332 339
Imports, f.o.b. -4,117 -4,680 -5,264 -5,160 -5,044 -5,920 -5,897 -6,163 -6,639 -6,903 -7,135Of which: oil -501 -679 -947 -998 -1,028 -1,066 -1,094 -1,175 -1,271 -1,372 -1,478Of which: government, infrastructure related -176 -173 -304 -264 -359 -658 -601 -556 -613 -608 -485
Services (net) -416 -691 -437 -336 -373 -612 -811 -790 -951 -987 -1,100 Income (net) -335 -341 -808 -530 -981 -584 -1,051 -1,085 -1,154 -1,380 -1,474
Of which: interest on public debt -29 -36 -35 -37 -39 -61 -68 -76 -104 -138 -166
Transfers 920 1,430 1,238 866 1,282 1,182 1,336 1,425 1,509 1,618 1,750Private transfers 687 756 838 794 1,203 826 1,256 1,342 1,435 1,544 1,677
Of which: workers' remittances (inflows) 777 751 792 774 1,059 819 1,110 1,189 1,284 1,388 1,502Official transfers 234 675 400 72 79 356 79 83 74 74 72
Of which: budget support (including HIPC) 234 225 224 72 71 77 79 83 74 74 72capital gains tax 0 449 176 0 7 279 0 0 0 0 0
Capital and financial account 1,787 1,081 2,722 2,664 2,320 3,104 3,144 3,613 4,047 4,141 3,979Capital account 197 160 194 298 297 286 259 323 209 209 209
Of which: project grants 197 160 194 298 297 286 259 323 209 209 209Financial account 1,589 921 2,528 2,366 2,023 2,818 2,885 3,290 3,839 3,932 3,771
Foreign direct investment 693 719 1,398 1,476 925 1,576 1,066 1,484 1,759 2,110 2,219Portfolio investment -37 -29 270 -60 125 0 0 50 50 70 306Other investment 933 230 860 950 973 1,242 1,819 1,755 2,030 1,752 1,245
Of which: Public sector (net) 528 -211 745 508 534 802 1,209 1,026 1,170 919 939
SDR allocation 224 0 0 0 0 0 0 0 0 0 0Build-up (-)/drawdown (+) of petroleum fund 0 -449 273 0 -7 342 171 0 0 0 0Loan disbursements 371 304 546 582 617 543 1,121 1,129 1,271 1,027 1,060
Project support (loans) 263 206 396 473 501 343 689 651 478 513 547Budget support (loans) 107 98 45 109 116 0 0 38 38 38 38Non-concessional borrowing 0 0 105 0 0 200 432 440 755 476 475
Amortization due -67 -66 -75 -74 -76 -83 -83 -102 -101 -108 -121Commercial banks (net) 41 66 -283 249 253 -55 21 -23 12 16 -11Other private (net) 365 375 668 193 185 495 589 753 848 817 317
Errors and omissions 80 306 648 0 200 0 0 0 0 0 0
Overall balance 237 -598 759 414 386 230 -147 329 400 329 349
Financing -237 598 -759 -414 -386 -230 147 -329 -400 -329 -349Of which:
Central bank net reserves (increase = –) -224 601 -755 -400 -382 -220 142 -329 -400 -330 -350Of which : SDR allocation -224 0 0 0 0 0 0 0 0 0 0
Use of Fund credit -1 -2 -2 -2 -2 -2 -2 -1 0 0 0
Memorandum items:Gross offical reserves 2,385 2,044 2,644 3,044 2,912 3,264 2,772 3,102 3,502 3,832 4,182Months of imports of goods and services 4.2 3.2 4.2 4.2 3.9 4.1 3.5 3.6 3.9 4.0 4.0Net donor support 694 584 746 836 867 557 889 917 594 588 580
Of which: Budget support (loans and grants) 341 324 270 181 187 77 79 121 112 112 110Project support (loans and grants) 461 366 590 771 798 629 949 974 687 721 755
Current account balance (percent of GDP) -9.5 -11.8 -13.3 -10.4 -9.9 -12.2 -13.4 -12.4 -13.0 -12.4 -10.8Current account balance (excluding grants) -10.8 -13.1 -14.5 -10.7 -10.3 -12.6 -13.8 -12.7 -13.2 -12.6 -11.1Trade balance (percent of GDP) -10.5 -14.2 -13.3 -10.4 -9.6 -12.2 -11.3 -10.7 -10.8 -9.9 -8.4Exports (percent of GDP) 13.5 13.7 13.6 13.4 13.9 13.0 12.8 12.6 12.8 12.5 12.9Imports (percent of GDP) 23.9 27.8 26.8 23.8 23.5 25.2 24.1 23.3 23.6 22.4 21.3
Sources: Ugandan authorities and IMF staff estimates and projections. 1 Fiscal year runs from July 1 to June 30.
2012/13 2013/14 2014/15 2015/16 2016/17 2017/182009/10 2010/11 2011/12

Table 5. Uganda: Banking Sector Indicators, March 2010–June 2013
(In Percent)
Mar-10 Jun-10 Sep-10 Dec-10 Mar-11 Jun-11 Sep-11 Dec-11 Mar-12 Jun-12 Sep-12 Dec-12 Mar-13 Jun-13
Capital adequacy Regulatory capital to risk-weighted assets 22.7 21.7 21.2 20.2 21.2 19.3 18.3 20.3 21.8 20.7 20.9 21.9 24.5 24.3Regulatory tier 1 capital to risk-weighted assets 19.9 19.2 18.8 17.5 18.9 17.3 16.2 17.9 19.0 18.3 18.5 18.8 21.4 21.2
Asset quality NPLs to total gross loans 3.7 3.3 2.8 2.1 2.5 1.6 1.8 2.2 3.4 3.9 4.7 4.2 4.7 4.0NPLs to total deposits 2.5 2.1 1.8 1.4 1.7 1.1 1.4 1.7 2.6 2.9 3.4 3.1 3.5 2.9Earning assets to total assets 82.4 74.9 76.7 77.1 73.6 74.8 74.3 74.0 74.7 72.0 71.9 71.3 69.6 70.0Large exposures to gross loans 41.0 35.4 35.5 35.7 38.6 41.7 38.3 34.6 33.7 34.6 34.6 34.6 34.8 36.0Large exposures to total capital 123.9 112.8 116.1 124.4 129.8 156.2 145.4 120.8 109.4 111.5 104.2 104.7 95.4 103.4
Earnings and profitability Return on assets 2.4 2.3 2.4 2.7 2.9 3.1 3.6 4.0 4.4 4.4 4.3 3.9 3.6 3.3Return on equity 15.5 16.1 16.2 18.0 19.6 22.4 25.4 27.4 28.1 29.5 27.9 24.2 21.0 20.4Net interest margin 10.0 9.9 10.0 10.0 10.1 10.5 11.0 11.7 12.5 12.8 12.9 12.8 12.5 12.2Cost of deposits 3.5 3.3 3.2 2.9 2.7 2.5 2.8 3.2 3.4 3.6 4.0 4.1 4.3 4.1Cost to income 78.9 79.2 78.7 75.7 73.5 71.2 68.8 68.2 67.5 68.1 68.8 70.9 72.0 72.4Overhead to income 53.0 53.7 54.0 53.1 52.5 50.4 47.5 43.9 40.9 39.6 38.5 40.1 41.9 43.2
Liquidity Liquid assets to total deposits 45.5 41.6 40.5 39.8 40.5 35.6 36.2 37.6 37.5 38.9 42.5 42.0 42.7 41.1
Market sensitivity Foreign currency exposure to regulatory tier 1 capital -3.0 -3.5 -11.8 -1.6 -2.1 -0.9 -3.4 -3.6 -4.1 -5.2 -5.2 -0.6 -5.1 -6.7Foreign currency loans to foreign currency deposits 59.2 52.1 54.4 65.2 63.4 68.6 66.8 67.9 74.7 67.1 74.8 87.0 72.3 72.8Foreign currency assets to foreign currency liabilities 101.1 98.4 96.3 98.0 98.1 100.1 98.1 100.2 103.2 103.4 100.7 105.0 104.8 104.9
Source: Bank of Uganda.
2010 2011 2012 2013
UG
AND
A
INTERN
ATION
AL MO
NETARY FU
ND
25
UGANDA
26 INTERNATIONAL MONETARY FUND
Annex 1. Debt Sustainability Analysis Update
This debt sustainability analysis (DSA) updates the joint IMF/IDA DSA from June 17, 2013.1 It incorporates recent macroeconomic developments and the planned scaling up of non-concessional borrowing (NCB) from $1.5 billion to $2.2 billion to finance critical infrastructure projects. The DSA also incorporates contingent liabilities arising from two public-private partnership (PPP) projects. In an alternative scenario, the DSA takes account of a potential additional NCB increase to finance the Ugandan share of a regional railway project aimed at advancing EAC integration. Another scenario illustrates the impact of oil production set to start in 2018. Results indicate that Uganda remains at a low risk of debt distress. Nonetheless, the debt service-to-revenue ratio is high owing to the relatively short maturity of domestic debt and poses some risks.
A. Background and Recent Developments
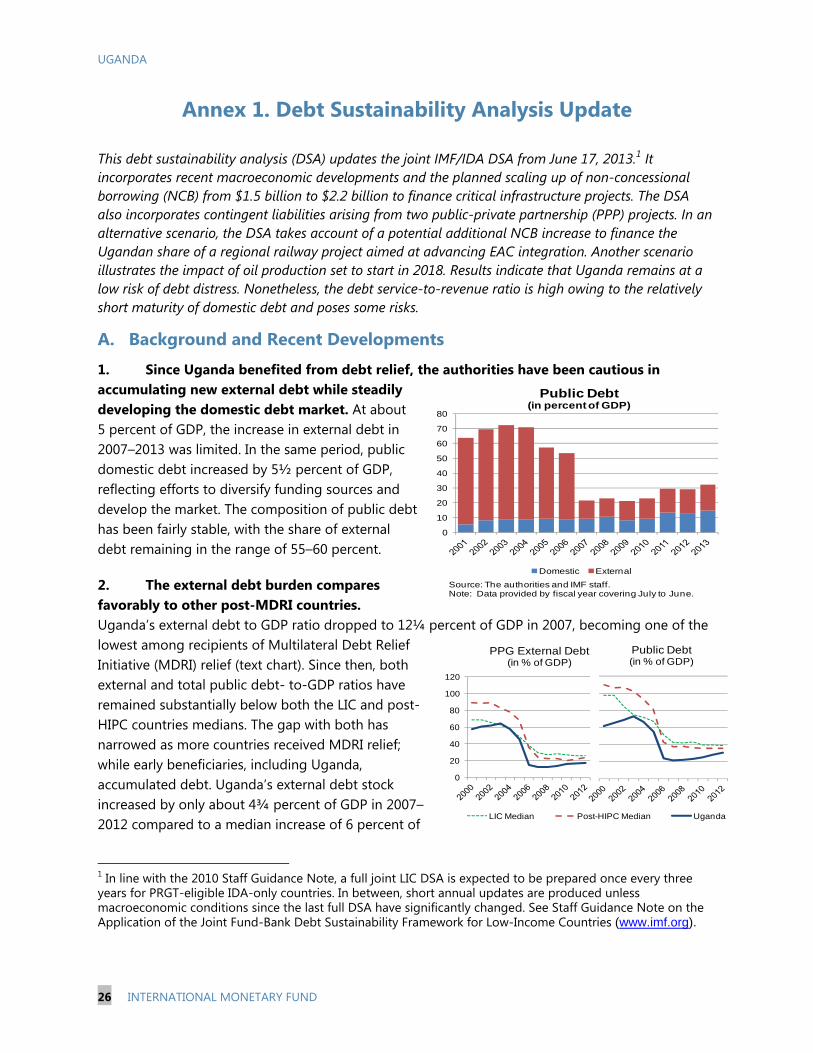
1. Since Uganda benefited from debt relief, the authorities have been cautious in accumulating new external debt while steadily developing the domestic debt market. At about 5 percent of GDP, the increase in external debt in 2007–2013 was limited. In the same period, public domestic debt increased by 5½ percent of GDP, reflecting efforts to diversify funding sources and develop the market. The composition of public debt has been fairly stable, with the share of external debt remaining in the range of 55–60 percent.
2. The external debt burden compares favorably to other post-MDRI countries. Uganda’s external debt to GDP ratio dropped to 12¼ percent of GDP in 2007, becoming one of the lowest among recipients of Multilateral Debt Relief Initiative (MDRI) relief (text chart). Since then, both external and total public debt- to-GDP ratios have remained substantially below both the LIC and post-HIPC countries medians. The gap with both has narrowed as more countries received MDRI relief; while early beneficiaries, including Uganda, accumulated debt. Uganda’s external debt stock increased by only about 4¾ percent of GDP in 2007–2012 compared to a median increase of 6 percent of
1 In line with the 2010 Staff Guidance Note, a full joint LIC DSA is expected to be prepared once every three years for PRGT-eligible IDA-only countries. In between, short annual updates are produced unless macroeconomic conditions since the last full DSA have significantly changed. See Staff Guidance Note on the Application of the Joint Fund-Bank Debt Sustainability Framework for Low-Income Countries (www.imf.org).
0
10
20
30
40
50
60
70
80
Public Debt(in percent of GDP)
Domestic External
Source: The authorities and IMF staff.Note: Data provided by fiscal year covering July to June.
0
20
40
60
80
100
120
PPG External Debt(in % of GDP)
LIC Median Post-HIPC Median Uganda
Public Debt(in % of GDP)
UGANDA
INTERNATIONAL MONETARY FUND 27
GDP for early beneficiaries of MDRI. The cautious approach in contracting new external debt maintains Uganda’s external debt in the lowest quartile within the countries that qualified for MDRI in 2006 (Text Table 1). New debt has mainly financed infrastructure projects and enhancement of transparency and service delivery in the public sector.
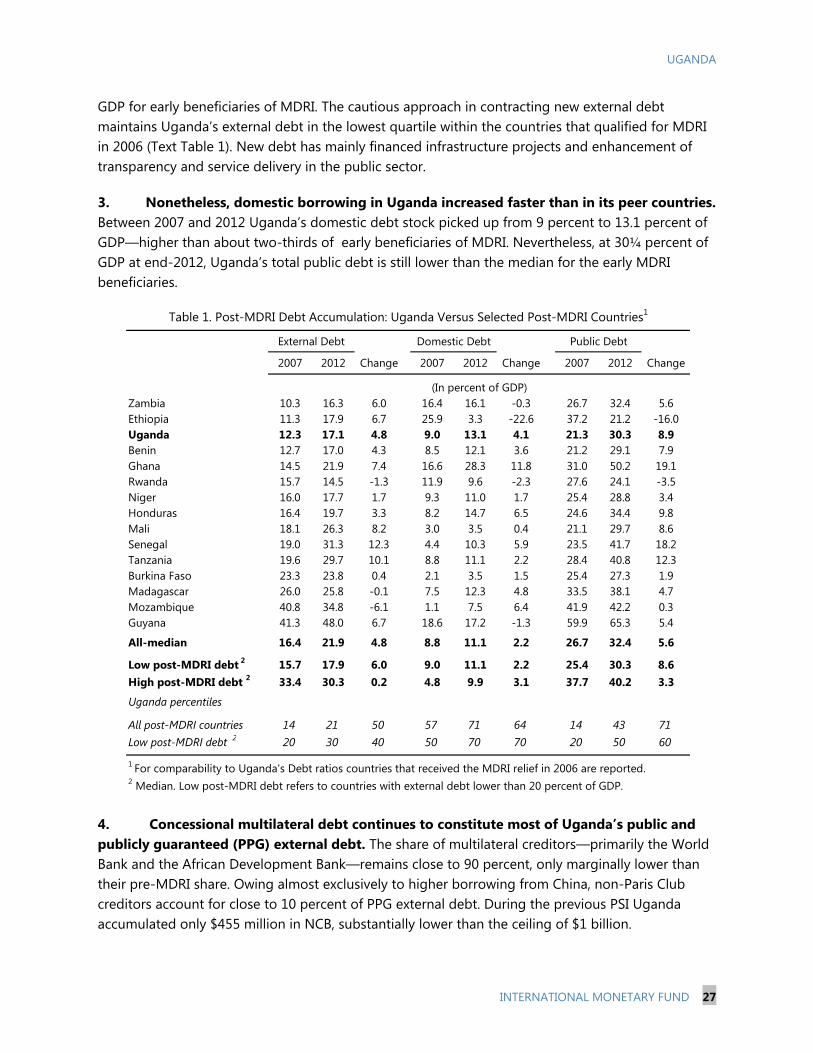
3. Nonetheless, domestic borrowing in Uganda increased faster than in its peer countries. Between 2007 and 2012 Uganda’s domestic debt stock picked up from 9 percent to 13.1 percent of GDP—higher than about two-thirds of early beneficiaries of MDRI. Nevertheless, at 30¼ percent of GDP at end-2012, Uganda’s total public debt is still lower than the median for the early MDRI beneficiaries.
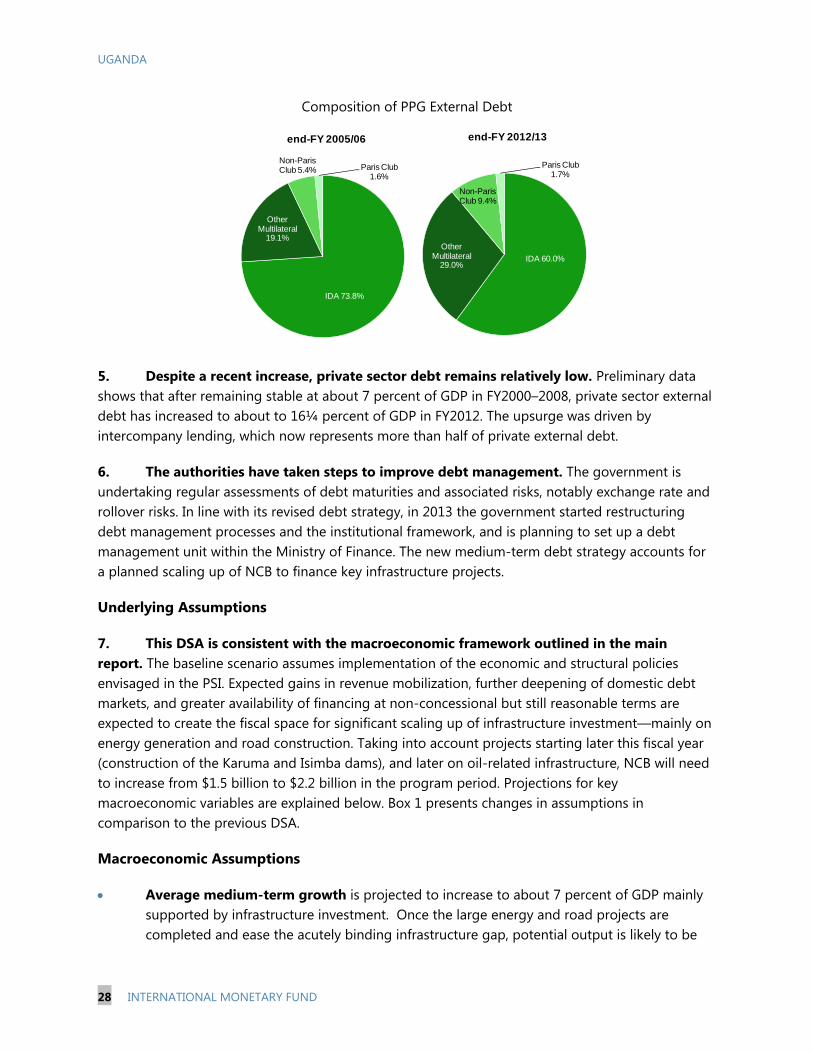
4. Concessional multilateral debt continues to constitute most of Uganda’s public and publicly guaranteed (PPG) external debt. The share of multilateral creditors—primarily the World Bank and the African Development Bank—remains close to 90 percent, only marginally lower than their pre-MDRI share. Owing almost exclusively to higher borrowing from China, non-Paris Club creditors account for close to 10 percent of PPG external debt. During the previous PSI Uganda accumulated only $455 million in NCB, substantially lower than the ceiling of $1 billion.
2007 2012 Change 2007 2012 Change 2007 2012 Change
Zambia 10.3 16.3 6.0 16.4 16.1 -0.3 26.7 32.4 5.6Ethiopia 11.3 17.9 6.7 25.9 3.3 -22.6 37.2 21.2 -16.0Uganda 12.3 17.1 4.8 9.0 13.1 4.1 21.3 30.3 8.9Benin 12.7 17.0 4.3 8.5 12.1 3.6 21.2 29.1 7.9Ghana 14.5 21.9 7.4 16.6 28.3 11.8 31.0 50.2 19.1Rwanda 15.7 14.5 -1.3 11.9 9.6 -2.3 27.6 24.1 -3.5Niger 16.0 17.7 1.7 9.3 11.0 1.7 25.4 28.8 3.4Honduras 16.4 19.7 3.3 8.2 14.7 6.5 24.6 34.4 9.8Mali 18.1 26.3 8.2 3.0 3.5 0.4 21.1 29.7 8.6Senegal 19.0 31.3 12.3 4.4 10.3 5.9 23.5 41.7 18.2Tanzania 19.6 29.7 10.1 8.8 11.1 2.2 28.4 40.8 12.3Burkina Faso 23.3 23.8 0.4 2.1 3.5 1.5 25.4 27.3 1.9Madagascar 26.0 25.8 -0.1 7.5 12.3 4.8 33.5 38.1 4.7Mozambique 40.8 34.8 -6.1 1.1 7.5 6.4 41.9 42.2 0.3Guyana 41.3 48.0 6.7 18.6 17.2 -1.3 59.9 65.3 5.4
All-median 16.4 21.9 4.8 8.8 11.1 2.2 26.7 32.4 5.6
Low post-MDRI debt 2 15.7 17.9 6.0 9.0 11.1 2.2 25.4 30.3 8.6High post-MDRI debt 2 33.4 30.3 0.2 4.8 9.9 3.1 37.7 40.2 3.3
Uganda percentiles
All post-MDRI countries 14 21 50 57 71 64 14 43 71Low post-MDRI debt 2 20 30 40 50 70 70 20 50 60
2 Median. Low post-MDRI debt refers to countries with external debt lower than 20 percent of GDP.
(In percent of GDP)
1 For comparability to Uganda's Debt ratios countries that received the MDRI relief in 2006 are reported.
Table 1. Post-MDRI Debt Accumulation: Uganda Versus Selected Post-MDRI Countries1
External Debt Domestic Debt Public Debt
UGANDA
28 INTERNATIONAL MONETARY FUND
Composition of PPG External Debt
5. Despite a recent increase, private sector debt remains relatively low. Preliminary data shows that after remaining stable at about 7 percent of GDP in FY2000–2008, private sector external debt has increased to about to 16¼ percent of GDP in FY2012. The upsurge was driven by intercompany lending, which now represents more than half of private external debt.
6. The authorities have taken steps to improve debt management. The government is undertaking regular assessments of debt maturities and associated risks, notably exchange rate and rollover risks. In line with its revised debt strategy, in 2013 the government started restructuring debt management processes and the institutional framework, and is planning to set up a debt management unit within the Ministry of Finance. The new medium-term debt strategy accounts for a planned scaling up of NCB to finance key infrastructure projects.
Underlying Assumptions
7. This DSA is consistent with the macroeconomic framework outlined in the main report. The baseline scenario assumes implementation of the economic and structural policies envisaged in the PSI. Expected gains in revenue mobilization, further deepening of domestic debt markets, and greater availability of financing at non-concessional but still reasonable terms are expected to create the fiscal space for significant scaling up of infrastructure investment—mainly on energy generation and road construction. Taking into account projects starting later this fiscal year (construction of the Karuma and Isimba dams), and later on oil-related infrastructure, NCB will need to increase from $1.5 billion to $2.2 billion in the program period. Projections for key macroeconomic variables are explained below. Box 1 presents changes in assumptions in comparison to the previous DSA.
Macroeconomic Assumptions
Average medium-term growth is projected to increase to about 7 percent of GDP mainly supported by infrastructure investment. Once the large energy and road projects are completed and ease the acutely binding infrastructure gap, potential output is likely to be
IDA 73.8%
Other Multilateral
19.1%
Non-Paris Club 5.4% Paris Club
1.6%
end-FY 2005/06
IDA 60.0%
Other Multilateral
29.0%
Non-Paris Club 9.4%
Paris Club 1.7%
end-FY 2012/13

UGANDA
INTERNATIONAL MONETARY FUND 29
Score Ranking Score Ranking Score Ranking Score Ranking
Uganda 2.27 133 2.91 110 1.44 111 1.80 133Kenya 3.09 103 3.93 72 2.50 72 2.73 111
Tanzania 2.27 132 3.22 94 2.26 82 1.77 134
Rwanda 3.22 96 4.96 40 … … 2.71 112
Burundi 1.87 141 2.70 121 … … 1.44 139
Median (all countries) 3.91 73 3.93 73 2.66 63 4.24 73
Source: World Economic Forum.
Electricity and telephony
Quality of infrastructure
Infrastructure Roads Railroads
higher, particularly if supported by an environment conducive to private sector development. On this basis, average long-term growth is projected at 7.2 percent.
Over the medium-term the average current account deficit is projected to reach 12½ percent of GDP, reflecting high import demand associated with the construction of large infrastructure projects. Once these are completed, import demand would come down while export receipts would increase on account of potential energy surpluses and better road and railway infrastructure. As a result, under the baseline scenario, which does not include oil exports, the current account deficit is projected, on average, at 7½ percent of GDP in the long term.
The fiscal deficit is projected to widen from about 4 percent of GDP in FY2012/13 to 5¼ percent of GDP in the medium term, peaking at 7½ percent of GDP in FY2013/14. This increase reveals the impact of the construction of large projects. The long-term average is expected to come down to about 2¾ percent of GDP.
Other Assumptions
An increase in the NCB ceiling from $1.5 billion to $2.213 billion in is incorporated. While debt will continue to be primarily highly concessional, additional concessional resources are not available to finance the large projects needed for addressing the infrastructure deficit. Uganda ranks 133th out of 146 countries in indicators on quality of infrastructure, in particular roads, railroads, and availability of electricity. It also lags behind most of its EAC partners. The World Bank supports the authorities’ decision to develop critical infrastructure projects.
Improvements in implementation capacity will be critical for the planned scaling up of infrastructure spending. Uganda’s weak track record of implementation of public investment raises concerns. However, recent improvements in implementation of road projects, as well as prospects for tapping into technical and project management expertise of external contractors and, when needed, high-skilled workers are likely to alleviate technical capacity constraints.
Another key consideration is preserving macroeconomic stability. The expected high import content would significantly limit inflationary and exchange rate appreciation pressures. Staff estimates that the growth stimulus associated with the projects would be compatible with potential output and not lead to overheating concerns.

UGANDA
30 INTERNATIONAL MONETARY FUND
Box 1.Uganda: Assumptions in Comparison with the Previous DSA
Compared to the previous joint IMF/IDA DSA, conducted in the context of the sixth review under the PSI, key changes are as follows: Non-concessional borrowing (NCB). The NCB ceiling is revised upward from $1.5 billion to
$2.2 billion to reflect the change in the financing modalities of the Karuma HPP, the construction of industrial substations for transmission, and smaller-scale oil-related infrastructure projects.
Discount rate. An increase from 3 percent to 5 percent, in line with the new guidelines, leads to an increase in the grant element of both the new borrowing and the debt service associated with the existing debt, thereby reducing the net present value of debt.
Financing terms for the NCB. Based on prospective financing terms of the Eximbank China loans under negotiation, staff estimates a grant element of about 11½ percent in the financing package of the Karuma, Isimba, and industrial substation projects. Overall, the DSA incorporates a higher grant element for new borrowing compared to the 6th review, taking into account the increase in the discount rate and the impact on interest rates of the expected tightening of global liquidity conditions over the medium-term.
Growth. The positive impact of the projects on the infrastructure gap, together with updated developments in the domestic and global economy, led staff to raise long-run growth projections from 7 percent to 7¼ percent.
Contingent liabilities from PPPs. Expected contingent liabilities associated with two road projects to be developed under PPP arrangements, amounting to about 1½ percent of GDP, are included in the baseline projections.
Domestic borrowing. With the recent extension of effective maturity to close to 2.7 years, the annual rollover of domestic debt stock has been reduced to about 35 percent from the previous 50 percent, reducing the rollover risk of public debt service.
B. External Debt Sustainability Analysis
8. PPG external debt is assessed to be sustainable over the projection period. All debt burden indicators are projected to remain below Uganda’s country-specific debt burden thresholds under the baseline scenario and the standardized stress tests (Figure 1a, Table 1a, and Table 1b).
9. Uganda’s external debt is projected to remain below the relevant debt burden thresholds even if long-term growth rates weaken sharply. To examine the sensitivity of DSA results to changes in long-term GDP growth, staff examined a shock scenario that illustrates at which long-term growth rate the baseline projections would exceed relevant external debt thresholds. The results show that an implausibly large decline in long-term growth from 7¼ percent to 2½ percent would be required to breach the debt service-to-revenue threshold by the end of the projection period. However, these results should be interpreted cautiously as this partial-equilibrium analysis does not incorporate feedback effects of a sharp and persistent deceleration in output on key macroeconomic aggregates including the fiscal deficit.

UGANDA
INTERNATIONAL MONETARY FUND 31
10. An alternative scenario that considers prospective construction of a regional railway shows that debt would still remain safely within the relevant thresholds. This scenario assesses implications of additional NCB of about $1.6 billion beyond the PSI period to finance the Ugandan share of the Mombasa-Kampala-Kigali regional railway project. Debt burden indicators, while significantly higher, would still be sustainable.
11. An illustrative scenario that includes the onset of oil production beginning in 2018 shows that the debt outlook would improve significantly (Box 2). This scenario simply illustrates the impact of oil revenues on the DSA, keeping expenditures unchanged with respect to the baseline. The borrowing needs for oil sector development would lead to an initial marginal increase in debt. Not surprisingly, when oil revenues come on stream, the DSA is projected to improve significantly with an elimination of external debt by 2025. This illustrates the space available to Uganda to use a significant portion of its prospective oil revenue to finance infrastructure investment.
Box 2. Assumptions for the Oil Illustrative Scenario
Cost and financing. Construction of the envisaged pipeline and small refinery is planned to start in FY2015/16. Total capital expenditure is estimated at $15-$20 billion, and would be financed primarily through FDI. The government will need to increase external borrowing only marginally to meet the expected equity commitments in both projects. Growth impact. Based on the investment and production profile, real GDP growth in 2016–2023 is expected to be 2–4 percent higher than under the baseline scenario. Growth would pick up during the investment phase and the onset of full production. Oil production is expected to account for close to 15 percent of Uganda’s GDP during the peak extraction period. Oil reserves are anticipated to last for about 30 years. Revenue impact. Oil revenues would amount to more than 50 percent of total government revenues. For the exercise, oil export prices are conservatively assumed to be constant in real terms at 80 dollars a barrel. Domestically refined oil is priced at import-parity minus a 20 percent discount.
C. Public Debt Sustainability Update
12. The evolution of total public debt (external and domestic debt) is sustainable over the projection period under the baseline scenario and when subject to stress tests. The public debt-to-GDP ratio is projected to peak at about 40 percent of GDP in 2018, well below the benchmark level of 74 percent associated with heightened public debt vulnerabilities for strong performers.2 However, the relatively short average maturity of domestic debt
2 Uganda is ranked as a “strong performer” under the Country Policy and Institutional Assessment (CPIA) framework of the World Bank. Accordingly, debt burden thresholds applicable for Uganda are PV of debt to GDP ratio of 50 percent, PV value of debt–to-exports ratio of 200 percent, PV of debt-to-revenue ratio of 300 percent, debt-service-to-exports ratio of 25 percent, and debt-service-to-revenue ratio of 22 percent. The indicative benchmark for public-debt-to-GDP ratio is 74 percent.
UGANDA
32 INTERNATIONAL MONETARY FUND
(less than three years) combined with a low revenue base leads to a debt service-to-revenue ratio of about 35 percent, among the highest in LICs. This significantly increases the rollover and interest rate risks, and needs to be addressed in the medium term by a combination of stronger revenue mobilization and deeper financial markets to extend average maturities.
13. Stress tests indicate that the path of public debt would become unsustainable in the absence of fiscal consolidation (Table 2b). In an illustrative scenario that assumes an unchanged primary deficit over the projection period at 5.9 percent of GDP, the NPV of public debt to GDP would grow rapidly and reach 77 percent by 2034. These results highlight the importance of reducing fiscal deficits after the temporary increase during the scaling up of public investment.
D. Conclusion
14. Despite the envisaged scaling-up of external borrowing, Uganda continues to face a low risk of debt distress. The government’s cautious approach in accumulating new external debt during the post-MDRI period has provided the economy with significant borrowing space to scale up public investment. However, the authorities are encouraged to adhere to the planned pace of implementation of these projects and ensure appropriate cost recovery to avoid delays and inefficiencies that could add costs and affect economic stability. Once the construction of the projects is completed, the temporary increase in fiscal deficits should be halted to bring public debt back to a sustainable path. The planned increase in tax revenues and maintenance of a stable economic environment should help reduce the existing rollover and interest risk of domestic debt.

UGANDA
INTERNATIONAL MONETARY FUND 33
Figure 1.a. Uganda: Indicators of Public and Publicly Guaranteed External Debt under Alternatives Scenarios, 2014–20341
Sources: Uganda authorities; and IMF staff estimates and projections. 1/ The most extreme stess test is the test that yields the highest ratio in 2024. In figure b. it corresponds to a One-time depreciation shock; in c. to a Terms shock; in d. to a One-time depreciation shock; in e. to a Terms shock and in figure f. to a One-time depreciation shock.
0
5
10
15
20
25
2014 2019 2024 2029 2034
f. Debt service-to-revenue ratio
-20
-10
0
10
20
30
40
50
60
-2
-1
0
1
2
3
4
5
2014 2019 2024 2029 2034
Rate of Debt AccumulationGrant-equivalent financing (% of GDP)Grant element of new borrowing (% right scale)
a. Debt Accumulation
0
10
20
30
40
50
60
2014 2019 2024 2029 2034
b. PV of debt-to GDP ratio
0
50
100
150
200
250
2014 2019 2024 2029 2034
c. PV of debt-to-exports ratio
0
50
100
150
200
250
300
350
2014 2019 2024 2029 2034
d. PV of debt-to-revenue ratio
0
5
10
15
20
25
30
2014 2019 2024 2029 2034
e. Debt service-to-exports ratio
Baseline Historical scenario Most extreme shock 1/
Threshold Oil sector development Higher NCB--Railway project

UGANDA
34 INTERNATIONAL MONETARY FUND
Figure 1.b. Uganda: Indicators of Public Debt Under Alternatives Scenarios, 2014–20341
Sources: Uganda authorities; and IMF staff estimates and projections. 1/ The most extreme stress tests is the test that yields the highest ratio in 2014 2/ Revenues are defined inclusive of grants.
0
50
100
150
200
250
300
350
400
450
500
2014 2016 2018 2020 2022 2024 2026 2028 2030 2032 2034
PV of Debt-to-Revenue Ratio 2/
0
10
20
30
40
50
60
70
80
90
2014 2016 2018 2020 2022 2024 2026 2028 2030 2032 2034
Baseline Fix Primary Balance Most extreme shock Non-debt flows Historical scenario
PV of Debt-to-GDP Ratio
0
10
20
30
40
50
60
2014 2016 2018 2020 2022 2024 2026 2028 2030 2032 2034
Debt Service-to-Revenue Ratio 2/

Table 1a. Uganda: Public Sector Debt Sustainability Framework, Baseline Scenario, 2011–2034
Estimate
2011 2012 2013 Average5/ Standard
Deviation
5/
2014 2015 2016 2017 2018 20192014-19 Average 2024 2034
2020-34 Average
Public sector debt 1/ 31.9 29.0 32.8 36.4 38.5 41.0 40.6 39.8 38.9 34.7 28.5Of which :foreign-currency denominated 18.2 15.6 17.5 19.9 22.8 25.2 26.2 26.9 26.4 24.5 21.0
Change in public sector debt 7.3 -2.9 3.8 3.6 2.1 2.5 -0.4 -0.8 -0.9 -1.2 -0.2Identified debt-creating flows 3.8 -4.8 2.0 5.0 1.8 2.4 0.0 -0.6 -0.9 -1.2 -0.2
Primary deficit 3.3 1.8 2.5 1.1 1.8 5.9 3.3 4.0 1.9 1.3 1.5 3.0 1.3 1.2 1.2Revenue and grants 18.4 15.5 14.8 15.1 15.8 15.8 16.0 16.3 16.4 16.4 16.4
of which: grants 2.3 2.3 1.7 1.4 1.5 1.0 0.9 0.8 0.8 0.3 0.0Primary (noninterest) expenditure 21.7 17.3 17.3 20.9 19.1 19.8 17.9 17.6 17.9 17.6 17.6
Automatic debt dynamics 0.5 -6.7 -0.5 -2.3 -1.6 -1.7 -1.9 -1.9 -2.4 -2.5 -1.4Contribution from interest rate/growth differential -1.0 -2.7 -0.9 -1.8 -2.0 -1.8 -1.9 -1.9 -1.4 -2.1 -1.2
of which: contribution from average real interest rate 0.5 -1.6 0.7 0.2 0.3 0.8 0.8 0.8 1.3 0.3 0.7of which: contribution from real GDP growth -1.5 -1.0 -1.6 -1.9 -2.2 -2.5 -2.7 -2.7 -2.7 -2.4 -1.9
Contribution from real exchange rate depreciation 1.4 -4.0 0.3 -0.6 0.4 0.1 0.1 0.0 -1.0 ... ...Other identified debt-creating flows 0.0 0.0 0.0 1.5 0.0 0.0 0.0 0.0 0.0 0.0 0.0
Privatization receipts (negative) 0.0 0.0 0.0 0.0 0.0 0.0 0.0 0.0 0.0 0.0 0.0Recognition of implicit or contingent liabilities 0.0 0.0 0.0 1.5 0.0 0.0 0.0 0.0 0.0 0.0 0.0Debt relief (HIPC and other) 0.0 0.0 0.0 0.0 0.0 0.0 0.0 0.0 0.0 0.0 0.0Other (specify, e.g. bank recapitalization) 0.0 0.0 0.0 0.0 0.0 0.0 0.0 0.0 0.0 0.0 0.0
Residual, including asset changes 3.5 2.0 1.8 -1.4 0.3 0.1 -0.4 -0.2 0.0 0.0 0.0
Other Sustainability IndicatorsPV of public sector debt ... ... 23.0 26.6 28.2 30.8 30.6 30.0 29.8 27.2 23.1
Of which : foreign-currency denominated ... ... 7.6 10.0 12.5 15.0 16.2 17.0 17.2 16.9 15.6Of which : external ... ... 7.6 10.0 12.5 15.0 16.2 17.0 17.2 16.9 15.6
PV of contingent liabilities (not included in public sector debt) ... ... ... ... ... ... ... ... ... ... ...Gross financing need 2/ 9.9 6.5 12.5 16.5 14.3 15.1 12.6 11.2 11.2 9.2 7.6PV of public sector debt-to-revenue and grants ratio (in percent) … … 155.0 176.0 178.4 195.3 190.7 184.4 182.1 166.0 141.1PV of public sector debt-to-revenue ratio (in percent) … … 174.9 193.8 197.6 208.6 202.3 194.4 191.7 169.3 141.1
Of which : external 3/ … … 58.1 73.2 87.6 101.4 106.9 110.6 110.9 105.7 95.3Debt service-to-revenue and grants ratio (in percent) 4/ 33.7 28.4 35.1 35.1 33.1 35.3 33.0 30.7 31.9 27.3 25.5Debt service-to-revenue ratio (in percent) 4/ 38.4 33.3 39.6 38.6 36.6 37.7 35.0 32.4 33.6 27.8 25.5Primary deficit that stabilizes the debt-to-GDP ratio -4.0 4.7 -1.3 2.2 1.2 1.6 2.2 2.1 2.4 2.5 1.4
Key macroeconomic and fiscal assumptionsReal GDP growth (in percent) 6.6 3.4 5.8 7.0 2.0 6.2 6.5 7.1 7.2 7.2 7.2 6.9 7.2 7.2 7.2Average nominal interest rate on forex debt (in percent) 1.0 1.1 1.1 1.1 0.5 1.1 1.5 2.1 2.1 2.2 2.4 1.9 2.6 3.1 2.7Average real interest rate on domestic debt (in percent) 5.5 -11.7 6.8 4.4 8.2 2.2 2.2 5.1 5.4 5.4 9.6 5.0 1.5 6.5 4.8Real exchange rate depreciation (in percent, + indicates depreciation) 10.1 -23.0 2.1 -2.9 12.1 -3.6 ... ... ... ... ... ... ... ... ...Inflation rate (GDP deflator, in percent) 5.0 24.1 4.7 8.7 6.4 7.8 6.9 4.7 4.8 5.0 3.4 5.4 6.8 5.8 6.4Growth of real primary spending (deflated by GDP deflator, in percent) 0.3 -0.2 0.1 0.1 0.1 0.3 0.0 0.1 0.0 0.1 0.1 0.1 0.1 0.1 0.1Grant element of new external borrowing (in percent) ... ... ... … … 29.7 28.4 18.9 26.7 27.5 22.7 25.7 25.8 19.6 ...
Sources: Ugandan authorities and IMF staff estimates and projections.1/ Public sector includes general government only and gross debt is used for all presentations.2/ Gross financing need is defined as the primary deficit plus debt service plus the stock of short-term debt at the end of the last period. 3/ Revenues excluding grants.4/ Debt service is defined as the sum of interest and amortization of medium and long-term debt.5/ Historical averages and standard deviations are generally derived over the past 10 years, subject to data availability.
Actual Projections
INTERN
ATION
AL MO
NETARY FU
ND
35
UG
AND
A
INTERN
ATION
AL MO
NETARY FU
ND
35

Table 1b. Uganda: External Debt Sustainability Framework, baseline Scenario, 2011–20131
Historical 6/ Standard 6/
Average Deviation 2014-2019 2020-20342011 2012 2013 2014 2015 2016 2017 2018 2019 Average 2024 2034 Average
External debt (nominal) 1/ 32.9 31.9 36.4 39.9 43.1 46.5 48.0 48.5 47.4 43.5 40.0o/w public and publicly guaranteed (PPG) 18.2 15.6 17.5 19.9 22.8 25.2 26.2 26.9 26.4 9.4 24.5 21.0
Change in external debt 6.2 -0.9 4.4 3.5 3.2 3.4 1.5 0.5 -1.1 -0.6 -0.1Identified net debt-creating flows 8.1 1.5 2.9 7.1 4.4 3.9 2.5 1.1 0.2 0.5 0.5
Non-interest current account deficit 11.5 12.9 9.6 6.8 4.2 13.1 11.9 12.4 11.7 10.1 7.2 7.0 6.2 6.9Deficit in balance of goods and services 18.3 15.5 11.4 14.6 13.7 14.2 13.2 11.7 11.5 10.5 9.2
Exports 22.3 23.5 23.8 22.0 21.8 22.2 21.9 22.3 22.5 23.5 24.8Imports 40.6 39.0 35.2 36.6 35.5 36.4 35.0 34.0 34.0 34.0 34.0
Net current transfers (negative = inflow) -8.5 -6.3 -6.0 -7.8 1.5 -5.5 -5.4 -5.4 -5.3 -5.2 -5.1 -4.3 -3.7 -4.1o/w official -4.0 -2.0 -0.4 -0.3 -0.3 -0.3 -0.2 -0.2 -0.2 -0.2 0.0
Other current account flows (negative = net inflow) 1.7 3.7 4.2 3.9 3.6 3.6 3.8 3.7 0.8 0.8 0.8Net FDI (negative = inflow) -4.3 -7.1 -4.3 -4.8 1.1 -4.4 -5.6 -6.3 -6.9 -6.6 -4.6 -4.4 -3.9 -4.2Endogenous debt dynamics 2/ 0.9 -4.2 -2.3 -1.6 -1.9 -2.3 -2.4 -2.5 -2.4 -2.1 -1.9
Contribution from nominal interest rate 0.3 0.5 0.4 0.4 0.5 0.5 0.7 0.7 0.7 0.7 0.7Contribution from real GDP growth -1.8 -1.0 -1.7 -2.0 -2.4 -2.9 -3.0 -3.2 -3.1 -2.9 -2.6Contribution from price and exchange rate changes 2.4 -3.7 -1.0 … … … … … … … …
Residual (3-4) 3/ -1.9 -2.4 1.5 -3.6 -1.2 -0.5 -1.0 -0.6 -1.3 -1.1 -0.6o/w exceptional financing 0.0 0.0 0.1 0.0 0.0 0.0 0.0 0.0 0.0 0.0 0.0
PV of external debt 4/ ... ... 26.6 30.0 32.8 36.3 38.0 38.6 38.2 11.7 35.9 34.6In percent of exports ... ... 111.6 136.3 150.4 163.4 173.5 173.1 169.8 153.0 139.3
PV of PPG external debt ... ... 7.6 10.0 12.5 15.0 16.2 17.0 17.2 16.9 15.6In percent of exports ... ... 32.1 45.6 57.3 67.5 73.9 76.3 76.5 72.2 62.8In percent of government revenues ... ... 58.1 73.2 87.6 101.4 106.9 110.6 110.9 105.7 95.3
Debt service-to-exports ratio (in percent) 4.4 6.2 5.0 4.5 5.1 6.7 6.8 6.9 7.0 8.5 9.0PPG debt service-to-exports ratio (in percent) 2.4 2.1 2.0 1.5 2.1 3.0 2.9 3.3 3.7 5.6 6.1PPG debt service-to-revenue ratio (in percent) 3.3 3.7 3.6 2.5 3.2 4.5 4.2 4.8 5.4 8.2 9.2Total gross financing need (Billions of U.S. dollars) 1.4 1.4 1.4 2.4 2.0 2.2 2.0 1.7 1.5 2.9 8.1Non-interest current account deficit that stabilizes debt ratio 5.3 13.8 5.1 9.5 8.7 9.1 10.2 9.7 8.3 7.6 6.3
Key macroeconomic assumptions
Real GDP growth (in percent) 6.6 3.4 5.8 7.0 2.0 6.2 6.5 7.1 7.2 7.2 7.2 6.9 7.2 7.2 7.2GDP deflator in US dollar terms (change in percent) -8.3 12.8 3.3 5.5 8.3 7.4 1.5 -0.7 2.1 1.5 3.6 2.6 3.6 2.7 3.5Effective interest rate (percent) 5/ 1.1 1.7 1.3 1.9 1.1 1.1 1.3 1.3 1.6 1.6 1.7 1.4 1.8 2.0 1.9Growth of exports of G&S (US dollar terms, in percent) 6.3 22.7 10.7 21.5 10.3 5.7 7.0 8.2 7.9 11.0 12.0 8.6 12.0 11.0 11.6Growth of imports of G&S (US dollar terms, in percent) 18.8 12.0 -1.5 17.1 12.8 19.0 4.8 9.0 5.3 5.5 11.1 9.1 11.1 10.0 10.9Grant element of new public sector borrowing (in percent) ... ... ... ... ... 29.7 28.4 18.9 26.7 27.5 22.7 25.7 25.8 19.6 22.0Government revenues (excluding grants, in percent of GDP) 16.2 13.2 13.2 13.7 14.3 14.8 15.1 15.4 15.5 16.0 16.4 16.1Aid flows (in Billions of US dollars) 7/ 0.7 0.8 1.0 0.9 0.9 0.6 0.7 0.7 0.7 0.9 1.4
o/w Grants 0.4 0.4 0.4 0.3 0.4 0.3 0.3 0.3 0.3 0.2 0.0o/w Concessional loans 0.3 0.3 0.6 0.5 0.5 0.3 0.4 0.5 0.4 0.7 1.4
Grant-equivalent financing (in percent of GDP) 8/ ... ... ... 2.7 2.7 1.8 1.8 1.7 1.5 1.0 0.5 0.8Grant-equivalent financing (in percent of external financing) 8/ ... ... ... 46.1 47.8 34.0 43.0 43.1 38.9 33.9 19.6 27.0
Memorandum items:Nominal GDP (Billions of US dollars) 16.8 19.6 21.4 24.5 26.5 28.1 30.8 33.5 37.2 62.8 176.1Nominal dollar GDP growth -2.2 16.6 9.3 14.1 8.1 6.3 9.4 8.8 11.1 9.6 11.1 10.0 10.9PV of PPG external debt (in Billions of US dollars) 1.6 2.4 3.2 4.2 4.9 5.6 6.5 10.5 27.0(PVt-PVt-1)/GDPt-1 (in percent) 3.6 3.2 3.7 2.6 2.4 2.5 3.0 1.5 1.5 1.6Gross workers' remittances (Billions of US dollars) 0.8 0.8 1.2 1.3 1.3 1.4 1.5 1.7 1.8 3.0 7.5PV of PPG external debt (in percent of GDP + remittances) ... ... 7.2 9.5 11.9 14.3 15.4 16.2 16.4 16.2 14.9PV of PPG external debt (in percent of exports + remittances) ... ... 26.0 36.9 46.5 54.9 60.1 62.4 62.7 60.1 53.6Debt service of PPG external debt (in percent of exports + remittances) ... ... 1.6 1.2 1.7 2.5 2.4 2.7 3.1 4.7 5.2
Sources: Ugandan authorities; and IMF staff estimates and projections. 01/ Includes both public and private sector external debt.2/ Derived as [r - g - ρ(1+g)]/(1+g+ρ+gρ) times previous period debt ratio, with r = nominal interest rate; g = real GDP growth rate, and ρ = growth rate of GDP deflator in U.S. dollar terms. 3/ Includes exceptional financing (i.e., changes in arrears and debt relief); changes in gross foreign assets; and valuation adjustments. For projections also includes contribution from price and exchange rate changes.4/ Assumes that PV of private sector debt is equivalent to its face value.5/ Current-year interest payments divided by previous period debt stock. 6/ Historical averages and standard deviations are generally derived over the past 10 years, subject to data availability. 7/ Defined as grants, concessional loans, and debt relief.8/ Grant-equivalent financing includes grants provided directly to the government and through new borrowing (difference between the face value and the PV of new debt).
Actual Projections
UG
AND
A
36 INTERN
ATION
AL MO
NETARY FU
ND

UGANDA
INTERNATIONAL MONETARY FUND 37
Table 2a. Uganda: Sensitivity Analysis for Key Indicators of Public and Publicly Guaranteed
External Debt, 2014–2034 (in Percent)
2014 2015 2016 2017 2018 2019 2024 2034
Baseline 10 13 15 16 17 17 17 16
A. Alternative Scenarios
A1. Key variables at their historical averages in 2014-2034 1/ 10 8 7 6 6 7 8 10A2. New public sector loans on less favorable terms in 2014-2034 2 10 13 17 19 21 22 23 25A3. Oil sector development starting from FY2013/14 10 12 16 18 18 19 1 -12
B. Bound Tests
B1. Real GDP growth at historical average minus one standard deviation in 2015-2016 10 12 15 16 17 18 17 16B2. Export value growth at historical average minus one standard deviation in 2015-2016 3/ 10 11 13 14 15 16 16 15B3. US dollar GDP deflator at historical average minus one standard deviation in 2015-2016 10 13 16 17 18 19 18 16B4. Net non-debt creating flows at historical average minus one standard deviation in 2015-2016 4/ 10 13 17 18 19 19 18 16B5. Combination of B1-B4 using one-half standard deviation shocks 10 10 10 11 12 13 14 15B6. One-time 30 percent nominal depreciation relative to the baseline in 2015 5/ 10 17 21 23 24 25 24 22
Baseline 46 57 67 74 76 77 72 63
A. Alternative Scenarios
A1. Key variables at their historical averages in 2014-2034 1/ 46 37 32 28 28 31 35 41A2. New public sector loans on less favorable terms in 2014-2034 2 46 61 76 86 92 96 99 99A3. Oil sector development starting from FY2013/14 45 55 73 82 80 77 4 -43
B. Bound Tests
B1. Real GDP growth at historical average minus one standard deviation in 2015-2016 46 55 67 73 75 77 71 62B2. Export value growth at historical average minus one standard deviation in 2015-2016 3/ 46 50 54 60 63 65 62 57B3. US dollar GDP deflator at historical average minus one standard deviation in 2015-2016 46 55 67 73 75 77 71 62B4. Net non-debt creating flows at historical average minus one standard deviation in 2015-2016 4/ 46 59 76 82 84 86 76 63B5. Combination of B1-B4 using one-half standard deviation shocks 46 43 39 44 48 51 51 51B6. One-time 30 percent nominal depreciation relative to the baseline in 2015 5/ 46 55 67 73 75 77 71 62
Baseline 73 88 101 107 111 111 106 95
A. Alternative Scenarios
A1. Key variables at their historical averages in 2014-2034 1/ 73 57 48 41 40 45 51 63A2. New public sector loans on less favorable terms in 2014-2034 2 73 93 114 125 133 139 144 150A3. Oil sector development starting from FY2013/14 72 85 115 121 120 116 6 -68
B. Bound Tests
B1. Real GDP growth at historical average minus one standard deviation in 2015-2016 73 86 104 109 113 116 107 97B2. Export value growth at historical average minus one standard deviation in 2015-2016 3/ 73 80 87 93 97 101 97 92B3. US dollar GDP deflator at historical average minus one standard deviation in 2015-2016 73 88 107 112 117 120 111 100B4. Net non-debt creating flows at historical average minus one standard deviation in 2015-2016 4/ 73 90 115 119 122 124 111 95B5. Combination of B1-B4 using one-half standard deviation shocks 73 72 68 75 81 86 87 90B6. One-time 30 percent nominal depreciation relative to the baseline in 2015 5/ 73 120 142 149 155 159 148 133
PV of debt-to GDP ratio
Projections
PV of debt-to-exports ratio
PV of debt-to-revenue ratio

UGANDA
38 INTERNATIONAL MONETARY FUND
Table 2a. Uganda: Sensitivity Analysis for Key Indicators of Public and Publicly Guaranteed
External Debt, 2014–2034 (continued) (in Percent)
Baseline 2 2 3 3 3 4 6 6
A. Alternative Scenarios
A1. Key variables at their historical averages in 2014-2034 1/ 2 2 2 2 2 2 2 3A2. New public sector loans on less favorable terms in 2014-2034 2 2 2 2 3 3 4 6 8A3. Oil sector development starting from FY2013/14 2 2 3 3 3 4 3 -1
B. Bound Tests
B1. Real GDP growth at historical average minus one standard deviation in 2015-2016 2 2 3 3 3 4 6 6B2. Export value growth at historical average minus one standard deviation in 2015-2016 3/ 2 2 3 2 3 3 5 6B3. US dollar GDP deflator at historical average minus one standard deviation in 2015-2016 2 2 3 3 3 4 6 6B4. Net non-debt creating flows at historical average minus one standard deviation in 2015-2016 4/ 2 2 3 3 4 4 6 6B5. Combination of B1-B4 using one-half standard deviation shocks 2 2 2 2 2 3 4 5B6. One-time 30 percent nominal depreciation relative to the baseline in 2015 5/ 2 2 3 3 3 4 6 6
Baseline 2 3 5 4 5 5 8 9
A. Alternative Scenarios
A1. Key variables at their historical averages in 2014-2034 1/ 2 3 3 2 2 3 4 5A2. New public sector loans on less favorable terms in 2014-2034 2 2 3 4 4 5 5 9 12A3. Oil sector development starting from FY2013/14 2 3 5 5 5 6 4 -2
B. Bound Tests
B1. Real GDP growth at historical average minus one standard deviation in 2015-2016 2 3 5 4 5 6 8 10B2. Export value growth at historical average minus one standard deviation in 2015-2016 3/ 2 3 4 4 4 5 8 9B3. US dollar GDP deflator at historical average minus one standard deviation in 2015-2016 2 3 5 4 5 6 9 10B4. Net non-debt creating flows at historical average minus one standard deviation in 2015-2016 4/ 2 3 5 5 5 6 9 9B5. Combination of B1-B4 using one-half standard deviation shocks 2 3 4 3 4 4 7 9B6. One-time 30 percent nominal depreciation relative to the baseline in 2015 5/ 2 5 6 6 7 8 12 13
Memorandum item:Grant element assumed on residual financing (i.e., financing required above baseline) 6/ 16 16 16 16 16 16 16 16
Sources: Country authorities; and staff estimates and projections.
1/ Variables include real GDP growth, growth of GDP deflator (in U.S. dollar terms), non-interest current account in percent of GDP, and non-debt creating flows. 2/ Assumes that the interest rate on new borrowing is by 2 percentage points higher than in the baseline., while grace and maturity periods are the same as in the baseline.3/ Exports values are assumed to remain permanently at the lower level, but the current account as a share of GDP is assumed to return to its baseline level after the shock (implicitly assumingan offsetting adjustment in import levels). 4/ Includes official and private transfers and FDI.5/ Depreciation is defined as percentage decline in dollar/local currency rate, such that it never exceeds 100 percent.6/ Applies to all stress scenarios except for A2 (less favorable financing) in which the terms on all new financing are as specified in footnote 2.
Debt service-to-exports ratio
Debt service-to-revenue ratio

UGANDA
INTERNATIONAL MONETARY FUND 39
Table 2b. Uganda: Sensitivity Analysis for Key Indicators of Public Debt, 2014–2034
2014 2015 2016 2017 2018 2019 2024 2034
Baseline 27 28 31 31 30 30 27 23
A. Alternative scenarios
A1. Real GDP growth and primary balance are at historical averages 27 26 26 25 24 24 22 20A2. Primary balance is unchanged from 2014 27 31 35 38 42 45 58 77A3. Permanently lower GDP growth 1/ 27 28 31 31 31 31 31 35
B. Bound tests
B1. Real GDP growth is at historical average minus one standard deviations in 2015-2016 27 29 33 33 33 33 32 30B2. Primary balance is at historical average minus one standard deviations in 2015-2016 27 28 29 29 29 28 26 23B3. Combination of B1-B2 using one half standard deviation shocks 27 27 28 28 28 28 27 25B4. One-time 30 percent real depreciation in 2015 27 32 35 34 33 33 30 28B5. 10 percent of GDP increase in other debt-creating flows in 2015 27 38 40 40 39 38 33 27
Baseline 176 178 195 191 184 182 166 141
A. Alternative scenarios
A1. Real GDP growth and primary balance are at historical averages 176 164 163 156 150 149 134 120A2. Primary balance is unchanged from 2014 176 194 221 239 257 274 356 468A3. Permanently lower GDP growth 1/ 176 179 198 195 191 191 191 216
B. Bound tests
B1. Real GDP growth is at historical average minus one standard deviations in 2015-2016 176 182 206 204 200 200 195 185B2. Primary balance is at historical average minus one standard deviations in 2015-2016 176 176 186 182 176 174 160 138B3. Combination of B1-B2 using one half standard deviation shocks 176 171 177 175 171 171 164 152B4. One-time 30 percent real depreciation in 2015 176 205 219 213 205 199 185 170B5. 10 percent of GDP increase in other debt-creating flows in 2015 176 239 254 247 238 231 204 162
Baseline 35 33 35 33 31 32 27 26
A. Alternative scenarios
A1. Real GDP growth and primary balance are at historical averages 35 33 35 31 29 30 25 24A2. Primary balance is unchanged from 2014 35 33 36 34 33 35 37 50A3. Permanently lower GDP growth 1/ 35 33 36 33 31 33 29 32
B. Bound tests
B1. Real GDP growth is at historical average minus one standard deviations in 2015-2016 35 34 37 34 32 33 29 29B2. Primary balance is at historical average minus one standard deviations in 2015-2016 35 33 35 33 30 32 27 25B3. Combination of B1-B2 using one half standard deviation shocks 35 33 35 33 30 32 27 26B4. One-time 30 percent real depreciation in 2015 35 34 37 35 33 35 32 33B5. 10 percent of GDP increase in other debt-creating flows in 2015 35 33 38 36 33 34 31 27
Sources: Country authorities; and staff estimates and projections.1/ Assumes that real GDP growth is at baseline minus one standard deviation divided by the square root of the length of the projection period.2/ Revenues are defined inclusive of grants.
PV of Debt-to-GDP Ratio
Projections
PV of Debt-to-Revenue Ratio 2/
Debt Service-to-Revenue Ratio 2/

UGANDA
40 INTERNATIONAL MONETARY FUND
Appendix I. Uganda: Letter of Intent
Kampala, Uganda, November 28, 2013
Ms. Christine Lagarde Managing Director International Monetary Fund Washington, DC 20431, USA Dear Ms. Lagarde:
On behalf of the Government of Uganda, we would like to provide you with an update on the progress we have achieved under our economic program supported by the IMF’s Policy Support Instrument (PSI). Economic growth has been stronger than expected, inflation is under control despite a significant food price shock, and the external current account improved allowing international reserves to meet the PSI end-June 2013 target. In light of these favorable developments, we observed all June 2013 quantitative assessment criteria under the program. Unfortunately, we missed the indicative targets on tax revenue and expenditure on poverty reduction by small margins and some structural commitments have suffered delays, but we have taken remedial action and remain committed to speeding up the implementation of the structural reform agenda. Therefore, we request completion of the first review under our PSI-supported program.
Going forward, we will continue to conduct policies that maintain economic stability and support sustainable and inclusive growth by generating employment and reducing poverty levels. Monetary policy is designed to support the 5 percent medium-term core inflation target. A program of infrastructure investment in electricity and road projects to address the infrastructure gap is at the center of our growth and development strategy, and we will ensure that this program is consistent with debt sustainability and the absorption capacity of the economy. We are also advancing integration efforts with other Eastern African countries to boost trade, improve competiveness, and ultimately culminate in a monetary union. We have made progress on improving tax collection and enhancing public financial management and will continue to take steps to advance further. To assist us in carrying out this ambitious reform agenda, the government of Uganda wishes to continue to benefit from technical assistance from the IMF in areas included in the program. We also wish to request that the ceiling for non-concessional borrowing included in the PSI arrangement be raised from $1.5 to $2.2 billion to finance our infrastructure investment program, and that the December

UGANDA
INTERNATIONAL MONETARY FUND 41
2013 quantitative assessment criteria and March 2014 indicative targets be modified in line with recent developments.
The attached Memorandum of Economic and Financial Policies (MEFP) sets out details of the policies to be pursued in the next year, which Government believes will be sufficient to achieve the objectives of our PSI-supported program but, as always, we stand ready to take any further measures that may become appropriate for this purpose.
We intend to work with the IMF and other development partners in the implementation of our program, and will consult with the Fund on the adoption of any such further measures, and in advance of revisions to the policies contained in the MEFP, in accordance with the Fund’s policies on such consultation. We will provide the IMF with such information as the Fund requests in connection with our progress in implementing the policies and reaching the objectives of the program. We also consent to publication of the documents for the first review under the PSI.
Sincerely yours
/s/ /s/ Maria Kiwanuka Louis Kasekende Minister of Finance, Planning For Prof. E. Tumusiime Mutebile and Economic Development Governor Bank of Uganda Attachments Memorandum of Economic and Financial Policies Technical Memorandum of Understanding
UGANDA
42 INTERNATIONAL MONETARY FUND
Attachment I. Memorandum of Economic and Financial Policies
This Memorandum of Economic and Financial Policies complements the previously agreed policies under the June 2013 Memorandum of Economic and Financial Policies (IMF Country Report 13/215). It presents an update on the economic performance in the second half of the fiscal year 2012/13, and provides details of the policies Government intends to implement in the period ahead to maintain overall macroeconomic stability and stimulate growth and job creation.
I. Recent Economic and Policy Developments
1. Economic growth for FY 2012/13 reached 5.8 percent, 0.7 percentage points higher than projected, driven by stronger-than-expected industrial output, services, and public investment. Inflation declined in the second half of FY2012/13 but the trend was reversed during the first quarter of FY2013/14 owing to a drought in most parts of the country that affected food crop production. With improved weather conditions, core inflation declined from 7.4 percent in September to 7.2 percent in October, and is projected to remain within PSI program targets.
2. On the external front, the current account deficit improved markedly in FY2012/13 with lower-than-anticipated FDI-related imports and stronger remittances. Gross international reserves rose from US$2.6 billion in FY2011/12 to US$2.9 billion in FY2012/13 equivalent to 3.9 months of imports. Risks to the external outlook include potential adverse effects of weather conditions on agricultural exports, unfavorable global economic conditions, and oil price increases.
3. Fiscal performance during FY2012/13 was slightly more expansive than projected. The overall deficit was 4.1 percent of GDP, compared to 3.9 percent of GDP in the program. Total expenditures and net lending amounted to 18.9 percent of GDP compared to 18.6 percent of GDP in the program, on account of higher development spending. The fiscal deficit was largely financed from external sources (2.6 percent of GDP) compared to 1.3 percent of GDP of domestic financing, in line with the program target.
4. Monetary policy was eased on account of muted inflation developments and forecasts, with the central bank rate (CBR) reduced to 12 percent in December 2012 and to 11 percent in June 2013 from 23 percent in February 2012. In an environment of relatively low inflation coupled with declining upward risks to inflation, BoU’s efforts were geared to supporting economic activity. However, as inflation increased owing to a drought-related food price spike, the CBR was raised by 100 basis points in September 2013, signaling Bank of Uganda’s (BoU) strong commitment to the inflation target. Lending rates have declined during the fiscal year, from 26.9 percent in July 2012 to 22.9 percent in June 2013; and private sector credit continued to grow, albeit at a slow pace, largely on account of foreign-currency-denominated loans.
5. The banking sector performed well in FY2012/13. Capital adequacy levels remained strong, aided by high profits, improved liquidity and better funding conditions. However, lending stagnated, with banks reducing their risk-weighted assets and investing more in government securities. The low rate in credit growth, 6.4 percent at the end of June 2013, reflected lower demand for credit from

UGANDA
INTERNATIONAL MONETARY FUND 43
leveraged corporations and households and reduced appetite for risk taking by banks. Asset quality is improving, with the system-wide ratio of NPLs to total lending at 4 percent in June 2013 from a peak of 4.7 percent in March. 2013. A financial sector systemic risk assessment shows that banks’ resilience has improved. The BoU has taken several measures to strengthen the macro prudential framework. In May, measures to enhance minimum capital requirements, including the Basel III capital conservation buffer for all banks, were introduced. Liquidity risk assessment will improve with the planned introduction of a new liquidity coverage ratio to be introduced in 2014. Financial inclusion continues to grow strongly as mobile money usage is becoming widespread in all regions of the country.
6. Government remains committed to addressing constraints affecting the business climate by stepping up infrastructure development, mainly on energy and roads.
II. Performance Under the PSI
7. As at end-June 2013, all quantitative assessment criteria were observed, while structural benchmarks were broadly achieved. The indicative targets on tax revenues and expenditures on poverty alleviating sectors for end-June 2013 were not met by small margins. Government is undertaking remedial measures to improve revenue collection and tax administration as well as addressing implementation capacity of the Ministries, Departments and Agencies (MDAs).
8. Significant progress has been made on achieving the structural benchmarks set from July to December. Government carried out the first stage of recapitalization of the BoU with marketable securities in May. Government remains committed to improving the management of public finances. Although with some delay, there is ongoing work on the VAT gap analysis in consultation with FAD. All central government entities are now covered by the Integrated Personnel and Payroll System (IPPS). Test runs are being undertaken on the functionality of the system, and it is expected that payment of salaries will be run through the IPPS starting in April 2014. The benchmark on rolling out the Integrated Financial Management System (IFMS) to cover all central government votes has been achieved ahead of schedule. The first phase of implementation of the Treasury Single Account (TSA) was completed in October 2013 by consolidating the central government accounts. Next steps include establishing cash management and debt management units. However, the structural benchmark on submitting to cabinet regular quarterly reports on unpaid bills of nine ministries based on data for the previous quarter was delayed because a mechanism of clear sanctions/penalties was being put in place. This awaits passing of the new Public Financial Management Bill. This bill is being considered by parliament, and consultations with the relevant stakeholders and the public are ongoing.
III. Macroeconomic Outlook and Risks
9. The macroeconomic framework has been updated to reflect last year’s better-than-expected economic performance. Growth is projected to reach 6.2 percent this fiscal year and 6.5 percent in 2014/15, supported by continued investments in infrastructure (particularly roads and energy) and

UGANDA
44 INTERNATIONAL MONETARY FUND
improved agricultural production and productivity. To achieve the latter, government is stepping up provision of inputs (seedlings) and pest and disease control.
10. Core inflation is expected to decline on account of lower food prices, declining commodity prices, and the recent exchange rate appreciation, converging to the 5 percent medium-term target. Risks to the inflation outlook include possible increases of imported prices and exchange rate depreciation as the global economy recovers. The external current account is expected to worsen due to increased FDI-related imports of goods and services.
11. The economy remains vulnerable to shocks emerging from both domestic and external sources. On the domestic side, the unpredictable weather conditions could negatively impact agricultural production thereby affecting exports and inflation. On the external front, the slower- than-projected global recovery could hurt export earnings and remittances inflows.
IV. Economic Policies
Fiscal Policy
Budget FY2013/14
12. Government’s fiscal policy in FY2013/14 and the medium term will aim at maintaining macroeconomic stability and accelerating the rate of economic growth, and will be focused on enhancing domestic revenue mobilization and budget efficiency. In order to complement achievement of these objectives, Government will continue strengthening the business climate and alleviating binding constraints to economic growth through targeted public investments, particularly in power and roads, agricultural production and productivity, and human capital. Domestic revenues are projected to increase as a share of GDP by about 0.5 percentage points as a result of new tax measures and strengthened tax administration. Any current expenditure pressures will be accommodated within the domestic financing for the FY2013/14 budget, in addition to conducting key investment projects described on paragraph 13. Excluding extraordinary investments, the fiscal stance will expand by 0.2 percent of GDP to support the growth recovery.
13. Inadequate power and road infrastructure are key impediments to private sector investment and growth. To address these constraints, Government will start construction of two large hydroelectric projects toward the end of this fiscal year. The Karuma and Isimba Hydropower Projects, together with associated transmission lines and substations, are identified as national core projects for development under the National Development Plan. Expected to more than double current production capacity, they will contribute to mitigating current and future energy supply shortages. Financing of these large projects amounts to US$ 2.2 billion in the next five years, and will require the use of government savings in the energy and oil funds and external borrowing. Given the challenges associated with identifying adequate financing from concessional sources, government intends to contract non-concessional loans in amounts consistent with debt sustainability and the absorptive capacity of Uganda. To this end, the government requests that the ceiling on non-concessional borrowing be adjusted to USD 2.2 billion during the program period.
UGANDA
INTERNATIONAL MONETARY FUND 45
Government does not intend to use future oil revenues as collateral and will ensure that on completion, these projects will generate sufficient returns to repay the costs of the investment through an appropriate policy on electricity tariffs.
14. Government will set up a special purpose vehicle to manage the hydropower dams and ensure that the revenue stream from the operation of the projects is separated from other transactions of the electricity companies and guarantee commercial viability of the projects.
Budget FY2014/15
15. The theme for the 2014/15 budget will be to promote growth and reduce poverty while maintaining macroeconomic stability and debt sustainability. The fiscal stance will be designed to be consistent with the objective of monetary policy of reducing core inflation to the medium term target of 5 percent.
16. With revenue gains from improved growth prospects and enhanced administrative reforms, total revenues and grants are projected to rise to 15.8 percent of GDP. Total expenditures and net lending are projected at about 21 percent of GDP and include among other items, wage increases to compensate civil servants for the decline in purchasing power of their salaries; election-related expenditures; and the continuation of spending on the two large-scale hydropower projects. Consequently, the overall deficit is projected at 5.1 percent of GDP. Financing of the deficit will rely on external sources (including non-concessional loans), which will account for about 3.9 percent of GDP, while up to 1.3 percent will be from domestic sources.
Monetary and Financial Policies
17. Monetary policy will be designed to ensure that core inflation over the medium term is as close to 5 percent as possible and that output is as close to potential as possible, consistent with the inflation objective.
18. The BoU continues to pursue a flexible exchange rate regime, and implement sterilized interventions in the foreign exchange market to dampen excessive exchange rate volatility or to accumulate reserves. To compensate for the loss of reserves from the planned use of government deposits to finance the infrastructure projects, the BoU has stepped up its announced program of daily dollar purchases in the market. This would allow international reserves to be maintained at 3.5 months of future imports during FY2013/14. Subsequently, international reserves will be raised to 4 months of imports.
19. The BoU continues to closely monitor risks that could emerge in the financial sector and is prepared to take any measure to mitigate these risks. In particular, the BoU will closely coordinate actions with the regulatory body (Uganda Communications Commission) and other relevant agencies to reduce the likelihood of any operational problems in the mobile money platforms. The BoU is also committed to upgrading its prudential measures and enforcement to mitigate risks that could emerge from foreign currency lending to unhedged borrowers.

UGANDA
46 INTERNATIONAL MONETARY FUND
V. EAC Integration
Customs Union
20. The government together with other East African Community (EAC) partner states continues to work towards strengthening regional integration. There are ongoing efforts aimed at consolidating the EAC into a Single Customs Territory, as a foundation for smooth implementation of the EAC Common Market Protocol and the subsequent EAC Monetary Union. This entails eliminating non-tariff barriers, a mechanism for clearance of goods at the first point of entry into the Community, adopting an EAC bond guarantee regime to avoid execution of multiple bonds in the movement of goods across the region; and implementing one-stop border post models to coordinate activities of various Government agencies involved in the regulation of trade. The use of information and communication technology to facilitate clearance of payment of taxes and cargo tracking, as well as exchange of trade statistics analysis for guidance in policy formulation is being stepped up.
Common Market
21. Implementation of the common market has been slow, with significant barriers to the free movement of goods and factors of production still in place across the region. The EAC developed a plan to guide the implementation of the Common Market Protocol, focusing on the six rights provided for under the common market. To deal with emerging challenges, partner states are committed to accelerating convergence of laws and policies and integrating EAC policies into their individual national plans.
Monetary Union
22. Uganda and the other EAC partner states have concluded negotiations on a Protocol for establishing an EAC Monetary Union. The Protocol sets out a 10-year road map for implementing a single currency, pre-requisites for macroeconomic convergence, and harmonizing policy and legal frameworks.
VI. Structural Reforms
Improving Public Financial Management
23. Government started implementing the TSA effective October 1st, 2013. The first phase of implementation involved i) introducing a structure of subaccounts to be swept daily into the consolidated fund, ii) closing most of the inactive accounts, iii) reconfiguring the IFMS to handle TSA operations, and iv) issuing operational guidelines to accounting officers. Looking forward, Government will further extend the coverage of the TSA by including salary accounts, holding accounts, non-donor funded project accounts and deposit accounts. Improvements to cash management planning will also require setting up a cash management planning unit to coordinate the timing of payments.

UGANDA
INTERNATIONAL MONETARY FUND 47
24. Government has broadened the coverage of IFMS to 68 central governments ministries and agencies, 14 local governments, 8 donor-financed projects, and 5 referral hospitals. The further rollout in central government will mainly target donor-financed projects, and remaining up-country referral hospitals. Further, government will enhance interfaces with other systems (Uganda Revenue Authority, Integrated Personnel and Payroll System, Debt Management and Financial Analysis System) and improve security of the system.
25. Government has revised its medium term debt strategy to take into account recent developments on borrowing. The strategy requires Government to undertake regular assessments of debt maturities (concessional and non-concessional) and associated risks (exchange rate, roll-over, etc). In line with the revised debt strategy in 2013, Government embarked on a restructuring of its debt management processes including its institutional framework.
Improving Tax Revenue
26. Government remains committed to raising tax revenue collections by continuously assessing tax exemptions from a cost-benefit perspective and amending the tax laws in cases where exemptions have outlived their usefulness. To this end, a VAT gap analysis is under way, with technical assistance from the IMF, to quantify the revenues foregone by statutory exemptions in the law. The results of this study will inform an action plan to be presented to Cabinet with the aim of implementing the recommendations in the FY2014/15 budget.
27. In addition, Government will send to Parliament the amendments to the Income Tax Act that were committed to at the time of the previous review but were delayed due to lack of consensus within cabinet. These include the amendment of the thin capitalization rule to limit excessive use of related party debt, the introduction of a capital gains tax on the disposal of commercial buildings by resident individuals, and the elimination of tax exemptions on income derived from agro processing and export businesses.
28. Further tax measures to strengthen revenues for next fiscal year’s budget will include the termination of VAT exemptions on i) hotel accommodation, ii) the textile sector, iii) packaging materials, and iv) feeds for poultry and livestock.
29. Reforms in tax administration also feature prominently in Government’s strategy to increase tax revenues in the medium term. To this end, efforts will be intensified to enforce compliance of the different types of taxpayers by improving risk profiles for different taxpayer segments and goods and sectors of operation. A particular focus will be on problematic industries, including wholesale and construction. Moreover, there will be a risk profile assessment of the top 216 importers, and top volume clearing agents, to identify, quantify, and channel their trade on the basis of evaluated risk levels. A National Targeting Centre will be created and provision to increase staff levels has also been made in the customs structure review.
30. Enforcement of the use of a unique tax identification number for all businesses who receive trading and other licenses and permits from the Kampala City Council Authority and local

UGANDA
48 INTERNATIONAL MONETARY FUND
governments will be stepped up. Partnerships have also been further enhanced with specific Government institutions through the signing and monitoring of memoranda of understanding. The Uganda Revenue Authority (URA) plans to continue working closely with other ministries and agencies to identify and address the low levels of taxpayer compliance, especially among Government suppliers.
31. URA will also clean up the tax registers to ensure they contain solely those capable of filing monthly and paying. This exercise has been refocused to cover both the large and medium taxpayers’ offices. Work is ongoing on the PAYE ledgers, whose system solution is already implemented. The development of a solution for the VAT ledgers is now at testing level. Current plans are to cover the larger taxpayers who bring in at least 90 percent of the revenue by June 2014 for PAYE and VAT.
Dealing with Arrears
32. Progress on the removal of arrears has proven challenging, but Government remains committed to eliminating them. To this end, an indicative target on the reduction in the stock of unpaid bills, as measured by the Accountant General through internal audits, will be introduced. Data on repayment of domestic arrears and the remaining previous year’s stock of unpaid bills will be transmitted on a quarterly basis within six weeks of the end of each quarter to ensure timeliness and transparency.
Government’s Support of Inflation Targeting
33. Government will amend the Bank of Uganda Act to include provisions that would enable the BoU to adapt its functions to the inflation targeting framework and bring its capital to an adequate ratio of its monetary liabilities.
34. Government will continue to annually recapitalize the BoU to meet statutory levels, subject to the implementation of the BoU’s commitment to contain its non-monetary policy related operational and administrative costs. The undertakings of Government and BoU in support of these transactions are contained in a joint Memorandum of Understanding recently signed by both parties. The issuance of marketable government securities for this purpose will comprise diverse maturities so that the BoU can have appropriate instruments to conduct monetary policy under inflation targeting.
UGANDA
INTERNATIONAL MONETARY FUND 49
VII. Program Monitoring
35. Progress in the implementation of the policies under this program will be monitored through QAC, indicative targets (ITs), and structural benchmarks (SBs) detailed in the attached Tables 1 and 2 and through semiannual reviews. Quantitative assessment criteria are proposed for end-December 2013 and end-June 2014, to be monitored respectively at the second and third reviews. The second review is expected to be completed by end-June 2014 and the third review by end-December 2014. The attached Technical Memorandum of Understanding—which is an integral part of this memorandum—contains definitions and adjusters

Table 1. Uganda: Quantitative Assessment Criteria and Indicative Targets for June 2013–June 20141
(Cumulative change from the beginning of the fiscal year, unless otherwise stated)
ProgramAdjusted
targetOutturn Result Program
Adjusted target
Outturn Result ProgramRevised
ProgramProgram
Revised Program
Program
Assessment criteriaCeiling on the increase in net domestic financing of the central government 868 802 681 Met 257 n.a. -421 736 -54 1,053 1,862
Ceiling on the stock of external payments arrears incurred by the public sector 4 0 0 Met 0 0 Met 0 0 0 0Ceiling on the contracting or guaranteeing of new nonconcessional external debt 1,500 0 Met 1,500 0 Met 1,500 2,200 1,500 2,200 2,200 with maturities greater than one year by the public sector 4, 5
Ceiling on new external debt with maturity up to one year contracted or guaranteed by the public sector 4, 6 0 0 0 Met 0 0 Met 0 0 0 0 0Minimum increase in net international reserves of the Bank of Uganda (US$mn) 361 358 392 Met 16 n.a. 52 42 107 2 -140Share of oil revenue placed in the Petroleum Fund 7 100 100 100 Met 100 100 Met 100 100 100 100 100
Indicative targetsCeiling on the increase in base money liabilities of the Bank of Uganda 836 527 Met 239 109 Met 504 434 591 541 593Floor on tax revenue 7,015 7,005 Not met 1,813 1,779 Not met 4,024 3,988 5,977 5,972 8,314Expenditures on poverty alleviating sectors 2,498 2,448 Not met 607 n.a. 1,246 1,246 1,745 1,745 2,612Ceiling on the issuance of guarantees by the Government/Bank of Uganda 0 0 Met 0 n.a. 0 0 0 0 0Net change in the stock of domestic arrears 0 -24 -50
Inflation consultation clauseOuter band (upper limit) 9.8 9.0 9.7 9.6 9.3Inner band (upper limit) 8.8 8.0 8.7 8.6 8.3Core inflation target 8 6.8 6.6 Met 6.0 5.7 Met 6.7 6.6 6.3Inner band (lower limit) 4.8 4.0 4.7 4.6 4.3Outer band (lower limit) 3.8 3.0 3.7 3.6 3.3
Sources: Ugandan authorities; and IMF staff estimates and projections
(Billions of Ugandan shillings)
(Millions of US dollars)
June 30, 2013 2
(Billions of Ugandan shillings)
(Annual percentage change)
3 Proposed targets are measured as the change from June 2013, except as marked.
2 Proposed targets are measured as the change from June 2012, except as marked.
March 31, 2014 3 June 30, 2014 3December 31, 2013 3September 30, 2013 3
1 Defined in the Technical Memorandum of Understanding (TMU). Values for June 2013, December 2013 and June 2014 are quantitative assessment criteria except as marked. Values for September 2013 and March 2014 are indicative targets except as marked.
4 Continuous assessment criterion.5 Cumulative change from June 28, 2013. To be used exclusively for infrastructure investment projects. 6 Excluding normal import-related credits.7 To ensure full and transparent transfer of oil revenues to the fiscal accounts.8 Annual percentage change, twelve-month period average core inflation. Calculated as stipulated in the TMU.
UG
AND
A
50 INTERN
ATION
AL MO
NETARY FU
ND

UGANDA
INTERNATIONAL MONETARY FUND 51
Table 2. Structural Benchmarks
Policy Measure Macroeconomic Rationale
Date Status
1. Government to carry out the first stage of recapitalization of the Bank of Uganda with marketable securities to the amount stipulated by law.
To enhance monetary policy independence and central bank credibility.
July 2013 Met
2. Ministry of Finance to submit to cabinet regular quarterly reports on unpaid bills of nine ministries based on data in the Commitment Control System (CCS) for the previous quarter of the fiscal year.
To facilitate control and elimination of expenditure arrears.
October 1, 2013, for quarter ending June 30, 2013;
January 1, 2014, for quarter ending September 30, 2013;
April 1, 2014, for quarter ending December 31, 2013.
Not met
3. Government to carry out a VAT gap analysis in consultation with IMF staff and to publish such analysis.
To make transparent the costs of VAT tax expenditures.
March 2014
4. Government to complete the rollout of the IPPS to cover management of the payroll of all entities within central government.
To improve both governance and transparency of budget execution.
April 15, 2014
5. Government to complete the expansion of the treasury system (IFMS) to all of central government votes.
To improve both governance and transparency of budget execution.
April 15, 2014
6. Ministry of Finance to submit to cabinet amendments to the Bank of Uganda Act including a provision for capital adequacy of BoU as an adequate percent of monetary liabilities, as well as other provisions to support implementation of inflation targeting.
To enable full monetary policy independence and credibility of the central bank.
May 2014
7. Government to start introducing a treasury single account for IFMS related transactions, including for the TGAs, salaries, and IFMIS projects.
To improve both governance and transparency of budget execution.
March 2014
8. Government to present to cabinet within the budget framework paper an action plan to implement the recommendations on addressing tax exemptions that come out of the VAT gap analysis.
To improve tax efficiency. May 2014

UGANDA
52 INTERNATIONAL MONETARY FUND
9. Government to include in the Budget Framework Paper a status report of all ongoing PPP programs, including individual estimates of each project’s contingent liability.
To enhance fiscal transparency.
March 2014
10. Government to have issued a minimum of 1 million ID cards under the new national identification system.
To support efforts to strengthen revenue collection, promote the unique identification of financial sector clients, and combat money laundering and the financing of terrorism.
May 2014
11. Government to eliminate the income tax exemption on income derived from agro-processing.
To increase revenue and tax administration efficiency.
July 2014
12. Government to continue with annual recapitalizations of the Bank of Uganda with marketable securities to bring capital to the statutory level until amendments to the Bank of Uganda act come into force, on the basis of the BoU’s implementation of its commitment to contain operational and administrative costs.
To enhance central bank efficiency. To enhance central bank discipline and monetary policy independence.
June 2014
June 2015

UGANDA
INTERNATIONAL MONETARY FUND 53
Attachment II. Technical Memorandum of Understanding
I. Introduction
1. This memorandum defines the quarterly assessment criteria and indicative targets described in the Memorandum of Economic and Financial Policies (MEFP) for the financial program supported by the IMF Policy Support Instrument (PSI) over the period of December 30, 2013—June 30, 2014, and sets forth the reporting requirements under the instrument. For the first year of the PSI-supported program, the stock of all foreign assets and liabilities will be converted into U.S. dollars at each test date using the average cross exchange rates referred to in the table below for the various currencies and then converted into Uganda shillings using the program average U.S. dollar-Uganda shilling exchange rate for March 2013.
II. Consultation Mechanism on Inflation
2. The quarterly consultation bands for the twelve-month average rate of consumer price inflation, as measured by the core consumer price index (CCPI) published by the Uganda Bureau of Statistics (UBOS), are specified in the text table 1: Inflation Targets. Projected CCPI inflation for end-December 2013 and end-June 2014 will be subject to the consultation mechanism, while that for end-March 2014 is an indicative target.
Text Table 1. Inflation Targets Jun. 2013 Sep. 2013 Dec. 2013 Mar. 2014 Jun. 2014 Outer band (upper limit) 9.8 9.0 9.7 9.6 9.3 Inner band (upper limit) 8.8 8.0 8.7 8.6 8.3 Core inflation target 6.8 6.0 6.7 6.6 6.3 Inner band (lower limit) 4.8 4.0 4.7 4.6 4.3 Outer band (lower limit) 3.8 3.0 3.7 3.6 3.3
3. Should the observed average CCPI inflation for the test date linked to a PSI program review (i.e., end-December 2013 for the second review and end-June 2014 for the third review) fall outside the outer band as specified in text table 1, the authorities will complete a consultation with the Executive Board of the Fund on their proposed policy response before requesting completion of the review under the program. The authorities will not be able to request completing a review under the
US Dollar (US$) 1
British pound/US$ 0.66Japanese Yen/US$ 94.2SDR/US$ 0.67Kenyan Shilings/US$ 85.6Tanzania Shilings/US$ 1598.7Euro/US$ 0.78
Ugandan Shilings/US$ 2594.8
Program Exchange Rates (end-March 2013)

UGANDA
54 INTERNATIONAL MONETARY FUND
PSI-supported program if the average CCPI inflation has moved outside of the outer band as of the test date linked to such review, until the consultation with the Executive Board has taken place. In line with the accountability principles, the BoU will report to the public the reasons for any breach of the outer bands and its policy response. In addition, the BoU will conduct discussions with the Fund staff when the observed average CCPI inflation falls outside the inner band as specified for the end of each quarter in the above table.
III. Base Money
4. Base money is defined as the sum of currency issued by the BoU and the commercial banks’ deposits in the BoU. The commercial bank deposits include the statutory required reserves and excess reserves held at the BoU and are net of the deposits of closed banks at the BoU and Development Finance Funds (DFF) contributed by commercial banks held at the BoU. The base money limits for December 2013, March and June 2014 will be ceilings on the cumulative change from the monthly average based on daily data for June 2013 to the same monthly averages for December 2013, March and June 2014, respectively. Base money limits for December 2013, March 2014 and June 2014 will be indicative targets under the PSI-supported program.
IV. Ceiling on the Cumulative Increase in Net Domestic Financing of the Central Government9
5. Definition. The cumulative increase in net domestic financing of the central government (NDF) is defined from below the line on a cash basis as the sum of:
a. the change in net claims on the central government by the banking system: Net claims on the central government by the banking system is defined as the difference between the outstanding amount of bank credits to the central government and the central government's deposits with deposit corporations, excluding oil revenues in the petroleum fund and deposits in administered accounts and project accounts with the banking system, including the central bank. Credits comprise bank loans and advances to the government and holdings of government securities and promissory notes. NDF by deposit corporations will be calculated based on data from balance sheets of the monetary authority and deposit corporations as per the deposit corporations’ survey. b. the change in net claims on the central government of domestic nonbank institutions and households: net claims on the general government of domestic nonbank institutions and households are defined as treasury bills, bonds or other government securities held by nonbank institutions and households (including nonresidents and nonresident financial institutions), plus any other liabilities of the central government to domestic nonbank
9 The central government comprises the treasury and line ministries.

UGANDA
INTERNATIONAL MONETARY FUND 55
institutions or households. All changes will be calculated as the difference between end-of-period stocks, net of any valuation changes resulting from currency movements.
V. Floor on Net International Reserves of the Bank of Uganda
6. Net international reserves (NIR) of the BoU are defined for program-monitoring purposes as reserve assets of the BoU net of short-term external liabilities of the BoU. Reserve assets are defined as external assets readily available to, and controlled by, the BoU and exclude pledged or otherwise encumbered external assets, including, but not limited to, assets used as collateral or guarantees for third-party liabilities. Short-term external liabilities are defined as liabilities to nonresidents, of original maturities less than one year, contracted by the BoU and include outstanding IMF purchases and loans.
7. For program-monitoring purposes, reserve assets and short-term liabilities at the end of each test period will be calculated in U.S. dollars by converting the stock from their original currency denomination at program exchange rates (as specified in paragraph 1). The NIR limits for December 2013, March and June 2014 will be floors on the change of the NIR stock from June 2013 to December 2013, March 2014 and June 2014, respectively. The NIR limit for December 2013 and June 2014 will be quantitative assessment criteria under the PSI-supported program; the floor for March 2014 will be an indicative target.
VI. Expenditures on Poverty Alleviating Sectors
8. The indicative target on poverty -alleviating expenditures includes domestic expenditures inclusive of wages and salaries in the Health, Education, Water and Environment and Agriculture sectors as defined by the Government of Uganda’s functional budget classification. Compliance with the indicative floor for poverty alleviating expenditures will be verified on the basis of releases.
VII. Ceiling on Issuance of Guarantees by the Government or Bank of Uganda
9. The indicative target on issuance of guarantees by the Government or Bank of Uganda aims to prevent accumulation of contingent liabilities by the Government (including Government entities such as ministries, agencies and authorities). Included against the ceiling are any direct, contingent liabilities of Government (including entities that are part of Government such as ministries, agencies and authorities) issued after June 30, 2012, and including any guarantees issued before July 1, 2012, but which are extended after June 30, 2012. This excludes guarantee programs that have explicit budget appropriations.
VIII. Share of Oil Revenue Placed in Petroleum Fund
10. The purpose of this assessment criterion is to avoid a situation whereby petroleum revenues bypass the Ugandan budget framework. A petroleum fund will be created upon passage of the revised PFMB; in the meantime, government has established a petroleum revenue account at the Bank of Uganda. This QAC will be deemed satisfied if 100 percent of petroleum revenues are

UGANDA
56 INTERNATIONAL MONETARY FUND
transferred to this account upon collection by URA. These resources may then be spent or saved as governed by the organic budget law in force at the time (PFAA 2003 until the new PFMB is enacted).
IX. Tax Revenue
11. A floor applies on tax revenue of central government measured cumulatively from the beginning of the fiscal year. For program-monitoring purposes, tax revenue is defined as the sum of direct domestic taxes (PAYE, corporate tax, presumptive tax, other direct taxes, withholding tax, rental income tax, tax on bank interest, casino tax, unallocated receipts), excise duty and value-added taxes net of refunds and taxes on international trade minus temporary road licenses as defined by the Government of Uganda’s revenue classification
X. Domestic Arrears
12. Net change of domestic arrears of the central government: a ceiling applies to net change of domestic arrears of the government. The ceiling for each test date is measured cumulatively from July 1, 2013.
13. Definition. The net change of arrears is defined as the difference between the gross accumulation of new domestic arrears (defined as the difference in stock of unpaid bills, as measured by the Accountant General through internal audits) and gross repayment of any arrears outstanding since the beginning of the year under review (including repayment of older arrears).
14. Reporting requirement. Data on repayment of domestic arrears and the remaining previous year’s stock of arrears will be transmitted on a quarterly basis within six weeks of the end of each quarter.
XI. Adjusters
15. The NIR target is based on program assumptions regarding budget support, assistance provided under the Heavily Indebted Poor Countries (HIPC) Initiative and the MDRI, external debt-service payments. The NDF target is based on program assumptions regarding automatic access by commercial banks to the BoU’s rediscount and discount window facilities.
16. The Uganda shilling equivalent of projected budget support (grants and loans) plus HIPC Initiative assistance in the form of grants on a cumulative basis from July 1 of the relevant fiscal year is presented under Schedule A. The ceilings on the cumulative increase in NDF will be adjusted downward (upward), and the floor on the cumulative increase in NIR of the BoU will be adjusted upward (downward) by the amount by which budget support, grants and loans, plus HIPC Initiative, exceeds (falls short of) the projected amounts.

UGANDA
INTERNATIONAL MONETARY FUND 57
17. The ceiling on the increases in NDF will be adjusted downward (upward) and the floor on the increase in NIR will be adjusted upward (downward) by the amount by which debt service due10 plus payments of external debt arrears less deferred payments (exceptional financing) falls short of (exceeds) the projections presented in Schedule B. Deferred payments are defined as (i) all debt service rescheduled under the HIPC Initiative; and (ii) payments falling due to all non-HIPC Initiative creditors not currently being serviced by the authorities (that is, gross new arrears being incurred).
18. The ceiling on NDF will be adjusted upward (downward) by the amount by which the domestic currency equivalent of Government of Uganda share of spending on the Karuma and Isimba hydropower projects and the associated industrial substations through withdrawals from the Petroleum Fund and the Energy Fund (using the market exchange rate) exceeds (falls short of) the projected amounts as set out in Schedule C. Spending on these projects financed by external borrowing are not included in this adjustor.
19. The ceiling on NDF will be adjusted upward (downward) by the amount by which inflows into the petroleum fund falls short of (exceeds) the projected amounts as set out in Schedule D.
10 Debt service due is defined as pre-HIPC Initiative debt service due, excluding debt service subject to HIPC Initiative debt rescheduling.
Sept-13 Dec-13 Mar-14 Jun-14
Cumulative from July 1, 2013 47 75 125 206
1Debt service is defined as pre-HIPC Initiative debt service.
Schedule A: Budget Support1
(Ush billions)
Sept-13 Dec-13 Mar-14 Jun-14
Cumulative from July 1, 2013 92 181 283 433
Schedule B: External Debt Service1
(Ush billions)
1Debt service due is defined as pre-HIPC Initiative debt service due, excluding debt service subject to HIPC Initiative debt rescheduling.
Sept-13 Dec-13 Mar-14 Jun-14
Cumulative from July 1, 2013 0 0 0 1,102
Schedule C: Expenditures on hydropower projects(Ush billions)

UGANDA
58 INTERNATIONAL MONETARY FUND
20. The floor on the increase in NIR will be adjusted upward by the amount by which withdrawals from the Ush denominated deposits of the Government of Uganda in the Energy Fund and the Petroleum Fund (using the market exchange rate) to finance the Government of Uganda share of Karuma and Isimba hydropower plants (HPP) and the associated industrial substations falls short of the projected amounts as set out in Schedule E. The Government of Uganda will first withdraw the foreign currency denominated portion of its deposits in the BoU, including any new foreign currency inflows to the Petroleum Fund and the Energy Fund compared to the projected amounts as set out in Schedule D.
21. Underlying the above adjustor, the currency composition of the Energy Fund and the Petroleum Fund are given below. The foreign currency denominated deposits of the Petroleum Fund and the Energy Fund do not constitute part of the BoU’s international reserves and as such are recorded under other foreign assets of the BoU. Any further foreign currency denominated inflows to these funds will continue to be recorded outside of the reserves and under other foreign assets of the BoU.
Dec-13 Mar-14 Jun-14
Cumulative change from November 1, 2013 0 0 0
(Ush billions)Schedule D: Inflows into Petroleum Fund
Ush
Energy Fund 301 181 (BoU reserves)Petroleum Fund 1162 171 (BoU other assets)
USD
Stock of the Oil and Energy Fund by November 1, 2013(Ush billions and USD millions)
Dec-13 Mar-14 Jun-14
Cumulative change from November 1, 2013 0 0 253
Schedule E: Withdrawals from the Energy and Petroleum Funds to Finance HPP
(US$ millions)

UGANDA
INTERNATIONAL MONETARY FUND 59
22. The ceiling on NDF will be adjusted upward (downward) by the amount by which the recapitalization of the Bank of Uganda exceeds (falls short of) the projected amounts as set out in Schedule F.
Schedule F: Recapitalization of the Bank of Uganda
(Ush bil lions)
Sept-13 Dec-13 Mar-14 Jun-14
Cumulative from July 1, 2013 0 0 0 0
XII. Ceiling on the Contracting or Guaranteeing of New Non-concessional External Debt by the Public Sector, and Ceiling on the Stock of
External Payments Arrears Incurred by the Public Sector11
23. The assessment criterion on short-term debt refers to contracting or guaranteeing external debt with an original maturity of one year or less by the public sector. Excluded from this assessment criterion are normal import-related credits and non-resident holdings of government securities and government promissory notes. The definition of “debt” is set out in paragraph 25.
24. The program includes a ceiling on new non-concessional borrowing with maturities greater than one year contracted or guaranteed by the public sector.12 Non-concessional borrowing is defined as loans with a grant element of less than 35 percent. The discount rates used for this purpose is 5 percent. The ceiling on non-concessional external borrowing or guarantees is to be observed on a continuous basis. The coverage of borrowing includes financial leases and other instruments giving rise to external liabilities, not only current as defined below, but also contingent, on non-concessional terms. External debt for the purpose of this assessment criterion means borrowing giving rise to liabilities to non-residents. Excluded from the limits are changes in indebtedness resulting from non-resident holdings of government securities and government promissory notes, refinancing credits and rescheduling operations, and credits extended by the IMF. For the purposes of the program, arrangements to pay over time obligations arising from judicial awards to external creditors that have not participated in the HIPC Initiative do not constitute non-concessional external borrowing. Excluded from these limits are also non-concessional borrowing within the limits specified in Table 1 of the MEFP. The ceiling also excludes non-concessional borrowing by one state-owned bank, Housing Finance Bank, which poses limited fiscal risk and is in a position to borrow without a government guarantee. The definition of debt, for the purposes of
11 The public sector comprises the general government (which includes the central government, local governments, and monetary authorities), and public corporations that are subject to “control by the government”, defined as the ability to determine general corporate policy or by at least 50 percent government ownership. 12 Contracting and guaranteeing is defined as approval by a resolution of Parliament as required in Section 20(3) and 25(3) of the Public Finance and Accountability Act, 2003.

UGANDA
60 INTERNATIONAL MONETARY FUND
the limit, is set out in point 9 of the Guidelines on Performance Criteria with Respect to External Debt (Executive Board’s Decision No. 6230-(79/140), as amended by Decision No 14416-(09/91), effective December 1, 2009). It not only applies to the debt as defined in Point 9 of the Executive Board decision, but also to commitments contracted or guaranteed for which value has not been received. 25. The definition of debt set forth in No. 9 of the Guidelines on Performance Criteria with Respect to External Debt in Fund Arrangements reads as follows:
(a) For the purpose of this guideline, the term "debt" will be understood to mean a current, i.e., not contingent, liability, created under a contractual arrangement through the provision of value in the form of assets (including currency) or services, and which requires the obligor to make one or more payments in the form of assets (including currency) or services, at some future point(s) in time; these payments will discharge the principal and/or interest liabilities incurred under the contract. Debts can take a number of forms, the primary ones being as follows: (i) loans, i.e., advances of money to the obligor by the lender made on the basis of an undertaking that the obligor will repay the funds in the future (including deposits, bonds, debentures, commercial loans and buyers' credits) and temporary exchanges of assets that are equivalent to fully collateralized loans under which the obligor is required to repay the funds, and usually pay interest, by repurchasing the collateral from the buyer in the future (such as repurchase agreements and official swap arrangements); (ii) suppliers' credits, i.e., contracts where the supplier permits the obligor to defer payments until sometime after the date on which the goods are delivered or services are provided; and (iii) leases, i.e., arrangements under which property is provided which the lessee has the right to use for one or more specified period(s) of time that are usually shorter than the total expected service life of the property, while the lesser retains the title to the property. For the purpose of the guideline, the debt is the present value (at the inception of the lease) of all lease payments expected to be made during the period of the agreement excluding those payments that cover the operation, repair, or maintenance of the property. (b) Under the definition of debt set out in point 9(a) above, arrears, penalties, and judicially awarded damages arising from the failure to make payment under a contractual obligation that constitutes debt. Failure to make payment on an obligation that is not considered debt under this definition (e.g., payment on delivery) will not give rise to debt.
26. The ceiling on the accumulation of new external payments arrears is zero. This limit, which is to be observed on a continuous basis, applies to the change in the stock of overdue payments on debt contracted or guaranteed by the public sector from their level at end-June 2013. External debt payment arrears consist of external debt service obligations (reported by the Statistics Department of the BoU, the Macro Department of the Ministry of Finance) that have not been paid at the time

UGANDA
INTERNATIONAL MONETARY FUND 61
they are due as specified in the contractual agreements but shall exclude arrears on obligations subject to rescheduling.
XIII. Monitoring and Reporting Requirements
27. The Government of Uganda will submit information to IMF staff with the frequency and submission time lag as indicated in Table 1. The quality and timeliness of the data submission will be tracked and reported by IMF staff. The information should be mailed electronically to [email protected].
Attachment II. Table 1. Summary of Reporting Requirements
Reporting Institution
Report/Table Submission Frequency
Submission Lag
I. Bank of Uganda
Issuance of government securities, repurchase operations and reverse repurchase operations.
Weekly 5 working days
Operations in the foreign exchange. Weekly 5 working days
Interest rates (7-day interbank, government securities). Weekly 5 working days
Commercial bank prime lending rate. Weekly 10 working days
Excess reserves of commercial banks. Weekly 5 working days
Private sector credit growth by shilling and forex. Weekly 10 working days
Disaggregated consumer price index. Monthly 2 weeks Balance sheet of the BoU, consolidated accounts of the commercial banks, and monetary survey.
Monthly 4 weeks
Daily balances of net foreign assets, net domestic assets, and base money of the BoU.
Monthly 4 weeks
Monthly foreign exchange cash flow table of BoU. Quarterly 4 weeks Statement of (i) cash balances held in project accounts at commercial banks; (ii) total value (measured at issue price) of outstanding government securities from the Central Depository System (CDS); and (iii) the stock of government securities (measured at issue price) held by commercial banks from the CDS.
Quarterly 6 weeks

UGANDA
62 INTERNATIONAL MONETARY FUND
Attachment II. Table 1. Summary of Reporting Requirements
Reporting Institution
Report/Table Submission Frequency
Submission Lag
Summary of (i) monthly commodity and direction of trade statistics; (ii) disbursements, principal and interest, flows of debt rescheduling and debt cancellation, arrears, and committed undisbursed balances—by creditor category; and (iii) composition of nominal HIPC Initiative assistance.
Quarterly 6 weeks
Summary of stock of external debt, external arrears, and committed undisbursed loan balances by creditor.
Quarterly 6 weeks
Standard off-site bank supervision indicators for deposit money banks.
Quarterly 4 weeks
Summary table of preliminary program performance comparing actual outcome with adjusted program targets for (i) base money; (ii) net claims on central government by the banking system; (iv) new non-concessional external borrowing; and (v) net international reserves.
Quarterly 6 weeks
II. Ministry of Finance
Summary of central government accounts. Revenues shall be recorded on a cash basis. Expenditures shall be recorded when checks are issued, except for domestic and external debt-service payments,13 cash transfers to districts, and externally funded development expenditures. Expenditures on domestic interest will be recorded on an accrual basis and external debt service will be recorded on a commitment basis (i.e., when payment is due).
Monthly 4 weeks
Summary of the stock of unpaid bills by central government MDAs, as measured by the Accountant General through internal audits.
Quarterly 6 weeks
13 The budget records domestic interest payments on a cash-basis while for program purposes this entry is reported on an accrual basis.
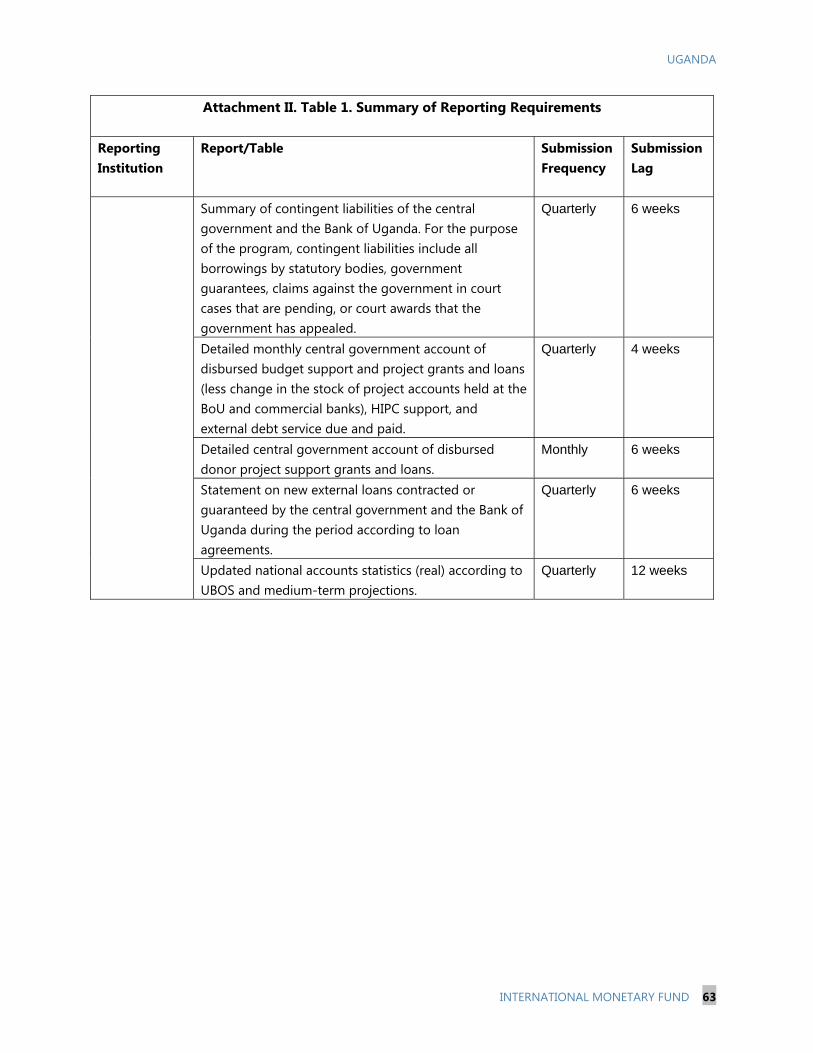
UGANDA
INTERNATIONAL MONETARY FUND 63
Attachment II. Table 1. Summary of Reporting Requirements
Reporting Institution
Report/Table Submission Frequency
Submission Lag
Summary of contingent liabilities of the central government and the Bank of Uganda. For the purpose of the program, contingent liabilities include all borrowings by statutory bodies, government guarantees, claims against the government in court cases that are pending, or court awards that the government has appealed.
Quarterly 6 weeks
Detailed monthly central government account of disbursed budget support and project grants and loans (less change in the stock of project accounts held at the BoU and commercial banks), HIPC support, and external debt service due and paid.
Quarterly 4 weeks
Detailed central government account of disbursed donor project support grants and loans.
Monthly 6 weeks
Statement on new external loans contracted or guaranteed by the central government and the Bank of Uganda during the period according to loan agreements.
Quarterly 6 weeks
Updated national accounts statistics (real) according to UBOS and medium-term projections.
Quarterly 12 weeks

UGANDA FIRST REVIEW UNDER THE POLICY SUPPORT INSTRUMENT—INFORMATIONAL ANNEX
Prepared By
The African Department
FUND RELATIONS _____________________________________________________________________________ 2
JOINT WORLD BANK-FUND WORK PROGRAM, JUNE 2013-JUNE 2014 __________________ 6
STATISTICAL ISSUES (AS OF OCTOBER 31, 2013) ____________________________________________ 8
CONTENTS
December 3, 2013

UGANDA
2 INTERNATIONAL MONETARY FUND
FUND RELATIONS
Membership Status: Joined: September 27, 1963 Article VIII
General Resources Account: SDR Million %Quota
Quota 180.50 100.00
Fund holdings of currency (Exchange Rate) 180.51 100.00
Reserve Tranche Position 0.00 0.00
SDR Department: SDR Million %Allocation
Net cumulative allocation 173.06 100.00
Holdings 139.78 80.77
Outstanding Purchases and Loans: SDR Million %Quota
ECF Arrangements 2.40 1.33
Latest Financial Arrangements:
Date of Expiration Amount Approved Amount Drawn Type Arrangement Date (SDR Million) (SDR Million)
ECF 1/ Sep 13, 2002 Jan 31, 2006 13.50 13.50ECF 1/ Nov 10, 1997 Mar 31, 2001 100.43 100.43ECF 1/ Sep 06, 1994 Nov 09, 1997 120.51 120.511/ Formerly PRGF.
Projected Payments to Fund 2/ (SDR Millions; based on existing use of resources and present holdings of SDRs):
Forthcoming 2013 2014 2015 2016 2017
Principal 1.20 1.00 0.20Charges/Interest 0.01 0.03 0.03 0.03 0.03Total 0.01 1.23 1.03 0.23 0.032/ When a member has overdue financial obligations outstanding for more than three months, the amount of such arrears will be shown in this section.
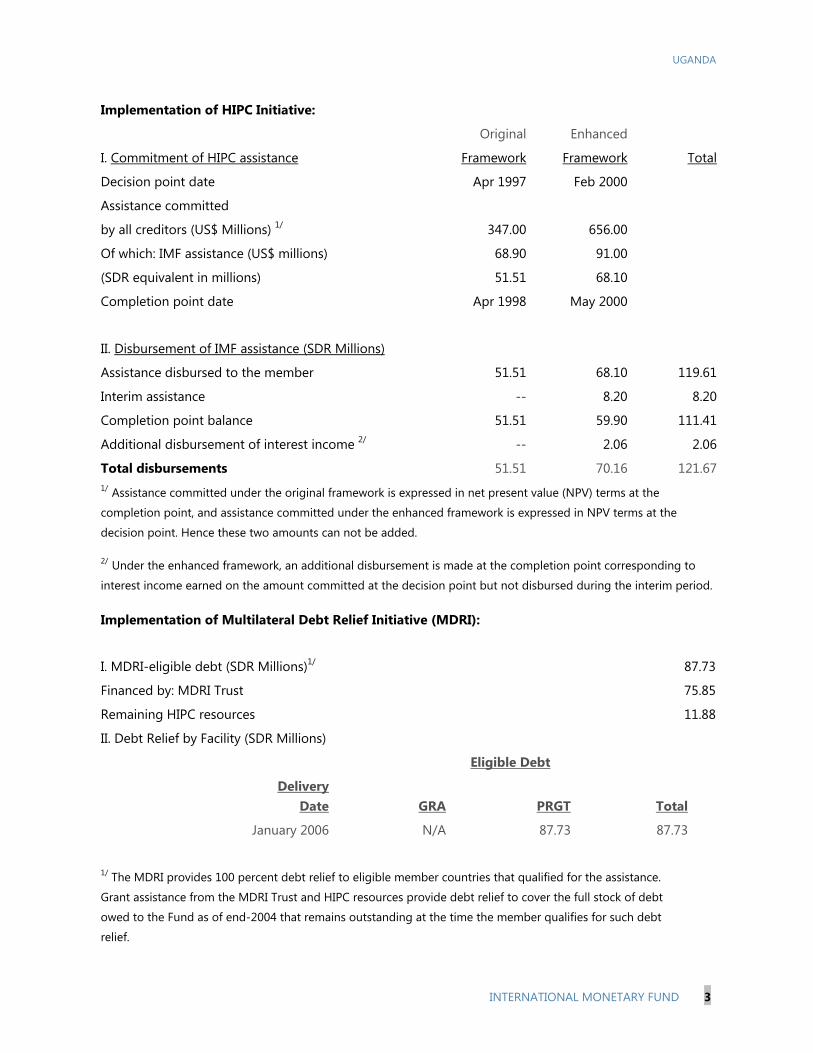
UGANDA
INTERNATIONAL MONETARY FUND 3
Implementation of HIPC Initiative:
Original Enhanced
I. Commitment of HIPC assistance Framework Framework Total
Decision point date Apr 1997 Feb 2000
Assistance committed
by all creditors (US$ Millions) 1/ 347.00 656.00
Of which: IMF assistance (US$ millions) 68.90 91.00
(SDR equivalent in millions) 51.51 68.10
Completion point date Apr 1998 May 2000
II. Disbursement of IMF assistance (SDR Millions)
Assistance disbursed to the member 51.51 68.10 119.61
Interim assistance -- 8.20 8.20
Completion point balance 51.51 59.90 111.41
Additional disbursement of interest income 2/ -- 2.06 2.06
Total disbursements 51.51 70.16 121.671/ Assistance committed under the original framework is expressed in net present value (NPV) terms at the
completion point, and assistance committed under the enhanced framework is expressed in NPV terms at the
decision point. Hence these two amounts can not be added.
2/ Under the enhanced framework, an additional disbursement is made at the completion point corresponding to
interest income earned on the amount committed at the decision point but not disbursed during the interim period.
Implementation of Multilateral Debt Relief Initiative (MDRI):
I. MDRI-eligible debt (SDR Millions)1/ 87.73
Financed by: MDRI Trust 75.85
Remaining HIPC resources 11.88
II. Debt Relief by Facility (SDR Millions)
Eligible Debt
Delivery Date GRA
PRGT Total
January 2006 N/A 87.73 87.73
1/ The MDRI provides 100 percent debt relief to eligible member countries that qualified for the assistance.
Grant assistance from the MDRI Trust and HIPC resources provide debt relief to cover the full stock of debt
owed to the Fund as of end-2004 that remains outstanding at the time the member qualifies for such debt
relief.

UGANDA
4 INTERNATIONAL MONETARY FUND
Implementation of Post-Catastrophe Debt Relief (PCDR): Not Applicable
Decision point - point at which the IMF and the World Bank determine whether a country qualifies for assistance under the HIPC Initiative and decide on the amount of assistance to be committed.
Interim assistance - amount disbursed to a country during the period between decision and completion points, up to 20 percent annually and 60 percent in total of the assistance committed at the decision point (or 25 percent and 75 percent, respectively, in exceptional circumstances).
Completion point - point at which a country receives the remaining balance of its assistance committed at the decision point, together with an additional disbursement of interest income as defined in footnote 2 above. The timing of the completion point is linked to the implementation of pre-agreed key structural reforms (i.e., floating completion point).
Safeguards Assessments: Under the Fund's safeguards policy, assessments with respect to the PSI are voluntary. An update assessment of the Bank of Uganda (BOU) was completed on April 10, 2007 and concluded that the BOU had strengthened its safeguards framework since the 2003 assessment. The main developments included implementation of International Financial Reporting Standards, publication of financial statements, establishment of an audit committee, and strengthening of the internal audit function. Staff made recommendations to address remaining vulnerabilities in the legal and internal control areas. Exchange Rate Arrangement: The official exchange rate is determined on the interbank market for foreign exchange. Uganda’s de jure exchange rate arrangement is free floating, and its de facto is floating. As of end-October, 2013 the official exchange rate was USh 2524.04 per U.S. dollar. The exchange system is free of restrictions on the making of payments and transfers for current international transactions. Article IV Consultation: The Executive Board concluded the last Article IV consultation on June 28, 2013. The next Article IV consultation with Uganda will be held in accordance with the decision on consultation cycles adopted September 28, 2010, as amended.

UGANDA
INTERNATIONAL MONETARY FUND 5
Technical Assistance: Uganda has continued to receive extensive technical assistance from the Fund in recent years.3 In the last months, FAD provided TA to the Uganda Revenue Authority (URA) in the areas of modernization to increase tax Compliance and improve revenue performance; and consolidating customs risk management practices and post clearance audit. Follow up missions for the the introduction of the Treasury Single Account and Cash Management also took place. A mission on Assessing Output Budgeting Tool was also conducted. A follow-up mission for the VAT gap analysis is planned for early 2014. MCM also continued to provide TA to Uganda to refine monetary and foreign exchange operations and deepen markets in order to enhance the effectiveness of monetary policy implementation and support the move to an inflation targeting regime. Recent missions include assisting the BoU to implement stress testing as part of the broader financial stability analysis; improving the licensing framework for banks in Uganda; assisting the Bank of Uganda on National Payments System Oversight Capacity Building; and assisting in the Reform of the Primary Dealer System in Government Securities. STA, with AFRITAC East, also continued to provide TA in the areas of price statistics and national accounts, providing assistance to the UBOs in the production of rebased GDP estimates and improved quarterly GDP estimates. LEG is also supporting Uganda with a comprehensive review of the existing BoU Act.
Resident Representative: The Fund has maintained a resident representative in Uganda since July 1982. Currently, the Senior Resident Representative, Ms. Ana Lucía Coronel, is also Mission Chief for Uganda. _________________________________ 3 For a description of technical assistance provided prior to June 2013, see the staff report for Uganda: 2013 Article IV
Consultation and Sixth Review Under the Policy Support Instrument (IMF Country Report No. 13/215).

UGANDA
6 INTERNATIONAL MONETARY FUND
JOINT WORLD BANK-FUND WORK PROGRAM, JUNE 2013-JUNE 2014
Title Products Provisional
Timing of Missions (if relevant)
Expected Delivery Date
1. World Bank Work Program
The current IDA portfolio consists of 14 operations with net commitments of US$1.46 billion, and 5 regional projects with net commitments of US$95.7 million. Key sectors of support include agriculture, transport, energy, water, urban, education, and health. Recently approved projects include the Municipal Infrastructure Development Program, and the Competitiveness and Enterprise Development Project. The near future (FY14) pipeline includes the Albertine Region Sustainable Development Project, Second Kampala Infrastructure and Institutional Development Project, the North-eastern Corridor Road Asset Management, and the Additional.
PRSC 9 disbursement was disbursed in June 2013. These series had been designed to improve efficiency of public expenditures and value for money in health, education, transport, and water and sanitation by addressing both cross-cutting (such as public financial management) and sector-specific bottlenecks. The Bank has suspended PRSCs, but remains open to negotiating new modalities and approaches to delivering budget support.

UGANDA
INTERNATIONAL MONETARY FUND 7
Public Investment Management (with support with DFID trust fund).
Project became effective in July 2013 and is expected to have delivered some outputs by June 2014
Economic Update series (FY14) Edition 3 - Special focus – decentralization Edition 4 - Special focus – pension reform (tbc)
December 2013 May 2014
Country Economic Memorandum (FY14) focusing on Uganda’s sources of growth accounting for the linkages of the new natural resources economy.
Concept note: November 2013
June 2014
2. Fund Work Program
First review of the PSI October 2013 December 2013
Second review of the PSI May 2014 June 2014
TA priorities: VAT gap analysis;
Extractive Industries and general tax policy;
PFM reform implementation;
Monetary policy and transition to inflation targeting; Review of the BoU Act, Review of MoU between Bank of Uganda and the MoFPED, BoU recapitalization, foreign exchange intervention in the context of inflation targeting, refining macroeconomic forecasting model.
Enhancing macroeconomic statistics, including national accounts, BoP data, and GFS.
January 2014 TBD TBD February 2014
TBD TBD TBD TBD
3. Joint Work Program
Joint DSA update
Joint DSA update
October 2013 May 2014
December 2013 June 2014

UGANDA
8 INTERNATIONAL MONETARY FUND
STATISTICAL ISSUES (AS OF OCTOBER 31, 2013) I. Assessment of Data Adequacy for Surveillance
General: Overall data provision is adequate for surveillance purposes, although some shortcomings remain. Real sector statistics: Since 2004 Uganda has been receiving technical assistance from the East African Technical Assistance Center (AFRITAC East) and, more recently on the compilation of annual and quarterly national accounts. In late 2011 the authorities started to disseminate quarterly GDP estimates at 2002 constant prices by economic activity. Following several TA missions, the Uganda Bureau of Statistics (UBOS) is currently disseminating improved quarterly constant price GDP estimates through its website. The next phase of this project is to produce current price quarterly GDP estimates, as part of the rebase exercise with an expected release around end-May 2014. UBOS has recently produced balanced supply and use tables (SUTs) that include preliminary product balances for 155 activities by 161 products, with the assistance of AFRITAC East and external consultants. The SUTs will enable UBOS to improve the base year estimates and will put the GDP rebased (2009/10) estimates on a firm footing. AFRITAC East has undertaken several missions over the past three years to assist UBOS with improving the data sources and compilation system for the rebased annual and quarterly national accounts. Labor market indicators such as employment, unemployment, and wages/earnings are infrequently compiled and disseminated. UBOS aims to compile and disseminate these data categories on an annual basis, but due to resource and data unavailability, these data are compiled with a two year lag. From January 2010 the consumer price index (CPI) benefited from a rebasing using the (out-of-date) 2005/2006 Uganda National Household Survey. Its coverage was extended from six to eight urban areas, and improved formulas were adopted (at the elementary level, a geometric average—in accordance with COMESA regulations, and at the higher-level, a modified Laspeyres-type to facilitate incorporation of replacement items and better imputations). UBOS compiles and disseminates a Producer Price Index for Manufacturing (separately for domestic and local output) and for hotels. In June 2013, AFRITAC East provided technical assistance for the redevelopment of the producer prices survey (PPS) and producer price index (PPI). Further TA to rebase, improve and expand the PPI will be provided during the next two years. In addition, TA is expected to be provided to quality assure the planned new CPI and to develop export and import price indices.
Government finance statistics: The Ministry of Finance, Planning and Economic Development (MoFPED) compiles fiscal statistics following the Government Finance Statistics Manual 2011 (GFSM 2011), but for budgetary central government and local governments only. UBOS has recently been given official responsibility for compiling and disseminating these statistics and have been requesting technical assistance for two years.

UGANDA
INTERNATIONAL MONETARY FUND 9
Monetary and financial statistics (MFS): TA in FY2014 will aim at improving the institutional coverage and classification of other depository corporation (ODCs) and initiation of the collection and compilation of data for other financial corporations, mainly insurance companies and pension funds. This would build on previous missions financed by the Department for International Development (DFID) on the standardized report forms (SRFs). Uganda began publishing SRF-based monetary data from 2002 in IFS beginning in early 2009.
External sector statistics: The focus of an external sector statistics mission, conducted during February 2013, was on aligning Uganda’s balance of payments and IIP data to the sixth edition of the Balance of Payments and International Investment Position Manual (BPM6), and further enhancing source data collection. Particular areas of concern include: (i) net errors and omissions for the published BOP with respect to the financial year 2011-12; (ii) data collection on transactions in non-resident securities; and (iii) reliable current/capital transfer split for foreign aid and more detailed data on the costs of embassies abroad.
II. Data Standards and Quality
Uganda has participated in the General Data Dissemination System (GDDS) since May 2000. The metadata and plans for improvement need to be updated (from December 2008). Uganda is participating in the SDDS, government finance, and monetary and financial statistics modules of the Fund’s GDDS Project for Anglophone Africa (funded by the DFID). This project aims to assist participating countries in implementing plans for improvements identified in the metadata.
In February 2005, a STA mission prepared a Report on the Observance of Standards and Codes (ROSC), with results published in July 2006. The ROSC mission assessed data compilation and dissemination practices against international standards in national accounts, prices, government finance, and balance of payments statistics. The monetary and financial statistics were not assessed.
III. Reporting to STA Uganda reports government finance statistics (GFS) data according to the GFSM 2001 framework for the GFS Yearbook, but does not report any high frequency data for inclusion in the International Financial Statistics (IFS). The BoU reports regularly monetary data for the central bank and other depository corporations (ODCs) in the format of Standardized Report Forms (SRFs).

Press Release No. 13/522 FOR IMMEDIATE RELEASE December 18, 2013
IMF Executive Board Completes First PSI Review for Uganda
The Executive Board of the International Monetary Fund (IMF) completed today the first review of Uganda’s economic performance under the program supported by the Policy Support Instrument (PSI). The Board’s decision was taken on a lapse of time basis.1 The PSI was approved by the Executive Board on June 28, 2013 (see Press Release No. 13/78). The IMF’s framework for PSIs is designed for low-income countries that may not need, or want, IMF financial assistance, but still seek IMF advice, monitoring and endorsement of their policies. PSIs are voluntary and demand driven (see Public Information Notice No. 02/145). Uganda’s economic recovery continues to gain momentum. Mainly driven by public investment, and supported by appropriate policies, GDP growth reached 5¾ percent in 2012/13. Supported by the recovery of private sector activity and significant public investment in the construction of two large hydropower plants and road projects, growth is expected to rise to 6¼ percent in 2013/14. Monetary policy responded to a recent drought-related food price shock in a timely manner, keeping inflation within the expected path toward the 5 percent medium-term target. Aided by an improvement in the current account deficit, international reserves remained at a level equivalent to 3.9 months of imports, maintaining a welcome buffer against the uncertain global environment. Program performance was broadly satisfactory. All the end-June 2013 quantitative assessment criteria were met, and reforms on the structural front advanced. In particular, the first stage of the Bank of Uganda (BoU) recapitalization was completed, strengthening its balance sheet and reinforcing its independence. Actions were taken to improve public financial management practices, including the first phase of implementation of a treasury single account and the upgrading of key accounting systems. The Parliament is currently examining the Public Finance Management Bill, aimed at improving budget execution and credibility, and enhancing the reporting and accountability of public finances. However, progress on strengthening tax revenue collection has been slow. Further improvements are 1 The Executive Board takes decisions under its lapse of time procedure when it is agreed by the Board that a proposal can be considered without convening formal discussions.
International Monetary Fund Washington, D.C. 20431 USA
2
also required to avoid the accumulation of payment arrears and reduce the frequency of supplementary budgets. Monetary policy, in the context of the BoU’s inflation targeting framework, struck the right balance between signaling its commitment to low inflation, avoiding excessive exchange rate volatility, and ensuring consistency with the fiscal policy stance. Ongoing institutional reforms to strengthen central bank operations and consolidate its credibility will be critical. Fiscal policy is expected to accommodate the envisaged scaling up of public investment in infrastructure, while supporting low inflation and avoiding crowding out of private sector activity. In this context, it will be important to resist pressures for additional current spending through a strict adherence to the approved budget and financing. The construction of two hydropower plants, Karuma and Isimba, will more than double current electricity production and address a critical structural bottleneck to growth. The increase in the non-concessional borrowing ceiling under the PSI to finance these projects is consistent with debt sustainability, and the risk of external debt distress is expected to remain low. Going forward, to minimize risks it will be important to ensure timely implementation of the projects, transparent and efficient management and an adequate cost recovery strategy.