Embed Size (px)
Citation preview

December 2017
Research project funded by the UK’s Department for International Development
(DFID/grant number PO 5639) implemented by Tilburg University and Radboud University Nijmegen
http://www.tilburguniversity.edu/dfid-innovation-and-growth/
DFID Research Project:
‘Enabling Innovation and Productivity Growth in Low
Income Countries (EIP-LIC)’
Country Report Uganda


Acknowledgments
In 2013, the Department for International Development (DFID) awarded a grant to Tilburg
University and Radboud University Nijmegen for a 4-years research project ‘Coordinated Case
Studies – Innovation for Productivity Growth in Low Income Countries’ (PO 5639)1. The sizeable
research project, implemented in cooperation with academic institutions in African and Asian
countries, resulted in an extensive series of scientific papers and reports, databases and more
practical policy oriented documents.
On behalf of Tilburg University and Radboud University Nijmegen I would like to thank the British
people and DFID, in particular the Growth Research Team, for the support in this project.
This present report present the findings of the research activities in Uganda. The research output on
Uganda was amongst others the result of a fruitful cooperation with the Makarere University
Business School (MUBS), in particular Prof. Wasswa Balunywa, the Principal of MUBS and Dr.
Vincent Bagire. The valuable knowledge and experience of participating senior researchers Sarah
Kyejjusa, Diana Ntamu (Director of the Entrepreneurship Centre) and Hojops Odoch was absolutely
essential in organizing the research activities in Uganda.
We hope that this report is informative for policy makers within governmental agencies, donors and
NGOs involved in the promotion of innovation in manufacturing SMEs in Uganda and the region.
It is also targeted at SME owners and SME branch organisations who could use the report as
reference material for reflecting on and formulating the management and business strategies. For the
academic community with similar research interests, it may provide useful insights to providing
ideas or supporting them to identify and/or validate research questions and hypotheses.
Prof. Lex Meijdam (Dean Tilburg University)
Disclaimer
This material has been funded by UK aid from the UK government; however the views expressed
do not necessarily reflect the UK government’s official policies.
1 The research project was later renamed into Enabling Innovation and Productivity Growth in Low Income
Countries’ (EIP-LIC).


Basic data of the project
Project title ‘Enabling Innovation and Productivity Growth in Low Income Countries’ (EIP-
LIC). Formerly: ‘Coordinated Case Studies – Innovation for Productivity Growth in
Low Income Countries’.
DFID RP reference number PO 5639
Project objective To fill research gaps in the understanding of factors, institutions and policies that can
increase innovation and productivity in low-income countries in Africa and Asia.
Project period 1 May 2013 – 30 September 2018
Lead partner Tilburg University
Project Director: Prof. Lex Meijdam (e-mail: [email protected])
Coordinator: Jaap Voeten (e-mail: [email protected])
Partner Radboud University Nijmegen
Prof. Patrick Vermeulen (e-mail: [email protected])
Countries of study Kenya, Tanzania, Vietnam, Ethiopia, Uganda, Ghana, South Africa, India,
Indonesia, Bangladesh
Project website www.tilburguniversity.edu/dfid-innovation-and-growth


Contents
Executive summary ......................................................................................................................................... 4
1 Introduction ........................................................................................................................................... 10
2 Project approach and methodology ....................................................................................................... 12
2.1 Research ....................................................................................................................................... 12
2.2 Policy and research uptake ........................................................................................................... 15
3 Qualitative study in Uganda .................................................................................................................. 18
3.1 Case study method ....................................................................................................................... 18
3.2 Selected cases ............................................................................................................................... 18
3.3 Research and policy issues ........................................................................................................... 26
4 Innovation systems ............................................................................................................................... 32
4.1 Human capital and innovation...................................................................................................... 32
4.2 Institutions and innovation ........................................................................................................... 34
4.3 R&D and technical efficiency ...................................................................................................... 36
4.4 External knowledge sources ......................................................................................................... 37
4.5 Innovation and export .................................................................................................................. 39
4.6 Gender diversity and innovation .................................................................................................. 40
5 Finance for Productivity Growth .......................................................................................................... 42
5.1 Finance and demand for skill ....................................................................................................... 42
5.2 Mobile money and trade credit..................................................................................................... 43
5.3 Trade credit and access to finance ................................................................................................ 45
References ..................................................................................................................................................... 48
Annexes ........................................................................................................................................................ 50
Annex 1: Series of EIP-LIC working papers ............................................................................................ 50
Annex 2: Highlights of DFID/World Bank EIP-LIC survey Uganda ....................................................... 52


4
Executive summary
From 2013 to 2017, the British Department for International Development (DFID) funded a research
project on innovation and productivity growth with special reference to low income countries (LICs),
implemented by Tilburg University and Radboud University Nijmegen. The project focused on
understanding the factors, institutions, and policies that can increase business innovation and
productivity growth, particularly in manufacturing small and medium sized enterprises (SMEs). The
research was organised within two thematic areas: ‘Innovation Systems’ and ‘Finance for Productivity
Growth’. Research teams conducted the field work in ten countries in Africa and Asia, including Kenya,
Tanzania, Vietnam, Ethiopia, Uganda, Ghana, South Africa, India, Indonesia and Bangladesh. Various
academic institutions and World Bank offices in these countries were actively engaged as partners in
the research.
A key feature of the project is the combined quantitative and qualitative research approaches involving
enterprise surveys, randomised control trials (RCTs) and case studies. The collection of original data
resulted in a series of scientific papers, reports, policy briefs and open-access databases. The research
output is targeted at academics in development research as well as at innovation policy makers within
governments, businesses and development agencies, with a view to valorising research outcomes and
promoting evidence-based policy making.
The research was structured around the following set of research questions, initially formulated by
DFID to frame the research:
What firm-level and regional-level factors hinder or foster the engagement of firms in
innovative activities and commercialise the outcomes of their innovative activities?
What is the impact of in-house innovation activities versus collaborative innovative activities
or technology acquisition activities on the innovative performance of firms in developing
countries?
What is the role of economic spillovers within clusters of firms in fostering economic growth
and innovation?
What are the most critical barriers to the process of innovation and the diffusion of technology?
What types of links between the public/private sectors, universities, governments, NGOs and
the private sector are most conducive to innovation activity?
What is the role of demand side versus supply side policies?
In the course of the project implementation, new research questions emerged. Both original and emerged
research questions were addressed in the various scientific outputs.
This ‘Uganda Country Report’ presents an overview of the scientific output and policy implications
relating to Uganda. The scientific output comprises a qualitative research report, six papers within the
‘Innovation Systems’ theme involving data from Uganda, and three papers within the ‘Finance and
Productivity Growth’ theme, one specifically on Uganda and two using data from the neighbouring
countries, Kenya and Ethiopia. In Annex 1 a comprehensive list of all research working papers written
in the framework of EIP-LIC is presented. The key DFID/World Bank survey findings for Uganda are
presented in Annex 2.
Qualitative research
The qualitative research findings of the project are written down in a report accessible via the project
website. It is based on data collected through open semi-structured interviews with owners and
managers of SMEs in Kampala and the surrounding area. The qualitative report provides context to the

5
other research activities to validate, compare and complement existing theory in literature and research
design and hypothesis development with contemporary bottom-up realities on the ground in Uganda, as
perceived by manufacturing SME owners and managers. Specifically, the case descriptions illustrate
the different ways in which companies in Uganda introduce new products, processes, technology, or
machinery.
The cases show that the innovations in the Ugandan cases are not ‘new to the world’ high tech
innovations, but mostly incremental technology adoption, it is still critical for the firms’ survival and
growth. The interviewed owners and managers innovate step-by-step to see what works and what does
not. They mention that the skills and knowledge gained through formal education do not match the
company’s requirements. No formal support from innovation systems institutions was received in their
efforts to innovate.
In terms of these innovation manifestations, Uganda fits best in the classification of a factor-driven
economy competing on factor endowments, unskilled labour and natural resources. As a country
becomes more competitive, productivity will increase and wages will rise with the advancing
development. Imported products remain cheaper, while some owners mention that these have inferior
quality. Interestingly, in such a context, innovation would be one way to make more efficient use of
resources and processes and compete with imports on the local market. An innovation focus on quality
would be a logical way forward.
Innovation systems
In the framework of the ‘Innovation Systems’ research theme, six scientific papers (downloadable from
the project website) were developed involving quantitative data on Uganda. The first scientific paper
analyses the relationship between firms’ human capital endowments and firm-level practices to improve
innovative output. The research finds that employee schooling is a relatively unimportant factor for
innovation within SMEs. However, it demonstrates a strong relationship between formal company
training and the probability of producing innovative output. Furthermore, the research finds that a firm
that gives slack time to its employees has a higher probability of producing innovative output. An
implication is that government agencies could develop special policies and programmes that encourage
and support SMEs in providing formal company training. Policies and programmes could assist in the
development of formats and curricula for such in-company training programmes. Lastly, a government
might inform the business community of how slack time could contribute to innovative ideas and output
from employees, encouraging them to establish a culture which includes slack time as routine and a way
to promote innovation.
The second scientific paper within the ‘Innovation Systems’ theme reviews regional institutional quality
through data from Uganda, Kenya and Tanzania. The study finds that firms situated in an environment
with a low degree of institutional quality have a lower likelihood of conducting and benefitting from
R&D. A lack of legislative transparency creates uncertainty, discouraging firms from investing in R&D.
The implication for policy is to focus on strengthening institutions by fighting corruption, enforcing the
rule of law and fostering regulatory quality. This is not only important at the national level, but is also
beneficial at the regional level. Policy makers could make ‘best practices’ out of the regional
implementation and enforcement of their national institutional policies and facilitate the spread of these
best practices across the rest of their country.
The third scientific paper using data from Uganda finds that R&D within firms decreases technical
efficiency. This is surprising because it has been previously suggested that inefficiency in
manufacturing firms in Africa arises from a lack of organised R&D and low levels of investment in
internal R&D. The low rates of human capital found in Africa, necessary to make the adoption of
advanced foreign technology worthwhile, may indicate a lack of capacity for sophisticated R&D

6
activities. The implication for government support is a policy focus on the operational environment,
being the underlying factor behind the apparent mismatch between internal R&D and efficiency. The
challenges here include limited access to credit and inputs, low levels of human capital, poor
infrastructure and poor governance.
The fourth scientific paper assesses the importance of external knowledge sources to firm-level
innovation. The research finds that regional variations in knowledge availability influence the success
of openness. In regions with high knowledge availability, the relationship between openness and
innovation is similar to that found in Western countries, which adds to the external validity of this
relationship. The study shows that firms located in regions where knowledge availability is lower are
more innovative when they are not using search breadth and only low levels of search depth, indicating
that in some environments, closed innovation is preferable. These results contrast with most previous
research on open innovation, which highlighted the benefits and the positive relationship with
innovative performance. Interestingly, the research results indicate that openness can even be a harmful
strategy, which should be acknowledged by policy makers. In regions where knowledge availability is
lower, being open has more costs than benefits. In policy making, the context should be considered
explicitly when establishing a relationship between openness and innovation. For governments, the
concept of openness is not automatically replicable from one context to another, and collaboration with
new partners could result in lower innovative performance.
The fifth scientific paper investigated the bi-directional relationship between innovation and exporting
in four countries in Sub-Saharan Africa, amongst others in Uganda The research finds that the relation
between innovation and subsequent exporting is positive and significant. The other way around, there
is a positive but non-significant relation between exporting and subsequent innovation. The research
further indicates that market creation mediates the innovation-exporting relationship because the
innovation process entails the introduction of new products and services to the marketplace. Moreover,
customer feedback mediates the relation between exporting and innovation to a large extent. Innovation
policies aimed at fostering product innovation by providing incentives may be crucial for exporting.
Customer feedback mediates the exporting-innovation relation to a very large extent. Therefore, policies
focusing on information and communications technology infrastructure investment are vital in enabling
faster response to market needs. Additionally, export promotion policies encompassing instruments
such as export subsidies are likely to play a key role in stimulating innovation.
The sixth paper analyses the relationship between gender diversity and innovation output of firms. The
research shows that gender diversity at all levels in the organisation has a positive effect on innovation.
Furthermore, the research illustrates that a country’s level of economic opportunity for women plays an
important role in the relationship between gender diversity and innovation. Policy makers must
acknowledge the value of gender diversity for innovation and create awareness among managers and
employees that innovation emerges and blossoms from gender diversity at the firm level. Government
agencies could develop special policies and programmes which encourage and support firms to hire a
more gender-balanced workforce, secure more female top managers, and develop a gender diverse
ownership structure. This could take the form of awareness raising programmes explaining the
particular benefit of gender diversity for a firm’s likelihood to innovate. Furthermore, the introduction
of tax advantages, subsidies or other incentives targeted at increased gender diversity at all hierarchical
levels within a firm could be a driver for increased gender balance. An additional avenue for policy
makers is to encourage a social perception of women as being equally valuable members of society,
with the same rights and obligations as men.
Finance for productivity growth

7
The first scientific paper within the ‘Finance for Productivity Growth’ theme investigates interactions
between access to finance and employment creation for educated workers in Uganda. The research
shows that the extent to which micro and small businesses expand skilled employment, as their sales
and profits increase, depends significantly on access to external funding. Firms with positive
performance and a bank loan will hire more trained and experienced employees. Thus, growing and
profitable small businesses create more jobs for trained and experienced workers - which is interpreted
as demand for skill - if they have access to external finance. The analysis does not reveal a significant
relationship in the case of hiring casual employees or family and friends in the informal context,
suggesting that financing constraints are more likely to bind in the context of employment contracts
associated with experienced and trained employees with high human capital intensity.
Regarding policy, the research findings underline the importance of well-developed financial systems
for policies focusing on job creation. Firms with greater financial flexibility are more likely to hire
skilled labour once their performance improves. For policy makers focusing on the challenge of creating
formal and permanent jobs in a developing society, devising a complementary financial sector policy is
equally important. The policy should go beyond helping firms directly to strengthening efficient
financial systems and credit programmes as well. Better access to external funding can thus be an
accelerator of human capital investment demand and growth. Policy makers must also acknowledge
that firms which are financially constrained save a greater proportion of their additional profits (or pay
other expenses associated with financial constraints) and therefore cannot invest further in greater levels
of employment. If access to finance is difficult, one could question the optimal effectiveness of
employment creation policies. For government, interest rates by state banks would be a first point of
attention in policy efforts to create formal employment of higher skilled labour. Against this
background, policy monitoring systems for employment creation could include the degree of access to
finance. Looking at it from the other side, formal credit policies and programmes could include formal
job creation, since the two are linked.
The second paper focuses on access to trade credit involving data from Kenya, a neighbouring country
of Uganda. An increasing body of literature stresses the significant role this plays in economic
development in LICs, including Uganda. Unlike credit from official financial institutions, trade credit
does not rely on formal collateral but on trust and reputation. The research explored whether the use of
electronic money within their business helps entrepreneurs to access such trade credit. The research
team found a positive relation between the use of mobile money ‘M-Pesa’, as a payment method when
purchasing inputs from suppliers, and access to trade credit among SMEs. A theoretical implication of
the research is that the use of mobile money lowers the probability of theft and alleviates trade credit
constraints, thereby stimulating entrepreneurial performance.
Policy implications point toward overcoming SMEs’ limited use of mobile money for their financial
transactions, compared to households in Kenya. Government policy makers, donors, NGOs’ policies
and programmes could explicitly focus on promoting its use within SMEs. The research suggests that
significant policy impact could be achieved if mobile money technology is promoted in combination
with trade credit. The research also provides input for the current policy debate on financial inclusion
in LICs. While for a long time there has been a focus on credit services for micro- and small
entrepreneurs, in recent years the policy debate has broadened to other financial services and
mechanisms. The research shows the importance of trade credit, providing efficient payment services
as a means to help firms expand their network and production.
The third scientific paper within the ‘Finance for Productivity Growth’ theme with relevance for
Uganda, investigated the relationship between bank credit and trade credit in the context of
neighbouring country Ethiopia. Specifically, the research question addressed whether usage of trade
credit decreases with access to bank credit, or whether the use of trade credit and bank credit are

8
positively associated. The findings suggest that bank finance and trade credit are substitutes in Ethiopia.
In locations with lesser access to formal bank finance, the use of trade credit is higher. The extension
of trade credit by suppliers generates a credible signal to banks with regard to the customers’
creditworthiness, which can make trade credit and bank credit complementary on the individual firm-
level. For informal retailers, bank credit acts as a counterpart to trade credit in the sense that higher bank
loan exposure is associated with greater access to trade credit. For formal firms, however, the research
reveals that having more bank loans is not a significant explanatory factor of the use of trade credit.
Having a relationship with a bank can also act as a signal of the creditworthiness of firms to their
suppliers and reduce the agency problems associated with trade credit. An important issue for studying
trade credit as a form of financing is its substitutability versus complementarity with respect to bank
credit. The researchers find that trade credit usage is more prevalent in locations with lower access to
finance, consistent with the substitutability theory.
Financial inclusion has been a key topic in development policy debates in many underdeveloped
countries, but most policy initiatives address the direct effect of bank credit constraints. This research
stresses the importance of the role of informality in understanding the association between trade credit
and bank credit. Informal firms feature non-transparent operations and rely on cash-based transactions,
partly to hide from tax authorities and partly due to the unavailability of bank accounts. Operational
transparency is a major element in accessing external finance, because without transparent (formal)
accounting standards, creditors cannot determine the quality of borrowers. Informal sector promotion
policies could focus on the notions and necessity of transparent operations though awareness, training
and education policies. Facilitating trade credit and bank credit could mutually strengthen each other,
for instance, in combined policy and development programmes integrating the two. Policies to expand
financial inclusion by increasing operational transparency might alleviate the agency problems of
informal enterprises vis-à-vis suppliers and enable them to obtain not only formal finance from banks
but also informal finance in the form of trade credit. For the formal sector, however, the research
suggests less expected policy impact. Although obtaining a bank loan is positively associated with
receiving trade credit for informal firms, the team does not find a similar significant link for the sample
of formal firms.
DFID/World Bank EIP-LIC survey Uganda
For a decade, the World Bank has conducted enterprise surveys in Africa and Asia to understand
economic development and business management features. As a focus of further inquiry, the World
Bank launched a series of Innovation Follow up Surveys (IFSs) in 2011 to collect data on firm-level
innovation several countries Africa and South Asia. The subsequent ICS Innovation Capabilities Survey
(ICS) is a follow-up and complementary to the IFS. The ICS implementation in Uganda in 2014 was a
joint effort of the World Bank and the DFID EIP-LIC project. The ICS comprises randomly selected
respondents from the IFS sample making its sample a subset of the IFS. The ICS focuses on innovative
activities and innovative capabilities of manufacturing firms.
ICS includes data from companies in the main regions in Uganda, represented by the major towns,
namely Kampala, Lira, Mbale, Jinja, Mbarara and Wakiso. The data involve firms in manufacturing,
particularly furniture, fabrication, equipment, craft making, construction and printing. The data show
significant innovations in processing and packaging, internship, new product development, training and
new equipment. The owners’ and managers’ objectives to innovate concerned increasing sales,
improvements in process, help communities, overcome regulations, competition and access new
markets. The survey further includes sources of

9
Various key variables are included in the dataset as presented in Annex 2 including the source of
information for the innovations, barriers to innovation, dynamic capabilities and trust and relationships
with external actors.
Research and policy dissemination
Based on the research outcomes, EIP-LIC produced series of policy briefs on promoting innovation in
manufacturing SMEs in LICs, targeted at a broad audience of policy makers. Innovation policy makers
are usually understood to be government officials and staff within various ministries (S&T,
industrialization, higher education and economic planning). However, innovation policies and strategies
are equally designed and implemented by managers, business owners and branch organizations in the
private sector. Likewise, development agencies, donors and NGOs also consider and integrate
(inclusive) innovation policies in their programs and projects. All these actors mutually interact and
could be enrolled in networks that promote and enable innovation in manufacturing SMEs in LICs. It
is envisaged that all these various stakeholders will make use of the EIP-LIC policy output.
The research output is accessible at the project website www.tilburguniversity.edu/dfid-innovation-and-
growth. The output includes the academic reports and papers, the open access databases, a series of
policy briefs and videos illustrating some key research findings and policy messages.

10
1 Introduction
The promotion of innovation in Low Income Countries (LICs) and emerging economies has recently
appeared on the agenda of policy-makers and international development agencies. Many agree that
innovation is crucial in these countries, because it is fundamental for growth in order to catch up with
middle and high income economies (Chaminade et al., 2010). Current research, theory development
and policy formulation to promote innovation, however, have mainly focused on innovation in the more
advanced economies, whilst investigation of these issues in low income countries to date has been
limited.
The 5-year research project ‘Enabling Productivity and Innovation in Low Income Countries (EIP-
LIC),’ funded by the British Department for International Development (DFID) and commissioned to
Tilburg University and Radboud University, aims to fill research gaps on innovation in LICs from an
economic perspective. EIP-LIC aims to deliver robust high quality evidence from Africa and Asia on
how to increase innovation and raise productivity in manufacturing SMEs, through a coordinated set of
thematic and country case studies providing internationally comparable data. The research has been
organized within two thematic areas: ‘Innovation System’ and ‘Finance for Productivity Growth’. The
countries of study include Kenya, Tanzania, South Africa, Ghana, Ethiopia, Uganda, Vietnam,
Indonesia, India and Bangladesh.
EIP-LIC focuses on manufacturing Small and Medium-sized Enterprises (SMEs) in LICs. Promoting
innovation in these enterprises has a particularly positive impact on development (Szirmai et al., 2011):
SMEs are usually operating on the boundary of the formal and informal sector and have low levels of
productivity and competitiveness. Compared to the agriculture and services sectors, manufacturing in
LICs is typically characterised by a limited share of the total GDP. Innovation within SMEs in
manufacturing enables these enterprises to raise productivity and grow, resulting in a better-balanced
economic structure while generating employment opportunities for poorer groups and contributing to
poverty reduction. Moreover, promoting innovation in domestic manufacturing is a way towards import
substitution and increases the competitive (export) position of firms on the world market.
The project collected primary data via enterprise surveys in collaboration with the World Bank,
conducted randomized control trials (RCTs) and carried out qualitative case studies in all countries of
study leading to a series of research papers and articles published in top journals and policy briefs. All
written output is available at the project website: www.tilburguniversity.edu/dfid-innovation-and-
growth
This ‘Uganda Country Report’ presents a summary of the key findings of EIP-LIC research of Uganda
and the associated policy implications. Chapter 2 sets out the overall project approach of EIP-LIC. In
chapter 3, the report introduces the SME manufacturing sector by providing some key finding abd
context of the qualitative study. Chapter 4 presents summaries of six research papers and policy
implications developed within the ‘Innovation Systems’ theme. Chapter 5 present presents summaries
of three research papers and policy implications developed within the ‘Finance for Productivity Growth’
theme. The policy implications in chapter 3, 4 and 5 are intended for government agencies, donors,
NGOs, branch organization or others to could take into consideration in their efforts to promote
innovation in manufacturing SMEs in Uganda. Annex 2 present the key survey findings as well as the
data addressing the research question articulated by DFID in the original project proposal.

11

12
2 Project approach and methodology
In 2012, DFID identified the need for research in this field, and set the terms of reference for project
proposals. Tilburg University’s successful proposal focused on an overall goal to contribute to
innovation and growth and raise productivity in low income countries (LICs), leading to job creation
and poverty reduction. The project aims to strengthen evidence-based policy making on innovation and
productivity issues in developing countries. At the direct operational and output level, its framework
comprises three areas of activity:
1. Research: open-access datasets and written research output (working papers, submitted articles and
reports) on productivity and innovation applicable to developing countries.
2. Policy and research uptake materials and dissemination.
3. Capacity development, to train and engage researchers in developing countries in policy relevant
innovation research. The project includes a capacity building component including PhD seminars
on research methods applied in the DFID project.
The approaches and methodologies involved in ‘Research’ and ‘Policy and Research Uptake’ are further
described in paragraphs 2.1 and 2.2 respectively. The capacity development component was of lesser
importance in the project and is not discussed in this report.
Project organisation
In terms of organisation and implementation, Tilburg University is the lead partner of the project, with
Radboud University Nijmegen (RUN) the main Dutch project partner. Within these universities, teams
of researchers were formed to prepare and manage the data collection and develop the academic output.
In every country of study, the research teams concluded cooperation agreements with academic partners
for joint implementation of fieldwork, data analysis, and paper and report writing. This cooperation also
incorporated research uptake and policy activities, involving interactions and stakeholder meetings with
policy makers within government, donors, NGOs and SME owners/managers. With regard to capacity
development, the Dutch project partners organised research methodology seminars for local academic
staff and students, in collaboration with their partners in the countries of study.
Partnerships were formed with the University of Nairobi (Kenya), University of Pretoria (South Africa),
University of Dar es Salaam (Tanzania), University of Ghana, National Economics University Hanoi
(Vietnam), University Indonesia, Ahmedabad University (India), Chittagong Independent University
(Bangladesh), and Makerere University Business School (Uganda). A cooperation agreement was
concluded with the World Bank for quantitative data collection in the 10 countries of study. For
randomised control trials within the ‘Finance for Productivity Growth’ research theme, a collaborative
agreement was concluded with The Abdul Latif Jameel Poverty Action Lab (J-PAL) in Jakarta,
Innovation for Poverty Action (IPA) in Accra and the National Board for Small Scale Industries
(NBSSI) in Ghana, amongst others.
2.1 Research
The first output area of EIP-LIC focuses on the development of high quality research output, data and
academic papers, examining ways to increase innovation in manufacturing SMEs in LICs. In particular,
the research teams addressed internal capabilities and external institutional factors, institutions and
policies that support or hinder the diffusion and adoption of innovation and finance raising productivity.
The research implementation was organised within two thematic areas: ‘Innovation Systems’ and
‘Finance for Productivity Growth’.

13
The written output of the research is systematically organised in a repository accessible via the
‘Publications and Reports’ menu on the project website. The repository is integrated into the overall
Tilburg University repository, established and maintained by its library. In addition, three types of open
access datasets are produced: (i) qualitative datasets, (ii) quantitative datasets under the ‘Innovation
Systems’ theme, and (iii) randomised control trial (RCT) quantitative datasets under the ‘Finance for
Productivity Growth’ theme. These are also accessible via the project website.
Research methodology challenges: combined qualitative – quantitative approach
Overall, the project involved a combined qualitative-quantitative research methodology, including
qualitative explorations in each country of study into policy and research issues, and quantitative data
collected through large scale surveys and RCTs. In the quantitative component, the project took an
‘economics’ perspective on innovation, and involved econometric analysis of a set of variables
concerning barriers at firm, regional and national levels and their causalities with the innovative
behaviour/capability of entrepreneurs and subsequently innovation and productivity. This constitutes a
reductionist and deductive approach in defining variables for analysis, in which the impact of individual
factors on innovation is assessed by applying quantitative econometric methods. The quantitative
analysis served as a basis for identifying relationships between internal capabilities, external
institutional factors and finance on the one hand and innovativeness and productivity growth on the
other.
Applying quantitative methods in development research brought some limitations and challenges. In
EIP-LIC, conceptual issues emerged, in terms of the definition and measurement of innovation and
productivity in LICs. These may seem straightforward variables at first glance, but their measurement
can be more complicated in the LIC context. Innovation may be manifested differently, not via high
profile technological and radical breakthroughs, usually measured by R&D expenditures or patents
(OECD, 2005), but by more incremental adoption and adaptation or new combinations of existing
technologies (Szirmai et al., 2011). These forms of innovation are equally important for raising the
productivity and competitiveness of SMEs in LICs.
Moreover, innovation research and theory development in recent decades have typically involved
empirical material from advanced economies, such as the innovation systems literature of Lundvall
(1992) and Freeman (1987), where innovation takes place within a relatively stable institutional and
Science, Technology and Innovation (STI) policy context, ‘controlled’ and supported by established
innovation system actors and innovation policies. In LICs, however, the contemporary institutional
realities and formal/informal dual economic contexts are different and may involve other less visible or
less commonly known factors and policies around SMEs affecting their innovativeness and how
innovation manifests itself.
Therefore, the theory and associated policies of how innovation evolves within an innovation system in
the institutional contexts in LICs may be different, which is increasingly acknowledged in recent
innovation systems literature (Lundvall, 2009; World Bank, 2010). For instance, entrepreneurs are
innovating by Doing, Using and Interacting (DUI) in fast-changing contexts, enabled by informal
institutions and informal (social) learning. Applying the research variables on innovation and
productivity in LICs from existing literature and theory (deduction) based on advanced economies,
therefore, might not take all relevant variables into account. A more precise identification of variables
might be obtained by complementing the selection with a broader understanding of contemporary
realities and context on the ground in LICs.
Qualitative studies

14
In an effort to manage these challenges, EIP-LIC included a complementary qualitative research
component, involving an exploration and description of contemporary realities of innovation in
manufacturing SMEs in LICs and emerging economies. This sought to inductively identify actual and
relevant research and policy issues as input for the EIP-LIC research themes as well as for additional
explanatory evidence supporting research outputs. This material could help researchers to validate,
compare and complement existing theory in literature and research design and hypothesis development
with contemporary bottom-up realities on the ground, as perceived by manufacturing SME owners and
managers.
In operational terms, Tilburg University and partners conducted a series of case studies of
manufacturing SMEs in each of the 10 countries of study in the project. The holistic case study approach
and method involved interviews capturing original insights, views and perceptions of SME owners and
managers. A similar report format and comparable data was used for all countries of study in EIP-LIC,
enabling cross-country comparison to identify overall trends and patterns in innovation and productivity
policy and research issues in manufacturing SMEs in LICs. The qualitative research findings for Uganda
are presented in chapter 3.
In each of the 10 countries of study, 15-20 semi structured interviews were held with owners and
managers of SMEs in manufacturing, textiles, metal processing, food processing etc. The interviews
discussed types of innovation, the firm’s history, its innovation processes, internal capabilities, and the
external business and institutional context. The owners and managers also shared their stories outside
this framework and advanced issues that are relevant and interesting for current scientific work. 170
interviews in total were recorded, transcribed and stored in a qualitative research database. The
concluding qualitative reports of all 10 African and Asian countries of study are downloadable from the
project website. Chapter 3 provides some key insights from the qualitative study in Uganda.
In line with DFID’s policy, the original intention was to publish the qualitative database as an open
access resource via the project website. However, in contrast to the numerical data, the qualitative data
contained some confidential information that owners and managers might not wish to have in the public
domain. This ethical consideration means that the interviews and transcripts are not freely available on
open access, but may still be used subject to a strict confidentiality agreement, in consultation with
Tilburg University.
Innovation systems research
The ‘Innovation Systems’ theme focused on understanding innovation in the manufacturing sector in
LICs, its processes and critical factors hindering or stimulating its diffusion, including innovation
policies and governmental institutions. The research involves the quantitative analysis of a set of
variables concerning barriers at firm, regional and national levels and their causalities with the
innovation capacity of firms. SMEs in manufacturing find it harder to survive than large firms, which
are typically more productive and more likely to innovate in the long term, securing employment and
economic growth. Regional conditions and infrastructures differentially affect levels of innovation and
technological and industrial development in developing countries.
The ‘Innovation Systems’ team obtained data in close cooperation with The World Bank, particularly
focusing on the World Bank Enterprise Survey (ES) and the Innovation Capabilities Survey (ICS). The
ES is an ongoing project covering over 155,000 firms in 148 countries, collecting data based on firms’
experiences and enterprises’ perception of the business environment and investment climate. The whole
population of the ES data is the non-agricultural economy, comprising firms from the manufacturing,
construction, services, transport, storage, and communication sectors.

15
The ICS is a follow-up and complementary to the ES, comprising a randomly selected subset of
respondents from the ES sample. It focuses on the innovative activities and capabilities of
manufacturing firms, and is a collaboration between the World Bank, Tilburg University and Radboud
University Nijmegen, funded by DFID through EIP-LIC.
The primary and secondary data enabled the ‘Innovation Systems’ researchers to produce a series of
working papers downloadable from the project website. The titles and full details of the papers are listed
in Annex … The data are available on open access for other researchers at the project website. All
working papers have been submitted to high quality journals, with some published and some still under
review at the time of writing this report. The primary and secondary data also enabled the team to
address the original DFID research questions underlying EIP-LIC, which are presented in chapters 4
and 5.
Finance for productivity growth
The ‘Finance for Productivity Growth’ theme focuses on understanding the effects of access to finance
in determining the productivity of SMEs and how constraints to investment finance influence growth.
The team identified interactions between firm-level characteristics, such as entrepreneurial traits,
country-level factors (such as industrial structure, institutional framework etc.) and access to finance.
Contrary to the research approach within the ‘Innovation Systems’ theme, the finance team conducted
four extensive RCTs in Vietnam, Ghana, Indonesia and Kenya. The interventions and associated
baseline and endline data collection were implemented with local partners including the Abdul Latif
Jameel Poverty Action Lab (J-PAL) in Jakarta and Innovation for Poverty Action (IPA) in Accra as
well as the National Board for Small Scale Industries (NBSSI) in Ghana. A series of academic papers
has been developed from this, listed in Annex 1. The dataset for each country, combining the listing,
baseline and endline data, will become available on the project website for future research and follow-
up RCTS or endlines.
2.2 Policy and research uptake
In following up on the research of EIP-LIC, the dissemination and uptake of the research evidence is
essential to justify the value for money of the project. The underlying principle of the project’s
engagement with potential users is to ensure that the research insights in the published output are useful,
accessible, actively disseminated and communicated in a way that enables potential users to engage and
make use of the research information in their own work (research valorisation). There are four target
groups of potential users of the EIP-LIC research outcomes:
Local policy makers of governmental agencies, international donors and development agencies and
NGOs, who may gain new insights into promoting innovation and productivity growth in the
manufacturing sector.
SMEs owners and SME branch organisations, who may learn from the management implications
of the research.
Researchers within the academic development research community, for whom the research
outcomes serve as a source of ideas and reference to develop their own research questions and
methods.
The general public worldwide interested in development and poverty alleviation issues. The
dissemination will inform the public about DFID’s innovation and growth approach to alleviating
poverty.
Policy and research uptake strategies
16
The project includes several strategies to interact with potential users. At the project start, the partners
organised a series of innovation policy stakeholder meetings in Kenya, Tanzania, South Africa,
Vietnam, Ghana, Indonesia, India and Uganda. Policy makers from government agencies, donors,
NGOs and SME owners and managers discussed the relevance of innovation and identified policy and
research issues. These issues were then followed up in the qualitative research component of the project.
A further dissemination mechanism has been the production of a series of EIP-LIC policy briefs in
which the findings and implications for policy of the academic papers are discussed. Each policy brief
is typically a 2-page presentation of key findings, practical suggestions and implications, accessible via
the project website.
The final collection of all research outputs is concluded in a series of country reports, which draw
together all the research findings for each country and are an important vehicle to disseminate the policy
messages. The last chapter of the report includes and elaborates on the country-specific policy
recommendations.
Lastly, three short videos were produced, focusing on key research findings and policy messages, using
high quality footage filmed in Accra, Nairobi and Kampala. The videos present a policy theme
illustrated by interviews with several SME owners and managers, tell the entrepreneurs’ story, provide
an idea of the realities they face on the ground, and show the resilience of the SME owners. They
provide policy makers with a sense of the difficulties of the local context, and suggest policy solutions
from the DFID research findings.

17

18
3 Qualitative study in Uganda
3.1 Case study method
The objective of the qualitative study of EIP-LIC is to identify relevant policy and research issues
concerning innovation in manufacturing SMEs within contemporary realities in Uganda. Applying a
case study approach is particularly useful in this respect, since this method is an approach for inductively
exploring and identifying concepts, noticeable similarities, trends and patterns of socio-economic
phenomena (Yin, 2003).
The case study research in Uganda involved a series of 13 interviews with managers and/or owners of
manufacturing SME in Kampala and around. The qualitative data collection through interviews took
place from 13 to 23 January 2017. The number of interviews may seem a limited number to justify
research validity. However, the approach usually involves in-depth rich and detailed descriptions and a
multidimensional analysis of the complexities and linkages of a few cases to gain an understanding of
the (socio-economic) mechanisms and processes of the case subject. In the case descriptions, innovation
as an economic phenomenon is the case ‘subject’, whereas the unit of analysis is a manufacturing SME.
The case description holistically explores the type and basic features of innovation within the SME, and
reviews the impact on productivity and competitiveness over the past 2 to 5 years.
The data for the case descriptions are obtained via ‘semi-structured’ interviews with SME owners and
managers. Of particular interest is what innovation means in the manufacturing SMEs in their context,
and the less known favourable and unfavourable institutional conditions and barriers enabling or
preventing it.
The selection criteria are defined in such a way that the selected cases represent the EIP-LIC target
group: manufacturing SMEs understood as a company with 10-100 employees. Moreover, the criteria
assure a certain homogeneity within the selected cases, which will enable comparison of cases while
supporting a certain validity of the identified trends or patterns. At the same time, allowing some
heterogeneity, by including deviant cases, provides more contrast, and thus enables the research team
to better construct and highlight divisions in the innovation process, linkages, system or mechanisms.
An essential element of the selection is the notion that types of SME innovation in LICs are not confined
to technological (radical) inventions resulting from particular R&D investments and efforts. Innovation
in manufacturing SMEs in LICs more often encompasses incremental adoption and adaptation or new
combinations of existing technologies, products, marketing, management or business practices.
Moreover, innovation often does not concern one type only. More often, an initial innovation enables
and/or triggers other types of innovation within a firm; a new technology allows the introduction of new
products, for instance.
From the eight cases in the comprehensive qualitative report of Uganda, accessible via the project
website, three cases are presented below to provide some insight on the daily realities of SMEs in
manufacturing.
3.2 Selected cases
Case 1: Construction materials – stone veneer (28 employees)
The first case concerns a company producing stone veneer. The owner started this business in 2010
together with his wife, cutting stones with a grinder in the front yard of his home. After initial
commercial successes, he moved into a larger workshop and bought his first professional machinery –
“now we have several stone cutting machines, as you can see in the workshop.” The company has 28

19
permanent workers at present. The work processes are jointly supervised by the couple. She attends the
accounts while he concentrates on technical part of the work.
The company cuts and polishes or carves the stones according to each client’s order. The veneer is
produced according to international standards in terms of size and thickness – “the thickness is critical
to avoid too much weight. The thinner the better.” The company cuts about 8 different kinds of rocks:
granite, marble and limestone, amongst others. Small trucks deliver the rocks from different locations
in Uganda. From the raw material, the owner develops 38 different product types of stone veneer. Apart
from the rocks, the main inputs are diamond cutting rings, electricity and water.
The company supplies to various clients including real estate developers, contractors, professional
builders, architects and engineers – “I also have an institutional buyer in Nairobi, who needs 2,000
stones every month.” The owner does not market his products “because I have sufficient clients and I
have limited capacity. I am hidden.” Customers find him via word of mouth.
The exactness of the stone cutting, which determines the quality, has been the strength of the company,
according to the owner. Other competitors in the neighbourhood also make stone veneer, but his is
produced with great precision. The other competitors only work in sandstone and kaolin, which is softer,
and only use hand tools. Over the years, the owner has invested in special machines that can handle
hard stone such as granite – “that is how we distinguish ourselves from other stone producers.”
The owner rents the plot of land where the workshop is located, but plans to move to an industrial area
in the near future, because there is no room for expansion at his current location. Moreover, the premises
are in a residential area, which poses an environmental challenge in terms of noise – “children live
around here and they have to go to school in the morning. Sometimes the noise is 24 hours a day.”
In 2013, he secured a contract for a large order with a value of 300,000 dollars from a real estate
developer who was building a shopping mall in Kigali (Rwanda) – “we supplied 6,000 m2 of veneer for
the outside walls, shop fronts and floors.” The developer paid partly upfront, which enabled the owner
to buy advanced machinery. He is still working with the same stone sawing machines today.
The Kigali contract was hard as well as rewarding work. At that time, the company employed 35 people.
He got the contract as a result of a meeting of the Uganda-Rwanda Business Forum, where he met a
Rwandan businessman who introduced him to the Chinese contractor in Kigali. The owner got in touch
with him to see some samples. “The chairman looked at me and said, ‘Can I gamble with you?’”
The owner was based permanently in Kigali for the
duration of the project, to ensure that everything went
well – “we were the small guys at the site.” His wife
remained in Kampala taking care of other customers’
needs and ensuring that production went on well to send
supplies to the site in Kigali His employees worked in
three shifts for 24 hours a day. Whenever there was a
small problem, he would solve it on the spot – “not for
only my stones but the rest of the builders.” The owner
learned a lot of things and “the work went very well
because the developer was supportive.”
He finished the contract properly because he wanted to show professionalism. As a result of the Kigali
contract, he managed to attract new customers.

20
Internal capabilities
The owner was educated in economics and business administration at university level and also did a
course in fine arts. His first job was in logistics and procurement, working in several locations in
Kampala, Mombasa and the United Arab Emirates. During his work and travels, he came across
companies producing stone veneer, which gave him the idea to start for himself.
The owner has organised the business according to what he learned in business administration. He
established an organisational structure and set up several departments including operations, human
resources, finance and marketing – “I had this idea that I should organise things well while I am still
small.” There are various explicitly defined positions and job descriptions in the company, such as
factory manager, product quality supervisor, floor manager and senior sales managers.
The owner is seeking to recruit a geologist to assess the quality of the stones. One issue is that he wants
to penetrate a new higher segment in the market. For this, he has to know the physical qualities and
strengths of the stones, but the owner himself has gained only basic practical knowledge – “I am not a
geologist but when I look at the stone I can tell you this is granite.”
The owner takes good care of his staff. Meals are provided, there is health insurance “and when they
fall sick, we bring them to the hospital.” One human resources staff member is responsible for welfare.
The employees are provided with gloves, noise and eye protection – “ever since we started, the only
person we have sacked is one individual who never complied with the safety guidance.”
Most of the technology involves a lot of manual work – “I know
there are some better machines but there is no need to introduce
them.” New advanced machines are expensive, which he cannot
afford within his current limitations on expansion, but “with new
machines, the production volume would increase a lot.”
The company controls for quality as the stones are packed on
pallets. Precision cutting of the stone veneer into the desired size
is essential – “the stones should fit well.” One staff member puts
the stones into the square metre for this purpose – “every stone is
checked.”
The owner is currently updating his product catalogue. He has
engaged experts from the National Environment Management
Authority to measure production emissions. For the new
catalogue, he wants to include data about carbon emissions, so
that clients can see that the products are developed in a
responsible way.
External business and institutional context
The owner has few interactions with the government and is unaware of innovation policies or
programmes targeted at manufacturing enterprises. Several ministers came to talk with him, but he has
little interest in this – “here, there is something wrong with the intentions of the people in government.”

21
According to the owner, everything starts and ends with the president. He believes that the president
himself has good intentions. However, in the end nothing happens and money disappears. People in
Uganda do their own thing and few feel a need to contact the government – “I don’t have time to go
chasing people who have bad intentions.”
The owner does not have credit from a bank, having had bad experiences in the past when the banks
were only looking at collateral, and particularly the machines. He had one bank employee who was
sceptical about the value of the company’s machines. “He asked, if you default, who will buy the
machine? I was dealing with the wrong guy.” Actually, the clients pay upfront so there are no problems
with cash flow and debtors. Only when he has a big contract will he go to the bank and get working
capital – “I haven’t gone out to get capital to buy machinery.”
Case 2: Textiles – gowns and clinical coats (25 employees)
This company produces a variety of textile products. The interview is held with the founder and director.
Since the start of the business in 1987, the core products have been PhD and ceremonial gowns. The
tailoring of these gowns is complicated and a certain quality is required – “we’ve been here for a long
time, so many institutions prefer to give us orders for the ceremonial and PhD gowns.” The company
has recently enlarged the range of products to include fashionable bags and cushions. To stay in
business, the company also has another line of products: clinical professional clothes for hospitals.
Tailoring was the owner’s hobby when she was a little girl – “I started sewing at the age of about 8.”
In high school, she studied tailoring subjects. She made dresses for her friends at no cost – “looking at
somebody with a dress I made was very encouraging.” In university, she kept up the hobby but studied
science, graduating with a BSc in chemistry. After graduating, she taught chemistry in a secondary
school for some years.
In 1985, while accompanying her husband during his PhD
studies in the UK, she attended a diploma course of a few
months at a fashion design school in London. She started
working for several textile factories, but had a rough start,
with complicated sewing machines and strict supervisors.
Nonetheless, she feels that the experience in London was
critical for her – “because the textile industry works very
fast and efficiently, which is something we need in
Uganda.” She came back to Uganda in 1986 and opened
her company. She saved money in the UK, which allowed
her to bring back 3 industrial machines.
Some time later, she met an American lady who gave US$5,000 for her to develop the business, which
meant she did not need bank credit to set up her tailoring workshop.
Initially, she started in a shop in the centre of Kampala, tailoring to order. People came in and ordered
what they wanted – “we became very popular and we got many customers.” However, the location
proved problematic in terms of safety, with high burglary rates, so she and her husband decided to move
to the outskirts of Kampala.
The new location was not as easy to find for her customers, so she changed from ‘clothes to order’ to
making her own designs – “people can come, see and just buy from the stock we have on display.”
However, this new approach did not work well. After a while, people would ask in the display room
full of clothes – “don’t you have anything new?” Then the idea came to make graduation gowns,
because the design does not change and can be made in large quantities.

22
In the early nineties, Makerere University in Kampala used to import these gowns from the UK. She
contacted the university but “it wasn’t easy to let us sell to them because they considered the imported
products better than ours.” She told the university representatives that the imported gowns are very
expensive and not even produced in the UK (she found out that the imported gowns from the UK were
actually made in developing countries such as India). With this argument, she secured her first order of
200 gowns. The PhD gown is a special and complicated design. The university gave the ‘secret’ design
to the company. Shortly thereafter, Makerere University started buying more gowns. Individual
graduates also placed orders – “we became popular because of our proximity to Makerere University.”
In the early ‘90s, she gained an MBA from Makerere to help develop her management skills – “during
that period, we made a lot of improvements in our workshop.” The cost of the MBA was affordable
because the business revenue meant she could easily pay the tuition fees. The MBA helped her to
organise her business, to develop mass production, and to improve staff management.
She involved the staff in solving internal problems and sought
their ideas in new product development – “I used much of what
they advised to improve.” She also regulated the working day
– “we used to come in at any time.” She set the rule that work
starts at 8 o’clock and begins with a prayer – “each of them can
lead the prayer and this improves their communication skills
and their confidence and they really work together, starting
from God.”
Occasionally, she sells gowns to a university in Malawi. She
sends the final products by DHL, but this is too expensive, in
her view.
In future, she would like to export more, but she considers export to be difficult, in terms of identifying
customers and working across borders – “you are not so sure whether the other person will pay.”
Internal capability and innovation
At present, 25 people are now working in the company, mostly women. In the past, the company hired
more casual workers in the event of a big order. There are 5 staff involved in the management and
administration, an accountant works three days a week and one member of staff manning the front
reception. The owner was trained in customer care. She and her husband are the managing directors.
Her husband used to work with Makerere University in a technical physics field, but has now retired
from the university and is engaged in consultancy. He has little involvement in the daily operation of
the business.
The company trains the production staff extensively. The owner explains that her experience in the UK
helped her to train her employees to work faster. The company gets interns – “they come in for an
internship and we mentor them and we show them how to run a textile business.” The owner is not
afraid that they might go away and start up their own businesses. She believes that her years of
experience give her a competitive advantage.
She sees that staff training results in higher productivity. In the past, the staff made 5 clinical coats a
day, whereas nowadays they can make 20 – “production capacity is growing because of the people
getting this experience.” The contracts for clinical coats are not very large. The company needs more
orders, as “our capacity is bigger than we use.” She is actively trying to secure more contracts and has
developed new marketing models – “we have Facebook, Instagram and a website.”
External business and institutional context

23
There are many challenges in business and “Uganda is a very difficult environment.” One problem is
the frequency of the power cuts – “you cannot rely on it when you are under pressure.” The company
has a small generator. It does not have a large capacity but can run some of the machines. Electricity is
also too expensive, according to the owner.
Most of the time, the company uses local suppliers who have imported fabrics and materials available.
The fabrics come from China and India via Dubai. The quality is not reliable, however, as the suppliers
do not buy the quality that the owner desires – “it seems that they are buying for themselves.” Another
problem is the high cost of borrowing, so the company does not have credit from a bank.
The owner feels that there are too many taxes. As a business develops, it must register for VAT, which
is required to work with large institutions such as Makerere University. VAT is 18%. There is also the
requirement to pay a 10% contribution to the national social security fund (NSSF) for each of the
workers’ salaries. There is income tax and a city council tax – “you really find it challenging to grow.”
The tax regulations are very strict. VAT is due on the 15th of every month and late payment incurs a
fine of 200,000 shillings – “it pinches, so you make sure you are on time.”
There are now many firms making graduation gowns, offering products are lower prices, but the owner
is quite confident that her quality is better than many of these competitors. The market is growing
because there are more new universities. When she started, there were only 3: Makerere, Nkumba and
Kyambogo. The company now also produces PhD gowns for Mbarara University – “I don’t know
whether they have PhDs at other universities yet.”
The owner sees that the manufacturing sector is still very small in Uganda. There are a lot of agricultural
products but these are exported and manufactured overseas, then imported as manufactured goods. It is
difficult for a manufacturing business to grow because of the problems in the business environment.
Management and entrepreneurship education is also new, with Ugandan students only recently learning
business administration and management, which are really useful for starting a business. Moreover,
manufacturing as a business is relatively new for Ugandans – “before the 1970s, only Indians were
doing it” but they were all expelled in the ‘70s by Idi Amin. After Idi Amin was sent out of the country,
the Ugandan business community took off. The new generation of entrepreneurs is still young – “I
remember I was in the second cohort of MBAs at Makerere – which meant really that was the start.”
The company is a member of the Uganda Manufacturers’ Association (UMA), USSIA and Uganda
Women Entrepreneurs’ Association (UWEA). She goes to regular meetings and gains good advice and
contacts. Other helpful networks, according to the owner, include the Private Sector Foundation Uganda
(PSFU). There is also the Uganda Investment Authority, which supports help foreign investors –
“foreigners enjoy better investment conditions than we do.” Foreigners also enjoy tax holidays – “there
is no fair competition.”
Case 3: Food processing – soya beverages and cakes (80 employees)
The company is located close to Kampala. The interview is held with the owner, who also acts as
managing director. The owner runs the business with his wife. In 1978, he was a young road
construction worker “digging trenches and breaking stones.” Seeing his fellow workers buying roasted
soya nuts and peanuts across the road, he identified an opportunity to produce and sell them himself, so
he started to sell roasted nuts as a side-line. After initial losses and a learning period, he began to make
“really serious profits.” People started to place orders and requests for packing the nuts in a particular
way.
In 1979, shortly after his first successes, Uganda descended into political chaos when Idi Amin was
removed from power – “everything was disorganised in Uganda and everyone went out of business.”
The owner went to Kenya and came back four years later – “I was back to zero, no job, no business.”

24
He picked up the idea of producing and selling food again, and set up a small venture baking and selling
cakes. His mother provided him with a simple traditional oven – “a drum with a compartment of fire
on the top, fire at the bottom and chambers for bread in the middle.” His business, informal at first,
grew slowly but surely. At one point, while doing different jobs in between, he realised that this food
processing had become his destiny in life – “so I had to concentrate on it.” In 1986, he officially
registered his business with the USSIA.
Internal capabilities and innovation
In his formal business, the owner experimented with new products – “by the time you come up with one
successful product, there are a lot of failures behind it.” One day he developed a special formulation
for a cake snack. He did it casually: just picking some ingredients, mixing them together and baking it.
The result turned out to be good – “I couldn’t believe it was me who did it.” He started to produce the
cake snacks on a larger scale and the “product picked up really well”. He started expanding and had 20
people working for him in 1995.
Then one day, the majority of his staff suddenly resigned. It turned out that they had started in business
themselves using the owner’s cake formula and selling it to the same customers. The owner was quite
frustrated and stopped his business. After a while, realising that his former workers were not able to
maintain quality, he started again. He successfully regained his customers and continued to grow.
Currently the business employs 80 people, including a sales and marketing team of 25 people. Having
learned his lesson to keep the formulas secret, he now concludes written non-disclosure agreements
with his staff.
Today, the company produces several key products that the owner
developed himself. One of them is the Soya Cup, a drinking product that
tastes like coffee – “the aroma is close but doesn’t have caffeine like
coffee.” The product is a beverage made from soya beans to be used with
plain water or milk – “the Soya Cup accounts for 50% of all our sales.”
People in Uganda are increasingly trying to avoid caffeine.
The company also produces brown butter, a spread for bread or a sauce
base that is a combination of soya beans, ground nuts and sesame.
Another important product is Soy Millet, a porridge from pre-cooked and
roasted maize, soya beans and millet. Other products include muffins and
cakes.
The main ingredient of all the products is soya. The owner became “a
soya guy” because he realised that soya is by far the most nutritious
product available in Uganda.
It has a much higher protein content than other cereals and vegetables, but has an unpleasant smell. To
address this taste issue, the owner started to develop products which eliminate the soya flavour and
came up with a solution to use local spices to neutralise the flavour.
Uganda is one of the top 4 major soya producers in Africa (with Zimbabwe, Nigeria and South Africa).
However, the supply of locally produced soya is not always reliable in terms of quality and volume.
Soya is seasonal and 50% of the beans are exported. The owner is not happy with the fact that raw beans
are exported from Uganda – “we are not only exporting beans cheaply but also exporting jobs.” He

25
sees the necessity for Uganda to add value to the country and export finished products – “the
industrialisation of this country is the way to go for us to get real value from our agricultural
production.”
The company targets the Ugandan domestic market, selling directly to supermarkets, retailers, some
schools, a few NGOs, and also individual customers via a small company shop. In terms of marketing,
the products are advertised on radio and TV. The company has several company cars for delivery –“in
the morning they go and distribute, then they come back in the afternoon or in the evening.” The
company does not have specialised distributors.
The company does not yet export, but the owner has plans to
develop this. He knows that there is a market “out there.”
Occasionally, individual customers buy his products and take
them overseas –“if you live in Chicago and you come to
Kampala looking for and buying my products, then […] I could
have a market in the US.” At the same time, the owner is aware
of the export challenges he is facing. He has to meet international
food quality standards.
He knows that the packaging should be improved, to be more attractive. Another challenge is meeting
production volumes if an international buyer places a large order.
The owner sees his business as a family enterprise. His son works with him, taking evening classes in
the university so that during the day he can work in the factory. His daughters also work in the company.
The owner has a clear succession plan.
The owner mentions that his focus on and persistence in business is a key success factor. Over the years,
he became knowledgeable about food processing. Although his formal education is limited to primary
school level, he has trained himself by attending short courses and linking up with people with
specialised expertise in food – “I knew I needed to team up with people and organisations who can
really help me to develop and redeem the time I lost in school.”
External business and institutional context
The owner is actively establishing linkages on an international scale, such as the World Initiative for
Soya for Human Health, the American Soya Association and Soya Southern Africa. He attends
international fairs and forums and takes the opportunity to make presentations. He was introduced to
academics from the University of Illinois who were doing research into soya beans – “that was is a
golden opportunity.” From that time, they started collaborating. Visiting the US, he met a professor in
food science who suggested new ideas for soya products – “he gave me ideas just walking down the
corridor.” He works with research institutes in Uganda but they provide little input. Researchers from
Makerere University have tried to make soya milk for a long time but never succeeded, whereas “mine
is on the market.”
The company and products are registered as trade names. The owner did not file patents for his products
because the process is quite expensive and complicated. Some competitors have tried to copy them –
“they have put a product on the market calling it soya cup and they don’t know that I have registered
it as a trademark.” The owner sometimes takes action to prevent this, but it is very expensive.

26
The financing of his business has been challenging since the
beginning. In the past, he had savings from his jobs.
He borrowed from money lenders – “these guys used to
charge 20% per month.” In an effort to get a bank loan,
because he did not have a credit rating, he sought help from
the Uganda Development Trust. Unfortunately, his financial
records were not understandable by outsiders – “I used to keep
records in a way I understood.”
Today, he is able to secure bank credit, although the lack of sufficient guarantees and collateral remains
a limitation. Moreover, the interest rate is too high, according to the owner – “in Uganda, the interest
rate is 26% per year while in Kenya it is 16%, so how can you compete in the region?” The owner sees
the high interest rate as the main reason why businesses in Uganda are stagnant – “we are not working
for ourselves but working for banks.” The owner’s latest idea is to approach private equity funders –“if
we have good ideas like these ones – there are people who have the money but do not know what to do
with it.” The owner tries to find partnerships to avoid having to use banks.
The owner feels the business environment is politically acceptable, although the government lacks the
means and capacity to provide direct support to his business. He feels the high taxes are unacceptable –
“the taxes are killers.” As many businesses are not paying taxes at all, he would recommend that the
government widen the tax base so that more people pay tax – “why narrow it up and make it so
complicated for a few?”
The USSIA offered him several business development services, including courses on how to bring
products to market, marketing and financial management –“the guys from the association did a very
good job.” He is looking at examples of “big businesses of big people.” He also partners with the
Uganda Manufacturers’ Association (UMA) and the Private Sector Foundation. His operation is small
but he has the ambition to expand it.
3.3 Research and policy issues
Innovation definition
The qualitative research shows that the owners and managers in all the interviewed companies, in
different ways, introduce new products, new processes, new technology, or machinery in order to
improve and expand their business operations. In advanced economies’ innovation terms, in which
R&D expenditures and number of patents are typically measured (OECD, 2005), these cases would not
be assessed as innovation. Such an assessment would in any case have been impossible because the
owners do not systematically record R&D expenditures and have not registered patents.
However, taking a broader perspective on innovation, viewing it as a more incremental adoption and
adaptation or new combinations of existing technologies (Szirmai et al., 2011), it is evident that the new
elements introduced in the interviewed companies resulted in better and more efficient business
operations, creating value. As described in emerging innovation theories on LICs, much innovation
depends on an aggregation of small insights and advances through ‘learning by doing’ rather than on
major technological inventions (Carayannis et al., 2003). Despite increasing interest in the literature,
the exact definition of innovation in LICs remains a problem (Çapoğlu, 2009). How should researchers
distinguish innovation in LICs from other activities? The broadest possible definition of innovation
would be everything new that the company does to survive and be ahead of its competitors. Innovation
could be considered as a ‘means’ towards the ultimate objective of raising productivity and increasing
competitiveness. A cross analysis of definitions in innovation theory from recent decades shows that

27
innovation is repeatedly typified by three key elements: newness, process and value creation (Voeten et
al., 2011).
Addressing the first element, Kotabe and Swan (1995) argue that innovation can be investigated in terms
of both newness to the company and newness to the market or world. Although the new products and
new processes in the interviewed Ugandan companies were not radical and ‘new to the world’, they
were new for the companies, as units of analysis. Interestingly, most company owners and managers
did not perceive their incremental adoption, adaptation and new combinations of existing technologies
to be innovation. They associated innovation with a radical technological invention or breakthrough. In
many innovation definition and measurement documents, such as the OECD Oslo Manual (OECD,
2005), an explicit distinction between product, process and other forms of innovation is made.
Kaplinsky and Morris (2001) identified five types of innovation: (i) process innovation aiming at
improving the efficiency of transforming inputs into outputs; (ii) product innovation leading to better
quality, lower price and/or more differentiated products; (iii) business practice innovation implying new
ways to organize business and attract new clients; (iv) functional innovations – assuming responsibility
for new activities in the value chain, such as design, marketing and logistics; and (v) inter-chain
innovations moving to new and profitable chains. However, the Ugandan cases show a combination of
new technology, new processes, new products and new clients within the companies. One could not
unambiguously distinguish one type of innovation within the interviewed companies.
Regarding the second element, the innovation process, all owners and managers themselves initiated,
managed and owned the innovation process within the unit of analysis, their company. They developed
the idea, sometimes inspired by others, started to run small experiments and trials and eventually
implemented the new product or production technique on a commercial scale. As is often the case in
incremental innovation, this is not a planned and formalized process involving a pre-defined innovation
strategy and an R&D department. In fact, all the innovations observed in the cases are the product of
experiential learning and a process of doing, using and interacting (DUI), as earlier described by
Lundvall et al (2009).
The third element, value creation of innovation, is evidenced either through lower input costs or higher
sales revenues (Porter, 1985). Higher profit through new premium products of better quality, or
appealing to a certain fashion increases competitiveness. Several of the interviewed companies clearly
pursue a higher sales revenue strategy via high quality, while others invest in machinery that is faster
and brings lower input costs, which raises labor and capital productivity.
Analysing the three Ugandan cases for newness, process and value creation is one possible way to assess
whether the observed new phenomena within the companies qualify for innovation or not:
1. The veneer stone company case did innovate in terms of new products of process technology.
However, more importantly was that the company introduced a management, business
administration and marketing techniques and principles to organize his business. The neighbouring
stone veneer businesses are household and informally organized. This makes the business more
advanced in terms of competitiveness. This could be qualified as a management innovation, which
would classify in Kaplinsky as business practice innovation.
2. The textile company introduced some new technology for the company and new products (gowns)
for the new market. Another notable innovation was, after a MBA study, the introduction of new
management systems and way of organizing the business which enabled her to raise productivity
of the company a lot.

28
3. The food processing company has introduced several new products on the Ugandan markets. These
products were developed by the owner, who gain a lot of experience over the years. He discover a
way to reduce the smell of soya in his products which is an example of process innovation. For the
production, the company has quite advanced machinery.
Internal capabilities
In all cases, it is the owner who initiates, coordinates and manages the new ideas, including preparations
for the innovation, technical details, and the product launch. Several companies have a design or R&D
department or a specialist employee with this function.
The Ugandan workforce mostly comprises unskilled labourers. Most owners pay their employees based
on output, not a fixed salary within fixed contracts. Several owners face difficulties of the unskilled
workforce and the high turn-over rate of the unskilled production workers. The recruitment of workers
is therefore an ongoing concern for the owners and managers. Sometimes the employees provide
innovative ideas, to a greater or lesser extent. Several owners, however, stress the limited creativity of
their workers and refer to a passive attitude. Most owners and managers do train the employees on-the-
job, but this does not involve the development of creativity. Getting higher educated staff is a problem
since the graduate employees have primarily theoretical knowledge and few practical skills.
The owners mention that the skills and knowledge gained through formal education do not match the
company’s requirements. Moreover, it is difficult to find skilled craftsmen to do the manual
manufacturing work in Uganda today. Despite these shortcomings, few interviewed company provides
additional formal training for the workers, opting instead for on-the-job training. Some owners are
reluctant to provide formal training because they are afraid that workers will move to other jobs. Some
owners acknowledge the potential innovation capacity within the workforce, but this is not applied in
practice.
Typically, the Ugandan companies possess technology and machinery that they have had for a long
time. The technology is still able to deliver a certain minimum quality of the products. Occasionally,
new machinery is bought from profits and savings. The interviewed owners and managers are well-
informed about technological possibilities though the internet or informal contacts. They actually have
ideas and plans for upgrading and expanding their companies. However, new (technological frontier)
machines are relatively too expensive and advanced compared to the expected returns on investment on
the short run. With regard to the long run, the macro-economic and institutional context does not provide
sufficient confidence to do such extensive investments. They are only confident about the stability of
the short-term.
External business environment and formal and informal institutions
All SME owners have more or less the same negative perception of government policies, legal
regulations and systems. There is no clear regulatory or policy framework for manufacturing SMEs.
Many ministries and governmental agencies have different regulations that are not predictable. All the
entrepreneurs complain about the high costs of production, such as electricity costs.
Several of them hold a negative perception about the ever-changing government policies and
regulations. There is no clarity about the changes and SME owners have to sort out themselves, which
turns out to be very time-consuming. Many ministries and governmental agencies have different and
unpredictable regulations. They also indicate that the business and institutional environment prevents
them from innovating and growing their business. All mention the issue of competition with imports.
The costs of production in Tanzania are high.

29
Most business were member of the Uganda Small-Scale Industry Association (USSIA) and had regular
interactions, which help in solving technical issues or networking for clientele. No interviewed company
received support from the government, and the owners and managers concerned regret that. They feel
that they have to survive on their own. While most of them think that is reasonable, some support in
terms of credit or technical support would have been welcome.
The banking system is not an attractive source of finance for SMEs. The high interest rates and complex
paperwork is an critical issue. Instead, most SME entrepreneurs find investment money from savings
and via informal loans from family members. They usually invest incrementally just before or after
receiving large orders.
Branch associations are an important source of information and business contacts and contracts for the
owners and managers of the cases. Most of them are member of an association. Interaction with formal
technology institutions, as suggested in innovation systems literature (Lundvall, 1997), does not happen.
Many SMEs owners and managers indicate that they would like to cooperate with universities to
undertake research at their premises, for sharing the research insights for instance. There is very little
spill-over of technology as a result of cooperation between firms, subcontracting or other forms of
collaboration within value chains, business clusters or networks.
Policy issues – insights for policy makers to consider
One question that remains is the extent to what government will be able to do to reach SMEs. Various
ministries within the Ugandan government have defined and implemented innovation policy. However,
it seems not to reach the SME owners interviewed. Some SME owners and managers are aware of R&D
centres and the programmes to aiming at technology development for SMEs. Maybe because one reason
is that the technology is done in a technocratic top-down way. The companies are seldom consulted, in
fact they prefer to stay at a distance from the formal institutions.
They are aware of the state of the art technology but they cannot afford the machines because of the
high costs. Moreover the one that have the money available do not invest because of the uncertain future,
both in macroeconomics terms. Also the government does not provide assurance on the stability of the
‘rules of the game’. Most SMEs do what they do and do not further expand because of challenging
business conditions.
As argued in the introduction of this report, it is desirable to develop innovation within manufacturing
SMEs. Some believe that technological innovation is critical for SME development and catch-up in
LICs. Technological innovation has, however, been traditionally concentrated in developed countries,
given the costs and risks involved in stimulating technological innovation. Foreign sources of
technology account for a large part of productivity growth in most countries. Therefore, the
development process in Uganda could be supported by tapping existing technical and product
knowledge.
Moreover, the stories and experiences of the owners and managers raise the issue of whether an
innovation-driven and new-to-the-world innovation approach would be the way forward. Most of the
required technology is already available, but elsewhere in the world. In fact, all owners in the cases are
well informed about the technological possibilities of their business. Without too much difficulty, the
owners and managers find the technology themselves by drawing on various sources of information
(the internet, informal business contacts and trade fairs). Moreover, the companies themselves refine
and adapt the existing technology once acquired. So, although setting up technology development
projects and programmes may help SMEs, the availability of technology is not perceived as a barrier to
innovation by the owners and managers.

30
It seems that the notion of growth as ‘manna from heaven’ as reflected in convergence theory, see the
earlier rejected exogenous growth model of Solow and Swan (Fagerberg et al. 2010), might work after
all because of the free and widespread access to knowledge and technologies via the internet. The
knowledge itself is available for local companies in Uganda. The institutional context, providing trust,
predictability, stability and access to finance is more of a problem in preventing investment in
technology and innovation and thus ‘convergence’ from happening. At the same time, maybe the
‘manna from heaven’, thus technology developed elsewhere, does not address the local needs or issues.
Innovation climate
How then can the innovative capacity of SMEs in developing countries be increased? According to the
World Bank, an efficient innovation policy by governments will address the overall innovation climate,
which goes beyond traditional science and technology policy. At the same time, government action can
usefully focus on a few generic functions to help SMEs to grow. It can facilitate the articulation and
implementation of innovative initiatives, since innovators need basic technical, financial and other
support.
The government can reduce obstacles to innovation in competition and in regulatory and legal
frameworks. Government-sponsored research and development structures can respond to the needs and
demands of surrounding communities. Finally, the education system can help form a receptive and
creative population. Regarding actual innovation policy development, there has been a considerable
amount of work in developing countries, such as the World Bank (2010) report ‘Innovation Policy: A
Guide for Developing Countries’.
The lack of relevant education is a problem for the companies interviewed, who feel there are
insufficient skilled workers and operators to work with modern machines. SME owners and managers
complain that university and college graduates do not have the required technical and craftsman’s skills,
exposure to modern technologies, or an entrepreneurial and creative attitude.
As mentioned earlier, several ministries and agencies are engaged in efforts to develop and promote
innovation policy, usually labelled as Science, Technology and Innovation (STI) policy. Despite
considerable effort in developing strategies and plans, actual implementation is challenging, due to the
limited availability of public budgets and knowledgeable staff.
Nearly all SME owners and managers suggest that creating a stable and predictable institutional context
would be an efficient and effective way to promote innovation in Uganda. All kinds of innovation
policies and programmes could be developed, but the results of such policies will be undermined by the
weak and unreliable wider formal institutional context.
Another policy idea emerging from the DFID project is that several owners and managers suggest not
to focus on governmental policy makers only, but on direct advice to SMEs on how to improve their
business. One idea is to develop non-governmental business information exchange networks and
platforms, establishing contact between entrepreneurs in Africa and beyond, to facilitate discussion and
deals within the various sectors. SME owners suggest that the DFID project could establish a network
of all SME owners and managers contacted during the implementation of EIP-LIC and create a website
for them to stay in touch with each other.

31

32
4 Innovation systems
The ‘Innovation System’ team produced seven scientific papers with special reference to Uganda. The
first paper analyses the relationship between firms’ human capital endowments and firm-level practices
to improve innovative output. The second paper reviewed regional institutional quality involving data
from Kenya, Tanzania and Uganda. The third paper addresses research and development within firms
decrease technical efficiency. The fourth paper investigated the bi-directional relationship between
innovation and exporting in four countries in Sub-Saharan Africa. The fifth paper assesses whether
innovation directly influences exporting behavior, because firms apply innovation as a strategy for
gaining an international market share. The sixth paper analyzes the relationship between gender
diversity in the ownership, management and workforce structure at the firm level and women’s
economic opportunity at the country level to improve innovation outputs.
The research within the ‘Innovation Systems’ theme was based on several existing as well as original
datasets collected in Kenya within the project framework. In cooperation with the World Bank, as
survey among 549 firms in Kenya was carried out. In additional three waves of data were used
comprising data from the 2013 World Bank Enterprise Survey, the 2013 Innovation Follow-up Survey
module, and the 2015 Innovation Capabilities Survey.
The research findings of each paper are discussed and policy implications are reviewed in the
paragraphs below. The associated policy briefs and many others are listed in the project website.
4.1 Human capital and innovation
The first scientific paper focuses on the role of internal human capital, or the skills, abilities and knowledge
of the employees, as an important source for innovation within firms. The existing studies offer little insight
into the relationship between human capital and innovation at the firm level, particularly in Low Income
Countries (LICs). This is especially important because most innovation within manufacturing SMEs in LICs
occurs incrementally via learning by doing, for which human capital at the firm level is critical. In the paper
entitled ‘Human capital and innovation in developing countries: a firm level study’ Van Uden and co-
authors analysed the relationship between firms’ human capital endowments and firm-level practices to
improve innovative output. The data collected (survey) concerned a sample of SMEs in Kenya, Tanzania
and Uganda (2,076 SMEs in total).
Research findings
Regarding the question whether employee schooling is a critical factor, the research shows that a higher
level of schooling enhances employees’ ability to understand, create and process information more quickly
within the firm than individuals without education. This is conducive to innovation, since it is a knowledge-
based activity. The research showed a marginally significant effect of employee schooling level within firms
on the likelihood of being innovative. Employee schooling is a relatively unimportant factor for innovation
within SMEs in Kenya, Tanzania and Uganda.
Formal company training refers to the extra training that employees receive from the firm and provides
employees with specific knowledge, because many skills are not learned during general basic education.
The research demonstrates a strong relationship between formal company training and the probability of
producing innovative output compared to firms that do not provide formal training. Having a company
training programme more than doubles the likelihood of a firm being innovative, from 23% to 47%.
33
Slack time gives employees the resources to work on their own ideas and encourages creativity to transform
the available and general technological knowledge stock. The research found that a firm that gives slack
time to its employees has a higher probability of producing innovative output compared to firms that do not
give slack time to their employees. The size of this effect is even more pronounced than that of formal
training: offering employees slack time results in an increase in the likelihood of being innovative from
23% to 54%.
Interaction effects: The research found that employee slack time in combination with the amount of
employee schooling within a firm does not strengthen the other factor’s effect on the probability of
producing innovative output in the manufacturing industry. However, any level of employee schooling or
offering employee slack time will increase a firm’s likelihood of being innovative. For firms that already
offer employee slack, a strategy of hiring more educated employees might have negative consequences for
innovativeness. It was assumed that offering both formal training and employee slack time would be
counterproductive, as formal training might reduce individual creativity, on which employee slack relies.
Policy implications
Van Uden and co-authors show that the internal human capacity of the SMEs surveyed in Kenya, Tanzania
and Uganda has a significant impact on the innovative output. In fact, the study shows that the internal
practices for stimulating knowledge development and creativity for innovative ideas, such as formal
company training and providing slack time, have a more profound relationship with innovation than
traditional factors such as formal education and formal R&D.
The importance of the internal practices revealed in the study appears to be somewhat at odds with current
innovation policy thinking, which is based on an innovation systems approach focusing on technology
development through setting up networks of formal R&D and educational institutions around the firm. In
fact, the small incremental product and process innovations and adaptation of existing technology observed
in the SMEs were not the result of innovation system institutions; rather from internal learning by doing,
using and interacting. This study suggests that SMEs equally (or perhaps more) benefit from policies that
strengthen their internal human capacity, rather than from policies promoting surrounding R&D institutions.
This implicitly leaves the initiative and ‘ownership’ of the innovation process (technology development)
much more within the SME.
Formal company training can be either general training that upgrades the capabilities of the whole workforce
or specific training that improves specific knowledge or skills. Promoting the creativeness and innovative
output of employees can be a learning objective of both forms of company training.
Government agencies could develop special policies and programmes that encourage and support SMEs in
providing formal company training. This could take the form of awareness raising programmes explaining
the particular benefit of company training for innovative output by employees. Government or development
agency policies and programmes could assist in the development of formats and curriculum for such in-
company training programmes. Governments could introduce certain tax advantages, subsidies or other
incentives for supporting company training. Such tax advantages could be linked to innovative output.
With regard to SMEs’ managers and branch organisations, their internal/company policies could focus on
conducting formal training linked to the creativeness and innovative output of employees. This training
could reflect and encourage a proactive and creative attitude and the freedom to develop ideas on the shop
floor.
Instead of passive employees working in a formal top-down management structure, a changed mentality
enables employees to take ownership and initiative. Management could encourage creative thinking by their
employees to stimulate innovation. Within business, managers can initiate a change of attitude and
organisational culture from top-down towards allowing some freedom and ownership in the innovation

34
process and technology development; allowing failures and rewarding innovative output; drawing on
employee creativity and establishing internal procedures to encourage innovation.
More indirectly, innovation policy could address state provision of primary and secondary education.
Instead of a focus on technical training and science and mathematics, there could be an additional priority
to develop pupils and students to be creative, work in teams, and to take the initiative proactively once slack
time is allowed.
4.2 Institutions and innovation
The second scientific paper within the “Innovation Systems’ theme explores whether the value of firm
resources can be more meaningfully understood in the context of the broader institutional environment. For
this reason, institutional quality within a firm’s region of operation is likely to influence the innovation
activities of the firm. Whilst country-level institutional quality is of key importance, variations in
institutional quality are likely to be observed across regions in a country due to differences in formal and
informal institutions that are territory specific. Moreover, regional variation in institutional quality has been
attributed to differences in the implementation and enforcement of formal legislative or regulatory
frameworks. Additionally, the various manifestations of cultural, political and economic systems in regions
within developing countries contribute to these differences.
In the second paper research, a team of researchers from the University of Nairobi and Radboud University
Nijmegen analysed the interplay between a phenomenon known as Regional Institutional Quality (RIQ),
firms’ resources and innovative activity. The original working paper is entitled ‘Institutions, Resources and
Innovation in Developing Countries: A Firm Level Approach’ (2014) by Laura Barasa, Peter Kimuyu,
Patrick Vermeulen, Joris Knoben and Bethuel Kinyanjui. This policy brief provides the research approach,
main outcomes and policy implications of the paper.
Research approach and findings
RIQ in the research framework particularly relates to the degree of regulatory quality, the rule of law and
levels of corruption. The key argument is that well-functioning institutions are crucial for innovation.
Therefore, firms are likely to be more successful in extracting value from their resources for innovation in
regions with a high degree of institutional quality. The micro-level relationship among firm-level resources,
RIQ and innovation in LICs has received little attention in the past. One major reason for this has been the
absence of firm-level data relating to innovation in LICs. Furthermore, a majority of studies on the subject
of innovation have been conducted in the context of developed countries, focusing on the determinants of
innovation (findings of such studies have limited policy implications for LICs). As such, the research
examines how firm-level resources interact with institutional quality to explain innovation. The extent to
which institutions influence the degree to which firms are able to extract value from their resources for
innovation remains unexplored, particularly in the context of developing countries.
The research hypothesises that a high degree of RIQ enhances the effect of firm-level resources on
innovation. Previous studies find that firm-level resources that have been found to drive innovation include
internal R&D, training, human capital, information search and communication facilities. This DFID
research focuses on three firm-level resources including internal R&D, the education level of employees
and quality certification. In particular, the research examines the moderating role institutions play with
regards to the innovation process involving the generation of innovative output from firm-level resources.
Thus, a high degree of institutional quality is imperative for innovation because it mitigates uncertainty
surrounding innovation activities.

35
The research is conducted in the context of LICs, which are characterised by a scarcity of resources such as
inadequate human capital, low rates of R&D, a low degree of institutional quality demonstrated by
widespread corruption, a low degree of regulatory quality and a weak rule of law. In fact, previous studies
argue that differences in institutional quality explain the varied growth rates in developing countries.
Various empirical studies place emphasis on the critical role institutions play in fostering entrepreneurial
activity and innovation in developing countries. The data used for analysis concerned firm-level data from
the World Bank Enterprise Survey and the Innovation Follow-up Survey, for the years 2010 to 2012, for
Kenya, Tanzania and Uganda.
In relation to the hypothesised interaction between firm-level resources and RIQ, the research team found
the following as a result of the analysis:
An interaction effect between internal R&D and RIQ. Firms situated in an environment with a low
degree of institutional quality have a lower likelihood of conducting and benefitting from R&D. In
particular, a corrupt environment imposes a variety of transaction costs on firms and limits the incentive
for investing in R&D and innovation. Furthermore, a lack of legislative transparency creates
uncertainty, discouraging firms from investing in R&D. Nevertheless, a strong rule of law that reins in
corruption and abuse of tax credits by firms is likely to enhance internal R&D.
An interaction effect relating to employee education levels and RIQ. A firm with well-educated
employees is likely to be more innovative in an environment with a high degree of RIQ. The employee
education level reinforces innovation activities in a firm whose environment features a high degree of
RIQ. Such an environment enables employees to use their knowledge and skills more productively and
fosters innovation in a firm.
An interaction effect of RIQ moderating the effect of quality certification. Obtaining quality
certification is conditional on strict adherence to established standards and procedures. Yet, if auditors
granting certification are corrupt and allow firms to implement quality standards only superficially,
quality certification is unlikely to influence innovation. Notwithstanding, the effect of quality
certification on innovation is reinforced by a high degree of RIQ because low levels of corruption, a
high degree of regulatory quality and a strong rule of law have been associated with innovation.
Policy implications
With regard to promoting innovation among manufacturing SMEs, it is vital that that more light is shed on
the variation in institutional quality in regions within developing countries. It is particularly critical to
address the extent to which RIQ influences innovation in developing countries, given that institutions are
essential to shaping entrepreneurial activity encompassing innovation. The main outcome of this original
research into RIQ in LICs is that the effect of firm-level resources on innovation is positively moderated by
institutions. Thus RIQ plays a distinct role with respect to the extent to which firms successfully extract
value from resources into innovative output in the context of developing countries. The value of firm-level
resources significantly depends on the institutional environment within which the firm operates.
Taking into account the observed variation in RIQ in Kenya, Tanzania and Uganda, it is crucial for policy
makers to focus on strengthening institutions by fighting corruption, enforcing the rule of law and fostering
regulatory quality. This is not only important at the national level, but is also beneficial at the regional level.
Thus, focusing on promoting good governance at the regional level may reduce the variation observed in
innovation in the individual countries. A similar outcome is observed in the complementary qualitative
research part of the DFID project (case studies and in-depth interviews). SME owners referred to the fact
that the formal government institutions, represented by the government officials, make their business
environment even more challenging. Business and tax regulations are unclear. While entrepreneurs in any
country will usually complain about government taxes, the situation is even more stressful and unpredictable

36
in cases of bribery and corruption. While entrepreneurs need a formal institutional context that assures
stability and predictability, the reality in many East African countries seems to be the reverse, bringing extra
uncertainty and risk.
Several SME owners and managers suggested that only creating a stable and predictable institutional context
would already be an efficient and effective way to promote innovation. All kinds of innovation policies and
programmes could be developed, but the results of such policies will be undermined by the weak and
unreliable wider formal institutional context.
Overall, stronger institutions provide a sound business environment that stimulates entrepreneurial activity
and innovation at the firm level. Well-functioning institutions serve to increase the value of firm-level
resources with regards to innovation because firms are better placed for appropriating value from their
resources into innovative output. This strengthens the argument of the importance of implementation and
enforcement. If all countries were able to increase their overall RIQ to that of the highest region in their
own country, the probable benefits in terms of increased innovation would be tremendous. Policy makers
could make ‘best practices’ out of the regional implementation and enforcement of their national
institutional policies and facilitate the spread of these best practices across the rest of their country.
4.3 R&D and technical efficiency
In the third scientific paper within the “Innovation Systems’ theme investigates the interactions of Research
and Development (R&D), foreign technology and technical efficiency in firms in Uganda, Kenya and
Tanzania. The original working paper is entitled ‘R&D, Foreign Technology and Technical Efficiency in
Developing Countries’ (2015) by Laura Barasa, Peter Kimuyu, Bethuel Kinyanjui, Patrick Vermeulen and
Joris Knoben.
Research findings
The team examined whether innovation activities including internal research and development (R&D) and
adoption of foreign technology have differential effects on technical efficiency (how efficiently a firm
converts inputs of capital and labour into outputs). A first finding of the study was that R&D actually
significantly decreased technical efficiency. This is surprising because it has been previously suggested that
inefficiency in manufacturing firms in Africa arises from a lack of organized R&D and low levels of
investment in internal R&D. Possible explanations could be that investment in R&D only has a lagged
impact on efficiency, or that R&D spending by an individual firm may increase the efficiency of the firm
relative to others (by virtue of the way efficiency in the sector is measured.
The adoption of foreign technology has a positive, but not statistically significant effect on technical
efficiency. This may indicate that foreign technology imported from advanced economies require additional
skills to match the African context of firms. The combination of internal R&D and the adoption of foreign
technology is found to significantly decrease technical efficiency. Additionally, low rates of human capital
found in Africa, necessary to make the adoption of advanced foreign technology worthwhile, may indicate
a lack of capacity for sophisticated R&D activities.
Policy implications
The results of the study indicate that internal R&D has a negative effect on technical efficiency. Firms may
engage in R&D activities that are not conducive to increasing efficiency. Apparently, the R&D is not
focusing on process innovation with a view to increasing productivity and efficiency, but likely on other
forms of innovation such as product innovation. In factor-driven economies like Kenya, Uganda and
Tanzania such product innovations, following the introduction of technologies that develop products from
locally available raw materials, is a common phenomenon indeed.

37
This is confirmed in the EIP-LIC qualitative studies in Kenya and Tanzania; innovating entrepreneurs seek
to compete with imports of manufactured goods, which could be produced locally. The entrepreneurs
indicate that they only require the technology enabling them to actually manufacture the product. This R&D
motive was much more the case than increasing the efficiency of the production process to increase
efficiency.
Innovation support policies and programmes in those countries could take this more nuanced view on the
types of innovation into account in the development of their programmes. Alternatively, government
support may be imperative for fostering engagement in R&D activities that improve efficiency, if companies
entered a more efficiency-driven way of operation. Another position is that the operational environment
may be the underlying factor behind the apparent mismatch between internal R&D and efficiency
The ‘usual suspects’ in the environment include limited access to credit and inputs, low levels of human
capital, poor infrastructure and poor governance. Entrepreneurs may hope to increase efficiency through
their R&D efforts, but eventually it does not materialize. This constitutes an argument for strengthening
basic conditions for economic development and institutional reforms aimed at strengthening
government. Likewise the internal absorptive capacity of enterprise may hamper the optimal use of the
R&D.
Investing in internal R&D in combination with adoption of foreign technology is not conducive to
mitigating inefficiency in manufacturing firms in developing countries. Notwithstanding, where internal
R&D is absorptive in nature foreign technology may be modified to meet the needs of manufacturing
firms that will in turn increase efficiency in developing countries.
4.4 External knowledge sources
The fourth scientific paper within the ‘Innovation Systems’ theme addresses the importance of external
knowledge sources to firm-level innovation has been for long underlined by economic and management
researchers as well as business practitioners. Despite open innovation’s increasing prominence in both
practice and research, the role of the context in which open innovation in developing countries is conducted
is not well investigated. A team of researchers of Radboud University Nijmegen carried out a study on
external knowledge sources and highlighted context when considering the relationship between openness
and innovative performance. The original working paper of the study is entitled ‘External Knowledge
Sources and the Cost and Benefits of Innovation in Developing Countries’ (2015) by Annelies van Uden,
Joris Knoben and Patrick Vermeulen. This policy brief summarizes the research methods and outcomes of
the study and discusses several policy implications.
Research findings
Based on an analysis of 683 firms in five developing countries, the team found that that regional knowledge
availability influences the success of openness. The study indicates that this relationship is contingent on
the context in which the firm is active. In regions with a high knowledge availability the relationship
between openness and innovation is similar to the one found in Western countries, which adds to the external
validity of this relationship.
The study shows that firms located in regions where regional knowledge availability is lower, are more
innovative when they are not using search breadth and only really low levels of search depth, indicating that
in some environments it is better for a firm to be closed for innovation. These results contrast most previous
research about open innovation, which highlighted the benefits and the positive relationship with innovative

38
performance. It shows that in regions with high knowledge availability, the inverted U-shape found in
Western countries is also valid there. However, we also find that in regions with moderate or low knowledge
availability the inverted U-shape turns into a U-shaped relationship.
Indicating that in regions with less knowledge available, an open innovation strategy does not have a
positive effect on innovation and it can be better to focus on fewer, deeper relationships rather than a very
broad engagement with many other actors. The study is important for the open innovation literature by
showing that regional knowledge availability strongly influences the relationship between openness and
innovation.
Policy implications
External sources provide the firm with new ideas
and help achieve innovation. However, innovation
policies in LICs can benefit from the study’s
findings; if external knowledge sources are
lacking, openness has a less favourable effect. The
study provides evidence that knowledge
availability is indeed a regional characteristic that
is of significant importance for the value of
openness.
Consequently the regional availability of knowledge should be considered in (open) innovation policies.
Interestingly, the research results indicate that openness can even be a harmful strategy, which has to be
acknowledged by policy makers as well.
The moderation effect of regional knowledge availability results in a negative relationship between external
search breadth and innovation. In regions where knowledge availability is lower, being open has more costs
than benefits. These findings supports the recent literature that stresses the downsides of openness. This
implies that openness should not be used in environments where external knowledge availability is lower.
Especially in the context of developing countries, the innovation policies and strategies promoting openness
could be much less effective than in developed countries.
This study adds to the generalizability of the relationship between openness and innovation outcomes. The
findings indicate that also in non-Western countries this relationship only holds in regions where knowledge
availability is high, which is comparable to the Western context. In policy making, the context should be
considered explicitly when establishing a relationship between openness and innovation. For governments,
the concept of openness is not one to one replicable in a different context and collaboration with other
partners could result in lower innovative performance. Promoting the knowledge availability is another
policy avenue in pursuing open innovation. Typically, education, information infrastructure and generic
economic development policies are prerequisites in a regional context.
Validating the policy implications on the ground, the qualitative studies of EIP-LIC, in particular Kenya
and Ghana, confirm that owners and managers in certain areas who were less open enjoyed more benefits
in the process of trying and introducing new technology and products. Several company owners learned it

39
the hard way – “they [competitors] came to tap my ideas. In one event the students from a university in
Accra took my idea and design for a machine.”
4.5 Innovation and export
The fifth scientific paper within the ‘Innovation Systems’ theme assesses whether innovation directly
influences exporting behavior, because firms apply innovation as a strategy for gaining an international
market share. A firm’s ability to successfully compete on the international market is influenced by its
capacity of introducing and marketing both new and improved products.
Actually, the link between innovation and exporting has received considerable attention. One strand of
research investigates complementarity between exporting and innovation while the other examines the
direction of causality. Nevertheless, few studies take into account the possibility of both causalities
occurring simultaneously. Furthermore, a majority of these studies have been conducted in developed
countries. For instance, previous studies find evidence of learning by exporting in Sub-Saharan Africa
(SSA) implying that participation on international markets facilitates knowledge flows from customers
and competitors. Yet, it remains unclear how this mechanism affects the exporting-innovation relation.
In the Fifth paper, a team of researchers from University of Nairobi and Radboud University
investigated bi-directional relationship between innovation and exporting in four countries in Sub-
Saharan Africa. Specifically, the research addressed the question whether there is a positive relationship
between innovation and subsequent exporting and that this relationship is mediated by market creation
and with customer feedback mediating this relation. The original working paper is entitled ‘Export and
Innovation in Sub-Saharan Africa’ (2017) by By Laura Barasa, Bethuel Kinyanjui, Joris Knoben, Peter
Kimuyu and Patrick Vermeulen . The study sample consists of firms located in SSA including Ghana,
Kenya, Tanzania, and Uganda.
Research findings
The research finds that the relation between innovation and subsequent exporting is positive and
significant. However, we find a positive but non-significant relation between exporting and subsequent
innovation. These relations broadly nuance a relationship between innovation and exporting.
We also find evidence that market creation mediates the innovation-exporting relationship since the
innovation process entails the introduction of new products and services on the marketplace. The market
creation significantly mediates about 32.5% of the effect of innovation on subsequent exporting. In
agreement with this, our results suggest that the technology-push mechanism accounts for the
relationship between innovation and subsequent exporting in the context of SSA.
Similarly but to a much larger extent, customer feedback is found to significantly mediate about
67.4%of the effect of exporting on subsequent innovation. Furthermore, we find evidence that customer
feedback mediates the relation between exporting and innovation to a large extent (67.4%) suggesting
that the demand-pull mechanism is very critical in explaining this relationship. Taking into cognizance
that the demand-pull mechanism has received scant attention over the past years this finding gives rise
to an important theoretical implication arising from the empirical evidence of the demand-pull
mechanism in SSA. We argue that the recognition of market needs arising from customers on the export
market constitutes a major driving force of innovation in SSA.
Apart from contributing to the debate on the innovation-exporting relationship in the context of SSA,
our paper goes a step further to shift focus on disentangling the mechanisms underlying this
interrelationship. This is an area of study that has received scant attention particularly in the African
context.

40
Policy implications
The findings reveal that whilst the main effect for the innovation-exporting relationship is significant,
the reverse relation remains unclear. Notwithstanding, the positive albeit non- significant relation
between exporting and innovation provides some nuanced support for the existence of a bi-directional
relationship. Furthermore, the technology-push mechanism underlies the innovation-exporting relation
to a medium extent. Hence, innovation policies aimed at fostering product innovation by providing
incentives may be crucial for exporting. Such policies may be useful in fostering the development of
innovations with a high degree of novelty and are likely to promote exporting through the creation of
new market space.
Moreover, the study provides evidence that the demand-pull mechanism underlies the exporting-
innovation relationship. Customer feedback mediates the exporting-innovation relation to a very large
extent. Therefore, state capital expenditure focusing on information and communications technology
infrastructure investment is vital in enabling faster response to market needs. Additionally, export
promotion policies encompassing instruments such as export subsidies are likely to play a key role in
stimulating innovation in SSA.
4.6 Gender diversity and innovation
In the sixth paper within the ‘Innovation Systems’ them analyses the relationship between gender diversity
in the ownership, management and workforce structure at the firm level and women’s economic opportunity
at the country level to improve innovation outputs. In present theory, there is an implicit assumption that
higher levels of women’s economic opportunity at a country level enable firms to better render the benefits
gender diversity can bring for innovation. The original working paper is entitled ‘Gender Diversity and
Innovation: The Role of Women’s Economic Opportunity in Developing Countries’ by Daniela Ritter-
Hayashi, Patrick Vermeulen and Joris Knoben.
Research Findings
The research shows that gender diversity at all levels in the organization has a positive effect on innovation
in the firms surveyed in low and lower-middle income countries in South Asia, Africa and the Middle East -
despite their below-average performance on a world-wide scale of measuring women’s economic
opportunity. Furthermore, the research illustrates that a country’s level of women’s economic opportunity
plays an important role in the relationship between gender diversity and innovation.
On the one hand, the results put forward that the positive effect of gender diversity on firms’ innovation
likelihood is amplified with increasingly equal opportunities for women. On the other hand, both gender
diversity in the ownership structure and in the overall workforce can have a negative effect on a firm’s
likelihood to innovate if the firm is operating in a country with very little economic opportunity for women.
It needs to be however pointed out that, extrapolated from this study, gender diversity only has a potential
negative effect on innovation in a handful of countries worldwide, ranging at the bottom of the women’s
economic opportunity ranking (lowest 5 countries for gender diversity in the workforce and lowest 15
countries for gender diversity in the ownership structure).
Policy Implications
Based on the research results, it is essential to acknowledge the value of gender diversity for innovation and
to create awareness among managers and employees that innovation emerges and blossoms from gender
41
diversity at the firm level. Government agencies could develop special policies and programs which
encourage and support firms in hiring a more gender-balanced workforce, having more female top managers
and supporting firms with a gender diverse ownership structure. This could take the form of awareness raising
programs explaining the particular benefit of gender diversity for a firm’s likelihood to innovate.
Furthermore, the introduction of tax advantages, subsidies or other incentives targeted at increased gender
diversity at all hierarchical levels within a firm could be a driver for increased gender balance. Once
awareness is raised at the top ranks of firms, it is pivotal that managers initiate a change of attitude and
organizational culture top-down, encouraging women to voice their opinion, urging men to value women’s
viewpoints and knowledge in the innovation process, and reassuring management on the importance of
promoting both men and women based on their performance rather than their gender.
It is crucial to encourage increased levels of women’s economic opportunity at a country level as a
prerequisite for gender diversity to benefit innovation. Potential avenues are increased access of women to
education to decrease the gap in knowledge between men and women. Governments could initiate country-
legislation enabling women to better balance family and work demands such as improved childcare as well
as maternity and paternity leave. An additional avenue for policy makers is to encourage a social perception
of women as being equally valuable members of society like men, with the same rights and obligations.
On a practical level, supporting networking activities through women entrepreneurship associations seems
an effective instrument to strengthen women’s determination to pursue ambitions. Moreover, establishing
programs in which women entrepreneurs lend support to girls on their way of obtaining education can be of
advantage. This can take the form of financial support and motivational reinforcement for the girls
themselves. Similarly, successful women entrepreneurs can serve as a role model to girls’ families, which
may be hesitant to invest in their daughters schooling based on traditional gender norms and expectations.
Moreover, to change the overall public perception of women entrepreneurs while aiming at a ripple down
effect to their immediate surrounding and support system, campaigns celebrating the success of women
starting a business can be a further avenue to strengthen their societal position.

42
5 Finance for Productivity Growth
The ‘Finance for Productivity Growth’ team produced three scientific papers with special reference to
Kenya. The first paper in the use of mobile phone technology and its impact trade credit for economic
development and growth. The second paper analysed the determinants of - and the barriers to - the
adoption of a profitable financial technology by SMEs in Kenya. The third paper investigated the role
of financial constraints in firms' skilled labour demand. The research findings of each paper are
discussed and policy implications reviewed in the paragraphs below. The associated policy briefs and
many others are listed in the project website.
5.1 Finance and demand for skill
Sub-Saharan Africa experienced a decade of growth between 2000 and 2012, in which average annual GDP
growth was over 4.5%. However, recent studies indicate that this growth has not translated into similarly
high growth rates in job creation. Current growth comes largely from a small base of industry and the
manufacturing sector, which will not come close to absorbing the millions of new workers entering the labour
force each year. What is even more challenging is that many educated and skilled workers in Africa fail to
find employment. The supply of highly skilled human capital who remain unemployed raises the question of
whether there is a shortage of firm-level demand for skill in African economies.
Academic studies stress the importance of access to external funding for firm-level investment decisions,
economic development and growth. What about the interactions between access to finance and employment
creation for educated workers? There is little research addressing the effect of financing constraints on hiring
decisions, especially of skilled workers.
For the second paper within the “Finance for Productivity Growth’ theme, a team of researchers from Cass
Business School (City University London) and Tilburg University investigated the role of financial
constraints in firms' skilled labour demand. Specifically, using a small business survey from Uganda, the
research explored whether skilled job creation rises with access to external finance. The original working
paper is entitled ‘Finance and Demand for Skill: Evidence from Uganda’ (2016) by Thorsten Beck, Mikael
Homanen and Burak Uras.
Research approach and findings
The research shows that that the extent to which micro and small businesses expand skilled employment, as
their sales and profits increase, depends significantly on access to external funding. Firms with positive
performance and a bank loan hire more trained and experienced employees. Thus, growing and profitable
small businesses create more jobs for trained and experienced workers - which is interpreted as demand for
skill - if they have access to external finance.
The analysis does not reveal a significant relationship in the case of hiring casual employees or family and
friends in the informal context, suggesting that financing constraints are more likely to bind in the context of
employment contracts associated with experienced and trained employees with high human capital intensity.
The results also suggest that financially constrained firms save their excess resources instead of investing in
a more sophisticated and skilled workforce.
Policy implications
The research findings underline the importance of well-developed financial systems for policies focusing on
job creation. Firms with greater financial flexibility are more likely to hire skilled labour once their
performance improves. For policy makers focusing on the challenge of creating formal and permanent jobs

43
in a developing society, devising a complementary financial sector policy is equally important. The policy
should go beyond helping firms directly to strengthening efficient financial systems and credit programmes
as well.
Better access to external funding can thus be an accelerator of human capital investment demand and growth.
Policy makers must also acknowledge that firms who are financially constrained save a greater proportion of
their additional profits (or pay other expenses associated with financial constraints) and therefore cannot
invest further in greater levels of employment; if access to finance is difficult, one could question the optimal
effectiveness of employment creation policies.
For government, interest rates by state banks. would be a first point of attention in policy efforts to create
formal employment of higher skilled labour. Against this background, policy monitoring systems for
employment creation could include the degree of access to finance. Looking at it from the other side, formal
credit policies and programmes could include formal job creation, since they are linked.
Better performance and financial access do not explain the hiring rates of informal employees, which include
casual and family employees. Labour creation policies should thus acknowledge the different policy
instruments for creating employment for higher educated and skilled workers on the one hand, and informal
employment on the other.
In many developing countries, young people are educated and governments need to find ways to employ
these highly qualified workers. With better access to finance, a firm’s workforce can become more permanent
and potentially more stable as well. As firms grow and become profitable, employment opportunities will
increase for those who are formally trained, educated and more experienced. The policy relevance of such
stable employment for higher educated staff centres on greater commitment of staff in firms. This will
particularly positively affect firms’ survival and innovation efforts, and is thus a vital issue for policy makers
in many nations, and especially in developing countries.
5.2 Mobile money and trade credit
Both in development research and policy, there is an increasing interest in the use of mobile phone technology
in Low Income Countries (LICs) and its impact on economic development and growth. Mobile money, as one
manifestation of such technology, stimulates welfare of households and small business in many African
countries and consequently increases the circulation of money in poorer communities. Increasing evidence
shows that it also promotes savings in households via formal bank accounts. Individuals use mobile money
for safety considerations, when travelling for instance. Moreover, mobile money technology provides
additional advantages such as enabling easy access to market information, market prices, and enhancing
market participation of farmers in remote communities.
One notable example of mobile money technology developed in Kenya is M-Pesa (M stands for mobile and
pesa means money in Swahili). It is an SMS-based money transfer and storage tool. After its launch in 2007,
M-Pesa rapidly became a popular way of making payments by households. Its involves less risk than informal
cash payment methods, storing money in mobile form implies more security than holding cash, and using M-
Pesa costs less than bank transfers. In 2011, 70 percent of adult population in Kenya had an M-Pesa account.
Actual growth numbers for the Kenyan economy suggest that the introduction of M-Pesa explains 14% of
per-capita real income growth and 3.4% of the total factor productivity growth between 2006 and 2013,
underscoring the quite large economic effect of mobile money technology. However, the use of M-Pesa by
Kenyan businesses has been less slower compared to its use in Kenyan households.
Business surveys show that only one out of three SMEs in Kenya adopts and uses the M-Pesa technology to
run its financial transactions. For the first scientific paper, a team of researchers from the Tilburg University,
44
Cass Business School (City University London), Financial Sector Deepening (FSD) Kenya and Wageningen
University carried out a study in 2013 analyzing the business use of M-Pesa in Kenya.
The underlying hypothesis of the study was that the availability of a mobile money technology such as M-
Pesa can significantly contribute to firm and ultimately macroeconomic performance. The original working
paper is entitled ‘Mobile Money, Trade Credit and Economic Development: Theory and Evidence (2014)’ by
Thorsten Beck, Haki Pamuk, Ravindra Ramrattan and Burak Uras. This policy brief provides the research
approach, main outcomes and policy implications of the paper.
Research approach and findings
The paper focuses on access to trade credit in particular since an increasing body of literature stresses the
significant role of trade credit in economic development in low income countries. Among other lenders in
financing credit-constrained firms, suppliers often provide a low-barrier channel to get access to credit, which
makes trade credit prevalent in financially less developed countries where the majority has limited if any
access to formal bank credit. Unlike credit from official financial institutions, trade credit does not rely on
formal collateral but on trust and reputation.
The research team wondered specifically whether the use of electronic money within their business helps
entrepreneurs to access such trade credit. The research concentrated on the relationship of SMEs with their
suppliers and measured the evolution of the M-Pesa technology as a payment method while making input
purchases. The study analysed the role of theft too and its interaction with M-Pesa technology to explain the
impact of M-Pesa on trade-credit connectedness in an economy and the resulting development consequences.
Data from the World Bank’s Enterprise Survey suggests that every year Kenyan manufacturing firms loose
about 2 percent of product values due to theft - which equals to twice the world average - from sales to remote
domestic markets.
The team used both a dynamic general equilibrium model of entrepreneurial finance as well as empirical data
from a novel SME survey from Kenya (FinAcess Business 2013). The details of the modelling and statistical
analyses of the data are presented in the working paper.
Key outcomes
The research team assessed a positive relation between the use of mobile money ‘M-Pesa’, as a payment
method when purchasing inputs from suppliers, and the access to trade credit among SMEs. In fact, both the
model and the empirical observation show this positive relationship. This empirical finding is consistent with
causality going into either direction. Having a trade credit relationship with suppliers exhibits thus a strong
positive relation with enterprises’ M-Pesa use as well. The researchers elaborate and explain in their working
paper that the use of M-Pesa is causing less problems and frictions in transactions with suppliers.
Consequently it is also lowering transaction costs and thus relevant for macroeconomic development in
Kenya.
In an effort to verify the relationship, shutting down the M-Pesa technology within the research context also
lowers the fraction of trade-credit relationships. The decline in trade credit relationships further suppresses
the macroeconomic development to a significant extent. This quantitative result underlines the strong
interaction between trade credit and M-Pesa.
The paper also shows that, in addition to enhancing information flows between economic agents, mobile
phone technologies may also help foster economic and financial relationships between enterprises in
developing countries. Moreover, theft raises the likelihood of default and constrains entrepreneurial trade-
credit opportunities. A theoretical implication of the research is that the use of mobile money lowers the
probability of theft and alleviates trade credit constraints, thereby stimulating entrepreneurial performance.

45
In sum, the key theoretical result from the model is that access to trade credit generates demand to use M-Pesa
as a payment method with suppliers and the use of M-Pesa in turn raises the value of a credit relationship and
hence the willingness to apply for trade credit.
Policy implications
Overall, given the limited use of mobile money in SMEs for their financial transactions, compared to
households in Kenya, policy makers within governments, donors, NGOs policies and programs could
explicitly focus on promoting the use of it within SMEs. The research suggests that particular policy impact
could be achieved if the promotion of mobile money technology takes place in combination with trade credit
promotion. Policies and programs promoting the use of mobile money within SMES could particularly focus
on those firms that have already established trade relationships with a view to assure greater policy impact.
These policy recommendations are derived from the probability of using mobile money when purchasing
goods being significantly higher for businesses with a trade credit relationship with their suppliers. Regarding
the economic significance of mobile money technology, the promotion of these more secure payment systems
particularly allowing to improve on risky cash holdings and allow for more efficient transfers, can have
economically meaningful implications for firm and macroeconomic development.
The research also provides input for the actual policy debate on financial inclusion relevant in many LICs in
many developing countries. While for a long time there has been a focus on credit services for micro- and
small entrepreneurs, over the past years the policy debate has broadened to other financial services and
mechanisms. The research shows the importance of trade credit, providing efficient payment services as a
means to help firms expand their network and production. The research contributes to this debate, supported
by an expanding literature, by underlining the importance of trade credit and the promise, which digital
payment systems can hold. Mainstream literature has focused on the lack of access to credit services by
enterprises as important growth constraint in developing countries, a policy implication of this research is the
importance of effective payment services, through trade credit, for expanding economic and financial
transactions in an economy.
Additional EIP-LIC insights
Bringing in additional insights from other DFID EIP-LIC research activities of Tilburg University, a
qualitative exploration of research and policy issues concerning innovation in manufacturing SMEs in Kenya,
a short study within the DFID project, confirms that mobile banking is not so much used for business
transactions, although most company owners do see its advantages. In particular, mobile banking avoids staff
having to carry cash, according to SME owners, which is usually the case after delivery of products by the
company’s drivers.
Despite the fact that mobile money is more secure, in terms of theft, SME owners are still reluctant to use
mobile banking for their business because of security weaknesses. There are still certain ‘tricks’ to wheedling
money from account holders. The qualitative study includes a case of a company that does credit sales. At the
same time, this company has several clients who are problematic and do not pay.
5.3 Trade credit and access to finance
Many African countries have achieved promising economic growth rates in recent years. However, credit
market imperfections are still persistent, resulting in limited access to formal bank credit for many firms,
especially small and micro enterprises. Trade credit, as a method of direct ‘in-kind’ business financing, can

46
be popular as an alternative to bank credit in locations with limited financial sector development. From this
perspective, trade credit and bank credit can be considered substitutes.
In the framework of a DFID-funded research project entitled ‘Enabling Innovation and Productivity Growth
in Low Income Countries (EIP-LIC)’, a team of researchers from Cass Business School (University of
London), the Institute for Management and Planning Studies (Iran), and Tilburg University investigated the
relationship between bank credit and trade credit in the context of a developing county. Specifically, the
research question addressed whether usage of trade credit decreases with access to bank credit, or whether the
use of trade credit and bank credit are positively associated. The research further highlights the role of
formality of firms. The team analysed firm-level data from 5,500 Ethiopian retailers. The original working
paper is entitled ‘Trade Credit and Access to Finance of Retailers in Ethiopia’ (2017) by Thorsten Beck,
Mohammad Hoseini and Burak Uras .
Research approach and findings
The findings suggest that bank finance and trade credit are substitutes in Ethiopia. In locations with lesser
access to formal bank finance, the use of trade credit is higher. The extension of trade credit by suppliers
generates a credible signal to banks with regard to the customers’ creditworthiness, which can make trade
credit and bank credit complementary on the individual firm-level. For informal retailers, bank credit acts as
a counterpart to trade credit in the sense that higher bank loan exposure is associated with greater access to
trade credit. For formal firms, however, the research reveals that having more bank loans is not a significant
explanatory factor of the use of trade credit. These results could imply that receiving bank credit increases the
creditworthiness of informal firms that have less transparent operations and motivates their suppliers to extend
them trade credit. Formal firms, on the other hand, are more transparent and the level of obtaining trade credit
is mainly restricted by the availability of such sources of external finance in the locality.
Having a relationship with a bank can also act as a signal of the creditworthiness of firms to their suppliers
and reduce the agency problems associated with trade credit. An important issue for studying trade credit as
a form of financing is its substitutability versus complementarity with respect to bank credit. The researchers
find that trade credit usage is more prevalent in locations with lower access to finance, consistent with the
substitutability theory. The research, however, also finds that bank credit acts as a complement to trade credit
for informal firms who lack transparency and suffer more from agency problems with their suppliers.
Policy implications
Although the link between trade credit and bank credit has been studied in the literature, investigating this
relationship in the context of a developing country with low levels of access to finance provides several
original insights for policy makers. Financial inclusion has been a key topic in development policy debates in
many underdeveloped countries, but most policy initiatives address the direct effect of bank credit constraints.
This research stresses the importance of the role of informality in understanding the association between trade
credit and bank credit. Informal firms feature non-transparent operations and rely on cash-based transactions,
partly to hide from tax authorities and partly due to the unavailability of bank accounts. Operational
transparency is a major element in accessing external finance, because without transparent (formal) accounting
standards, creditors cannot determine the quality of borrowers. Informal sector promotion policies could focus
on the notions and necessity of transparent operations though awareness, training and education policies.
Facilitating trade credit and bank credit could mutually strengthen each other, for instance, in combined policy
and development programmes integrating the two.

47
Policies to expand financial inclusion by increasing operational transparency might alleviate the agency
problems of informal enterprises vis-à-vis suppliers and enable them to obtain not only formal finance from
banks but also informal finance in the form of trade credit.
For the formal sector, however, the research suggests less expected policy impact. Although obtaining a bank
loan is positively associated with receiving trade credit for informal firms, the team does not find a similar
significant link for the sample of formal firms.

48
References
Çapoğlu, C. 2009. The Meaning of Innovation and Entrepreneurship in Developing Countries.
International Studies In Entrepreneurship 21: 85-91.
Carayannis, E. G., E. Gonzalez and John Wetter. 2003. “The Nature and Dynamics of Discontinuous
and Disruptive Innovations from a Learning and Knowledge Management Perspective.” In The International Handbook on Innovation edited by Larisa Shavinia. London: Elseviers Science Ltd.
Chaminade, C., B.-Å. Lundvall, J. Vang and K. J. Joseph. 2010. ‘Designing Innovation Policies for
Development: Towards a Systemic Experimentation Based Approach’. In: Lundvall, B. Å., K. J. Joseph,
C. Chaminade and J. Vang (eds.) Handbook of Innovation Systems and Developing Countries,
Cheltenham: Edward Elgar, pp. 360-379
Cirera, X., & Muzi, S. (2016). Measuring firm-level innovation using short questionnaires: Evidence
from an experiment (Policy Research Working Paper 7696). Washington, DC: World Bank Group.
Fainshmidt, S., Pezeshkan, A., Frazier, L., Nair, A. & Markowski, E. (2016) Dynamic capabilities and
organizational performance: A meta-analytic evaluation and Extension. Journal of Management
Studies, 53(8), 1348-1380.
Freeman, Ch.. 1987. Technology Policy and Economic Performance: Lessons from Japan. London and
New York, NY: Pinter Publishers.
Gereffi, G. 1994 ‘The organisation of buyer driven global commodity chains: how US retailers shape
overseas production networks’. In Commodity Chains and Global Capitalism edited by G. Gereffi and
M. Korzeniewicz, Westport, CT: Praeger, pp. 95–122.
Helfat, C., Finkelstein, S., Mitchell, W., Peteraf, M., Singh, H., Teece, D., Winter S. (2007). Dynamic capabilities: Understanding strategic in organizations. Blackwell: Oxford, UK.
Kotabe, M. and K.S. Swan. 1995. The role of strategic alliances in high technology new product
development. Strategic Management Journal 16(8): 621-36.
Kuhlmann, S. , P. Shapira and R. Smits. 2010. ‘Introduction. A Systemic Perspective: The Innovation
Policy Dance’, in R. Smits, S., Kuhlmann and P. Shapira, The Theory and Practice of Innovation Policy,
PRIME Series on Research and Innovation Policy in Europe.
La Porta, R., Lopez-de-Silanes, F., Shleifer, A., & Vishny, R. 1997. Trust in large organizations.
American Economics Review, Papers and Proceedings, 137(2), 333 - 338.
Lundvall, B.-Å. 1992. National Systems of Innovation: Towards a Theory of Innovation and Interactive
Learning. London: Pinter Publishers.
Lundvall, B.-Å., K. Joseph, C. Chaminade and J. Vang. 2009. Handbook of Innovation Systems and
Developing Countries - Building Domestic Capabilities in a Global Setting. Celtenham: Edward Elgar
Publishing.

49
OECD. 2005. The Measurement of Scientific and Technological activities, proposed guidelines for
collecting and interpreting technological innovation data – Oslo Manual. Paris: Organization for
Economic Co-operation and Development (OECD), Eurostat.
Oslo Manual: Guidelines for collecting and interpreting innovation data (3rd ed.). (2005). Paris:
Organisation for Economic Co-operation and Development.
Porter, Michael. 1985. The Competitive Advantage: Creating and Sustaining Superior Performance.
New York, NY: Free Press.
Scott, W. R. 2001. Institutions and organizations (2nd ed.). Thousand Oaks: SAGE.
Szirmai A., W. Naudé and M. Goedhuys. 2011. ‘Entrepreneurship, Innovation, and Economic
Development: An Overview’, In Szirmai, A., W. Naudé and M. Goedhuys (eds.) Entrepreneurship,
Innovation, and Economic Development. Oxford: Oxford University Press, pp. 3-32
Teece, D. J. 2007. Explicating dynamic capabilities: the nature and microfoundations of (sustainable)
enterprise performance. Strategic Management Journal 28(13): 1319–1350.
Yin, R. 2003. Case Study Research: Design and methods. Thousand Oaks, CA: Sage Publications.
World Bank. 2010. Innovation Policy: A Guide for Developing Countries. World Bank.
https://openknowledge.worldbank.org/handle/10986/2460
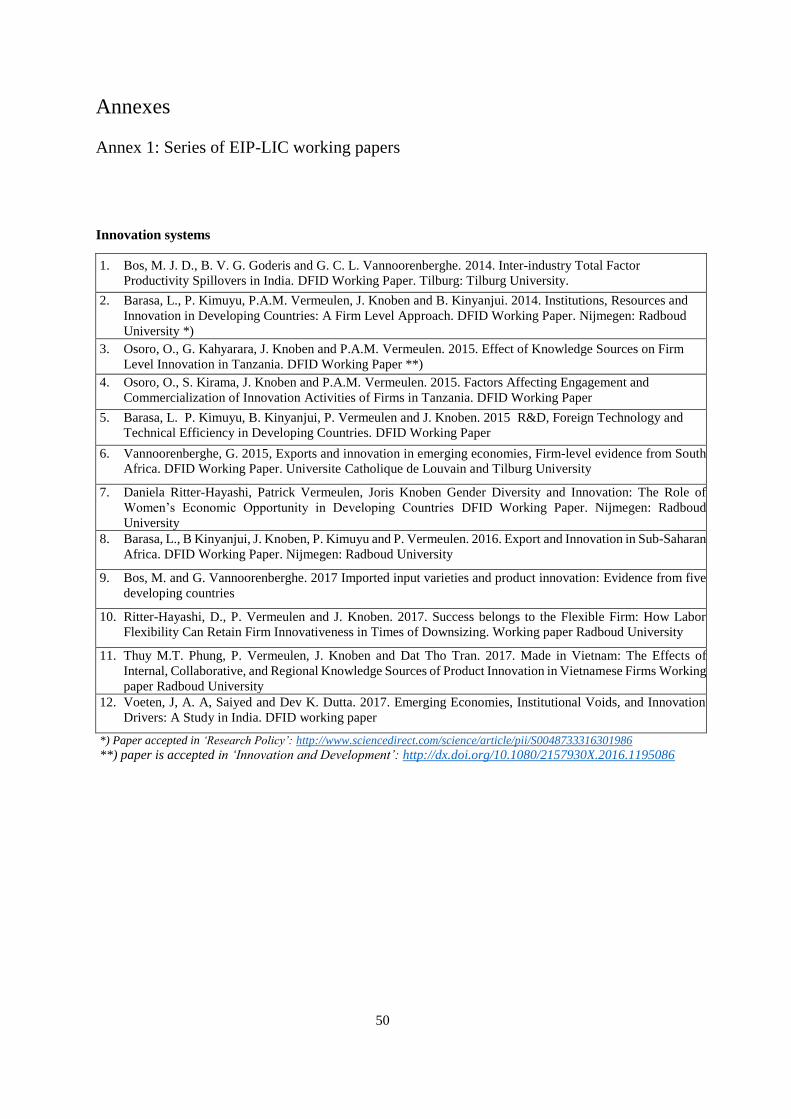
50
Annexes
Annex 1: Series of EIP-LIC working papers
Innovation systems
1. Bos, M. J. D., B. V. G. Goderis and G. C. L. Vannoorenberghe. 2014. Inter-industry Total Factor
Productivity Spillovers in India. DFID Working Paper. Tilburg: Tilburg University.
2. Barasa, L., P. Kimuyu, P.A.M. Vermeulen, J. Knoben and B. Kinyanjui. 2014. Institutions, Resources and
Innovation in Developing Countries: A Firm Level Approach. DFID Working Paper. Nijmegen: Radboud
University *)
3. Osoro, O., G. Kahyarara, J. Knoben and P.A.M. Vermeulen. 2015. Effect of Knowledge Sources on Firm
Level Innovation in Tanzania. DFID Working Paper **)
4. Osoro, O., S. Kirama, J. Knoben and P.A.M. Vermeulen. 2015. Factors Affecting Engagement and
Commercialization of Innovation Activities of Firms in Tanzania. DFID Working Paper
5. Barasa, L. P. Kimuyu, B. Kinyanjui, P. Vermeulen and J. Knoben. 2015 R&D, Foreign Technology and
Technical Efficiency in Developing Countries. DFID Working Paper
6. Vannoorenberghe, G. 2015, Exports and innovation in emerging economies, Firm-level evidence from South
Africa. DFID Working Paper. Universite Catholique de Louvain and Tilburg University
7. Daniela Ritter-Hayashi, Patrick Vermeulen, Joris Knoben Gender Diversity and Innovation: The Role of
Women’s Economic Opportunity in Developing Countries DFID Working Paper. Nijmegen: Radboud
University
8. Barasa, L., B Kinyanjui, J. Knoben, P. Kimuyu and P. Vermeulen. 2016. Export and Innovation in Sub-Saharan
Africa. DFID Working Paper. Nijmegen: Radboud University
9. Bos, M. and G. Vannoorenberghe. 2017 Imported input varieties and product innovation: Evidence from five
developing countries
10. Ritter-Hayashi, D., P. Vermeulen and J. Knoben. 2017. Success belongs to the Flexible Firm: How Labor
Flexibility Can Retain Firm Innovativeness in Times of Downsizing. Working paper Radboud University
11. Thuy M.T. Phung, P. Vermeulen, J. Knoben and Dat Tho Tran. 2017. Made in Vietnam: The Effects of
Internal, Collaborative, and Regional Knowledge Sources of Product Innovation in Vietnamese Firms Working
paper Radboud University
12. Voeten, J, A. A, Saiyed and Dev K. Dutta. 2017. Emerging Economies, Institutional Voids, and Innovation
Drivers: A Study in India. DFID working paper
*) Paper accepted in ‘Research Policy’: http://www.sciencedirect.com/science/article/pii/S0048733316301986
**) paper is accepted in ‘Innovation and Development’: http://dx.doi.org/10.1080/2157930X.2016.1195086

51
‘Finance for Productivity Growth’
1. Beck, T. H. L., H. Pamuk, R.B. Uras. 2014 Entrepreneurial Saving Practices and Business Investment:
Theory and Evidence from Tanzanian MSEs. Tilburg: Tilburg University. Paper accepted in journal
“Review of Development Economics”
2. Beck, T. H. L. and M. Hoseini. 2014. Informality and Access to Finance: Evidence from India. Tilburg:
Tilburg University.
3. Beck, T. H. L., H. Pamuk, R.B. Uras and R. Ramrattan. 2015. Mobile Money, Trade Credit and Economic
Development: Theory and Evidence (new title: “Payment Instruments, Finance and Development” R&R
for Journal of Development Economics”). Tilburg: Tilburg University.
4. Dalton, P., Nguyen Nhung and J. Ruschenpohler. 2016. The Right Amount of Income Variability:
Evidence from Small Retailers in Vietnam. Tilburg University.
5. Beck, T. H. L.,M. Homanen and B. Uras, B. 2016. Finance and Demand for Skill: Evidence from Uganda.
Tilburg University
6. Dalton, P., H. Pamuk, D. van Soest, R. Ramrattan and B. Uras. Technology Adoption by Small and Medium
Businesses: Experimental Evidence from Mobile Money in Kenya.
7. Dalton, P., J. Rueschenpuller and B. Zia. Aspirations of Small Firms: Evidence from Jakarta
8. Beck. T., M. Hoseini and B. Uras. 2017. Trade credit and access to finance of retailers in Ethiopia. DFID
Working paper, Tilburg University
9. Dalton, P., H. Pamuk, D. van Soest, R. Ramrattan and B. Uras. The effect of Mobile Money on Small and
Medium Businesses: Experimental Evidence from Kenya.
10. Dalton, P., J. Rueschenpuller, B. Uras and B. Zia. Learning business practices from peers: Evidence from
an RCT in Jakarta. (*)
11. Naveed Ahmed. Relationship Lending and Terms of Credit: Evidence from Firm Level Data in Bangladesh
12. Dalton, P., J. Rueschenpuller, B. Uras and B. Zia. Framing Effects and Small Businesses Performance:
Experimental Evidence from Urban Indonesia (^)
13. Dalton, P., Ty Turley. Developing Goals for Development. Experimental Evidence from Small Cassava
Producers in Ghana.
All papers are accessible at the EIP-LIC project website: https://www.tilburguniversity.edu/dfid-innovation-and-growth/

52
Annex 2: Highlights of DFID/World Bank EIP-LIC survey Uganda
By Vincent Bagire (Makarere University Business School/MUBS)
1. Introduction
This report covers the features from the study of Ugandan firms. The context of innovation is based on
three data sets. The first set of data comprises 184 firms from the 2014 Innovation Capabilities Survey
(ICS). The second is the follow up qualitative interviews done in 2017in which 13 firms were involved.
The report also presents data from the Enterprise Survey data of 2013 with 762 cases. The data shows
that firms surveyed were from all the parts of the country. In this report the regions are represented by
the major town where the study was centered, namely Kampala, Lira, Mbale, Jinja, Mbarara and
Wakiso. The data shows firms from manufacturing in terms of furniture, fabrication, equipment, craft
making, construction and printing. Thus there was generally a balance in regional and sector
distribution.
The World Bank Enterprise Survey (WBES) collects data focusing on an economy’s business
environment and investment climate. The World Bank has conducted firm-level surveys for many years.
Different waves of studies in the 1990’s and through 2000 have enlisted progress in understanding firm
level factors. Over the years instruments have been standardized for establishing comparability of data
across countries. The Innovation Follow up Survey (IFS) was launched in 2011 to collect data on firm-
level innovation and has so far been conducted in 19 countries in Africa and South Asia.2 The WBES
involves administering firm-level surveys to a representative sample of firms in the non-agricultural
formal sector in an economy comprising firms in the manufacturing, retail and service sector. In
addition, WBES are stratified according to the sector of activity, firm size and geographical location of
the firm.
Respondents are a subset of the original WBES and are randomly selected to form a sample of 75
percent of the ES respondents (www.enterprisesurveys.org). The ICS is a follow-up and complementary
to the IFS. The ICS comprises randomly selected respondents from the IFS sample making its sample
a subset of the IFS. The IC focuses on innovative activities and innovative capabilities of manufacturing
firms, and is a collaboration between the World Bank, Tilburg University, and Radboud University
Nijmegen within the ‘Enabling Innovation and Productivity Growth in Low Income Countries’ project
funded by the United Kingdom’s Department for International Development (DfID).3 In Uganda, the
IFS was done in collaboration with Makerere University Business School, who organized for the local
program, contacted the firms and a team of scholars witnessed the qualitative interviews that were
conducted.
1.1 General description of the sample
1.1.1 Distribution of firms region
The combined data sets shows that firms were from across the country based on major towns. Uganda
is divided in administrative districts that provide the key geographical units, in all regions. Major towns
could also be based on to denote the political regions. In this case Kampala and Wakiso reflect the
capital city and central region respectively, Mbale, the far eastern region, Mbarara for the western; Jinja
firms are representative of the east, and finally, Lira reflects the sample of firms in the northern region.
The number of firms per region is summarized in Table 1.
2 These countries include Ghana, Tanzania, Uganda, Kenya, Congo DRC, Ethiopia, Malawi, Rwanda, Sierra Leone,
South Sudan, Sudan, Namibia, Nigeria, Zambia, and Zimbabwe in Africa; and Bangladesh, Nepal, India, and Pakistan
in South Asia. 3 This project was undertaken to study the innovative capability of manufacturing firms in ten case countries including
Ghana, Tanzania, Uganda, Kenya, South Africa, and Ethiopia from Africa, Bangladesh, and India from South Asia and,
Vietnam and Indonesia from East Asia and Pacific http://www.tilburguniversity.edu/dfid-innovation-and-growth/.

53
Table 1. Sample by towns in Uganda, combined WBES and IFS data
Sampling region from final progress report, combined
Region/town Frequency Percent Valid
Percent
Cumulative
Percent
Valid
Kampala 74 37.6 37.6 37.6
Jinja 35 17.8 17.8 55.3
Lira 14 7.1 7.1 62.4
Mbale 19 9.6 9.6 72.1
Mbarara 25 12.7 12.7 84.8
Wakiso 30 15.2 15.2 100.0
Total 197 100.0 100.0
The majority of the firms were obtained from the central and the capital city areas. This is by far the
largest region and more vibrant in business activity. It has more urban centers than the other regions.
Notably Kampala is the capital city where many enterprises mushroom given the big urban market.
Conversely Wakiso is a large urban district that skirts around Kampala city. In the near east is Jinja and
having a high number for firms connotes with its historical status. It is traditionally the industrial town
of Uganda and home to the country’s currently operational hydro electrical dams. In the west covering
a big hinterland to the south is Mbarara town. By region characterisation, Mbarara is a big area and with
many district towns that are growing rapidly.
Figure 1. Distribution of firms by major towns denoting regions
Regarding the sample by region and size, excluding the IFS firms, Table 2 and Figure 2 give a further
description of the sample firms. The size is measured based on number of employees. Small being equal
to or less than five to nineteen; twenty to ninety nine and large had one hundred and above. The firms
in Kampala were moderately distributed across the size, although the majority were still in the small
size category. Jinja and all the other towns, save for Wakiso has majority in the small size categorization; Wakiso had a majority in medium size. Notably there was no large size firm in Lira, Mbarara and Mbale
0
10
20
30
40
50
60
70
80
Kampala Jinja Lira Mbale Mbarara Wakiso
D I S T R I B U T I O N O F F I R M S BY R E G I O N

54
in this sample. This analysis implies that across the country, firms employing more than 100 people are
still relatively very few.
Table 2. Firm distribution by region and size
Sample Size Total
Small
>=5 and <=19
Medium
>=20 and <=99
Large
>=100
Kampala 32 16 13 61
Jinja 25 5 5 35
Lira 9 5 0 14
Mbale 18 1 0 19
Mbarara 22 3 0 25
Wakiso 10 18 2 30
Total 116 48 20 184
Figure 2. Graph of sample by size and region
Distribution of firms sector
The IFS sample included SMEs falling in different sub sectors within manufacturing and services. It
was thus interesting to learn of the comparative innovation efforts across different firms. The firms were
in metal fabrication, wood works, textile, construction, printing and craft ware. The majority were in
metal works, equipment and fabrications. Notable as well as the firms in the handcrafts and woodwork;
these comprised of carpentry, crafts, decorations, earth pieces among others. The summary
categorization by sector is shown in Figure 3.
0
5
10
15
20
25
30
35
Kampala Jinja Lira Mbale Mbarara Wakiso
Size versus Region
Small >=5 and <=19 Medium >=20 and <=99 Large >=100

55
Figure 3. Distribution of firms by sector
Conversely, the ICS survey firms were distributed over a number of sectors. This is summarized in
Table 3 showing the sector and the region.
Table 3. ICS sample firms by region and sector
Sector of the Establishment * Sampling region from final progress report Cross tabulation
Count
Sampling region from final progress report Total
Kampala Jinja Lira Mbale Mbarara Wakiso Secto
r of th
e Estab
lishm
ent
1511 3 0 0 0 0 0 3
1514 0 0 3 0 0 0 3
1520 1 1 0 0 1 0 3
1531 2 5 3 3 2 2 17
1533 0 1 0 0 0 0 1
1541 4 1 1 1 3 6 16
1542 0 1 0 0 0 0 1
1549 0 1 0 0 0 2 3
1551 1 2 0 0 0 0 3
1553 0 0 0 0 0 1 1
1554 2 0 0 0 0 1 3
1711 15 1 0 2 2 3 23
1721 2 0 0 0 0 0 2
1722 1 0 0 0 0 0 1
1729 3 0 0 0 0 1 4
1730 0 0 0 0 1 0 1
1810 4 1 0 1 2 0 8
1920 0 1 0 0 0 0 1
2010 1 1 0 0 1 0 3
2022 0 0 0 1 0 0 1
2029 1 0 0 0 1 0 2
2101 1 0 0 0 0 0 1
2211 2 0 0 0 0 0 2
2221 1 0 2 0 2 0 5
2411 1 0 0 0 0 0 1
2422 1 0 0 0 0 0 1
2424 0 0 0 0 0 1 1
Metal works and Equipment
39%
Handcraft and Wood works
23%
Food processing15%
Textile and Printing
15%
Construction 8%
Sector distribution

56
2519 0 0 0 1 0 0 1
2520 0 0 0 0 0 2 2
2693 2 0 0 0 1 2 5
2695 1 0 0 0 0 0 1
2720 0 1 0 0 0 0 1
2811 0 4 1 1 1 1 8
2892 0 1 0 0 0 0 1
2899 4 4 0 3 5 2 18
2921 0 1 0 0 0 0 1
2923 0 0 0 1 0 0 1
3130 1 0 0 0 0 0 1
3190 1 0 0 0 1 0 2
3430 1 1 0 0 0 0 2
3610 4 7 4 5 2 5 27
3720 1 0 0 0 0 0 1
4510 0 0 0 0 0 1 1
Total 61 35 14 19 25 30 184
1.2 Exports and Imports
The Ugandan economy is still predominantly import based. The country is land locked and the gate way
is through the Seaport of Mombasa through the Republic of Kenya. This in a way limits the level of
exports by small producers as the cost from the inland across to the seaport is very high. The economy
is also largely agro based with much livelihood on subsistence farming in crop and animal husbandry
(PWC, Uganda Economic Outlook, Q2 2017). The country has also went through a turbulent political
past prior to the mid 1980’s. This political past still defines the business landscape in the country as
well as the level of development and industrialization.
Uganda attained independence from Britain in October 1962. It went through some constitutional crisis
and was declared a republic in 1966. In 1971, the country entered a remarkable era in history when the
first military coup was staged and overthrew an elected government. For next eight years the country
suffered bloodbath under military dictatorship. After the overthrow of dictatorship in April 1979 by a
combined force of Ugandan exiles and Tanzanian forces, the country witnessed short presidential
tenures till an elected government was sworn in in 1980. The new regime however, was faced with
guerrilla warfare and was ousted by its own military in 1985; the new military ruler was shortly deposed
by the guerrilla forces in January 1986. This political scene left the economy crumbled. Public
infrastructure was almost spoilt to non-functional. The country has therefore been in recovery but lately
regained its economic path.
National development is still low. This is despite the country being endowed with good climate and vast
natural resources. Agro-technology is still low accounting for low productivity hence less value for
export. On the other hand, certain foods are imported into the country especially rice and sugar. Equally
most manufactured products are imported, including capital goods and industrial inputs. For instance
whileas, merchandize in exports increased from USD 147 in 1990 to U$ 501 in 1998, imports increased
from U$213 million to U$ 1474 million; a very large disproportionate ratio. Thus we see a great
imbalance between the country’s exports and imports. The mineral sector is inadequately developed
despite the confirmation of rich oil and gas reserves in the Albertine region alongside other scattered
mineral deposits countrywide.
The summary of the product exports and imports characteristic in the IFS data set companies are
summarized in Table 4.

57
Table 4. Product exports and import behaviour of the firms
Company Main business Products and export level
Stone Works Stone for construction Different stone shapes imported to Kenya and Rwanda
Furniture Wood work in all forms Started importing finished products from China. Now
exporting at low scale to Rwanda and venturing into
South Sudan.
African Crafts Craft designs Through visitors and interns to Finland, Canada,
Germany, USA
Apparel Designers Textile designs Have made inroads to export bags, gowns etc. To
Tanzania, US, Europe, Malawi and Finland
Energy Stoves Energy saving stoves Exported once to South Sudan currently yet to make
other external contacts.
Fruit Processing Fruit juice processing and
packing
Export efforts made to Southern Sudan, Kenya and
Ghana, other expected
Furniture Furniture designing Still depending on local market.
Food Processing Food processing Attempted through friends to Canada, US, and regional
markets
Equipment Fabrication Machinery and equipment Working on ISO certification to launch into export,
building capacity
Metal Fabrication Metal fabrication Exploring regional market
Tools Manufacturing Machinery and equipment
fabrication
Not ventured, occupied with satisfying local market
In Table 5 is a representation of the export priority areas by the WBES dataset.
Table 5. Export destinations by priority (Percent)
Region As first main As second
China 0.5 -
Congo 1.6 1.6
DRC 0.5 -
Germany 0.5 -
India 1.6 -
Kenya 5.4 2.7
Rwanda 1.6 5.4
South Sudan 4.9 1.6
Sudan 6 1.1
Tanzania 1.6 1.1
U.K 0.5 0.5
USA 1.1 -
Burundi - 0.5
Canada - 0.5
Nigeria - 0.5
South Africa - 1.6

58
The data confirms that the key destination for Ugandan exports remains Kenya, followed by South
Sudan. Other first priority destinations are Congo, Rwanda, USA, India and Tanzania. Conversely, these
countries are also second priority destinations.
1.3 Supplies and imports
Table 6 shows the proportionate means for the firms reporting on input supplies purchased from
domestic or foreign sources. Across all regions, the means for domestic origin so much outweigh those
for foreign origin. Mbale reports the highest mean for domestic followed by Lira. This means that in
these two regions, the greatest portion of the raw materials and intermediate goods were of domestic
origin. Conversely, in these two regions, the lowest means are reported for raw materials and
intermediate goods being of foreign origin. Kampala reports the highest mean for foreign origin,
although proportionately lower than the highest score for domestic. Kampala and Wakiso are below the
average of the domestic origin source. The possible explanation for this observation lies in the type of
industry in question. Most of the raw materials for instance in fabrication and carpentry are locally
available. Firms may also be purchasing some of their inputs from local importers.
Table 6 Report on Raw materials and intermediate goods source
Table 6 shows the proportion of total material inputs and supplies by origin for firms located in different
regions (www.enterprisesurveys.org). With the exception of SSA, which seems to depend on inputs of
foreign origin to a large extent, we observe relatively little variation in the reported proportions shown
in Table 5 and regional data in Table 6.
The origin of inputs and supplies by region is shown in Table 7.
Table 7. Origin of inputs and supplies by region
Region
Foreign origin Domestic origin
East Asia and Pacific 25.4% 74.6%
Europe & Central Asia 38.0% 62.0%
Latin America & Caribbean 35.1% 64.9%
Middle East & North America 43.9% 56.1%
South Asia 24.0% 76.0%
Sub-Saharan Africa 64.8% 35.2%
Table data shows that the highest origin of inputs and supplies is Sub Saharan Africa; South Asia was
reported to be the lowest foreign origin.
Sampling region from final
progress report
Raw materials and intermediate
goods of domestic origin
(Mean values)
Raw materials and intermediate
goods of foreign origin
(Mean values)
Kampala (N=61) 61.66 36.41
Jinja (N=35) 73.20 20.06
Lira (N=14) 87.86 12.14
Mbale (N=19) 92.63 7.37
Mbarara (N=25) 70.80 29.20
Wakiso (N=30) 61.07 31.07
Total (N=184) 70.19 26.60

59
2 Innovation
2.1 Product and process innovation
Innovations are here discerned from the point of view of process and products, including improvements
in service provision. The definition of innovation adopted in this report is based on previous studies
especially Oslo Manual (2005). It is defined as the implementation of new products and services, or
significant changes in existing products and services. From the Uganda country study are noted various
innovations as discerned from the owner managers explanation. These are elaborated below product,
process, market, production and customer services.
Product
The cutting and polishing of stone for construction was found to be a key innovation by one company
in the study. The stone veneer is produced according to international standards but they have made
significant improvements in the product and process. About 8 different kinds of rock, marble and
limestone are cut into different shapes to meet the taste of the construction industry. 38 different product
types are designed. The owner has also ventured into export to Kenya and Rwanda.
In the wood and furniture works we also identified various product innovations. These included new
designs of furniture pieces that are unique on the Ugandan markets. Some of these designs are original
as was explained by the owner managers, others are imitations and modifications of westerns models.
As explained earlier, the innovations in equipment and machinery was fascinating and so are those in
crafts and energy stoves. We found the patenting of the purple coloured energy stove by one company
a very bold step of innovation not common in the rest of the country.
Figure 4- Innovation activities
From the figure above, several activities were listed as carried out towards innovations among the
sampled SMEs. As noted earlier the basic understanding of innovation was being able to offer
something new from the neighbours. In this case activities were mainly in new product development,
followed by formal training. The lowest focus was on new product development.
Formal training activities
This became the second highest scored activity towards innovation, although it was a surprising result.
Formal training was done in different ways. Notable was the training organized by international NGOs
and agencies like DFID, GIZ from which the entrepreneurs gained immense knowledge for their
operations. One entrepreneur for instance, was offered a formal training in Germany and on return has
0 1 2 3 4 5 6 7
New Equipment
Formal Trainings
New Product development
Internship
Production
Innovation Activities

60
been able to develop various innovations in solar power energy. At the energy stove company,
apprenticeship is the kind of training that is offered; the apprentices go through a long and rigorous
training to master the skills. As it was noted, some leave to set up their own enterprises.
Production activities
Activities related to production were key drivers to innovation. Many of the enterprises were adopting
newer technologies in their production processes. This was at one Printing company where graphical
printing and digital machinery had greatly improved quantity and quality; a similar story was shared by
Apparel designers whose importation of electrical sewing machines had changed the fashion designs of
the graduation gown. Similarly at the Stone Company the powerful cutting and designer machines led
to a breakthrough in stone veneers innovations.
Internship activities
This could be categorised as organizational innovation or even training but it emerged with emphasis
on its own. It began as a policy by the National Council of Higher Education to encourage skill
development among graduates. It has become an innovative activity for companies as well as graduates
to develop new ways of doing work through knowledge exchange and learning on the job.
2.2 Effect of cost of innovation in the establishment.
This analysis is based on the WBES dataset. This effect of cost of innovation on the firm establishment
is depicted Figure 4 below and summarized in table 8.
It is discerned from the
graph that the cost of
innovation was felt to
be very important
among the
establishments. Those
reporting it to be not
important or moderate
were relatively very
few.
Figure 5. Importance attached to cost of innovation

61
Table 8 Cost of innovation by region
High cost innovation? Total
Not
important
Moderately
important
Very
important
Sampling
region from
final
progress report
Kampala 15 4 42 61
Jinja 7 6 22 35
Lira 0 4 10 14
Mbale 1 3 15 19
Mbarara 1 13 11 25
Wakiso 3 7 20 30
Total 27 37 120 184
With further analysis of cost of innovation by region, the distribution was very important across the
regions with the highest being Kampala and Lira the lowest. This signifies that cost remains a key factor
in innovation activities of firms in the survey.
Certainty of innovation
It was also important to establish whether the certainty of innovation for services and goods was at all
an issue among the firm in the WBES survey. The results in Table 9 provide key insights on this
aggregated by region.
Table 9.Uncertain demand for innovation goods or services
Frequency Percent
Not important 49 26.6
Moderately 78 42.4
Very important 57 31.00
Total 184 100
The uncertain demand for the innovation was moderately important. Across the regions, however,
Kampala maintained very important for the uncertainty. Other regions however, aligned with the
general view of uncertainty of demand being only moderately important.
On whether there was no need for innovation due to prior innovation, the score was higher in Kampala;
all the other regions differed and maintained moderate rankings. This could be due to Kampala’s
population being extremely urban and exposed that they find no need for new innovations due to
previous innovations. Also the influence of many goods allows them adequate variety of choices for
their consumption. Meanwhile in upcountry towns their consumption is driven by seeing something
new, which may drive desire for further innovations.
Table 10. Sampling region from final progress report * Uncertain demand for innovative goods or
services?
Uncertain demand for innovative goods or
services?
Total
Not important Moderately
important
Very important
Sampling region from
final progress report
Kampala 15 20 26 61
Jinja 17 10 8 35
Lira 2 10 2 14
Mbale 4 8 7 19
Mbarara 2 19 4 25
Wakiso 9 11 10 30 Total 49 78 57 184
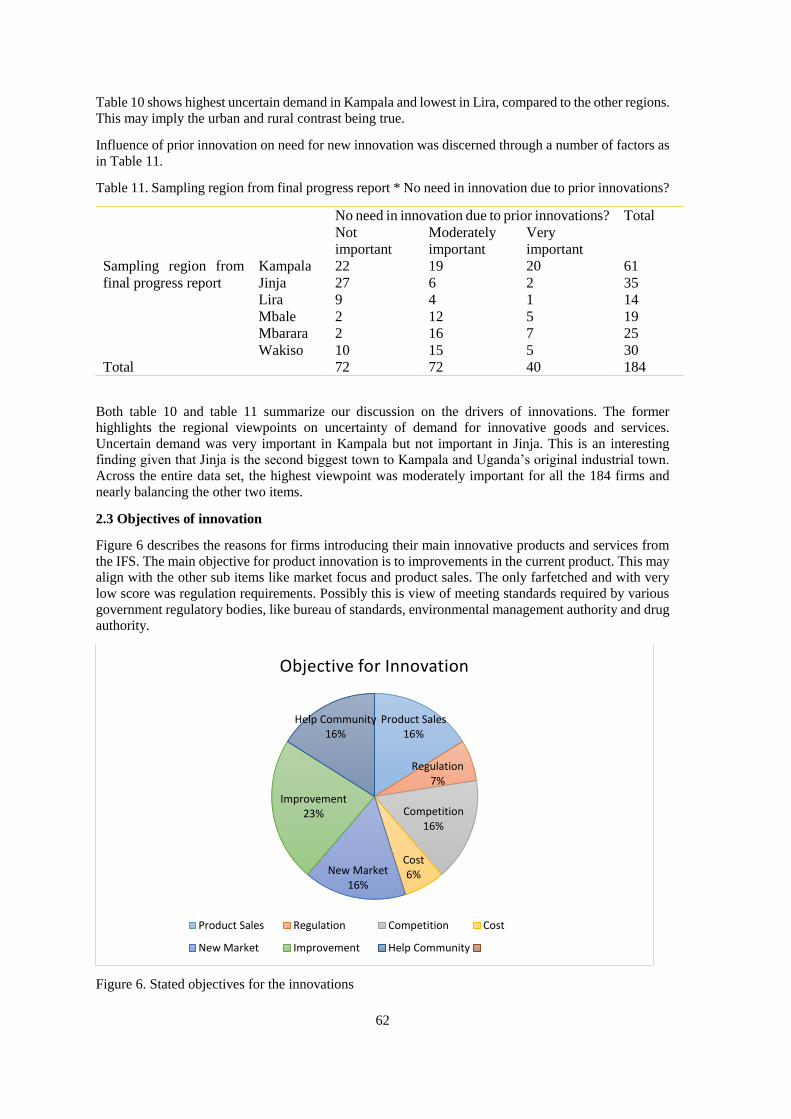
62
Table 10 shows highest uncertain demand in Kampala and lowest in Lira, compared to the other regions.
This may imply the urban and rural contrast being true.
Influence of prior innovation on need for new innovation was discerned through a number of factors as
in Table 11.
Table 11. Sampling region from final progress report * No need in innovation due to prior innovations?
No need in innovation due to prior innovations? Total
Not
important
Moderately
important
Very
important
Sampling region from
final progress report
Kampala 22 19 20 61
Jinja 27 6 2 35
Lira 9 4 1 14
Mbale 2 12 5 19
Mbarara 2 16 7 25
Wakiso 10 15 5 30
Total 72 72 40 184
Both table 10 and table 11 summarize our discussion on the drivers of innovations. The former
highlights the regional viewpoints on uncertainty of demand for innovative goods and services.
Uncertain demand was very important in Kampala but not important in Jinja. This is an interesting
finding given that Jinja is the second biggest town to Kampala and Uganda’s original industrial town.
Across the entire data set, the highest viewpoint was moderately important for all the 184 firms and
nearly balancing the other two items.
2.3 Objectives of innovation
Figure 6 describes the reasons for firms introducing their main innovative products and services from
the IFS. The main objective for product innovation is to improvements in the current product. This may
align with the other sub items like market focus and product sales. The only farfetched and with very
low score was regulation requirements. Possibly this is view of meeting standards required by various
government regulatory bodies, like bureau of standards, environmental management authority and drug
authority.
Figure 6. Stated objectives for the innovations
Product Sales 16%
Regulation7%
Competition16%
Cost6%New Market
16%
Improvement23%
Help Community16%
Objective for Innovation
Product Sales Regulation Competition Cost
New Market Improvement Help Community

63
Source of information for innovations
This was an interesting item for the firms. It turned out that sources of information for the innovation
are various as illustrated in the Figure 7.
Figure 7. Sources of innovation information
The sources of information for innovation cut across internal and external dimensions. The internal
sources were internet search, benchmarking and study trips. Benchmarking was very low, simply that
the SMEs do not carry it out as a way for learning. In the external factors suppliers were the lowest;
possibly as compared to customers, the latter was the highest, which conforms to norm. Suppliers of
materials, power, fuel etc. may not be interested in how much innovation but Customer feedback is
essentially critical to pointing out the changing needs. As noted earlier, some owner managers indicated
that they learnt a lot when they travelled outside the country.
2.4 Challenges to the local firms in innovation
Table 12. Summary of challenges of innovation
Infrastructure Lack of good machines that can be used in production
Transport facilities in terms of transporting materials
High prices for electricity.
Regulation Lack of contracts from the government and also jobs being given to only
Chinese companies
The interest rates are quite very high and prohibitive
The value of the dollar has not been regulated and too high
Institutions The prices at which the ingredients are bought are too high
High charges for rent
High taxes on operations, like the purchase of timbers and high
Lack of institutions coming to train because much emphasis is put on formal
educational institutions only
Competition Customers are poor can't afford to consume as they used to
Domination of the market by many people doing the same work
Lack of clear market, ignorance of the market and people prefer things
imported from outside companies
012345678
Information Sources

64
Small companies that produce poor quality goods on the roads which sell at a
low price
Lack of customers
Lack of steady market for the produce and the business being flooded was a
major hindrance
Marketing of products, informal sector is still predominant
Organizational Lack of practical knowledge by the workers hampering innovation
Lack of well-established capital both material and cash Minimizing jobs
among the youth and people losing morale
Seasonality in the demand for their products by the customers
A lot of expenditure compared to earnings for example
Economic Theft within the area is the biggest problem
The patent laws are weak and there is a lot copying in the industry
Figure
8.
Aggregated Challenges to innovation
Table 12 summarizes the views from the WBES while Figure 8 displays those from the IFS. Both align
into internal and external challenges. A number of challenges are to do with the firms’ internal
capabilities, financing and management. There are however, a number or challenges that are external
and thus uncontrollable that continue to hamper innovations in Uganda.
The Government policy direction on BUBU – Buy Uganda, Be Ugandan. This is a new policy that
emerged out of complaints by the local entrepreneurs on competitiveness with foreign investors as well
as massive import flows of locally available products. It has not picked up well despite the novelty it
carries. Government agencies were for example required to buy furniture from the local firms but claims
of poor quality and inadequate supplies still fail the implementation of BUBU.
2.5 Dynamic capabilities
The role of firm capabilities has become more important in developing economies in recent years
(Fainshmidt, Pezeshkan, Frazier, Nair, & Markowski, 2016). A dynamic capability refers to the capacity
of an organization to purposefully create, extend, or modify its resource base (Helfat et al., 2007). In
this and other innovation surveys, dynamic capabilities are reported using four constructs including
identification and selection of knowledge, knowledge acquisition, knowledge transformation, and
commercialization of products. Various items in the ICS instrument measured on a 7-point-likert scale
ranging from completely disagree to completely agree are used for measuring each construct.
Specifically, 5 items are used for measuring the firm’s ability for identifying and selecting knowledge,
3 items are used for measuring the firm’s ability for acquiring knowledge, and 4 items are used for
measuring both the ability of transforming knowledge and commercializing products.
2
4
1
3
4
3
2
0 1 2 3 4 5
Uncertaain Demand
Market
Partners
Technology
Personnel issues
High Costs
Financing
Barriers to Innovation

65
The average values of the items within each construct measuring dynamic capabilities are shown in
Figure 9. Lira scores highly on most of the variables. It streams highest on commercialization but is
close with Wakiso on the others namely “Identification & selection” of knowledge, “Acquisition” and
“Transformation”. The lowest posts are from Jinja on all the four dimensions. On the overall, firms
report the lowest ability of identifying and selection of knowledge, and transforming knowledge.
Conversely, they report generally average ability of acquiring knowledge. This low score on
identification and selection of knowledge may imply that the firms are unable to perceive market
opportunities. Conversely, the high scores on acquisition of knowledge confirm innovations that
eventually get to the market, as commercialization is equally high. Overall by total, there were high
abilities for all capabilities indicating rich networks between firms and scientific and research institutes.
Figure 9. Dynamic capabilities
Illustration of Cases
In this section a brief highlight of cases is given to illustrate the dynamic capabilities as discerned. We
look at capabilities in terms of education, skills, facilities and process. This analysis is based on the IFS
data.
Stone veneer company
We found that the capabilities at the firm level were generally above average. At the Stone veneer, the
owner manager was educated in economics and business administration but had ventured and mastered
the science of stone ware and design. The firm uses diverse knowledge to manage both processes and
technical decisions. The founder has also set up formal company structures to ensure smooth
transformation and sustenance of operations. He has learnt the physical attributes of stones that define
their hidden value.
Management system that involves delegation, health care system among others was akin to the process
improvements. Thus the innovation activities discerned from this company were among others included
stone cutting and designs, process setting to ensure standardization and efficiency measures through the
operations
0.0 1.0 2.0 3.0 4.0 5.0 6.0
DC Select
DC Acquire
DC Combine
DC Commercialize
Mean scores of Dynamic Capabilities by Region
Total Wakiso Mbarara Mbale Lira Jinja Kampala

66
Furniture Company
Expansion and Transformation into a large company; improved board set up and composition skilled
enough to steer the strategic direction of the company; sustainability through the family membership on
the board and in management; the company has obtained an ISO certification. Management has also
separated manufacturing which is now done about twenty kilometres out of the city and the show room
and sales department which are in the central business district.
The company has noted the need for a strategic positioning in the entire value chain. They have bought
a large piece of land and ventured into tree growing to ensure sustain future supplies of soft and hard
wood. Various by products are also used in the same vain, like pulp for making soft cushions, husks are
also utilized into manure.
They have also acquired a plot in the government designated industrial park which is foreseen to be the
main business hub in the coming years. To meet future needs of the changing market, the company is
shifting from manual to computerized systems in the whole operations. This has required new skills and
a program to retool the staff is going on with a slogan for innovation. The owner manager travels a lot
to see and get inspired with new ideas from around the world. In his knowledge management model he
is preparing for succession in the next three years.
Energy saving company
The innovation in stove making has taken root in the Ugandan market. The company that was involved
in this study was key testimony of how much local entrepreneurs have managed to move this skill to a
higher level. Driven by the world advocacy for energy systems that conserve the environment, this has
become not only a lucrative business but also a policy friendly venturesome. The country is running out
of forest cover at a very fast pace. The key domestic source of energy is firewood and charcoal. The
current domestic technologies do not conserve energy thus use of large quantities of firewood. The other
innovations in faecal sludge and briquettes are still in nascent technological breakthrough; it is shrouded
in cultural and technological limitations. So an innovation in stones that conserve energy is timely as it
will not save the environment but also saves domestic users from high energy expenses.
The company has grown from 5 to 30 employees in less than ten years of operation, and combined
knowledge in ceramic fabrication to improved stoves. These are shaped in square, rectangle, oval and
round. They are curved of old iron sheets, with attractive colour patterns and use a combination of
marketing channel innovations. They have partnered with environmental protection focused NGOs who
have large orders to supply to their beneficiary communities. In this vain, the company has benefitted
from trainings by the development partners. The company is lately studying a modification possibility
to diversify into solar energy systems. Resources that have enabled them develop the innovations are
machinery, technology, grant networks, professional engineers, and sector networks and collaborations
under an umbrella association.
2.6 Trust
In this section we report the level of trust of the firms to their partners in business dealings. Results are
given in Table 13. Four items measured on a 7-point-likert scale ranging from completely disagree to
completely agree used the ICS instrument relating to the extent to which firms regard their partners as
trustworthy, frank and truthful, honest, and including the extent to which firms trust other organizations
are used to construct an averaged value for measuring trust. Mbale and Lira reported the highest mean
value on trust. On the other hand, Jinja reported the lowest mean value on trust. We carefully note that
the mean values for five of the six regions were above average. The mean for Jinja was below the grand
mean. Over all, the results imply a relatively high level of trust.

67
Table 13. Trust
Sampling region from
final progress report
Min Max Mean SD N
Kampala 2.50 6.00 4.1639 .89429 61
Jinja .00 5.50 3.3143 1.71535 35
Lira 2.50 6.00 4.6429 .86444 14
Mbale 3.25 6.00 4.7500 .80795 19
Mbarara 2.50 5.25 4.2800 .60519 25
Wakiso 2.75 5.25 4.2667 .72497 30
Total .00 6.00 4.1318 1.11862 184
We compare mean values of trust in partners, and other organizations in their business dealings with
mean values of political trust. This was to establish whether there is a general attitude of trust or distrust
in government. The ES instrument to construct a measure of political trust that relates to the respondents
evaluation of business-government dealings. This is also a measure of regional institutional quality
(RIQ). That we examine in the second section of the report. Items were measured on a 5-point-likert
scale ranging from “no obstacle” to “very severe obstacle” indicating the “degree to which e.g.
corruption is an obstacle to the operations of the firm” is used for measuring political trust.
Government performance relating to perceived corruption, judicial efficiency, and bureaucratic quality
has been found to be associated with trust (La-Porta, Lopez-de-Silanes, Shleifer, & Vishny, 1997).
Hence, government institutions will most likely not be perceived as an obstacle where we have high
levels of trust. The results reveal that the mean values for political trust above average for all the regions,
save for the case of Jinja. While this may imply better functioning government institutions, it may also
have a historical dimension. As already noted earlier in this report, Uganda’s current business landscape
is mirrored in the political past the country suffered. In the old regimes government and its agencies
were direct perpetrators of insecurity and harassment to the business community. This image has vividly
changed in the minds of the people in the recent past. Jinja was once the country’ industrial town but
this progress was stunted. A most likely reason is based on government agencies. Jinja on the other
hand reported the only mean below average in the trust of partners. It equally had the lowest trust in
government and its agencies. This is summarized in table14.
Table14. Comparison of firm Trust in Partners and Government
Sampling region from
final progress report
Trust in
partners
Trust in
Government
and agencies
N
Kampala 4.1639 5.3934 61
Jinja 3.3143 1.7714 35
Lira 4.6429 6.7857 14
Mbale 4.7500 6.3158 19
Mbarara 4.2800 5.2000 25
Wakiso 4.2667 5.8333 30
Total 4.1318 5.8937 184

68
2.7 Relationship with customers and institutional actors
Relationships with buyers, suppliers, competitors, and institutional actors indicate the degree of firm
embeddedness in local networks of economic activity. Four items measured on a 7-point-likert scale
ranging from completely disagree to completely agree from the ICS instrument are used to construct an
averaged value measuring whether the firms “have very well established relations” with these external
actors. Table 15 shows that Lira reported the highest mean value on this indicator. We conclude that
firms in the northern region have relatively close relations with external actors than the others. The
lowest mean was recorded in Mbarara which was also below the grand mean. The implication is lowest
relationship of firms with external actors in the western part of Uganda.
The values suggest that a divergence in agreement on having well established relations with external
actors. This implies a somewhat moderate degree of integration signifying that only some firms are
likely to benefit from information and opportunities in their local networks of economic activity and
others likely not.
Table 15. Relationship with external actors
Sampling region from
final progress report
Minimum Maximum Mean Std.
Deviation
N
Kampala 1.75 6.00 3.9877 .82339 61
Jinja 1.00 5.00 3.2357 .81110 35
Lira 4.50 6.00 5.1429 .49725 14
Mbale 3.75 5.50 4.6711 .44917 19
Mbarara 1.75 4.50 3.0700 .90289 25
Wakiso 2.50 5.75 4.0833 .84163 30
Total 1.00 6.00 3.8940 .98363 184

69
3 DFID Research Questions
This part of the report answers several questions relating to firm-level and regional-level factors that
drive innovation in Uganda. We use simple regressions. In addition, we examine how public-private
sector linkages influence the development of innovations. We also investigate the significance of factors
that firms perceive as critical barriers to the process of innovation and the diffusion of technology. This
analysis and the statistics in the tables are based on the Uganda ES2013 data set. This data covered firm
level and market factors including age, ownership and education; access to credit, innovation, location
and regulatory quality. There were 762 cases on which the analysis is based.
3.1 Firm characteristics, regional factors and innovation activities
In this section the following research question is addressed: “What firm-level and regional-level factors
including size, ownership, market orientation, labour skills availability, gender, firm location, ties
between public/private sector, role of intermediaries etc. hinder or foster the engagement of firms in
innovative activities?”
Firm-level factors include age, size, percentage of foreign ownership, percentage of fulltime employees
with high school education, and access to a line of credit or loan from a financial institution. Regional-
factors comprise location of the firm which includes urban or rural, regional level of knowledge
creation, and RIQ. We use a clustered robust standard errors logit model to examine whether these
factors foster or hinder innovation activities including internal R&D, external R&D, formal training,
and purchase of new equipment for the development of innovations. Standard errors are clustered at the
regional level. Table 16 reports the results of our estimation. For the firm-level factors we observe that
the coefficient for size is positive and significant across all model except internal R&D. This indicates
that larger firms have a generally higher likelihood of engaging in innovation activities.
Table 16. Logistic regression coefficients (n =762)
On the firm level factors, the coefficients were widely positive and significant for external R&D, save
for age. Age was positive and significant for internal R&D only and negative and not significant for
external R&D. For the rest it was positive but not significant. This implied that older firms were more
likely to engage in internal R&D. The coefficient for education is negative for internal R&D, positive
and significant for external R&D and not significant for new equipment. Hence, firms with a large
proportion of employees with high school education have a higher likelihood of engaging in external
R&eD. The coefficient for foreign ownership is positive and significant for internal R&D, external
R&D, but negative for formal training and new equipment. This may be a result of foreign direct
investment where foreign owners attempt to focus on R&D and less on formal training as they come in
Variable Internal R&D External R&D Formal training New equipment
Firm-level factors
Age 0.015** (.000) -0.0031 (0.000) 0.024 (0.000) 0.025 (.1364)
Size 0.011 (.000) 0.078** (0.000) 0.117*** (0.001) 0.104** (.2197)
Foreign ownership .0015** (.000) 0.059* (0.000) -0.001 (0.000) -0.019 (.2009)
Education -0.008 (0.000) 0.080** (0.000) 0.175*** (0.000) 0.085 (.1738)
Access to credit 0.017** (0.009) 0.083** (0.036) 0.032 (0.043) 0.073 (.1612)
Regional-level factors
Location 0.152*** (0.007) 0.048 (0.028) -0.025 (0.043) 0.049 (.1337)
Knowledge creation 1.020** (0.000) 0.499*** (0.001) -0.185** (0.001) 0.030 (.3344)
RIQ 0.001 (0.001) 0.020 (0.003) -0.012 (0.003) 0.016 ((.1398)
Constant -0.348 (0.022) -0.107 (0.083) 0.194** (0.097) -0.4819 (.41417)
Clustered robust standard errors in parentheses
* p<0.10, ** p<0.05, *** p<0.01

70
with experts. Access to credit is positive and significant to internal and external R&D. It remains
positive but not significant in the rest of the models. This means that firms access credit to engage in
R&D but do not seek credit to finance formal training and purchase of new equipment.
On the regional level factors, knowledge creation has more spread positive and significant coefficients
across the models. It is negative with formal training. This inverse relationship may mean that with
more knowledge created within the firm, there is less attraction to formal education. Also it is likely
that there are several knowledge sharing channels. Location is positive and significant only for internal
R&D, hence firms located in the urban center may seek to increase their internal R&D. Thus
urbanization may not encourage investment in external R&D. We also observe that the coefficient for
RIQ are not significant across all models. A probable explanation for this is may be that firms do mind
risks associated with entering into contracts for the production of innovations.
Hence, from this analysis we conclude that firm level factors and regional level factors are diversely
significant in the various models. We infer that in Uganda, the prediction of innovation has to be
assessed across factors on both scales.
3.2 Commercialization of innovative output
This section answers the following research question: “Which firm-level and regional-level factors
hinder or foster the extent to which firms successfully commercialize the outcomes of their innovation
activities?” We examine the relationship between firm-level and regional-level factors, and
commercialization of innovative output by means of an OLS regression model. The measure relates to
the ability of firms capturing value from their innovative output. Hence, commercialization is
conditioned upon innovation activities yielding successful outcomes. Nonetheless, we run a simple OLS
regression to explore this relationship. Table 17 reports the results of our estimation. We observe that
none of the firm level factors had a significant effect on commercialization. There are negative
coefficients for size, education and age. Probably this, means that firms to commercialize their
innovations is not given due attention as firms grow in age and size. However, location had a very
strong effect on commercialization. This is important and means that urban location with big
concentrates of population attracts more commercialization than rural areas where people are sparse.
Table 17. OLS regression coefficients (n = 184)
Variable Commercialization
Firm level factors
age of firm -.121 (0.001)
Size -.060 (0.001)
Foreign Ownership .012 (0.010)
Education -.032 (0.009)
Access Credit .003 (0.759)
Regional level factors
Location .252** (0.738)
RIQ -.063 (0.068)
Knowledge Creation .128 (0.017)
(Constant) 9.150*** (2.318)
Robust standard errors in parentheses
* p<0.10, ** p<0.05, *** p<0.01

71
Among the regional level factors, location was most significant. RIQ was negative and not significant
whereas knowledge creation was not significant. This counterintuitive as one would expect that firms
have higher ability to commercialize. We could also note that firms have a higher ability of
appropriating returns from innovative output in an environment with strong institutions (Barasa,
Knoben, Vermeulen, Kimuyu, & Kinyanjui, 2017).
Thus, as firm-level factors, the size of the firm is not important for commercializing innovative output.
Furthermore, knowledge creation and RIQ are not crucial regional-level factors for successful
commercialization of innovative products and services. Notwithstanding, urbanization seems to hinder
the extent to which firms can successfully commercialize innovative output.
3.3 In-house innovation, collaborative innovation, and technology acquisition
This section addresses the following research question: “What is the impact of in-house innovation
activities versus collaborative innovation activities or technology acquisition activities on the
innovation performance of firms in developing countries?” In-house innovation activities relates to a
firm developing innovative products or services entirely on its own. Collaborative innovation activities
on the other hand indicate that firms cooperated with other external actors including firms,
universities/research institutes, private consulting companies, individuals or government enterprises to
develop their innovative output. Technology acquisition on the other hand relates to firms acquiring
foreign technology including equipment and machinery for their production processes. Innovation
performance is measured as the number of innovative products/services introduced by the firm. Table
18 shows that firms engaging in-house innovation activities and collaborative innovation activities have
lower innovative output relative to those that have acquired foreign technology. This suggests that firms
in low income countries such as Uganda benefit from incorporating foreign technology in their
production processes.
Table 18. OLS regression coefficients (n = 184)
Variable Innovation output
Firm-level factors
Age 0.101 (0.001)
Size -0.011 (0.000)
Foreign ownership -0.057 (0.008)
Education -0.079 (0.007)
Access to credit 0.062 (0.010)
Regional-level factors
Location 0.085 (0.595)
Knowledge creation -0.187* (0.014)
RIQ 0.067 (0.054)
Innovation activities (Reference: Foreign technology
acquisition)
In-house activities -0.054 (2.522)
Collaborative activities -0.009 (2.508)
Constant 7.805 (2.192)
Clustered robust standard errors in parentheses
* p<0.10, ** p<0.05, *** p<0.01
Based on the results of our estimation, we conclude that technology acquisition is critical for increasing innovative output relative to in-house and collaborative activities. This is particularly relevant in the

72
context of developing countries given that our descriptive statistics revealed that countries in SSA
heavily depend on imported inputs and supplies relative to countries in other regions.
3.4 Economic spillovers and innovation
This section answers the following research question: “What is the role of economic spillovers within
clusters of firms in fostering economic growth and innovation?” Table 19 reports on our estimation of
the effects of spillovers generated by cooperative relationships with customers and suppliers on
innovative performance. Cooperative relationships relate to the number of firms reporting that the main
important source of information or idea for any innovative activity in their firms was from customers
or suppliers.
Table 19. Logistic regression coefficients (n =184)
Variable Innovation
Firm-level factors
Age (log) 0.129 (.000)
Size (log) 0.076 (.000)
Foreign ownership 0.087 (.000)
Education 0.009 (0.001)
Access to credit 0.012 (0.091)
Regional-level factors
Location -0.025 (0.092)
Knowledge creation 0.341*** (0.002)
RIQ -0.019** (0.008)
Cooperative relationships
Customer 0.200** (0.206)
Supplier 0.054 (0.571)
Cooperation for innovation
Firms 0.186** (0.170)
Private consulting
company/individuals 0.086 (0.129)
Universities/research institutions -0.087 (0.164)
Constant 0.699 (0.521)
Clustered robust standard errors in parentheses
* p<0.10, ** p<0.05, *** p<0.01 Additionally, spillovers arising from cooperating with other firms, universities/research institutes, and
consultancy firms in developing main innovative products are also reported. Innovation performance is
a binary variable which indicates whether a firm introduced any new product or service. Coefficients
for knowledge creation and R&D are positive and significant. Coefficients for collaborating with
customers are significant. This implies that spillovers arising from collaborating for innovation between
firms is important for Uganda. Additionally firms benefit more from customer ideas as they are likely
to give feedback.
Based on our estimation, we conclude that horizontal spillovers arising from firms are more critical for innovation performance relative to vertical spillovers from customers and suppliers. In particular,

73
innovation ideas from other firms and customers have significant effects on innovation performance for
manufacturing firms in Uganda.
3.5 Barriers to innovation and technology diffusion
This section addresses the following research question: “What are the most critical barriers to the
process of innovation and the diffusion of technology in low income country setting?” Table 20 reports
the results of our estimation of the relation between barriers of innovation, and technology diffusion.
Innovation performance is measured as the number of innovative output and technology diffusion
relates to firms adapting or reproducing a product or service already sold by another firm. We observe
the most critical barriers to the innovation process include knowledge creation and market dominated
by established firms. Notwithstanding, the most critical barrier to technology diffusion is size, foreign
ownership and knowledge creation.
Table 20. OLS/ Logistic regression coefficients (n =762)
Innovative Output Technology
Diffusion age of firm .113 (.001) -.078 (.000)
Size .002 (.001) .269*** (.000)
Foreign Ownership -.027 (.008) .332*** (.001)
Education -.032 (.007) .042 (.001)
Access Credit .109 (.631) -.016 (.099)
Location .010 (.595) .166 (.104)
Knowledge creation -.215** (.014) .199* (.002)
RIQ .046 (.055) .087 (.009)
Lack of finance? .037 (.351) .041 (.057)
High cost innovation? -.033 (.415) -.067 (.064)
Lack of qualified personnel? .029 (.387) -.091 (.070)
Lack of information on technology? -.123 (.411) .035 (.075)
Lack of information on markets? .068 (.432) .075 (.064)
Difficulty finding co-operating
partners?
-.005 (.371) .113 (.062)
Market dominated by established
enterprises?
-.191* (.407) -.024 (.069)
Uncertain demand for innovative
goods or services?
.153 (.406) -.018 (.072)
No need in innovation due to prior
innovations?
-.016 (.4100 -.064 (.070)
(Constant) 8.919*** (2.009) -.440 (.348)
We therefore conclude that the most critical barrier to process of innovation is knowledge creation. This
implies that without creating new knowledge firms cannot have innovations developed. Furthermore,
difficulty in finding co-operating partners implies weak linkages between firms, and universities and
research institutes.
3.6 Linkages with external agents and innovation
Here, we address the following research question: “What types of links between public/private sector,
universities, government, NGOs and the private sector are more conducive to innovation activity? What
is the role of universities for facilitating/propagating innovation in LICs? What is the role of the private
sector?” In some instances, firms collaborate with external agents for realizing the development of
innovative products or services. External agents comprise domestic and foreign firms, domestic and
foreign academic and research institutions, private consulting company/individuals, and the
government. Very few firms report on these measures of co-operation in the development of
innovations. In fact, no firm reports collaborating with the government in developing its main innovative
product or service. Table 21 reports the results of our estimation of the relation between the highlighted
linkages and innovative activity in the firms.

74
Table 21 Logistic regression coefficients (762)
Variable Internal R&D External R&D Formal training New equipment
Firm-level factors
Age (log) -.024 (.000) -.061 (.000) -051 (.000) .010 (.1951)
Size (log) .012 (.000) .112 (.000) .126 (.000) -.058 (.1466)
Foreign ownership -.009 (.000) -132* (.000) -.102 (.001) .113 (.2032)
Education .006 (.000) .092 (.001) .083 (.001) -.205* (.1785)
Access to credit .013 (.000) .009 (.083) .056 (.645) -.034 (.1513)
Regional-level factors
Location .238*** (.021) .046 (.085) -.006 (.093) .017 (.1766)
Knowledge creation 1.077*** (.000) .547*** (.002) .292** (.002) .101 (.3796)
RIQ -.001 (.002) .010 (.007) .076 (.008) -.057 (.1358)
Academic/research institutions -.005 (.037) -182** (.154) .033 (.167) -.155 (.2897)
Firms .007 (.038) -.014 (.158) -.009 (.172) .036 (.3389)
Private consultants -.018 (.029) .168** (.120) .109 (.130) .014 (.2217)
Constant -.638 (.113) .133 (.466) -.333 (.506) .8158 (.9015)
Standard errors in parentheses
* p<0.10, ** p<0.05, *** p<0.01
We observe that firms collaborating with private consultants are more likely to engage in external R&D
than those collaborating with Academic institutions.
Thus, different types of linkages matter for different innovation activities in the context of innovation
in LICs. Linkages with private consultants have a much larger effect on external R&D. Linkages with
other firms was not important for internal R&D and external R&D. The role of academic and research
institutions has no effect on innovation activities undertaken by firms. This may indicate that there are
very weak linkages between academia, research institutions and firms in Uganda. Furthermore, linkages
do not affect formal training and purchase of new equipment for innovation.
3.7 Gender diversity and innovation
In this section we address the following question: “What is the role of gender diversity in fostering
innovation performance for firms in developing countries?” Table 22 provides an overview of how
gender diversity impacts innovation performance which is measured as the introduction of new products
or services. Gender diversity relates to female participation in the ownership of the firm, top
management and overall workforce. Innovation is measured as whether or not a firm introduced new
products or services. We find that the coefficient for female ownership is negative and not significant.
Notwithstanding, the coefficients for female participation in top management is positive but not
significant.

75
Table 22. Logistic regression coefficients (n=184)
Variable Innovation
Firm-level factors Age (log) .141** (.000)
Size (log) .063 (.000)
Foreign ownership -.058 (.001)
Education .096* (.001)
Access to credit .034 (.073)
Regional-level factors
Location .046 (.049)
Knowledge creation .409*** (.001)
RIQ .093* (.005)
Gender diversity
Female ownership -076 (.015)
Female top manager .119 (.059)
Female workforce
participation -.115*
(.006)
Constant .032 (.183)
Clustered robust standard errors in
parentheses * p<0.10, ** p<0.05, *** p<0.01
These results suggest that firms with a more gender diverse ownership structure do not necessarily
introduce a new product or service. Essentially, female owned firms have no likelihood of introducing
innovations in the context of Uganda. The coefficients for female ownership was negative and not
significant; those for female workforce participation were negative but statistically significant.
Considering these coefficients, we attribute to the general social structure in which women may be
attributed to low participation rates. Furthermore, the negative but non-significant relation between
female participation in the top management could be explained by the general social status in which
women managerial capability is not highly considered.
4 Conclusions
4.1 Distribution of firms
The report presents data from three samples, the Innovations Capability survey (ICS) with 184 firms, a
qualitative follow up in 2017 with 13 companies and the Enterprise Survey data of 2013 with 762 cases.
The report covers firms from all regions of the country namely Kampala, Lira, Mbale, Jinja, Mbarara
and Wakiso. These major towns represent the major regions. The firms were from manufacturing in
terms of furniture, fabrication, equipment, craft making, construction and printing. Thus there was
generally a balance in regional and sector distribution.
4.2 Exports and Imports
We also looked at exports and important. It was said that Uganda is mainly import oriented. The
Ugandan economy is still predominantly import based. Being a land locked country, Uganda relies
mainly on the sea route through Mombasa in Kenya. The recent focus is a diversification to Dar es
Salaam. The country has gone through a turbulent past that seems to define her SMS status. This
notwithstanding the country has consolidated a recovery road map. With oil and gas discovery in the

76
Albertine region alongside. All the countries in the sub region were cited as export destinations. Kenya
is the major on for both exports and imports. Other countries were US, UK and European countries
4.3 Supplies and imports
We analysed the proportionality of exports and imports, especially for raw materials. We noted that
most of the raw materials and intermediate goods are of mainly domestic origin. There were very few
from foreign markets origins. In regional distribution Mbale and Jinja have the highest of both. It is
also possible the firms may also be purchasing some of their inputs from local importers. This means
sources are local but of foreign origin.
4.4 Innovations
This report widely covers findings on innovation among the surveyed firms. It enlists the source of
innovation information, measures of innovation, innovation activities and barriers.
4.4.1 Innovation activities
There were various innovation activities reported in the survey. They included production innovations
in the processing and packaging, internship, new product development, training and new equipment.
The highest score was on new product developments across the various sectors and regions. This
confirms that firms in Uganda are involved in various forms of innovation. The objectives of
innovations can be summarized as increasing sales, improvements in process, help communities,
regulations, competition and new markets.
4.4.2 Sources of information for innovation
The survey was also interested in summarizing the source of information for the innovations. This was
mainly from customer feedback. It scored highest while others were university and research institutions.
This implies that SMEs in Uganda who are involved in various innovative activities have close linkage
with their customers and interestingly with academic institutions either through direct study programs
or internship opportunities with students. After all internship was also mentioned among the innovative
activities. Other sources of information which were important and reaffirm the innovations activities
of the firms were benchmarking, government sources, suppliers and study trips. These various sources
of information imply that SMEs are clearly looking out for any possible information from multiple
sources to drive their innovative ideas.
4.4.3 Barriers to Innovation
Several barriers to innovation were enlisted. They ranged from personal factors, firm level factors,
industry and policy matters. These include innovations in costs; cost was very important a factor across
the regions in terms of production and running businesses. The other key challenges to innovation were
taxation regimes, poor or lack of machinery, knowledge base was low and prices are unstable. They
also reported lack of customers and clear market, seasonality of demand, technological flows and cost
of electricity, among others.
4.5 Dynamic capabilities
Dynamic capabilities were measured using that included the firm’s ability for identifying and selecting
knowledge, ability for acquiring knowledge, transforming knowledge and commercializing products.
There were generally balanced across the regions with Lira scoring highly on most of the variables. It
was closely followed by Wakiso on identification & selection of knowledge, acquisition and
transformation. Jinja posted the lowest scores on all the four dimensions. We conclude that overall,
firms report a high ability of identifying and selection of knowledge, and transforming knowledge. They
however reported a low level of acquiring knowledge. This challenges them on how to translate
knowledge into innovations if its acquisition is very low.

77
4.6 Trust and relationships with external actors
The measurement of trust and relationship with partners were important to assess how much the firms
worked with other players in the industry as well as government. In the report a comparison is made
between the other partners and government. The level of trust a firm has with the government could
widely influence the ability to innovate. Mbale and Lira reported the highest mean value on trust. On
the other hand, Jinja reported the lowest. Over all, the results imply a relatively high level of trust by
firms to external players. Interestingly, and important for the survey, the level of trust in government
was very low across all the regions, save for Mbale. We attribute this to the political history the country
went through were people who are of age and witnessed government machinery forcefully root
merchandize could still be vivid in their minds or the stories retold over the years. Relationships with
buyers, suppliers, competitors, and institutional actors indicate the degree to which firms interact and
work with others. We know that firms are environmental serving and environmental dependent. We
conclude that firms in the northern region have relatively close relations with external actors than the
others.
4.6 Gender diversity
Gender diversity was observed to be a key factor in innovations. Across the regions, however, firms are
characterised of patriarchal societies and female ownership was likely to be very low as well as female
as top manager. The role of gender diversity in promotion of innovation cannot be ignored. Urbanization
is likely to play a key role in fostering female participation.
4.7 Linkages with external actors
One major observation is that well-functioning institutions benefit commercialization of innovative
output. We also find that relative to in-house and collaborative innovation activities, firms that acquire
foreign technology increase their innovative output. Furthermore, cooperating with other firms and
consultants significantly affects innovation performance lending credence to the positive influence of
horizontal spillovers. Notwithstanding, firms cite market dominance by established firms and
knowledge creation as major impediments to the innovation process. This indicates that innovating
firms are likely to be operating in markets with limited freedom of entry for new products and services.
In sum, there are salient features of manufacturing firms in Uganda that provide insightful contextual
information that is crucial to understanding innovation.

78
5 References
Barasa, L., Knoben, J., Vermeulen, P., Kimuyu, P., & Kinyanjui, B. (2017). Institutions, resources and
innovation in developing countries: a firm level approach. Research Policy, 46(2017), 280-291.
http://dx.doi.org/10.1016/j.respol.2016.11.008.
Cirera, X., & Muzi, S. (2016). Measuring firm-level innovation using short questionnaires: Evidence from an experiment (Policy Research Working Paper 7696). Washington, DC: World Bank Group.
Fainshmidt, S., Pezeshkan, A., Frazier, L., Nair, A. & Markowski, E. (2016) Dynamic capabilities and
organizational performance: A meta-analytic evaluation and Extension. Journal of Management
Studies, 53(8), 1348-1380.
Helfat, C., Finkelstein, S., Mitchell, W., Peteraf, M., Singh, H., Teece, D., Winter S. (2007). Dynamic
capabilities: Understanding strategic in organizations. Blackwell: Oxford, UK.
La Porta, R., Lopez-de-Silanes, F., Shleifer, A., & Vishny, R. 1997. Trust in large organizations.
American Economics Review, Papers and Proceedings, 137(2), 333 -338.
Oslo Manual: Guidelines for collecting and interpreting innovation data (3rd ed.). (2005). Paris:
Organization for Economic Co-operation and Development.

79
Appendix. Variable measurement
Variable Measurement Source
Innovation performance
Innovative output Number of innovative products or services introduced IFS
Innovation Firm introduced any new product or service: "1" Yes "0" No IFS
Firm-level factors
Age (log) Year of survey (2013) less the year the establishment began its operations WBES
Size (log) Number of permanent full-time employees at the end of the last fiscal year WBES
Foreign ownership % owned by private foreign individuals, companies or organizations WBES
Education % of full-time workers completed high school WBES
Access to credit Establishment has a line of credit or loan from a financial institution: "1" Yes "0" No WBES
Regional-level factors
Location City with population over 1 million: "1" Urban "0" Rural WBES
RIQ Composite measure of mean of standardized firm-level scores of corruption, rule of law
and regulatory quality in each region WBES
Corruption
Corruption as an obstacle is measured: five-point scale (0 = not an obstacle, 4 = very severe
obstacle). WBES
Rule of law
Courts as obstacle: five-point scale (0 = not an obstacle, 4 = very severe obstacle) WBES
Political instability as obstacle: five-point scale (0 = not an obstacle, 4 = very severe
obstacle) WBES

80
Crime, theft, disorder as obstacle: five-point scale (0 = not an obstacle, 4 = very severe
obstacle) WBES
Regulatory quality
Tax rates as obstacle: five-point scale (0 = not an obstacle, 4 = very severe obstacle) WBES
Tax administration as obstacle: five-point scale (0 = not an obstacle, 4 = very severe
obstacle) WBES
Customs and trade regulations as obstacles: five-point scale (0 = not an obstacle, 4 = very
severe obstacle) WBES
Business permits and licensing as obstacles: five-point scale (0 = not an obstacle, 4 = very
severe obstacle) WBES
Knowledge creation (log) % of firms conducting internal R&D within a region IFS
Innovation activities
Internal R&D Dummy variable: "1" Yes "0" No IFS
External R&D Dummy variable: "1" Yes "0" No IFS
Formal training Dummy variable: "1" Yes "0" No IFS
New equipment Dummy variable: "1" Yes "0" No IFS
Commercialization Average value of items in commercialization construct ICS
Extent to which firm can successfully commercialize products: 7-point-likert scale (0=
completely disagree, to 6=completely agree) ICS
Extent to which firm can commercialize completely new products: 7-point-likert scale (0=
completely disagree, to 6=completely agree) ICS
Extent to which firm can commercialize new products in existing markets: 7-point-likert
scale (0= completely disagree, to 6=completely agree) ICS
Extent to which firm can commercialize new products in new markets: 7-point-likert scale (0= completely disagree, to 6=completely agree)
ICS

81
Collaboration
Collaborative activities Innovation with firms, universities/research institutions, private consulting companies,
individuals: "1" Yes "0" if otherwise IFS
In-house activities Innovation developed entirely by the firm: "1" Yes "0" if otherwise IFS
Foreign technology Technology licensed from a foreign-owned company: "1" Yes "0" No WBES
Spillovers
Other firms Number of firms reporting most important source of information/knowledge to be from
parent or another firm IFS
Consultancy firms Number of firms reporting most important source of information/knowledge to be from
private consulting company/individuals IFS
Universities/research institutes Number of firms reporting most important source of information/knowledge to be from
universities/research institutes IFS
Barriers
Lack of funds within enterprise 3-point-likert scale (0= not important, to 3=very important) ICS
Lack of external financing 3-point-likert scale (0= not important, to 3=very important) ICS
High costs of innovation 3-point-likert scale (0= not important, to 3=very important) ICS
Lack of qualified personnel 3-point-likert scale (0= not important, to 3=very important) ICS
Lack of information technology 3-point-likert scale (0= not important, to 3=very important) ICS
Lack of information markets 3-point-likert scale (0= not important, to 3=very important) ICS
Difficulty finding co-operating
partners 3-point-likert scale (0= not important, to 3=very important) ICS
Market dominated by established
firms 3-point-likert scale (0= not important, to 3=very important) ICS
Uncertain demand for innovative
products 3-point-likert scale (0= not important, to 3=very important) ICS

82
No need due to prior innovation 3-point-likert scale (0= not important, to 3=very important) ICS
Technology diffusion Adapted or reproduced a product or service already sold by another firm: "1" Yes "0" No IFS
Linkages
Academic/research institutions Innovation developed with domestic or foreign academic/research institutions: "1" Yes "0"
No IFS
Firms Innovation output developed with domestic/foreign firms or a domestic-owned parent firm:
"1" Yes "0" No IFS
Private consulting
company/individual Innovation output developed with private consulting company/individual: "1" Yes "0" No IFS
Demand vs supply side policies
Financial support Government agencies or departments source of funds for innovation activities: "1" Yes "0"
No IFS
Non-financial support Government agencies or departments source of non-financial support for innovation
activities: "1" Yes "0" No IFS
Gender diversity
Female ownership Ownership of firm: "1" if female, "0" if otherwise WBES
Female top manager Top manager of firm: "1" if female, "0" if otherwise WBES
Female workforce participation
(log)
Ratio of number of female full-time employees to the number of full-time employees both
at the end of the last fiscal year WBES