Embed Size (px)
Citation preview

6 December 2016
Imagination Technologies Group plc Business on track; restructuring nears completion Imagination Technologies Group plc (LSE: IMG, “Imagination”, “the Group”), a leading multimedia, processor and communications technology company, today announces results for the six months ended 31 October 2016. Highlights
• Total partner shipments in line with expectation, with revenues from continuing operations up 6% to £64.4m (H1 FY16: £60.8m), as a consequence of the strong US dollar
o Royalty revenue up 6% to £52.5m (H1 FY16: £49.6m) − Total partner unit shipments 584m (H1 FY16: 584m)
o Licensing revenue up 7% £11.8m (H1 FY16: £11.0m)
− PowerVR licencing slow with deals moving to H2
− Ensigma revenue up 144% to £4.4m (H1 FY16: £1.8m) - significant deals signed with large customers
• Group returned to profitability
o Continuing operations adjusted EBIT* up 65% to £12.2m (H1 FY16: £7.4m)
o Continuing operations operating profit of £2.9m (H1 FY16: loss £5.5m)
o £27.5m annual cost savings delivered • Restructuring nears completion - Pure and most of IMGsystems sold, IMGworks near disposal
• Net debt of £40.8m (April 2016: £33.0m, October 2015: £35.4m), H1 outflows reflecting one-off restructuring costs and £5.2m exchange loss on dollar denominated debt. Continuing operations generated £9.5m cash from operating activities
• Peter Hill will take over as non-executive Chairman on 1 February 2017 - see separate press announcement
Andrew Heath, Chief Executive, said: “We have successfully executed the restructuring programme, initiated last February, on time and in line w ith our expectations. The £27.5m of cost savings, identified earlier in the year, have been delivered – this has enabled the business to return to profitability. Our Ensigma unit achieved strong licence sales as we have made good progress in agreeing deals w ith a number of major customers. The underlying trading performance of the Group for H1 is in line w ith our expectations and we additionally benefitted from the strong dollar. “We are now in a much better position to exploit our leading technologies, across a range of increasing opportunities and execute our refreshed strategy. “For our continuing operations, w e remain on course to deliver an underlying trading performance for the year in line w ith our expectations and anticipate that w e w il l continue to see an additional benefit from the strong US dollar.”
* Adjusted EBIT is used by management to measure the performance of the business year on year by excluding non-recurring items (items which typically do not occur every year), items relating to acquisitions and investments, non-cash based share incentive charges, and amortization of intangible assets from acquisitions. The reconciliation from reported results to adjusted results is set out in note 6.
Enquiries

Imagination Technologies Group plc Tel: 01923 260 511 Andrew Heath, Chief Executive Officer Guy Millward, Chief Financial Officer Instinctif Partners Tel: 020 7457 2020 Adrian Duffield/Kay Larsen/Chantal Woolcock About Imagination Technologies Imagination is a global technology leader whose products touch the lives of billions of people across the globe. The Group’s broad range of silicon IP (intellectual property) includes the key processing blocks needed to create the SoCs (Systems on Chips) that power all mobile, consumer and embedded electronics. Its unique multimedia, processor and connectivity technologies enable its customers get to market quickly with complete and highly differentiated semiconductors. Imagination’s licensees include many of the world’s leading semiconductor manufacturers, network operators and OEMs/ODMs who are creating some of the world’s most iconic products. See: www.imgtec.com. Overview In the first half of the financial year, the Group continued the restructuring of the business, initiated last February, to enable the business to grow and trade profitably. The £27.5m cost reductions have been completed in line with the original expectations. Pure was sold in September and the majority of IMGsystems has either been sold or closed down. IMGworks and the remaining part of IMGsystems are in the process of being sold. These transactions are near completion. Continuing operations achieved revenues growth of 6% to £64.4m (H1 FY16: £60.8m) and adjusted EBIT* of £12.2m (H1 FY16: £7.4m). The cost savings and improved revenues meant that the Group returned to profitability with an overall (including discontinued operations) adjusted EBIT* of £7.8m (H1 FY16: loss £7.2m), helped by foreign exchange gains. Strategy Following the detailed operating review at the start of this calendar year, the Group continued to reinforce and build on the current strengths in its three core businesses; graphics and multimedia (PowerVR), general purpose processing (MIPS) and connectivity (Ensigma). Investment has been increased in PowerVR with the addition of 24 more engineers, and more will be added in the second half of the financial year to address market opportunities. Ensigma produced a strong performance in license sales and MIPS continued to increase its presence in the automotive market with a number of deals. The Group’s strategy is to build leading and disruptive IP solutions of real scale with customers, across a wide range of markets, where it can provide differentiated offerings and build defendable positions; delivering long-term value to shareholders. The Group will continue to invest in MIPS and Ensigma and improve these businesses through partnership arrangements aimed at building the necessary ecosystems and reaching scale more quickly. Outlook Imagination continues to see good demand for licenses in all three core businesses. Royalty revenues for the full year remain in line with earlier expectations before the exchange gains. The improved revenues, lower cost base and operational cash generation mean the Board’s expectations for the full year for the continuing operations remain unchanged.

Operational review PowerVR PowerVR’s focus is on consolidating Imagination’s position and retaining leadership in high-end mobile phones and regaining market share in the mid-range mobile market. Opportunities exist to also grow the Group’s position in automotive infotainment, digital TV/set top boxes and the rapidly emerging AR/VR market; as well as exploiting investments made in ray tracing and vision products. The Group is seeing continuing success of PowerVR in mobile GPUs. Its architecture is deeply embedded in the market leader’s devices, who continue to use PowerVR’s GPU technology in their latest products. The Group’s Series 8XE has been a notably successful product launch. It is being actively designed-in by licensees, and as such Imagination expects a number of new devices based on PowerVR Series8XE to ship in 2017, including devices from customers, who have not previously shipped with PowerVR, targeting the STB/DTV, automotive infotainment and mobile segments. There will be major new devices shipping from established customers too, notably the Mediatek Helio X30. Imagination expects some of these devices to intersect with Google’s Daydream VR specification and enable further mass market untethered VR headsets. The mature PowerVR technology offerings will be refreshed in 2017 with new offerings in the mid-range XE family and in the high-end with the debut of 8XT, which is a significant advance in the PowerVR architecture. The collaboration announced with OTOY is further testimony of the potential of accelerated ray tracing to disrupt the GPU market. The Group’s ray tracing technology is under evaluation by tier1 players in the gaming market and Imagination is continuing to develop its ecosystem with notable games publishers and middleware/engine providers. Imagination has also seen the first shipments of its video technology in high performance H.265 4K60 422 prosumer devices. The Group also expects to ship its advanced ISP technology aimed at the prosumer market in Q3 and that these new offerings will drive further the PowerVR licensing pipeline MIPS MIPS has been refocused on the embedded processor markets, where the Group is strong. It has seen design wins in networking, routers and DTV/STB. Good progress is also being made in mobile LTE modems, as the Group targets its differentiated technology to customers’ needs. The strength of Imagination’s differentiated technology was demonstrated by Mobileye’s selection of MIPS I6500 for its latest EyeQ5 product and Denso’s announcement to collaborate on joint research on hardware multi-threading for next-generation in-vehicle electronic systems. Ensigma Ensigma is now focused on IP licensing for connectivity. The complete end-to-end Wi-Fi and Bluetooth solutions offered by Ensigma have resulted in the strong licensing in the first half, up £2.1m. Notable deals have been secured with major industry players in mobile computing, unmanned systems and IoT, including a significant win with a tier1 provider which is an important validation of the strength of the Ensigma offering. Financial review The segmental analysis showing the component parts of the Group’s business now includes allocations of centrally managed costs that apply to each business. The remaining costs shown as central costs related to the directors and other corporate costs which do not specifically relate to any of the businesses. IMGworks is shown as a discontinued operation following the announcement that it is to be sold, made at the July 2016 results.

Revenue Licensing revenue from continuing operations increased 7% to £11.8m (H1 FY16: £11.0m), although H1 FY16 revenue includes £2.4m of license revenue that was subsequently reversed in H2 FY16, following decisive action taken to renegotiate two contracts and improve the commercial outcome for the group. PowerVR license revenue of £5.1m (H1 FY16: £6.7m) was slow with deals moving to H2. £1.7m of H1 FY16 revenue reversed was in PowerVR. MIPS license revenue was £3.1m (H1 FY15: £3.4m), H1 FY16 revenue included £0.3m of license revenue that was reversed in H2 FY16. Ensigma license revenue grew 260% to £3.6m (H1 FY16: £1.0m) with significant deals signed with large customers giving the business the opportunity to achieve royalty progress for the first time in recent years. Royalty revenues from continuing operations rose 6% to £52.5m (2015: £49.6m) with both PowerVR and MIPS showing year-on-year increases helped by favourable exchange rates. MIPS’ partner shipments were 388m (2015: 353m) with volumes up in most major customers, PowerVR partner shipments were 191m (2015: 226m), driven by the predicted fall in volume at our largest customer. Ensigma volumes were 4.7m (2015: 5m). Average royalty rates were in line with last year in PowerVR and Ensigma and down slightly in MIPS. The average sterling/dollar rate during the first half of the year increased by 14%, resulting in a similar gain in revenue. Profitability The £27.5m of cost savings identified earlier in the year have been delivered in full. Following completion of the restructuring and the sale of the discontinued operations, headcount for the Group will be around 1,200 (down from 1,700, including discontinued operations, in February 2016). However, the Group continues to recruit into the core businesses. PowerVR achieved adjusted EBIT* of £16.3m (2015: £16.7m), an operating margin of 38%. Both MIPS and Ensigma significantly improved their profitability, Ensigma covered its engineering cost for the first time, although both businesses made adjusted losses*. Exchange gains on revenue from continuing operations were approximately £9m spread over the businesses. Exchange losses included in operating expenses were approximately £4m, these were concentrated in MIPS and corporate costs where asset retranslations are shown. Operating profit from continuing operations was £2.9m (H1 FY16 loss £5.5m). Losses fell in discontinued operations as cost reductions made last year came through and businesses were sold before the period end. Losses on the disposal of Pure and parts of the IMGsystems business were £0.9m; the acquirer of Pure also has an option to buy one of the Group’s King Langley properties. Finance expenses of £5.5m (H1 FY16: £0.3m) included £4.6m of exchange losses on retranslating loans, leases and hedging contracts at the weaker sterling exchange rates at the end of October 2016. Tax charges in continuing operations reflect withholding taxes paid on customer receipts. The Group expects to use up losses in coming periods as the business’ profitability improves. The Group’s loss after tax improved to £10.1m (2015: £20.8m).

Cash and debt Continuing operations generated £9.5m in cash but overall operations absorbed £1.0m after loss-making discontinued operations and the payment of restructuring costs outflows. The net debt at the year-end increased to £40.8m (2015: £35.4m), £5.2m of the £5.4m increase was due to retranslation of the US dollar denominated debt at current exchange rates.

Condensed consolidated income statement
Continuing operations
Half-year to 31 October
2016
£’000
Half-year to 31 October
2015 (restated)
£’000
Year to 30 April
2016 (restated)
£’000
Revenue 64,448 60,762 121,553
Operating expenses (61,593) (66,278) (148,320) Operating profit / (loss) from continuing operations 2,855 (5,516) (26,767)
Net financing expense (5,471) (263) (2,630) Loss before tax (2,616) (5,779) (29,397)
Taxation (charge) / credit (2,004) (1,526) 3,294 Loss from continuing operations (4,620) (7,305) (26,103)
Loss from discontinued operations (net of tax) (5,491) (13,508) (54,756)
Loss for the period attributable to equity holders of the parent (10,111) (20,813)
(80,859)
Loss per share (note 8)
Basic Diluted
(3.7)p (3.7)p
(7.7)p (7.7)p
(29.8)p (29.8)p

Condensed consolidated statement of comprehensive income
Half-year to 31 October
2016 £’000
Half-year to 31 October
2015 £’000
Year to 30 April
2016 £’000
Loss for the period attributable to equity holders of the parent
(10,111)
(20,813)
(80,859)
Other comprehensive income: Items that are or may be reclassified subsequently to profit or loss:
Exchange differences on translation of foreign operations (7,752) (211) (1,630)
Exchange differences on translation net investment in foreign operations 6,799 51 1,711
Change in fair value of assets classified as available for sale 898 1,265 (499) Total other comprehensive (expense) / income for the period, net of income tax (55) 1,105 (418) Total comprehensive expense the period attributable to equity holders of the parent
(10,166)
(19,708)
(81,277)

Condensed consolidated statement of financial position
At 31 October
2016 £’000
At 31 October 2015 £’000
At 30 April 2016 £’000
Non-current assets Intangible assets 40,724 45,826 42,679 Goodwill 48,773 59,834 48,773 Property, plant and equipment 66,817 76,413 69,752 Investment property - - 5,475 Investments (note 10) 5,414 17,743 4,626
Deferred tax 12,529 7,227 12,923
Corporation tax 1,243 1,050 889
Other debtors 3,976 2,771 3,238
179,476 210,864 188,355 Current assets Inventories 354 7,470 220
Trade and other receivables 35,906 38,175 24,421
Accrued Income 21,596 36,654 29,695
Corporation tax 1,211 631 952
Assets held for resale (note 9) 5,986 - 5,255
Cash and cash equivalents 9,425 7,907 5,820
74,478 90,837 66,363 Total assets 253,954 301,701 254,718 Current liabilities Trade and other payables (30,154) (43,941) (39,814)
Provisions (7,011) (520) (8,936)
Liabilities held for resale (note 9) (7,712) - (6,312)
Interest bearing loans and borrowings (4,102) (3,297) (38,789)
Corporation tax (1,454) (586) (1,480)
(50,433) (48,344) (95,331) Non-current liabilities Other payables (6,851) (3,425) (7,158)
Provisions (1,420) (500) (1,893)
Interest bearing loans and borrowings (46,165) (40,015) –
Deferred tax liability (11,876) (13,947) (12,912)
Corporation tax (5,933) (3,788) (4,583)
(72,245) (61,675) (26,546) Total liabilities (122,678) (110,019) (121,877)
Net assets 131,276 191,682 132,841
Equity Called up share capital 28,116 27,363 27,663
Share premium account 104,689 102,060 103,277
Other capital reserve 1,423 1,423 1,423
Merger reserve 2,402 2,402 2,402
Revaluation reserve 1,406 2,272 508
Translation reserve 123 835 1,076
Retained earnings (6,883) 55,327 (3,508)
Total equity attributable to equity holders of the parent 131,276 191,682 132,841
Condensed consolidated statement of changes in equity
Share capital £’000
Share premium account
£’000
Other capital
reserve £’000
Merger reserve
£’000
Revaluation reserve
£’000
Translation reserve
£’000
Retained earnings
£’000
Total equity £’000
At 1 May 2015 27,162 101,976 1,423 2,402 1,007 995 70,509 205,474 Loss for the period – – – – – – (20,813) (20,813) Other comprehensive income for the period
–
–
–
–
1,265
(160)
–
1,105
Share based remuneration – – – – – – 5,400 5,400 Deferred tax debit in respect of share-based incentives
–
–
–
–
–
–
417
417
Issue of shares for SIP 4 – – – – – (4)
–
Issue of shares at nil cost 182 – – – – – (182) – Issue of new shares 15 84 – – – – – 99 At 31 October 2015 27,363 102,060 1,423 2,402 2,272 835 55,327 191,682 At 1 May 2015 27,162 101,976 1,423 2,402 1,007 995 70,509 205,474 Loss for the period – – – – – – (80,859) (80,859)
Other comprehensive income for the year
–
–
–
–
(499)
81
–
(418)
Share based remuneration – – – – – – 7,750 7,750
Deferred tax credit in respect of share-based incentives
–
–
–
–
–
–
(487)
(487)
Issue of shares for SIP 101
– – – – – (101)
–
Issue of shares at nil cost 320
– – – – – (320)
–
Issue of new shares 80 1,301 – – – – – 1,381
At 30 April 2016 27,663 103,277 1,423 2,402 508 1,076 (3,508) 132,841
At 1 May 2016 27,663 103,277 1,423 2,402 508 1,076 (3,508) 132,841
Loss for the period – – – – – – (10,111) (10,111) Other comprehensive income for the period
–
–
–
–
898
(953)
–
(55)
Share based remuneration – – – – – – 7,112 7,112
Deferred tax credit in respect of share-based incentives
–
–
–
–
–
–
–
–
Issue of shares for SIP 6 – – – – – (6)
–
Issue of shares at nil cost 370 – – – – – (370) – Issue of new shares 77 1,412 – – – – – 1,489 At 31 October 2016 28,116 104,689 1,423 2,402 1,406 123 (6,883) 131,276
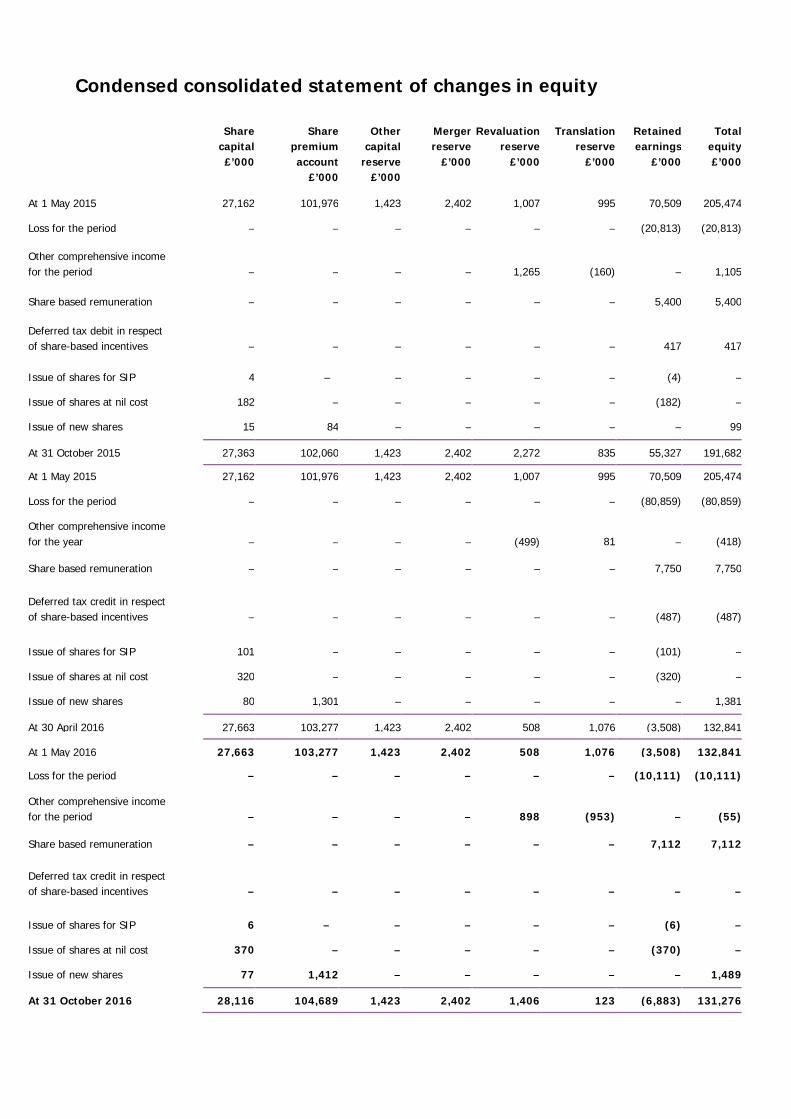
Condensed consolidated statement of cash flows
Half-year to 31 October
2016 £’000
Half-year to 31 October
2015 £’000
Year to 30 April
2016 £’000
Cash flows from operating activities Loss after tax (10,111) (20,813) (80,859)
Tax charge / (credit) 632 (1,851) (6,641)
Loss before tax (9,479) (22,664) (87,500) Adjustments for: Depreciation and amortisation and impairment 7,822 8,606 34,603
Loss on disposal of fixed assets – 295 293
Net financing expense 5,471 112 1,717
Share-based remuneration 7,112 5,400 7,750
Impairment of investments 2 4,854 11,387 Loss / gain on disposal of business units (424) - - Contingent acquisition consideration release – – (1,726) Exchange difference 969 251 2,030
Operating cash flows before movements in working capital 11,473 (3,146) (31,446) (Increase) / Decrease in inventories (1,091) 1,041 5,148 (Increase) / Decrease in receivables (4,614) 5,817 23,706 (Decrease) / Increase in payables (6,729) 1,940 19,297
Cash generated by operations (961) 5,652 16,705 Interest paid (856) (401) (835)
Taxes paid (1,285) (1,134) (3,025)
Net cash flows from operating activities (3,102) 4,117 12,845 Cash flows from investing activities Interest received 10 11 37 Acquisition of intangible assets (1,342) (1,817) (3,727) Acquisition of property, plant and equipment (1,380) (9,788) (17,270) Investments made in the year - (523) (523) Disposal of investments in the year 108 - 4,410 Disposal of business units 2,550 - -
Net cash used in investing activities (54) (12,117) (17,073) Cash flows from financing activities Proceeds from the issue of share capital 79 99 184 Draw down of facilities 9,000 20,000 30,000 Repayment of borrowings (1,711) (6,635) (22,298)
Net cash from financing activities 7,368 13,464 7,886 Net increase in cash and cash equivalents 4,212 5,464 3,658 Effect of exchange rate fluctuation (607) (208) (489) Cash and cash equivalents at the start of the period 5,820 2,651 2,651
Cash and cash equivalents at the end of the period 9,425 7,907 5,820 During the year, discontinued operations absorbed £10.5m of the group’s net operating cash flows, paid £0.0m in respect of investing activities and paid £0.0m in respect of financing activities. The disposal of Pure generated a £2.6m cash receipt.

Notes to the condensed consolidated half year financial report
1. Reporting entity
Imagination Technologies Group plc (the ‘Company’) is a company incorporated and domiciled in the United Kingdom. The Condensed Consolidated Half Year Financial Report of the Company as at and for the six months ended 31 October 2016 comprise the Company and its subsidiaries (together referred to as the ‘Group’). The Consolidated Financial Statements of the Group as at and for the year ended 30 April 2016, are available upon request from the Company’s registered office at Imagination House, Home Park Estate, Kings Langley, Hertfordshire WD4 8LZ. An electronic version is available from the Investors section of the Group website at www.imgtec.com.
2. Statement of compliance
This Condensed Consolidated Half Year Financial Report has been prepared in accordance with IAS 34: Interim Financial Reporting as endorsed and adopted for use in the European Union and the Disclosure and Transparency Rules (DTR). Selected explanatory notes are included to explain events and transactions that are material to an understanding of the changes in financial position and performance of the Group since the last annual Consolidated Financial Statements as at and for the year ended 30 April 2016. This Condensed Consolidated Half Year Financial Report does not include all of the information required for full annual Financial Statements prepared in accordance with International Financial Reporting Standards.
3. Significant accounting policies
This Condensed Consolidated Half Year Financial Report has been prepared on the basis of accounting policies and presentation consistent with those applied in the Consolidated Financial Statements for the year ended 30 April 2016, except as noted below, and has been reviewed in accordance with ‘International Standard on Review Engagements (UK and Ireland) 2410: Review of Interim Financial Information Performed by the Independent Auditor of the Entity’, issued by the Auditing Practices Board for use in the UK. The following additional accounting standards, amendments, and interpretations have been adopted in the period:
• Clarification of Acceptable Methods of Depreciation and Amortization – Amendments to IAS 16 and IAS 38
• Equity Method in Separate Financial Statements – Amendments to IAS27
• Annual Improvements to IFRSs – 2012-2014 Cycle • 2016 Disclosure Initiative – Amendments to IAS 1
Adopted IFRS not yet applied The following accounting standards, amendments and interpretations had been issued but they are not yet effective for the Group and have not been early adopted. Their adoption is not expected to have a material effect on the financial statements:
• Recognition of Deferred Tax Assets for Unrealised Losses – Amendments to IAS 12 (effective for periods commencing after 1 January 2017)
• Disclosure Initiative – Amendments to IAS 7 (effective for periods commencing after 1 January 2017)
• IFRS 15 Revenue from Contracts with Customers (effective for periods commencing after 1 January 2018)
• IFRS 9 Financial Instruments (effective for periods commencing after 1 January 2018) • IFRS 16 Leases (effective for periods commencing after 1 January 2019)

4. Risks and uncertainties
The Board continuously assesses and monitors the key risks of the business. Despite the current uncertainty in the global economy, the key risks that could affect the Group’s medium term performance, and the factors which mitigate these risks, have not significantly changed from those set out in the Group’s Annual Report for 2016, a copy of which is available from our website www.imgtec.com. The financial and business review includes consideration of uncertainties affecting the Group in both the short and medium term. The Board regularly reviews forecasts, including forecasts adjusted for significantly worse economic conditions than currently expected, and as a prudent measure has recently agreed with HSBC, temporary increases to both its revolving credit facility and leverage covenants. The Board remains satisfied with the Group’s funding and liquidity position. On the basis of its forecasts, both base case and stressed, and available facilities, the Board has concluded that the going concern basis of preparation continues to be appropriate.
5. Estimates
The preparation of interim financial statements requires management to make judgements, estimates and assumptions that affect the application of accounting policies and the reported amounts of assets and liabilities, income and expense. Actual results may differ from these estimates. In preparing this Condensed Consolidated Half Year Financial Report, the nature of the significant judgements made by management in applying the Group’s accounting policies and the key sources of estimation were the same as those that were applied to the Consolidated Financial Statements as at and for the year ended 30 April 2016.
6. Operating segments
The Group determines and presents operating segments based on the way that financial information is presented to the Board of Directors, which is the Group’s chief operating decision maker. During the prior year, the Group sub divided the Technology segment into five smaller segments or business units (BUs) – PowerVR, MIPS, Ensgima, IMGworks and IMG Systems. Whilst these BUs are similar in that they all develop technologies for licensing to semi-conductor companies for incorporation into silicon devices, they offer different technologies and in the case of IMGworks a design service and are managed separately. The Pure business unit remained a separate business unit, the same as it was in previous years. The costs of the corporate functions of the Group are, where possible, and using the most appropriate basis, allocated to each business unit. There is no inter-segment trading and no significant seasonality in the Group’s operations although there is typically an increase in revenues in the period leading up to Christmas. Information regarding the operations of each reportable segment is included below. Performance is measured based on adjusted EBIT as shown in the second table for each of the three reporting periods shown. Note that during the prior year, the Group decided to offer for sale, the business and assets of the Pure and IMG Systems BUs. During the current year the Group decided to offer for sale the business and assets of the IMG Works BU – therefore the performance of these three BUs are included below as Discontinued operations.
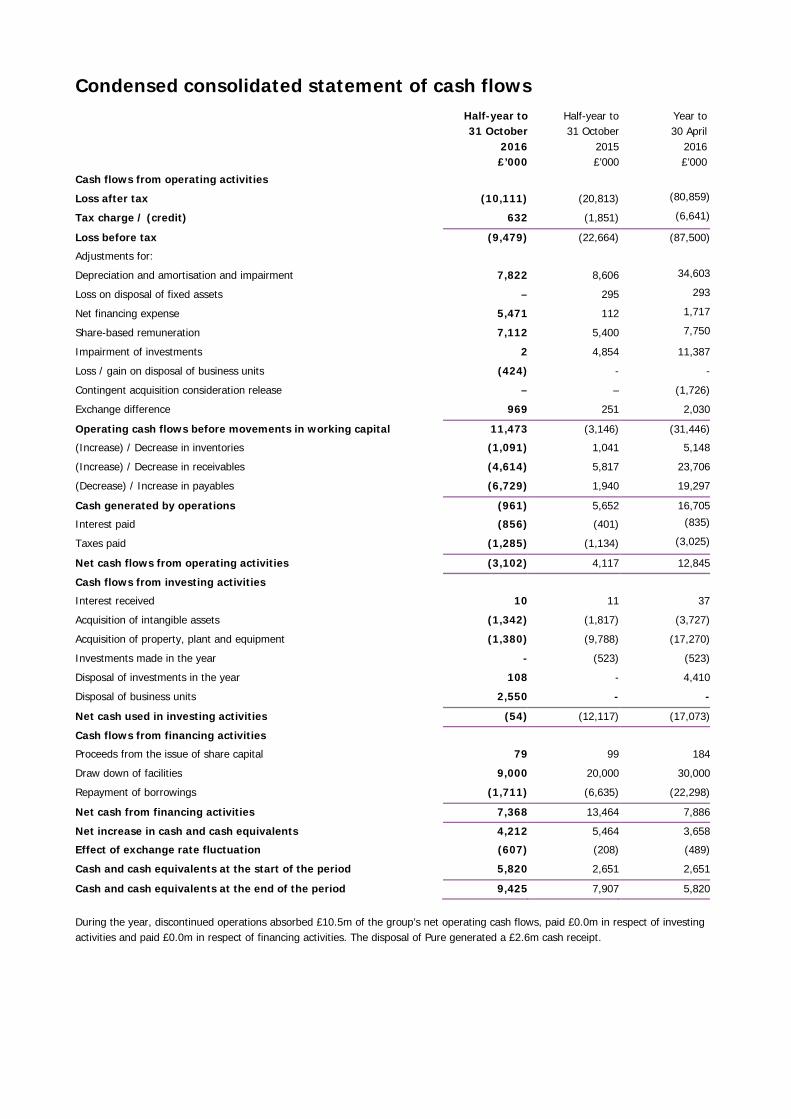
Six months ended 31 October 2016
TOTAL CONTINUING DISCONTINUED PVR MIPS ENS CORP TOTAL CONT PURE IMGWKS IMGSYST TOTAL DISC 2016 2016 2016 2016 2016 2016 2016 2016 2016 2016 £'000 £'000 £'000 £'000 £'000 £'000 £'000 £'000 £'000 £'000 Revenue Pure 6,059 0 6,059 6,059 Licensing 14,617 5,143 3,091 3,570 11,804 2,519 294 2,813 Royalties 52,690 38,153 13,503 844 52,500 190 190 Other 154 107 37 144 10 10 Total Revenue 73,520 43,296 16,701 4,414 37 64,448 6,059 2,519 494 9,072 Operating expenses Cost of sales (5,270) (123) (384) (66) (573) (4,406) (285) (6) (4,697) R&D (38,124) (16,395) (12,026) (4,499) 1,164 (31,756) (1,731) (3,799) (838) (6,368) SG&A incl in adj operating EBIT (22,375) (10,482) (5,054) (2,015) (2,374) (19,925) (435) (1,465) (550) (2,450) SG&A excl in adj operating EBIT - below (11,758) (2,749) (3,538) (1,341) (1,711) (9,339) (642) (1,267) (510) (2,419) Total operating expenses (77,527) (29,749) (21,002) (7,921) (2,921) (61,593) (7,214) (6,816) (1,904) (15,934) Operating profit / (loss) (4,007) 13,547 (4,301) (3,507) (2,884) 2,855 (1,155) (4,297) (1,410) (6,862) Net financing expense (5,471) (5,471) (5,471) 0 Profit / (loss) before tax (9,478) 13,547 (4,301) (3,507) (8,355) (2,616) (1,155) (4,297) (1,410) (6,862) Taxation (charge) / credit (633) (2,004) (2,004) 231 859 281 1,371 Profit / (loss) for the year (10,111) 13,547 (4,301) (3,507) (10,359) (4,620) (924) (3,438) (1,129) (5,491)

Adjusted EBIT CONTINUING DISCONTINUED TOTAL PVR MIPS ENS CORP TOTAL CONT PURE IMGWKS IMGSYST TOTAL DISC 2016 2016 2016 2016 2016 2016 2016 2016 2016 2016 £'000 £'000 £'000 £'000 £'000 £'000 £'000 £'000 £'000 £'000 Reported operating profit / (loss) - (from above) (4,007) 13,547 (4,301) (3,507) (2,884) 2,855 (1,155) (4,297) (1,410) (6,862) Share based payments 7,111 2,762 1,107 754 1,250 5,873 234 691 313 1,238 Amortisation of intangibles from acquisitions 3,018 0 2,431 587 0 3,018 0 0 0 0 Acquisition related costs (925) 0 0 0 (925) (925) 0 0 0 0 Gain / (loss) on investments 1 0 0 0 1 1 0 0 0 0 Gain / (loss) on disposal of businesses 870 0 0 0 0 0 559 0 311 870 Corporate restructuring costs 117 (13) 0 0 261 248 (135) 10 (6) (131) Provision for onerous contracts 628 0 0 0 62 62 0 566 0 566 Provision for onerous leases (16) 0 0 0 109 109 (17) 0 (108) (125) Impairment of tangible fixed assets 975 975 975 0 Dilapidations (22) 0 0 0 (22) (22) 0 0 0 0 Adjusted EBIT 7,750 16,296 (763) (2,166) (1,173) 12,194 (514) (3,030) (900) (4,444) Net financing expense (5,471) (5,471) (5,471) 0 Adjusted profit before tax 2,279 16,296 (763) (2,166) (6,644) 6,723 (514) (3,030) (900) (4,444)
Acquisition related costs relate largely to the historic acquisitions of Posedge and Kisel and include elements of deferred acquisition consideration which are required to be accounted for as compensation. The credit as at 31 October 2016 relates to the release of accrued contingent compensation which did not crystallise in the period.
The onerous contracts provision in April 2016 largely relates to three legacy IMGworks contracts being performed for customers. An onerous contract is one where the unavoidable costs of meeting the obligations under the contract exceed the economic benefits expected to be received under it. These provisions have been trued up during the current period leading to a futher £566,000 charge.
The £975,000 impairment of tangible fixed assets at October 2016 relates to Concept House. This property was reclassified as an investment property during the year ended April 2016 (when an impairment of £6,458,000 was made). In the current period it has been reclassified as an asset held for resale, and impaired down to its likely sales price.

Year ended 30 April 2016 (restated)
TOTAL CONTINUING DISCONTINUED
PVR MIPS ENS CORP TOTAL CONT PURE IMGWKS IMGSYST
TOTAL DISC
2016 2016 2016 2016 2016 2016 2016 2016 2016 2016
£'000 £'000 £'000 £'000 £'000 £'000 £'000 £'000 £'000 £'000
Revenue
Pure
18,819
18,819
18,819
Licensing
18,573 10,156 6,439 2,025 0 18,620
(1,549) 1,502 (47) Royalties
103,626 77,708 23,473 1,499 0 102,680
946 946
Other
356
213
40 253
103 103
Total Revenue
141,374 87,864 30,125 3,524 40 121,553 18,819 (1,549) 2,551 19,821
Operating expenses
Cost of sales
(18,935) 30 (742) 42
(670) (17,967) (109) (189) (18,265)
R&D
(89,802) (30,979) (22,126) (9,306)
(62,411) (6,843) (16,239) (4,309) (27,391) SG&A incl in adj EBIT
(57,117) (25,955) (12,253) (5,955) (3,790) (47,953) (1,756) (4,732) (2,676) (9,164)
SG&A excl in adj EBIT - below (60,389) (3,429) (6,693) (2,297) (24,867) (37,286) (1,113) (7,679) (14,311) (23,103)
Total operating expenses
(226,243) (60,333) (41,814) (17,516) (28,657) (148,320) (27,679) (28,759) (21,485) (77,923)
Operating profit / (loss)
(84,869) 27,531 (11,689) (13,992) (28,617) (26,767) (8,860) (30,308) (18,934) (58,102)
Net financing expense
(2,630)
(2,630) (2,630)
0
Profit / (loss) before tax
(87,499) 27,531 (11,689) (13,992) (31,247) (29,397) (8,860) (30,308) (18,934) (58,102)
Taxation (charge) / credit
6,641
3,294 3,294 1,772
1,574 3,346
Profit / (loss) for the year
(80,859) 27,531 (11,689) (13,992) (27,953) (26,103) (7,088) (30,308) (17,360) (54,756)

Adjusted EBIT
TOTAL CONTINUING DISCONTINUED
PVR MIPS ENS CORP TOTAL CONT PURE IMGWKS IMGSYST TOTAL DISC
2016 2016 2016 2016 2016 2016 2016 2016 2016 2016
£'000 £'000 £'000 £'000 £'000 £'000 £'000 £'000 £'000 £'000
Reported operating profit / (loss) - (from above) (84,869) 27,531 (11,689) (13,992) (28,617) (26,767) (8,860) (30,308) (18,934) (58,102)
Share based payments
7,750 2,667 980 802 1,312 5,761 370 975 644 1,989 Amortisation of intangibles from acquisitions 8,712 622 4,863 1,420
6,905
1,807 1,807
Acquisition related costs
1,125
1,125 1,125
0 Gain / (loss) on investments
11,387
11,387 11,387
0
Corporate restructuring costs
6,591 140 595 75 3,716 4,526 743 522 800 2,065 Provision for onerous contracts
6,735 0 256 0 297 553 0 6,182 0 6,182
Provision for onerous leases
1,907
1,907 1,907
0 Impairment of goodwill
11,061
0
11,061 11,061
Impairment of tangible fixed assets
6,851
6,851 6,851
0 Contingent acquisition consideration release (1,726)
(1,726) (1,726)
0
Release of contract obligations
0
0 0
0
Adjusted EBIT
(24,476) 30,960 (4,995) (11,695) (3,748) 10,522 (7,747) (22,629) (4,622) (34,998)
Net financing expense
(2,630)
(2,630) (2,630)
0
Adjusted profit before tax
(27,106) 30,960 (4,995) (11,695) (6,378) 7,892 (7,747) (22,629) (4,622) (34,998)

Six months ended 31 October 2015 (restated)
TOTAL CONTINUING DISCONTINUED PVR MIPS ENS CORP TOTAL CONT PURE IMGWKS IMGSYST TOTAL DISC 2015 2015 2015 2015 2015 2015 2015 2015 2015 2015 £'000 £'000 £'000 £'000 £'000 £'000 £'000 £'000 £'000 £'000 Revenue Pure 8,424 0 8,424 8,424 Licensing 12,645 6,673 3,376 989 0 11,038 601 1,006 1,607 Royalties 49,837 37,520 11,245 800 0 49,565 0 272 272 Other 243 0 119 0 40 159 0 84 84 Total Revenue 71,149 44,193 14,740 1,789 40 60,762 8,424 601 1,362 10,387 Operating expenses Cost of sales (7,623) (6) (275) (20) 0 (301) (7,021) (151) (150) (7,322) R&D (43,733) (15,114) (10,781) (4,441) 0 (30,336) (3,427) (7,822) (2,148) (13,397) SG&A incl in adj EBIT (26,950) (12,347) (6,030) (2,816) (1,566) (22,759) (790) (2,185) (1,216) (4,191) SG&A excl in adj EBIT - below (15,241) (2,238) (3,158) (1,339) (6,147) (12,882) (316) (691) (1,352) (2,359) Total operating expenses (93,547) (29,705) (20,244) (8,616) (7,713) (66,278) (11,554) (10,849) (4,866) (27,269) Operating profit / (loss) (22,398) 14,488 (5,504) (6,827) (7,673) (5,516) (3,130) (10,248) (3,504) (16,882) Net financing expense (263) (263) (263) 0 Profit / (loss) before tax (22,661) 14,488 (5,504) (6,827) (7,936) (5,779) (3,130) (10,248) (3,504) (16,882) Taxation (charge) / credit 1,848 (1,526) (1,526) 626 2,048 700 3,374 Profit / (loss) for the year (20,813) 14,488 (5,504) (6,827) (9,462) (7,305) (2,504) (8,200) (2,804) (13,508)

Adjusted EBIT CONTINUING DISCONTINUED TOTAL PVR MIPS ENS CORP TOTAL CONT PURE IMGWKS IMGSYST TOTAL DISC 2015 2015 2015 2015 2015 2015 2015 2015 2015 2015 £'000 £'000 £'000 £'000 £'000 £'000 £'000 £'000 £'000 £'000 Reported operating profit / (loss) - (from above) (22,398) 14,488 (5,504) (6,827) (7,673) (5,516) (3,130) (10,248) (3,504) (16,882) Share based payments 5,400 1,720 726 568 918 3,932 316 691 461 1,468 Amortisation of intangibles from acquisitions 4,560 466 2,432 771 3,669 891 891 Acquisition related costs 376 376 376 0 Gain / (loss) on investments 4,852 4,852 4,852 0 Corporate restructuring costs 52 52 52 0 Adjusted EBIT (7,158) 16,726 (2,346) (5,488) (1,527) 7,365 (2,814) (9,557) (2,152) (14,523) Net financing expense (263) (263) (263) 0 Adjusted profit before tax (7,421) 16,726 (2,346) (5,488) (1,790) 7,102 (2,814) (9,557) (2,152) (14,523)

Total group revenue is reported by geographical area of sales as follows:
At 31 October 2016 £’000
At 31 October 2015 £’000
At 30 April 2016 £’000
USA 47,104 45,941 92,465 Asia 12,956 13,680 30,012 United Kingdom 4,836 7,015 14,186 Rest of Europe 6,973 3,205 3,722 Rest of North America 1,240 1,074 2,164 Rest of the world 411 233 (1,175) 73,520 71,148 141,374 The basis for attributing external customers to individual countries is the customer’s country of domicile. Revenue from an individual customer representing more than 10% of the Group’s total revenue for the period has the value of approximately £31,364,000 (2015: £29,406,000). The customer’s country of domicile is USA, and the revenues are included in the PVR division (2015: USA domiciled and within the PVR division).
7. Taxation
Income tax expense is recognised based on management’s best estimate of the weighted average annual income tax rate expected for the full financial year applied to the pre-tax income of the interim period. There was a net tax charge in the period of £632,000 (2015: tax credit £1,851,000). The tax charge for the interim period includes a current tax charge of £1,252,000 (2015: £1,135,000) which largely relates to foreign withholding tax suffered on receipts from customers; and a deferred tax credit of £620,000 (2015: £2,986,000) arising due to the release of the deferred tax liability created when acquiring the intangible assets of MIPS Technologies Inc in 2013. A rate of 17% has been used to estimate the expected reversal of deferred tax balances, and has been reflected in reporting deferred tax assets and liabilities on the balance sheet as at 31 October 2016.

8. Earnings per share From continuing and discontinuing operations
Half-year to 31 October
2016
Half-year to 31 October
2015
Year to 30 April
2016
(Loss) / profit attributable to shareholders (£10,111,000) (£20,813,000) (£80,859,000) Weighted average number of shares in issue 278.6m 272.6m 273.6m Less: Weighted average number of shares held by Employee Benefit Trust (1.9)m (2.0)m (1.9)m Effect of dilutive shares: Employee incentive schemes 13.0m 14.6m 15.3m
Weighted average number of shares potentially in issue 289.7m 285.2m 287.0m (Loss) / Earnings per share Basic (3.7)p (7.7)p (29.8)p Diluted (3.7)p (7.7)p (29.8)p
From continuing operations
Half-year to 31 October
2016
Half-year to 31 October
2015
Year to 30 April
2016
(Loss) / profit attributable to shareholders (£4,620,000) (£7,305,000) (£26,103,000) Weighted average number of shares in issue 278.6m 272.6m 273.6m Less: Weighted average number of shares held by Employee Benefit Trust (1.9)m (2.0)m (1.9)m Effect of dilutive shares: Employee incentive schemes 13.0m 14.6m 15.3m
Weighted average number of shares potentially in issue 289.7m 285.2m 287.0m (Loss) / Earnings per share Basic (1.7)p (2.7)p (9.6)p Diluted (1.7)p (2.7)p (9.6)p
From discontinuing operations
Half-year to 31 October
2016
Half-year to 31 October
2015
Year to 30 April
2016
(Loss) / profit attributable to shareholders (£5,491,000) (£13,508,000) (£54,756,000) Weighted average number of shares in issue 278.6m 272.6m 273.6m Less: Weighted average number of shares held by Employee Benefit Trust (1.9)m (2.0)m (1.9)m Effect of dilutive shares: Employee incentive schemes 13.0m 14.6m 15.3m
Weighted average number of shares potentially in issue 289.7m 285.2m 287.0m (Loss) / Earnings per share Basic (2.0)p (5.0)p (20.2)p Diluted (2.0)p (5.0)p (20.2)p

Adjusted earnings per share
From continuing and discontinuing operations
Half-year to 31 October
2016
Half-year to 31 October
2015
Year to 30 April
2016
Adjusted profit / (loss) before tax – note 6 £2,279,000 (£7,421,000) (£27,106,000) Taxation (charge) / credit (£2,021,000) £404,000 £1,987,000 Adjusted profit / (loss) attributable to equity holders of the parent £258,000 (£7,017,000) (£25,119,000) Weighted average number of shares in issue 278.6m 272.6m 273.6m Less: Weighted average number of shares held by Employee Benefit Trust (1.9)m (2.0)m (1.9)m Effect of dilutive shares: Employee incentive schemes 13.0m 14.6m 15.3m Weighted average number of shares potentially in issue 289.7m 285.2m 287.0m Adjusted earnings / (loss) per share Basic 0.1p (2.6)p (9.2)p Diluted 0.1p (2.6)p (9.2)p
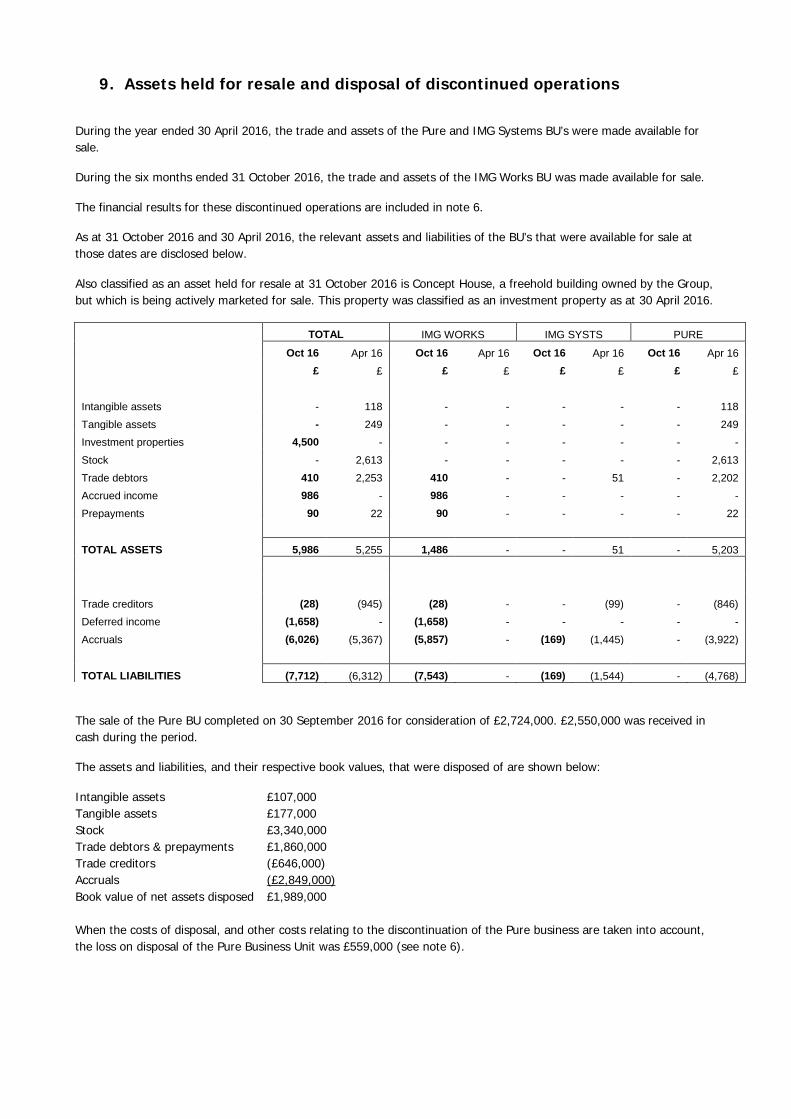
9. Assets held for resale and disposal of discontinued operations
During the year ended 30 April 2016, the trade and assets of the Pure and IMG Systems BU’s were made available for sale.
During the six months ended 31 October 2016, the trade and assets of the IMG Works BU was made available for sale.
The financial results for these discontinued operations are included in note 6.
As at 31 October 2016 and 30 April 2016, the relevant assets and liabilities of the BU’s that were available for sale at those dates are disclosed below.
Also classified as an asset held for resale at 31 October 2016 is Concept House, a freehold building owned by the Group, but which is being actively marketed for sale. This property was classified as an investment property as at 30 April 2016.
TOTAL IMG WORKS IMG SYSTS PURE
Oct 16 Apr 16 Oct 16 Apr 16 Oct 16 Apr 16 Oct 16 Apr 16 £ £ £ £ £ £ £ £
Intangible assets - 118 - - - - - 118 Tangible assets - 249 - - - - - 249 Investment properties 4,500 - - - - - - - Stock - 2,613 - - - - - 2,613 Trade debtors 410 2,253 410 - - 51 - 2,202 Accrued income 986 - 986 - - - - - Prepayments 90 22 90 - - - - 22
TOTAL ASSETS 5,986 5,255 1,486 - - 51 - 5,203
Trade creditors (28) (945) (28) - - (99) - (846) Deferred income (1,658) - (1,658) - - - - - Accruals (6,026) (5,367) (5,857) - (169) (1,445) - (3,922)
TOTAL LIABILITIES (7,712) (6,312) (7,543) - (169) (1,544) - (4,768)
The sale of the Pure BU completed on 30 September 2016 for consideration of £2,724,000. £2,550,000 was received in cash during the period.
The assets and liabilities, and their respective book values, that were disposed of are shown below:
Intangible assets £107,000 Tangible assets £177,000 Stock £3,340,000 Trade debtors & prepayments £1,860,000 Trade creditors (£646,000) Accruals (£2,849,000) Book value of net assets disposed £1,989,000 When the costs of disposal, and other costs relating to the discontinuation of the Pure business are taken into account, the loss on disposal of the Pure Business Unit was £559,000 (see note 6).

10. Financial Instruments
Offsetting As at 31 October 2016 the outstanding currency contracts amounted to £0 (2015: £24,034,000). The fair value of these outstanding currency contracts was a £0 net asset/liability (2015: £126,000 net asset). The movement in fair value since 30 April 2016 of £235,000 has been recognized within finance expense in the period. Fair values of financial instruments Fair value is defined as the amount at which a financial instrument could be exchanged in an arm’s length transaction between two informed and willing parties and is calculated by reference to market rates discounted to current value.
Half-year to 31 October
2016 £’000
Half-year to 31 October
2015 £’000
Year to 30 April
2016 £’000
Financial assets: Trade and other receivables 35,906 32,513 23,726
Cash and cash equivalents 9,425 7,907 5,820
Assets held for sale 5,986 - 5,255
Available for sale investments 5,414 17,743 4,626
Financial liabilities:
Borrowings (50,267) (43,312) (38,789)
Trade and other payables (37,165) (17,277) (25,376)
Liabilities held for sale (7,712) - (6,312)
Non current payables (8,271) (3,702) (5,427)
Fair value hierarchy The Group measures the fair value of available for sale investments using the following hierarchy that reflects the significance of the inputs used in making the measurement: Level 1: Quoted market price (unadjusted) in an active market for an identical financial instrument. Level 2: Valuation techniques based on observable inputs, such as market prices for similar financial instruments. Level 3: Valuation techniques using unobservable inputs which can have a significant effect on the instrument’s valuation. The Group has applied the above hierarchy to its investments as follows: NetSpeed – the valuation is based on the purchase price of the investment which was acquired during the year. This investment is categorized as Level 3. Atomos – the valuation is based on the purchase price of the investment. This investment is categorized as Level 3. The following table analyses investments, measured at fair value at the reporting date, by the level in the fair value hierarchy into which the fair value measurement is categorized:

Half-year to 31 October
2016 £’000
Half-year to 31 October
2015 £’000
Year to 30 April
2016 £’000
Level 1 – 6,261 109
Level 2 – – –
Level 3 5,414 11,482 4,517
5,414 17,743 4,626 The following table shows a reconciliation from opening balances to the closing balances for fair value measurements in Level 3 of the fair value hierarchy:
Half-year to
31 October 2016 £’000
At 30 April 2016 4,517 Investment in the year – Total gains and losses:
In income statement – In other comprehensive income 897
At 31 October 2016 5,414 NetSpeed – At the balance sheet date a gain of £217,000 arose due to foreign exchange movements and this has been recognised in the consolidated statement of comprehensive income. Atomos – At the balance sheet date a gain of £680,000 arose due to foreign exchange movements and this has been recognised in the consolidated statement of comprehensive income.
11. Related Parties
The nature of related parties as disclosed in the Consolidated Financial Statements for the Group as at and for the year ended 30 April 2016 has not changed. Furthermore, there have been no significant related party transactions in the six month period ended 31 October 2016.
12. Approval
The Condensed Consolidated Half Year Financial Report was approved by the Board on 6 December 2016.
Responsibility statement of the directors in respect of the half-yearly financial report This Half Year Management report is the responsibility of, and has been approved by the directors of Imagination Technologies Group plc. Accordingly, the directors confirm that to the best of their knowledge: • the condensed set of financial statements has been prepared in accordance with IAS 34: Interim Financial Reporting as adopted by the EU;
• the interim management report includes a fair review of the information required by: (a) DTR 4.2.7R of the Disclosure and Transparency Rules, being an indication of important events that
have occurred during the first six months of the financial year and their impact on the condensed set of financial statements; and a description of the principal risks and uncertainties for the remaining six months of the year; and
(b) DTR 4.2.8R of the Disclosure and Transparency Rules, being related party transactions that have taken
place in the first six months of the current financial year and that have materially affected the financial position or performance of the entity during that period; and any changes in the related party transactions described in the last annual report that could do so.
By order of the Board Bert Nordberg Chairman 6 December 2016

Draft 7
Independent review report to Imagination Technologies Group plc Introduction We have been engaged by the company to review the condensed set of financial statements in the half-yearly financial report for the six months ended 31 October 2016 which comprises condensed consolidated income statement, condensed consolidated balance sheet, condensed consolidated statement of comprehensive income, condensed consolidated statement of changes in equity, condensed consolidated cash flow statement and the related explanatory notes. We have read the other information contained in the half-yearly financial report and considered whether it contains any apparent misstatements or material inconsistencies with the information in the condensed set of financial statements. This report is made solely to the company in accordance with the terms of our engagement to assist the company in meeting the requirements of the Disclosure and Transparency Rules (“the DTR”) of the UK’s Financial Conduct Authority (“the UK FCA”). Our review has been undertaken so that we might state to the company those matters we are required to state to it in this report and for no other purpose. To the fullest extent permitted by law, we do not accept or assume responsibility to anyone other than the company for our review work, for this report, or for the conclusions we have reached. Directors’ responsibilities The half-yearly financial report is the responsibility of, and has been approved by, the directors. The directors are responsible for preparing the half-yearly financial report in accordance with the DTR of the UK FCA. As disclosed in note 3, the annual financial statements of the group are prepared in accordance with IFRSs as adopted by the EU. The condensed set of financial statements included in this half-yearly financial report has been prepared in accordance with IAS 34 Interim Financial Reporting as adopted by the EU. Our responsibility Our responsibility is to express to the company a conclusion on the condensed set of financial statements in the half-yearly financial report based on our review. Scope of review We conducted our review in accordance with International Standard on Review Engagements (UK and Ireland) 2410 Review of Interim Financial Information Performed by the Independent Auditor of the Entity issued by the Auditing Practices Board for use in the UK. A review of interim financial information consists of making enquiries, primarily of persons responsible for financial and accounting matters, and applying analytical and other review procedures. A review is substantially less in scope than an audit conducted in accordance with International Standards on Auditing (UK and Ireland) and consequently does not enable us to obtain assurance that we would become aware of all significant matters that might be identified in an audit. Accordingly, we do not express an audit opinion. Conclusion Based on our review, nothing has come to our attention that causes us to believe that the condensed set of financial statements in the half-yearly financial report for the six months ended 31 October 2016 is not prepared, in all material respects, in accordance with IAS 34 as adopted by the EU and the DTR of the UK FCA. John Bennett Senior Statutory Auditor for and on behalf of KPMG LLP Statutory Auditor Chartered Accountants 15 Canada Square London E14 5GL 6 December 2016