Embed Size (px)
Citation preview

Ilsue RohIlsue Roh
DCs’ IT Development and DCs’ IT Development and Remaining Challenges Remaining Challenges
10/10/2011 10/10/2011

2
ContentsContents
1. Korean IT Development Path
2. Success Factors of Korean IT Industry
3. Global IT Development Issues
4. Implementation of Policy Initiatives
ICT Development issues in Developing CountriesICT Development issues in Developing Countries

3
I. Korean IT Development I. Korean IT Development
PathPath
I. Korean IT Development I. Korean IT Development
PathPath

4
1. GDP Per Capita & Economic Growth
GDP ($)
5 Year Plan ofEconomic Development
5 Year Plan ofEconomic Development
67 U$67 U$
12,19612,196
1953
10,000
87 U$87 U$
1962
5,000
1996 1997
7,3557,355
2007
20,04520,045
1995
11,47111,471
Asian Financial Crisis
Asian Financial Crisis
1970 1980 2005
16,29116,291
20,000
2010
Export of 100 B. U$(87)Export of 100 B. U$(87)
Political Transition(88)Political Transition(88)
1987
GlobalFinancial Crisis
GlobalFinancial Crisis
IT Export of 100 B. U$(05)IT Export of 100 B. U$(05)

5
2. Growth Pattern of the Korean Economy
□ The Stage of Growth by innovation
- Labor oriented growth stage(1960 ~1970) :
- Capital oriented growth stage(1970 ~ 1990) :
- Innovation oriented growth stage(2000 ~ ) :
high tech. + Innovation
Years for Transition
UK 200 years
Japan 100 years
Korea 30 ~40 years
China 30 years
Natural Resources Based Economy ?
6
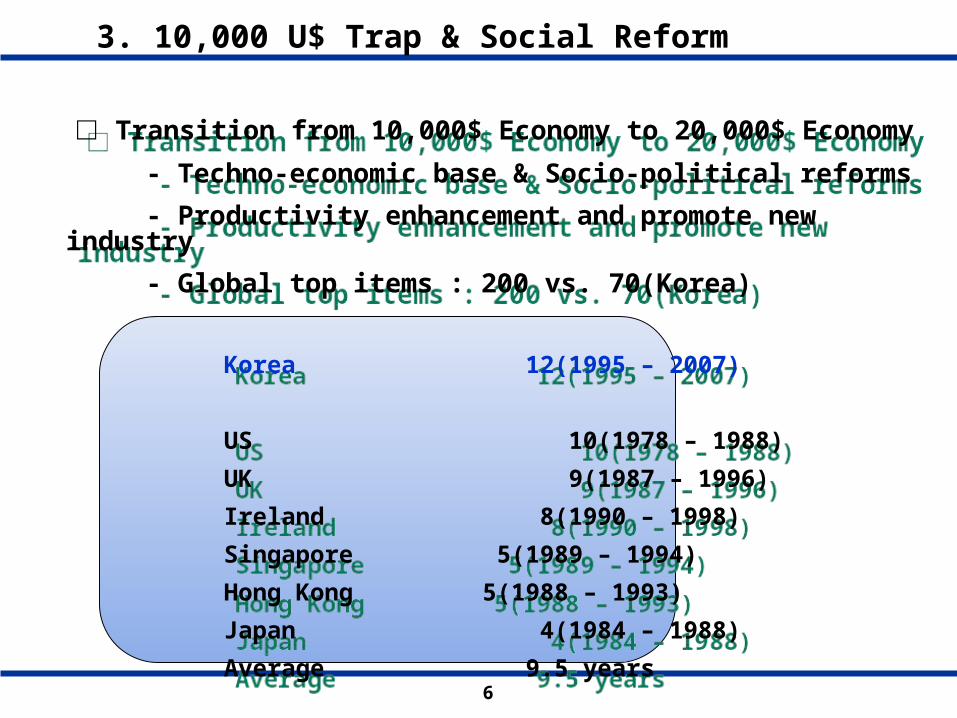
3. 10,000 U$ Trap & Social Reform
□ Transition from 10,000$ Economy to 20,000$ Economy
- Techno-economic base & Socio-political reforms
- Productivity enhancement and promote new industry
- Global top items : 200 vs. 70(Korea)
Korea 12(1995 – 2007)
US 10(1978 – 1988)
UK 9(1987 – 1996)
Ireland 8(1990 – 1998)
Singapore 5(1989 – 1994)
Hong Kong 5(1988 – 1993)
Japan 4(1984 – 1988)
Average 9.5 years
7
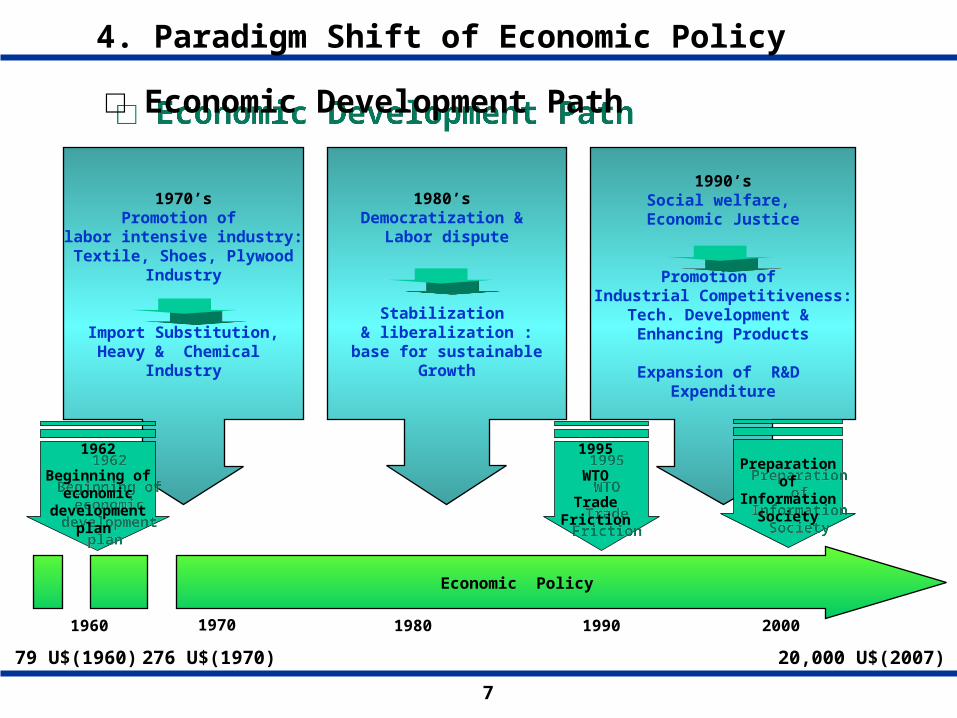
4. Paradigm Shift of Economic Policy
□ Economic Development Path □ Economic Development Path
Economic Policy
1970 1990 20001960
1970’sPromotion of
labor intensive industry:Textile, Shoes, Plywood
Industry
Import Substitution,Heavy & Chemical
Industry
1990’sSocial welfare,
Economic Justice
Promotion of Industrial Competitiveness:
Tech. Development & Enhancing Products
Expansion of R&D Expenditure
1980’s Democratization &
Labor dispute
Stabilization & liberalization :
base for sustainable Growth
1962
Beginning of economic
development plan
1962
Beginning of economic
development plan
1995
WTO
Trade Friction
1995
WTO
Trade Friction
276 U$(1970) 20,000 U$(2007)79 U$(1960)
Preparation of
Information Society
Preparation of
Information Society
1980

8
5. Paradigm Shift of Industry Policy
□ Industry Policy Drives to Innovation Drives □ Industry Policy Drives to Innovation Drives
Export-based Industry Policy
1980 1990 20001960
1970’s
Heavy & Chemical Industry
(Steel, Chemical, Machinery, Shipbuilding)
Mid 1990’s~
IT Industry
(DRAM(83), TDX(86),CDMA(96), LCD(97))
1980’s ~early 1990’s
Assembly &Processing Industry
(Electronics, Shipbuilding Automobile)
10 Mil. Mobile Phone Sub.(1998)1 Phone/ 1 House (1988)
Government Export Drive Private sector initiative
1970
9
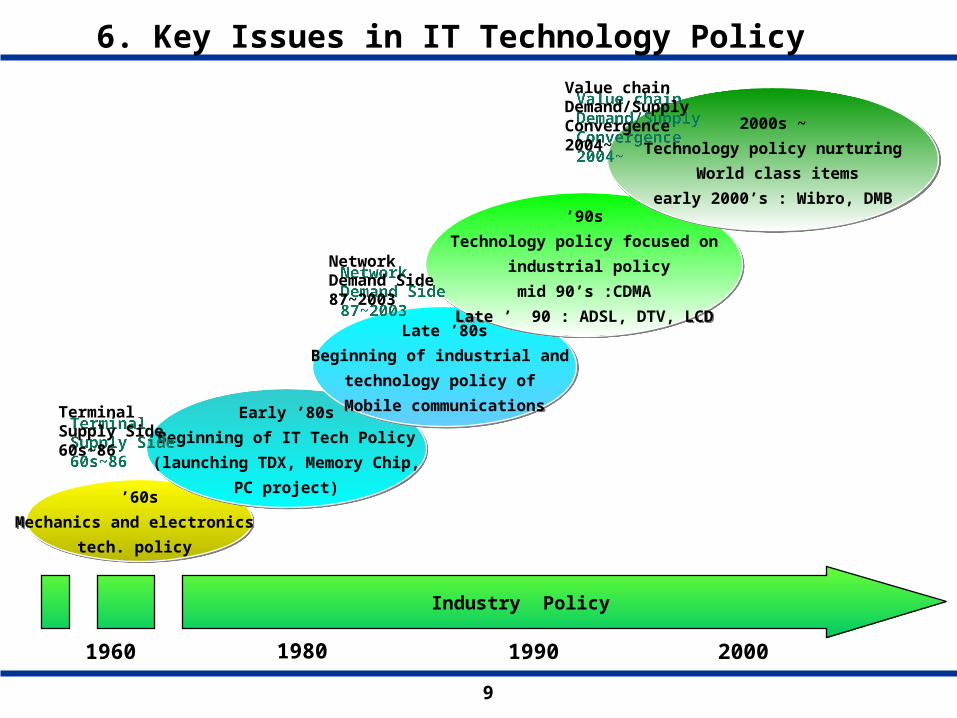
’60s
Mechanics and electronics
tech. policy
’60s
Mechanics and electronics
tech. policy
Early ’80s
Beginning of IT Tech Policy
(launching TDX, Memory Chip,
PC project)
Early ’80s
Beginning of IT Tech Policy
(launching TDX, Memory Chip,
PC project)
Late ’80s
Beginning of industrial and
technology policy of
Mobile communications
Late ’80s
Beginning of industrial and
technology policy of
Mobile communications
’90s
Technology policy focused on
industrial policy
mid 90’s :CDMA
Late ’ 90 : ADSL, DTV, LCD
’90s
Technology policy focused on
industrial policy
mid 90’s :CDMA
Late ’ 90 : ADSL, DTV, LCD
Industry Policy
1980 1990 20001960
2000s ~
Technology policy nurturing
World class items
early 2000’s : Wibro, DMB
2000s ~
Technology policy nurturing
World class items
early 2000’s : Wibro, DMB
6. Key Issues in IT Technology Policy
TerminalSupply Side60s~86
TerminalSupply Side60s~86
NetworkDemand Side87~2003
NetworkDemand Side87~2003
Value chainDemand/Supply Convergence2004~
Value chainDemand/Supply Convergence2004~

10
7. Industrial Portfolio in 1980s
Growth
Profit
○ Automobile○ Automobile
○ Machinery○ Machinery
○ Electronics○ Electronics
○ Shipbuilding○ Shipbuilding
○ Construction○ Construction○ Textile
○ Textile
○ Chemical○ Chemical
○ Steel○ Steel
○ Precision Equipment
○ Precision Equipment ○ Precision
Chemistry
○ Precision Chemistry
Source : kang, Y. J. , KER, 2000
○ Leisure○ Leisure
AverageAverage

11
8. Industrial Portfolio in 1990s
Growth
Profit
○ Automobile○ Automobile
○ Machinery○ Machinery
○ Electronics○ Electronics
○ Shipbuilding○ Shipbuilding
○ Construction○ Construction
○ Textile○ Textile
○ Chemical○ Chemical
○ Steel○ Steel ○ Precision
Equipment
○ Precision Equipment
○ Precision Chemistry
○ Precision Chemistry
Source : kang, Y. J., KER, 2000
○ Computer○ Computer
○ Semi-Conductor○ Semi-Conductor
○ Leisure○ Leisure
AverageAverage
○ Business Service○ Business Service

12
9. Industrial Portfolio in 2000
Growth
Profit
○ Automobile○ Automobile
○ Machinery○ Machinery ○ Electronics
○ Electronics
○ Shipbuilding○ Shipbuilding
○ Construction○ Construction
○ Textile○ Textile
○ Chemical○ Chemical
○ Steel○ Steel
○ Precision Equipment○ Precision Equipment
○ Precision Chemistry ○ Precision Chemistry
Source : kang, Y. J., KER, 2000
○ Computer○ Computer
○ Semi- Conductor
○ Semi- Conductor
○ Communications Services
○ Communications Services
○ Communications Equipment
○ Communications Equipment
○ Leisure○ Leisure
AverageAverage

13
10. Positioning Changes of IT Industry
Growth
ProfitSource : kang, Y. J., KER, 2000
○ Electronics(90)○ Electronics(90)
○ Computer(90)○ Computer(90)
○ Semi-Conductor(98)○ Semi-Conductor(98)
○ Communications Services(90)
○ Communications Services(90)
○ Communications Equipment(98)
○ Communications Equipment(98)
AverageAverage
○ Computer(98)○ Computer(98) ○ Semi-Conductor(90)
○ Semi-Conductor(90)○ Electronics(98)
○ Electronics(98)
○ Communications Services(98)
○ Communications Services(98)
14
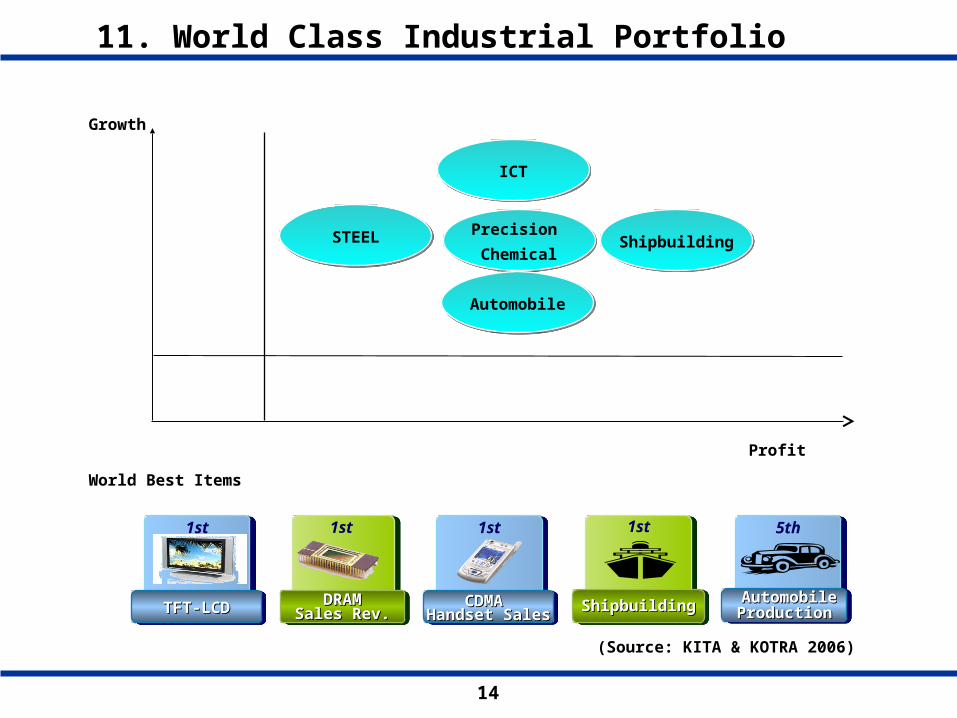
11. World Class Industrial Portfolio
Growth
Profit
STEELSTEEL
ICTICT
Precision
Chemical
Precision
Chemical
AutomobileAutomobile
ShipbuildingShipbuilding
DRAMDRAMSales Rev.Sales Rev.
DRAMDRAMSales Rev.Sales Rev.
1st
(Source: KITA & KOTRA 2006)
1st
CDMA CDMA Handset SalesHandset Sales
CDMA CDMA Handset SalesHandset Sales
Automobile Automobile ProductionProduction
Automobile Automobile ProductionProduction
5th
ShipbuildingShipbuildingShipbuildingShipbuilding
1st1st
TFT-LCDTFT-LCDTFT-LCDTFT-LCD
World Best Items

15
12. SWOT of Korean IT Industry
□ Strength : Mass Production, applied technology
Weakness : Source technology , S/W, global marketing
□ Strength : Mass Production, applied technology
Weakness : Source technology , S/W, global marketing
SS
○ CDMA & Mobile devices○ DTV, TFT-LCD○ STBox○ Semiconductor Tech.
○ CDMA & Mobile devices○ DTV, TFT-LCD○ STBox○ Semiconductor Tech.
WW
OO TT
○ Fiber, core tech. ○ S/W, Digital Contents○ Higher IT HR○ Product Planning & Marketing
○ Fiber, core tech. ○ S/W, Digital Contents○ Higher IT HR○ Product Planning & Marketing
○ Positioning global market○ Digital convergence btwn. telecom & broadcasting Industry ○ Increasing Internet user○ Worldclass IT Infra
○ Positioning global market○ Digital convergence btwn. telecom & broadcasting Industry ○ Increasing Internet user○ Worldclass IT Infra
○ Competition against foreign companies (Tech.)○ Follow up of developing countries (Wage) ○ Standardization Competition○ Strategic IPR Protection among advanced nations
○ Competition against foreign companies (Tech.)○ Follow up of developing countries (Wage) ○ Standardization Competition○ Strategic IPR Protection among advanced nations

16
13. Government’s R&D Investment Ratio
Ratio of private sector (Bil. U$)
Ratio of government sector(%)
DRAM, TDX, CDMA ?Machinery, Steel,
Chemical, shipbuilding,Automobile, electronics
Introduction P Catch up P Creative P

17
II. Success Factors of Korean II. Success Factors of Korean
IT IndustryIT Industry
II. Success Factors of Korean II. Success Factors of Korean
IT IndustryIT Industry

18
□ KII(Korea Information Infrastructure) Project
1. Background : • To enforce the national competitiveness • SOC in digital economy
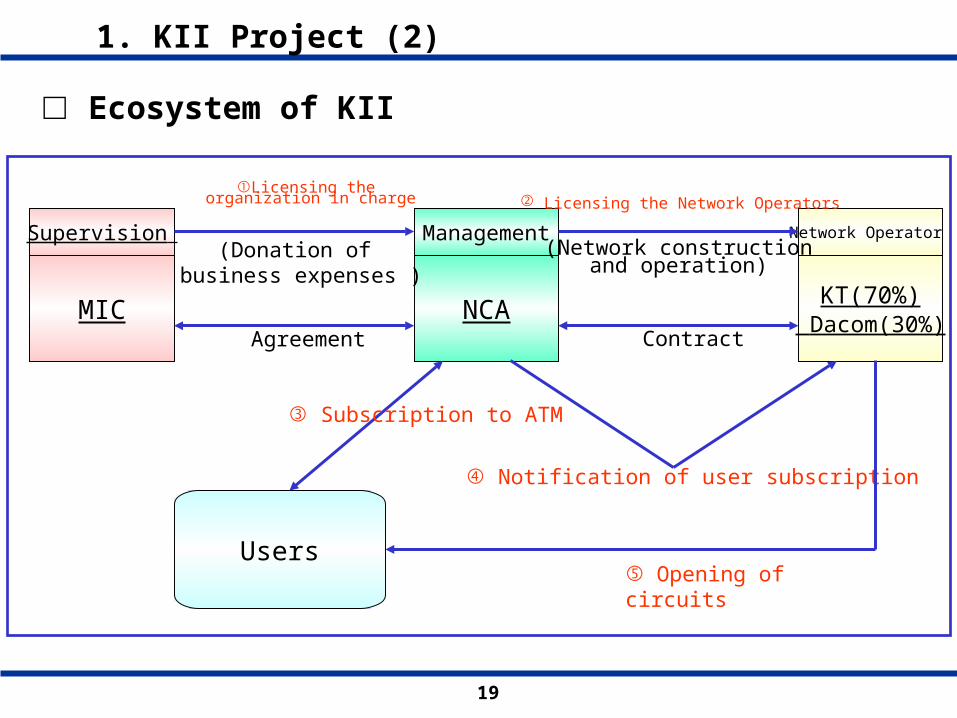
2. Government strategy : • To take over the risk which might be resulted from large scale investment at the initial stage • To help the private sector to migrate smoothly to the information society 3. Main Players • MIC : Investment & project supervision • NCA(NIA) : Management on behalf of the government • KT and Dacom : Network installation and operation
1. KII Project (1)
19
□ Ecosystem of KII
1. KII Project (2)
Supervision
MIC
Management
NCA
Network Operator
KT(70%) Dacom(30%)
①Licensing the organization in charge
(Donation of business expenses )
Agreement
② Licensing the Network Operators
(Network construction and operation)
Contract
Users
③ Subscription to ATM
④ Notification of user subscription
⑤ Opening of circuits

20
1. KII Project (3)
Government
Users NetworkOperators
② Usage charge③ Contract charges = Usage charges + Deposit(Gov’t subsidy)
① Service provisioning
□ Financing for the KII
1. Government deposit to the operators account 2. Construction of KII by operators with the deposit 3. Government credit cleared as a part of contract charge(~40%)
4. Price differentiation • Group A: up to high Schools (70% of basic charges) • Group B: National and local governments Research, educational and cultural are institutuions Medical organization Medical insurance, non-profit organization(Basic charges) • Group C: others (130% of basic charges)

21
□ Internet Industry
1. Broadband internet apartment : • Highly urbanized population : 80% • Housing pattern : 50 % live in apartments • Internet cafe
2. Deregulation policy : • No entrance & price regulation, flat rate system
3. Facility-based competition • Hanaro telecom (ADSL, 1999) vs. cable modem service providers • KT (2000), major competition
4. Government’s role • Keeping price down • Strategic promotion in supplying PC and Internet • Keeping the demand of the user (e-education, e-trade)
2. Broadband Experience(1)

22
2. Broadband Experience(2)
* Hurry Psychology : faster speeder* Peer Pressure: intolerance for slower connection
□ Success Factors
* Enthusiastic Adoption of New Service * Various contents & Killer app.* Wholesale Demand: Internet Cafe
Cultural Acceptance
Demand
* Gov’t Initiatives : KII, Korea Information infra. e-Korea initiatives* Pro- Competition facility based competition Deregulation for ISP business* Certification System for Super High Speed Building
* Stiff Competition: 3 players, Price competition, facility based competition * Geographic Advantages: 50% of household in apartment complex* Dropping Network Costs: cost effective deployment, mass deployment and operating know-how
Policy & Regulation
Supply

23
□ Mobile Industry
1. Massive national R&D project - Successful establishment of government drive technology development system • Government : CDMA technology development project, Project Planning, roll assignment, funding, roadmap • Participants : Source tech. (Qualcom), commercial tech. (ETRI),
devices (Samsung, LGE, HE, Maxon) (devices), mobile
operator (SKT)
2. Selecting CDMA tech. : • GSM (industrialized tech.) • Early commercialization of CDMA Tech. : encouraging CDMA environment
3. Introducing competition & handset subsidy • 3rd telecom market reorganization • lower price & better services, explosive market demand & growth
3. Mobile Experience (1)
24
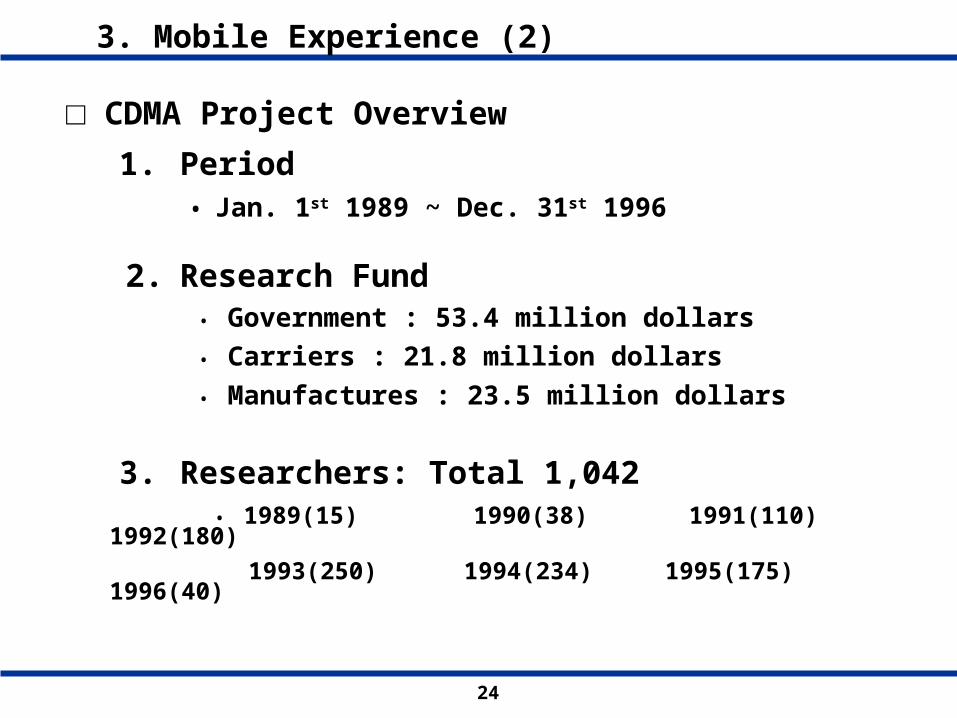
1. Period • Jan. 1st 1989 ~ Dec. 31st 1996
2. Research Fund • Government : 53.4 million dollars
• Carriers : 21.8 million dollars
• Manufactures : 23.5 million dollars
3. Researchers: Total 1,042 • 1989(15) 1990(38) 1991(110) 1992(180)
1993(250) 1994(234) 1995(175) 1996(40)
□ CDMA Project Overview
3. Mobile Experience (2)

25
QualcomQualcom ETRIETRI
System design/
dev. proto type
System design/
dev. proto typeJDA (Joint Development Agreement)JDA (Joint Development Agreement)
Joint research fund : 16.95 mil. U$Joint research fund : 16.95 mil. U$
DA (Designated Manufacturer)DA (Designated Manufacturer)
Infrastructure & Terminal Terminal
Royalty in advance : 8.50 mil. U$
Current royalty : domestic 6.0%
foreign 6.5%
Royalty in advance : 3.00 mil. U$
Current royalty : domestic 5.25%
foreign 5.75%
LGIC, Samsung, Hyundai Electronics Maxon
Dev. commercial system
Dev. commercial system
Source : ETRI, 2002
□ CDMA Joint Development Procedure
3. Mobile Experience (3)

26
Qualcomm
USA, Brazil, Argentina, China, India, Australia, Russia
SK Telecom(011)+ Shinsegi(017)
KT Freetel(016) + KT M.Com
LG PCS(019)
Foreign Mkt.
Others
ETRI
Samsung.
LG
Hyundai
Maxon
Telson
Hanwha
Pantech
Tech. Transfer
Royalty
Core Tech.
Parts Supplier
Domestic Suppliers
(First+Second)
Foreign Supplier
Manufacturers
PCS
Cellular
3. Mobile Experience (4)
□ The Structure of CDMA Industry

27
4. Success Story and its Effects
Economic effects
□ Unique Success Story and its Effects
Psychological effects
Better technology base

28
III. Global IT Development III. Global IT Development
issuesissues
III. Global IT Development III. Global IT Development
issuesissues

29
1. 3G Penetration Ratio
Source : ITU-D, 2010
□ The Rise of 3G

30
2. Global Mobile Subscription
Source : ITU-D, 2010
□ Growth Potential of Asia Pacific and Africa - Fast Growth in Asia Pacific - Greater potential in Africa
31
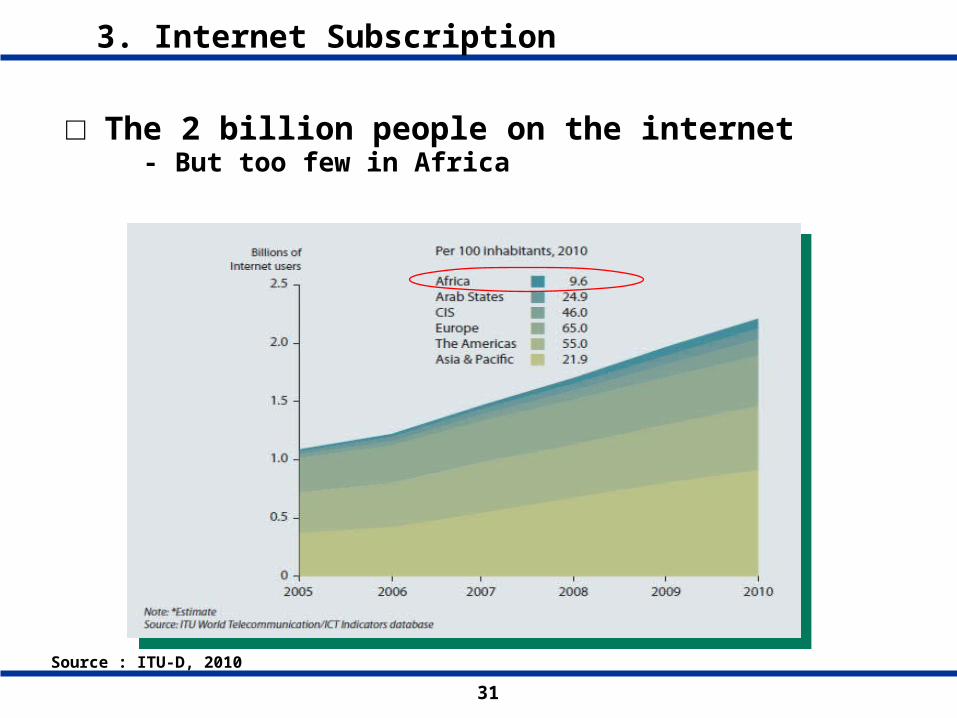
3. Internet Subscription
Source : ITU-D, 2010
□ The 2 billion people on the internet - But too few in Africa

32
4. Connecting Homes
Source : ITU-D, 2010
□ TV vs. Internet access
- Half a billion households worldwide (or 29.5%) have access to the Internet
33
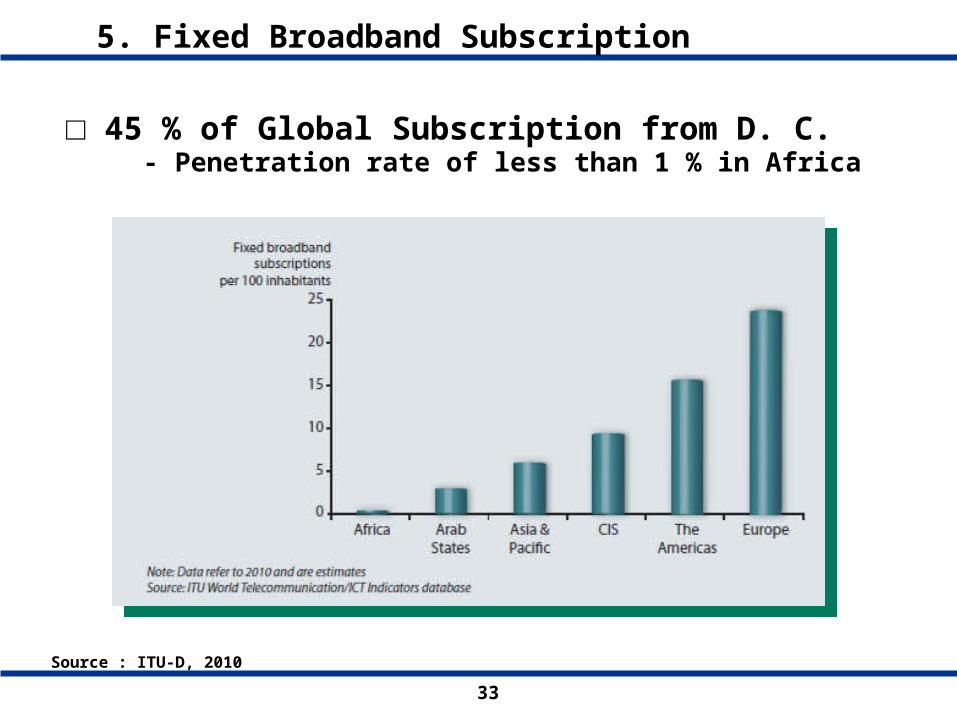
5. Fixed Broadband Subscription
Source : ITU-D, 2010
□ 45 % of Global Subscription from D. C. - Penetration rate of less than 1 % in Africa

34
6. Broadband Speed and Affordability
Source : ITU-D, 2010
□ Connection Speed and Average Price
35
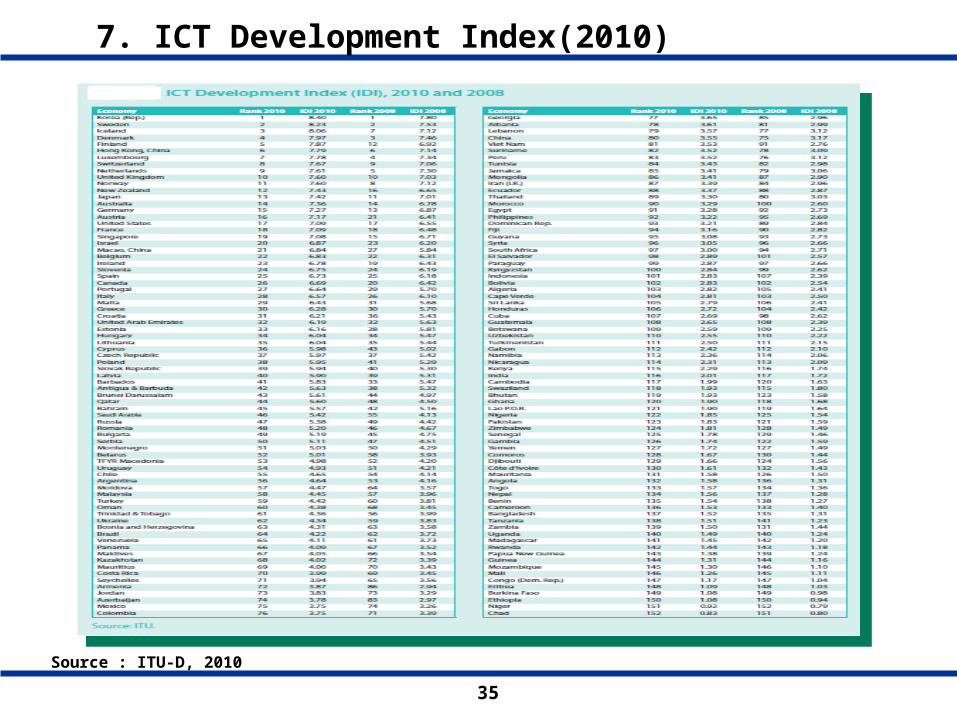
7. ICT Development Index(2010)
Source : ITU-D, 2010

36
8. IDI in Asia and Pacific(2010)
Source : ITU, 2010
37
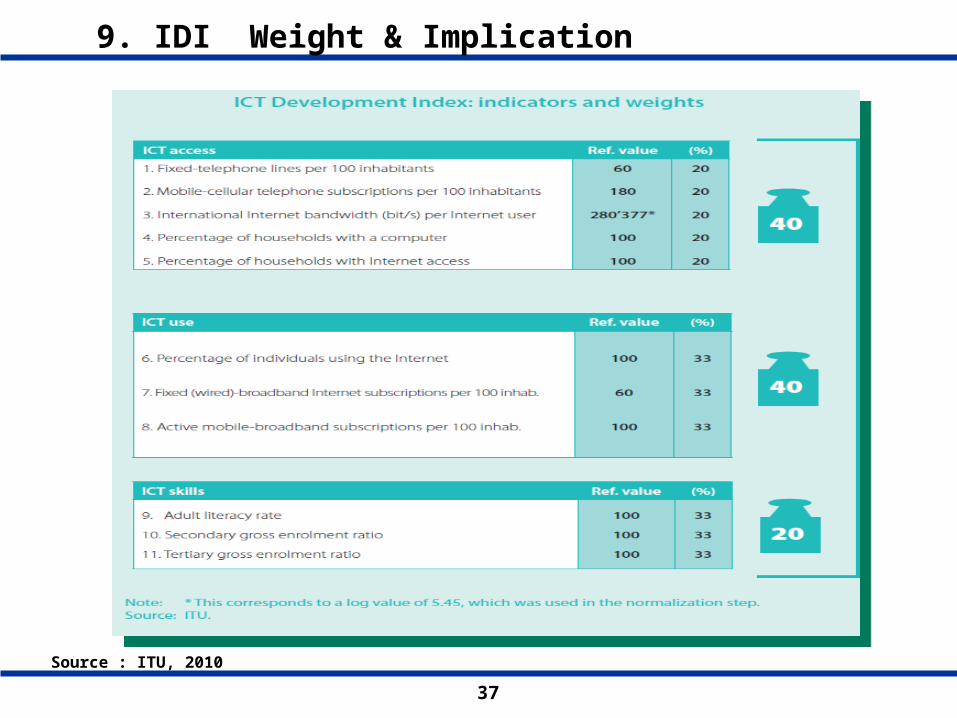
9. IDI Weight & Implication
Source : ITU, 2010

38
10. Economies by IDI (2010)
Source : ITU, 2010
39
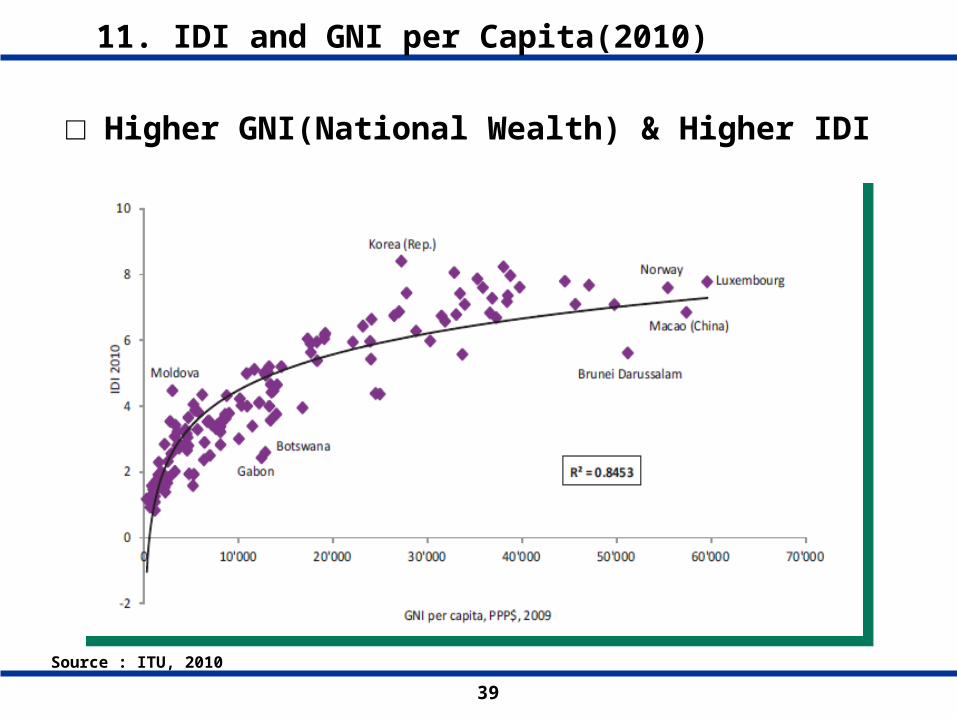
11. IDI and GNI per Capita(2010)
Source : ITU, 2010
□ Higher GNI(National Wealth) & Higher IDI
40
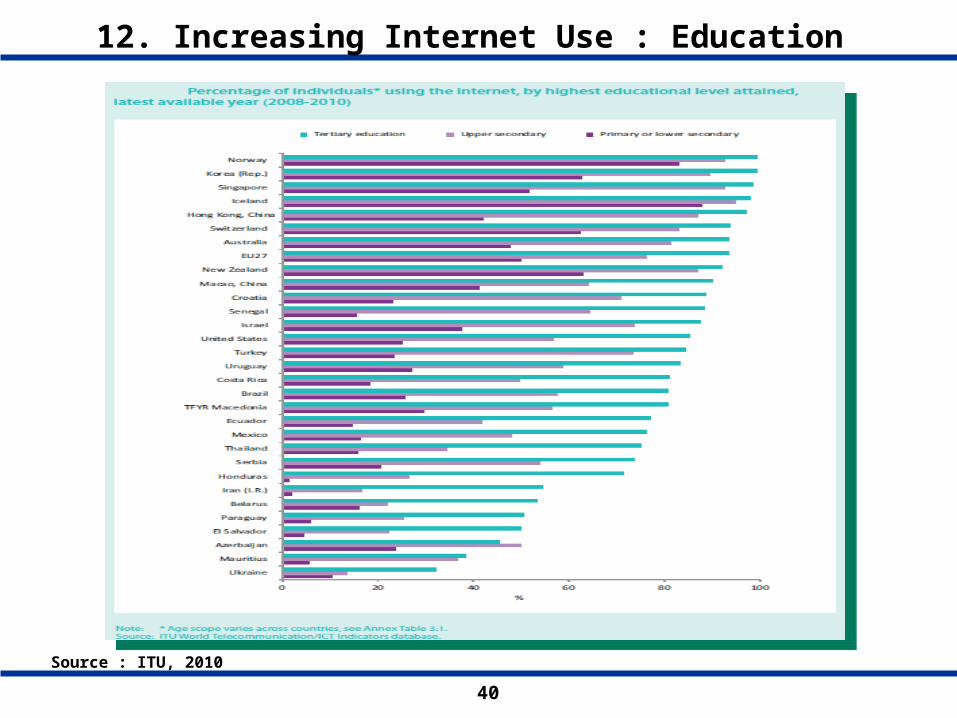
12. Increasing Internet Use : Education
Source : ITU, 2010

41
ICT as a Core Sector
ICT as an Enabler
Economic Development
Sustainable Industry
Competitive Knowledge Workers
Productivity
Social Equality
Education
13. Growth Engine
□ ICT is a Growth Engine of Socio-Economic Development

42
IV. Implementation of Policy IV. Implementation of Policy
InitiativesInitiatives
IV. Implementation of Policy IV. Implementation of Policy
InitiativesInitiatives
43
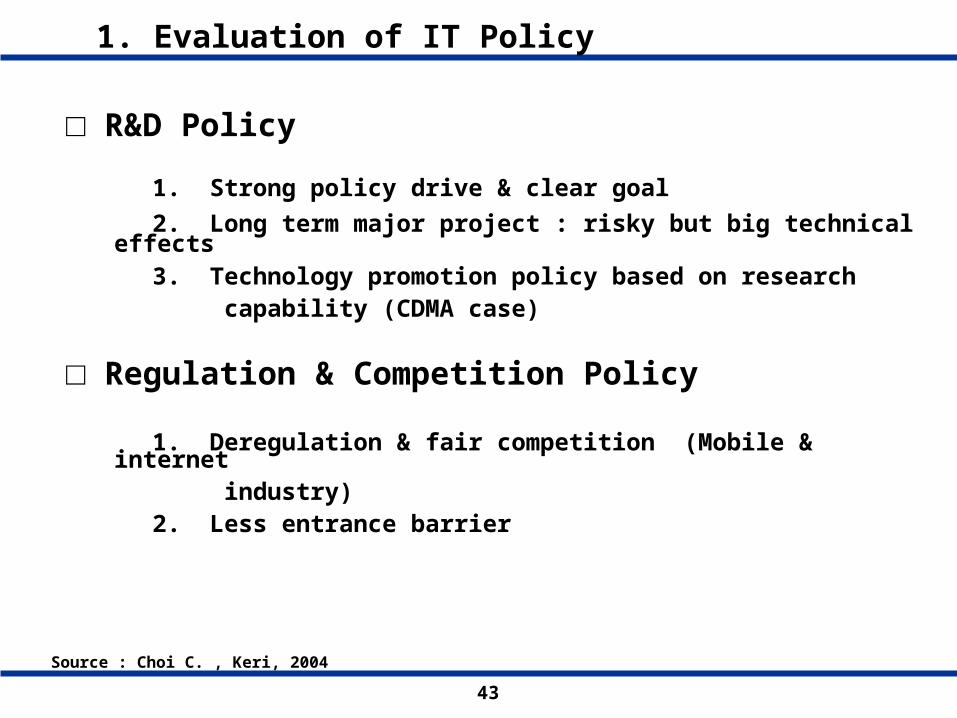
□ R&D Policy
1. Strong policy drive & clear goal
2. Long term major project : risky but big technical effects 3. Technology promotion policy based on research capability (CDMA case)
□ Regulation & Competition Policy 1. Deregulation & fair competition (Mobile & internet industry) 2. Less entrance barrier
1. Evaluation of IT Policy
Source : Choi C. , Keri, 2004

44
□ Corporation Policy
1. Evaluate the role of the major corporation in IT industry 2. Capability not Size
□ IT Policy
1. Deregulation & fair competition
2. Facility based competition 3. Emphasizing Frontier spirit for better industrial innovation
2. Evaluation of IT Policy
Source : Choi, C. K. , Keri, 2004
45
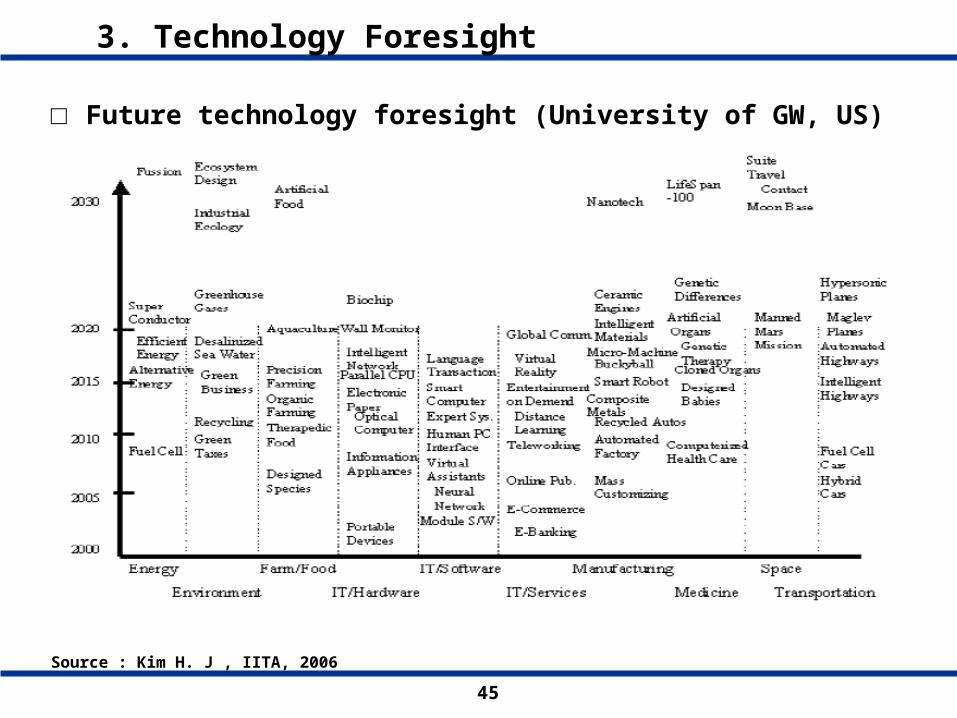
Source : Kim H. J , IITA, 2006
3. Technology Foresight
□ Future technology foresight (University of GW, US)
46
□ TEP & SIF 1. Techno-Economic Paradigm (TEP)
2. Socio-Institutional Framework (SIF)
- Good match
- Mismatch: structural crisis
4. New System

47
Thank You !Thank You !
Questionnaire
ETRI
Ilsue Roh
email : [email protected]
Phone: 82-42-860-1135