Embed Size (px)
Citation preview

IIrrI Lv. AD AO T O 025 CLEMSON UNIV 5 C DEPT OF MAfl€ MATICAL SCIENCES FIG 1211‘ I ON SUMS OF GAMMA ORDER STATISTICS WITH APPLIC”TON TO THE DISTR—ETC (U)
SEP 78 K T WALLENIUS. K ALAN ~~OO1k—t5—C—OU51UNCLASSIFIED N1OI
_
_ __
i~~~~
~I
_ _ LEVV41
~~~~~~~~~~~~~~~~
:~ DEPARTMENTOF
~~ MATHEMATICALSCIENCES
4 CLEMSON UNIVERSITYQ.mio~, Sooth Cerolini
~~~~~ 79 0 6 04 091

ON SUMS OF GAMMA ORDER STATISTICS
WITH APPLICATION TO THE
DISTRIBUTION OF R2, IN BEST SUBSET
MULTIPLE REGRESSION ,
(/0 ) K. T./Wa].].enjusK./Alam
/ L J )
Repor~~~~l~ l~ ~~~LJ/ ~
) Technical ~‘ep~~ t~)3O5
SepL~~~~.... 8\ I
D D C
JUN 1 8 1919Research supported by
~~~~~~~~~~
THE OFFICE OF NAVAL RESEARC
COnt2øtj NØ~ Gl4 75 C~~~45~~~
• D~Siv~ t~ ’tON ~~~~~A,pprov.d tuc ~~~~~~
Di,trth utirn~ Ua1i~rn~ød
____r — —~~~~~~~ — — — ,—_. - —— - ‘-.--- —.- -

ON SUMS OF GAMMA ORDER STATISTICS WITH
APPLICATION TO THE DISTRIBUTION OF R2
IN BEST SUBSET MULTIPLE REGRESSION
K. T. Wallenius and Khursheed Alam
Clemson University
ABSTRACT
This paper concerns the distribution of the sum of k
largest observations in a sample of m observations from a
gamma distribution with n degrees of freedom . The density
and cdf of the distribution are given as a sum of gamma
density functions. If n is integer valued then the sum
• consists of a finite number of terms. The distribution of
the sum arises in a problem of selecting variables in a
multi ple regression analysis.
Key words: Gamm a Distribution ; Laplace Transform ; MultipleRegression ; Variable Selection .
AMS Classification : 62E15
*The authors ’ work was supported by The Office of NavalResearch under Contract N00014—75—0451. ~~~~~~~~~~~~~~~~~~~~~~~~~~~~
-~
2 .
1. Introduction.
The distribution of the sum of k largest (smallest)
order statistics arises in various statistical investigations.
In life testing , for example , suppose that m items are put
on trial and that the experiment is terminated when k m
items fail. Let the length of life of the items be indepen-
dently and identically distributed according to a gamma dis-
tribution with an unknown scale parameter 3 , say.
If X1 X2 ~- . . • < Xk denote the observed failure times then
v k1 x.. , representing the sum of k smallest order statistics ,
together with Xk is a sufficient statistic for 8. If
. . . denote the observed failure times for
another set of items for which the scale parameter is 0’ , say ,
then the ratio R =
~i=l X~/ ~j~ l Z~ may be used to test the
hypothesis H: 0 = 0’ . Note that the distribution of R does
not depend on the value of the scale parameter .. under H.
For another example , suppose that m customers are wait-
ing in a queue for service . In certain situations , it may be
desirable to divert k of the customers who are likely to take
individually longer servicing time compared to the remaining
cus tomers , to a special queue. Let the servicing time of the
customers be independently and identically distributed . Then
the total servicing time of the special queue represents the
sum of k largest order statistics , whose distribution would
be of interest.
3.
Let denote the sum of k largest values in a s~ nple of n
observations from a gamma distribution with n degrees of
freedom. In this paper - ‘~~~ show that the cumulative distri-
bution function (cdf) of can be expressed as a linear
function of the gamma distribution functions. If n is a pos-
itive integer then the linear function consists of a finite
number of terms. The distribution of is obtained by invert-
ing its Laplace transform . The distribution of the sum of
k smallest values in the sample is obtained similarly.
For an application of the given result consider the
problem of determining the distribution of sample multiple
correlation Rk in regression analysis, where k variables
are selected for inclusion in the regression equation from a
given set of n vari ables , which maximize the value of Rk.
Suppose that the variables are jointly normally distributed
and independent. It is shown in Section 3 that (M—l)R ~ is
asymptotically distributed for large M (sample size) as the
sum of k largest order statistics in a sample of m obser—
vations from a chi-square (\~ ) distribution with 1 degree
of freedom .
- -—-

4.
2. Distribution of Y,,.~ Let Xr denote the r-th ~na11est value in a san~,le
of in ~~servations fran a gamma distribution with n degrees of freedom ,
and let ~k ~k+lXr ~enote the s~.nn of ti~~ in largest ~~servations in
the san~ le. Let (x) and Fk (x) denote the density and ~~f of
respectively , and let ~~ (0) denote the Laplace transfoxm of the distri-
bution. The density and ~~f are d,tained by invertir~g L~~( 0) , as fo1l~~s.
Let V be distributed according to the gamma distribution wit h n
degrees of freedan, and let g~ (x) and (x) denote its density and cdf,
respectively . The density function and the Laplace transfonn of the dis-tr ibution are given by n—i -xg (x) x e / r (n) , x
e d G~(x) = (1+8)~~ , 8 > o . (2.1)
Let ~P (0) denote the Laplace transform of the conditional. distribution
of 1, given V x, where x 0 . We have
~ (0) = (i-G (x)~~ f~ e0~’ dG (y)x n
= (1~0) —n ( l•••~Gn ((l+0)x)) (1—G (x))~~ .
Let H (x) denote the aif of X k. Given X k = ~1
~k is distributed
as the s~ n of k independent thservations fran the conditional distribution
of V, given I x. Therefore
(0) =i: ~~(0) d H(x)= m (En-•l) J.X~~k (0) G~
rI~~~ l (x) (1~~~4~x))
kdG(x )
m(’~~ ) (l+0)~~’~f(l..G ( (1+8)x)))kGn~
•~k_l
(x)dGn (x)
1 k< m
(1+O)~~~ k m. (2.2)
The Laplace transform of the distribution of the sum of k
smalle st observations in the sample is obtained by substitut-

5.
ing G ((l+8)x) for l-G~ (1+O)x) and l_G
~ (x) for G~~(x)
in the right hand side of (2.2).
First we consider the special case when n is a positive integer.
Let ~~~ denote the coefficient of x” in the expansion of
n-i ~x v~~~~ ~~
for ncri-regative integer values of u and v. The nuit*rs c~1 can be
cuiputed recursively fran the fol1c~ing forrmila .
vu• ~~~~~~~ , u < n— l
cul =o , u ..~• n
c~ 7 = o , u > (n—l)v
c~ , = ~~n=l L ~~~~~~~ ,
n U I (n—l)v, v>l.
Fran (2.2) and the forniila
—x n—l xl -G (x)=e
we have after siitçlification for 1 <k <in
— rn-i rn-k—i (n—i) k (n—i) r —
r
r(i~ k r=o u~~ v = o
(in-k_i) r (u+vfn) (J i+r)~~~’~’~~ (1+e) nk+u (i+~~0 )
_U~•V_fl (2.3)
where = k / (l+rlt). Through deccitiposition into partial fractions we
have
A -nk+u -u-v-n -
nk-u-l a ~~v+n-l b(l+~) ‘~r°~
— ___________ +1 S
• (1~0) nk_U S S=O (~~~~~~~~~~ 7~ffl-S
(2.4)
— ~~~~ .-
— — — — — — — - - — 0 _~~ ~~
— 0~~~~0
6.
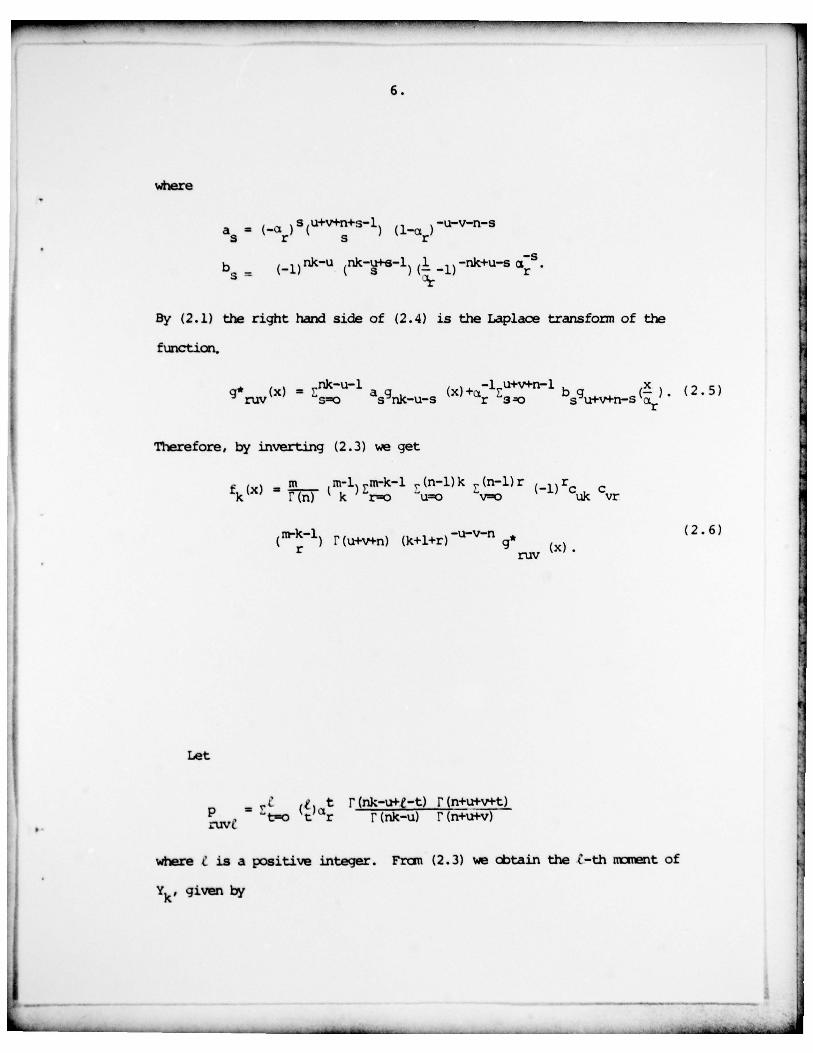
where
a3 ~~~~~ (~~~~ 4~~4S~~~)
~~~ —u—v—n— s
b5 = (—1 ) f l k U (nk—rs—l) (1 1) —nk+u—s ~;5.
By (2.1) the right hand side of (2.4 ) is the Laplace transform of the
function.
g* (x) = znk~14
~~~~~~~ (x) + E ~~~~n-~ bg~~,~n-5 r
(2. 5)
Therefore , by inverting (2.3) we get
f X ’ m m-1~~m-k—l ~.( n— l)k ~ (n— i)r
~~~~~ ~k ‘ r~~ ~~~~ v~~ / uk yr
( In-k_i) r (u+v+n) (k+l+r) g* (x). (2.6)
Let
— ,~ t I’ (nk—u4~ —t) r (n+u+v+t)p , - t~o ‘t~~r r (nk—u) 1’ (n+u+v)
0 • ruvt
where ~ is a positive integer . Fran (2.3) we thtain the C-th n~it~nt of
1k’ given by

7.
E m (rn_i ) c.m-k— i,r (n— l)k r (n— 1)r ,1) r)c r~n~ k r~~ u~~ v~~
Cuk yr
(In-k_ i) 1’ (u+v+n) (k+l+r) ~~~~~~~~~~~ ~~~~~~~~~~~~ . (2 . 7)
For n 1 and ~..= 1., the forni.ila (2.7) checks with the k.rx~jn result
(see e.g. David (1970) 2.7.3)
E 1k ~~ i~ n-k+1 ~J1= ~
(m-j+l )~~~.
Next, we consider the general case when n is not a posit ive integer.
The case n = 1/2 is of special interest , as in the exanpie , described in the
previous section . Let
(a)~. ~r
‘V (a,b;x) ~~ r = i ii
(a)r a(a+1) .. . (a+r—1)
denote the confluent hypergeanetric function , and let
rS x~ (a ,b;x) —~~ d —r = o rs r! (2.8)
where s is a positive integer. Differentiating (2.8) with respect
to x and using the formula for the derivative of a confluent
hyper geometr ic funct ion , given by
‘~(a,b;x) = ~ (a+i ,b*i;x)
we get r~~ ~~~ (a,b;x)D (a+1 ,b+i;x) =
~~~~~~ d~~1 $ ~~~
- .
a~uating the coefficient of ~r both sides we cbtain a recursive relation
for the coefficients drss given by dos = 1~ d~.l = (a) r’ (b) r(a+l)
d = sa r (r) r—t d s 1 (2 9)r+l s b ‘~ t—o t (b+1) t s—i’
- - - -
8.
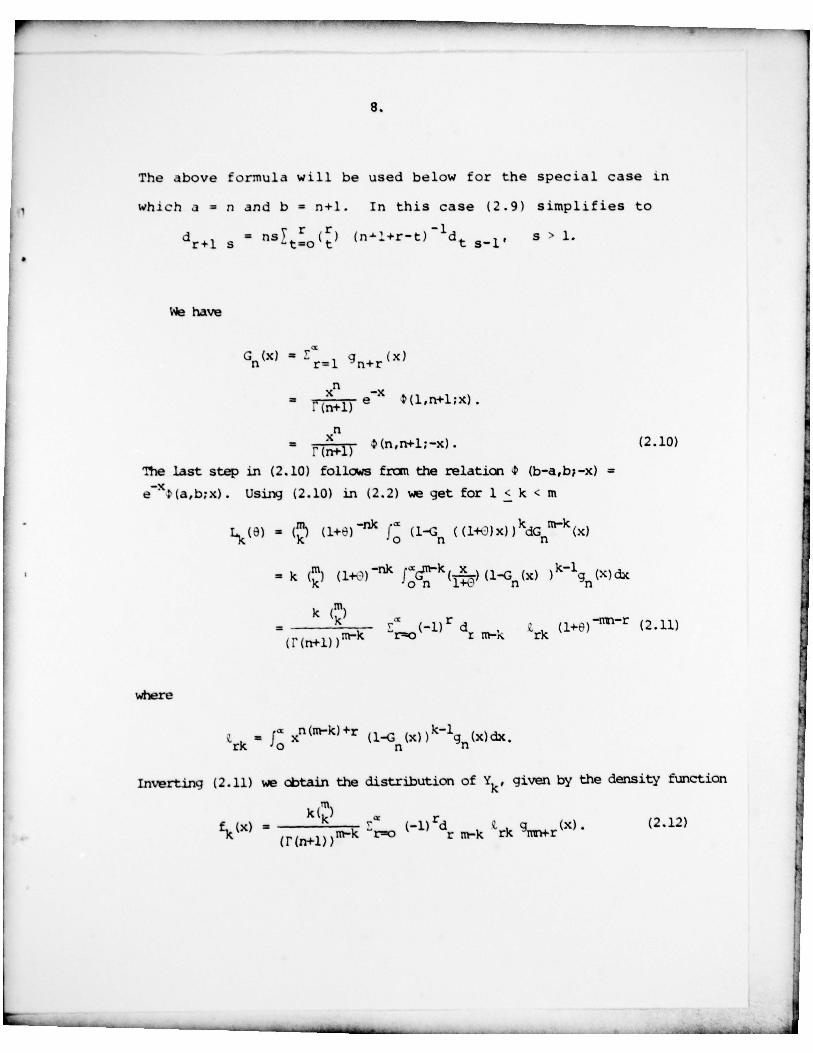
The above formula will be used below for the special case in
which a = n and b = n+l. In this case (2.9) simplifies to
d~~ 1 ~ =
~~~~~~ (nt.
~ +r~ t)l~dt s—i’ ~
We have
G~(x) ~~~=1
g~~~~(x)
‘( n+l) eX t (l,n+l;x).
= 1’( n+l ) ~(n,n+i;—x). (2.10)
The last step in (2.10) foll~~s fran the relation ~ (b-a ,b;—x) =
e ’~~(a,b;x). Using (2.10) in (2.2) we get for i < k < in
= (~) (1+0)~~~ f ~ (l-G ( ( l ~~) x ) ) kdG~~~~ (x)
= k (~) (1+t?)’~ f
~x~~ n-k~~~~~~~ )
~~~~~ )~~~ g~ (X) dx
= k (~ )
ç~~ (1)r d ~ (1÷0)~~~-r (2.11)(~ (n+l) rn-k r o r rn-r... rk
~~~re
~rk ~ ~n (m_k)+r (l-G (x))~~~g~ (x)dx.
Inverting (2.11) we cbtain the distribution of ~k ’ given by the density function
~~(x) = (r (~~i))~~ ~~ (_1) rd
r ~~k ~rk #r~~~ (2.12)
tlH
_ _ _ -a,
9.
Table I belc~i sk~~ s, for illustration , the u~çer 90th and 95th
0 percentiles of the distribution of for certain values of
rn ,k and n . Since y~ represents the largest order statistic
in a sampie of size in , and is distributed as a gamma
random var iab le wi th inn deg rees of f reedom , the percen tiles
~~ for k = 1 and in can be obtained from available tables
of the gamma distribution and the distribution of the largest
order statistic f rom that distribution . Percentage points
of the d i s t r ibu t ion of order statist ics from the gamma dis-
tribution have been tabulated by Gupta (1960). The percentage
points of I~ ~iiven in the table agree with the corresponding
points ~ive in Table III of Gupta.
F
H

0 0 • - _ _ _ _ _ _
3. Asymptotic Distribution of Rk.
Let X 1... ,X~ denote a given set of in predictor variables
and I denote the predictand in a multiple regression problem ,
where the variables are jointl y normally distributed . Specifi-
cally, let ~~~~~~~~~~~~~
d N(i.i , ) , where d means “dis-
tributed as ” . Since we are concerned with the correlation
coef f ic ien t, we can assume without loss of generality
that ~= 0 and that is a correlation matrix. Let Y arid denote the
vector of deviations of the cbserved values of V arid fran their
respective n~ans in a sanple of M observations ~~tained fran the given
distribution. Consider a subset of the predictor variables , say, X1, . . .Let X = (X 1, . .. t xk). The ~~uare of the sanpie rrn.altiple correlation between
I and (Xl , . . .l Xk) is given by
2 ‘ S — 1 ’R = (‘1 X (X X) X ‘1) / (1 Y ) .
rBy the law of large ntmters
(M— l) (X ’X)~~~~~ > ~~ as M -~~
where denotes the correlation matrix of the predictor variables
X 1,. . . , X~ . Therefore , asynptotically
(M— 1)R 2 ~ (Y x —i X ~) / (•
~‘•
~) (3.1)
Let denote the largest sanpie nultiple co-relation anx ng (~)
correlations between I and k out of in predictor variables .
Let V . = (Y X. ) 2/ (y y) , and let S,,~ denote the sum of k largest
values anong ~~~~~~~~ Let Cor (Y,X.) = ~ and Cor (X~~X3) A for
i, j = i,... ,m and i 4 j . That is, the predictor variables are equi—
correlated with thai~elves and with the predictor variables . The ~~
- _ _ _ _ _ _

0 ~~~~~~~~~~~~~~~~~~~~~~~~~ 0
11.
distinct characteristic roots of are (1—A) —l arid (1+ (k-i) A)
Let A~ and X denote, respectively , the mininun arid maxinun of the t~~
values. The quantity on the right hand side of (3.1) lies between
k *k 2arid A ~~~~~ Therefore, the asynptotic distribution of (M-i) R.K
is minorized (majorized) by the distribution of A*Sk À*ç.
Let A 0. Then X~ = A 1. Given Y , V .~”2 = (Y X . ) / ( Y Y)~~’2
~
N (~ (Y Y) 1”2 , 1_~2 ) arid Cor (Vt”2 iV~”2 ) = — p 2 . Therefore
(V~’2 ,. . .,V1”2 ) ~ ~~~~~~~~~~~~~~~~~~~~ (3.2)
where W and 0k,. • are jointly normally distr ibuted independent
of W , with n~ an zero arid covariance, given by
Var ( U. ) = i—p2, Coy (U~~U.) =-p 2 .
Thus for large ~I we have
(M-i)R ~ ~ S~
with the distribution of Sk being given by (3.2) . If noreove’~, ~ = o 0
then is distributed as the sum of k largest values in a sanpie of
in observations fran a chi-square distribution with 1 degree of free&in.
Diehr and Hoflin (1974) have given an ~rpirical formula for the
percentage points of the distribution of for the case A = p - o.
Fran Table 1 of their paper we obtain the 90% and 95% points of (M-l)
for m = 5, k = 1,2, 3, M = 106, as sh~~n belc~i
k—i 2 390% point 5.25 7.56 8.50
95% point 6.51 9.14 10.18
-
~
-- -—-- _ _ _ _ _

-
i
The above fiijures are sliqhtly larqer (as they should be) than
the correspondir~j percentage points of 21k for in ~~~, given in
0 Table ~. bel~~.
- --~~~~~~~~~~~~~~ -—-- -— ~~~~~~~~~~~~ ~~~~~00 -~~~~~ -

~~~0~~0 — ~~~~~~~~~ -~~
13.
• kki~~~ledg~ nent
• This ~~rk was supported by the Office of Naval Research underCaitract !sJ000l4~75~0451.
The autbors ackna~iledge the contribution of Dr. James S. Hawkes tothe preparation of Table 1.
References
(1) David , H. A. ( 1970) . Order Statistics , Wiley Publicationsin Statistics .
E 2~ Diehr , G. and Hofiirt , D. R. (1974). Approximating the distribution• of sanple R2 in best subset regressions . Technanetrics 16, 317-320.
(3) Q~pta, S. S. (1960). Order statistics fran the gamma distribution.Technanetrics 2, 243—262.
•
Khursheed AlanDept. of Mathenatical Sciences0—104 Martin HallClanson UniversityClenson, South Carolina 29631, USA
a
-- - 0

( 1 4 )
Table I - Percentiles of the di s t r i b u t i o n of
J ~~~~~~~~~~~~~~~~~~~~~~~~~~~~~~~~~~~~~~~~
m = 2 1.90 2 .51 2 .30 3.000 2.25 2 .85 2 . 9 3 .6 3.13 3.9 1
4 2 .46 3.09 3.3 4 . 0 3. ” 4 . 7 ~~~~ 4 . 74
n = l
2 2 . 9 7 3 . 6 8 3. 89 4~~74
3 3 . 3 7 4 .08 4 . 7 5 . 6 5 . 3 3 6 . 3 0
4 3 . 6 5 4 . 3 o 5 .3 6 . 2 6 . 2 “ .2 6 . 6 8 ~~~ . 75
n = 2
2 4.~~l 5 . 5 6 6 . 68 7 . 75
3 5 .19 6 . 0 3 7 . 8 8 .9 9. 2 7 10 . 5 1
4 5 . 5 3 6 . 3 6 8 .6 9 . 7 10.6 11.8 1 1 . 7 7 1 3 . 1 5
n = 3
2 6 . 2 6 ~‘ . 2 1 9 . 2 7 10.51
3 ô. 80 7 . 3 10.6 12 . 0 12. 99 1 4 . 4 3
4 . 17 8.10 11.5 12 . 7 14 .6 1 6 .0 16. 60 1 8 . 2 1
n~~~ 4
2 . 71 8. 75 11.77 13 . IS
3 8 .3 0 9 .3 2 13.3 14. 7 16 .60 18 .21
4 8 . 7 1 9. 1 16.3 15.6 18.3 2 0 . 1 2 1. 31) 23 . 11)
n • 5
2 9.11 10.22 1 4 . 2 1 15. 71
3 9. 74 10.~~3 15.9 17 .4 2 0 .13 2 1 . 8 9

1$I~~~~~I~~~ :~.*as,’~~a o N 3P ‘$11 ‘aGI (WhIle D.• Lnisi.I1
DE~~~~
., ~~~~~~~~~~~~
~~~~~~~ ~ LAD INST~~UCTION$r~ ~~~~ I I#V~~~J~~ f~ I A I iIJ~’~ ~ SLPORE COMPLLT!N G FO~~PA
ac.om ~ NVUSE~ GOv’ Ac:cuIo ~ N0.~ ~ IIeI.IIN ’ a ~ * ? A ~~OG 4UU•I ~
~4l0l”• • •
~~~ ~~• ~~~~~~~
0
~~• ‘v ~~i or . .o.~ a •i~~so o :~~v ucG
On Sums of Gamma Order Statisticswith.~Application to the Distribut~.onof r in Best Subset Multiple ‘ “~~‘°~~~~~° 0*4. *LSG*~
Tech . Re port # 3 0‘ ‘..om..~ I. :ONTIAC o* o**~
K. T. WalleniusK. Alain NOCO14- ’5—C-0451
I •E* 0*USNG 3* QA NS At ION MAU I AND ADDUISI 10 •*oO* M (I.LMI~~~- Ø*0~~IC ‘A &I(A* IA ö WO*I~ I,SNIi NIIUSI*I
Cisuison Uni.vsxsi’~y /Dept. of Maths~atica1 Sc~.snces NR 042—2 71Clsntson, South Caro1~.na 29631 ____________________________
• :oM uoS.~..INo o” I~ I MA UI AND A0D*III 12. *I~ Q*t DA tE
~ffi~~e of Naval R ssarc~ September l9’~Cod. 436 53. NUMUI* 0’ ‘AD C$Arl~.n~~on. Vs. ‘n” ’ ____________________________
~~ MONI~~~ *lN~~ AGINC’! MAUL a AOD*LI5 (SS ~SSi.,w I g,~~~~ C.nu,SSffia 0511.. ) II. ILCu*l~~’V C...AII. I.. ~a. ..p.n;
• Unclass~.fisd~~~~ DCC’ AI$I~~ICA ~~IO$ DOWNG*AD* NG
5$ D•S ISSUt ION S t A r C U I l d Y (.5 tAll ~ I f l )
Approv ed for public relsass; distrthution unl~mit.d .
~? DIStUISutIOM 5 r A IMCNt (.5 A. .i., p.. , int ..l HI D3••k 20 . IS dSSS. in5 _ *10.15)
I I $UO•)..I54IN ’~~A*~ w0 t1
a ~ g~ w ooDs (Cillis nu. In ,., .. .i.. is n.....~~, .,i .wt g gy a, aa..a ~~~~~~~
Ganuna Distribution; Laplace Transform ; Multiple Regression ;Variable Selection .
20 a•I~ — (C.øirnw. in .1.. i a s IS n.0.0.10p in~ IISOHIP IV WSIA NIInS.1)
5 This paper concerns the distribution of the sum of klar gest observations in a sample of m observations from aganuna distribution with n degrees of freedom . The densityand cdf of the distribution are given as a sum of gamma
• density functions. If ri is integer valued then the sumconsists of a finite number of terms . The distribution ofthe sum arises in a problem of selecting variables in amulti~ 1e regression analysis .
DO 5 JAN 71 ~~~ EDItION 0’ I NOV 55 5 O~~IO~~gtE1.’(d O i D 3 ~0I .• l$01 $SCUSI?I’ C~ a$$s’ ICAtIoN OP ta~I$ ‘ApE r~ In Din. Li,in0.


![reality (Quelques psychasthenia, · PSYCHOPATHOLOGY [264] Some observations relative to the feeling of reality (Quelques obser- vations relatives ausentiment dureel).-DIVRY.Jour](https://img.pdfslide.us/doc/110x75/5e84beb1cb56304c900d16b1/reality-quelques-psychasthenia-psychopathology-264-some-observations-relative.jpg)