Embed Size (px)
Citation preview
IEEE TRANSACTIONS ON NEURAL SYSTEMS AND REHABILITATION ENGINEERING, VOL. 19, NO. 3, JUNE 2011 221
Clustering Linear Discriminant Analysis forMEG-Based Brain Computer Interfaces
Jinyin Zhang, Student Member, IEEE, Gustavo Sudre, Student Member, IEEE, Xin Li, Senior Member, IEEE,Wei Wang, Douglas J. Weber, Member, IEEE, and Anto Bagic
Abstract—In this paper, we propose a clustering linear dis-criminant analysis algorithm (CLDA) to accurately decode handmovement directions from a small number of training trialsfor magnetoencephalography-based brain computer interfaces(BCIs). CLDA first applies a spectral clustering algorithm toautomatically partition the BCI features into several groups wherethe within-group correlation is maximized and the between-groupcorrelation is minimized. As such, the covariance matrix of allfeatures can be approximated as a block diagonal matrix, therebyfacilitating us to accurately extract the correlation information re-quired by movement decoding from a small set of training data. Theefficiency of the proposed CLDA algorithm is theoretically studiedand an error bound is derived. Our experiment on movementdecoding of five human subjects demonstrates that CLDA achievessuperior decoding accuracy over other traditional approaches.The average accuracy of CLDA is 87% for single-trial movementdecoding of four directions (i.e., up, down, left, and right).
Index Terms—Brain–computer interface (BCI), linear discrim-inant analysis (LDA), magnetoencephalography (MEG), spectralclustering.
I. INTRODUCTION
A BRAIN–COMPUTER interface (BCI) provides a directcontrol pathway from brain to external devices [1]–[3]. It
is a new communication option for those with neuromuscularimpairments that prevent them from using conventional aug-mentative communication methods. Although applications forpatients with severe motor disabilities have been the drivingforce of most BCI research, the potential of BCI for healthyusers is also extensive, including applications such as computergames and home entertainment systems.
Manuscript received September 22, 2010; revised December 20, 2010; ac-cepted January 31, 2011. Date of publication February 22, 2011; date of currentversion June 08, 2011. This work was supported in part by the National Insti-tutes of Health under Grant 5 UL1 RR024153, Grant KL2 RR024154, Grant1R01EB007749, and Grant 1R21NS056136), in part by the National ScienceFoundation under Grant EEEC-0540865, in part by the Telemedicine and Ad-vanced Technology Research Center under Grant W81XWH-07-1-0716, in partby the Craig H. Neilsen Foundation, and in part by the University of Pittsburgh.
J. Zhang and X. Li are with the Department of Electrical and ComputerEngineering, Carnegie Mellon University, Pittsburgh, PA 15213 USA (e-mail:[email protected]; [email protected]).
G. Sudre is with the Program in Neural Computation (PNC), Center for theNeural Basis of Cognition, Carnegie Mellon University, Pittsburgh, PA 15213USA (e-mail: [email protected]).
W. Wang and D. J. Weber are with the Department of Physical Medicine andRehabilitation and the Department of Bioengineering, University of Pittsburgh,Pittsburgh, PA 15213 USA (e-mail: [email protected]; [email protected]).
A. Bagic is with the Department of Neurology, University of Pittsburgh, Pitts-burgh, PA 15213 USA (e-mail: [email protected]).
Color versions of one or more of the figures in this paper are available onlineat http://ieeexplore.ieee.org.
Digital Object Identifier 10.1109/TNSRE.2011.2116125
To develop a practical BCI system, efficiently recording brainactivity and decoding users’ intention are two important butchallenging tasks. Magnetoencephalography (MEG) is a non-invasive modality that measures magnetic fields generated byelectrical neural activity [4]. MEG records brain signals withhigh temporal resolution. It is a valuable technique comple-mentary to other noninvasive recording modalities like elec-troencephalography (EEG) and functional magnetic resonanceimaging (fMRI) [5]. In the context of BCI, MEG is an impor-tant tool to train human subjects to modulate their neural ac-tivity for movement control [6]–[8]. In this paper, we focus onan MEG-based BCI system where human subjects perform overtor imagined movement of their wrists.
Once brain activity is recorded, various signal processing andmachine learning algorithms, e.g., linear discriminant analysis(LDA) [3], [8], [10], [11], support vector machine (SVM) [6],[10], [12], common spatial pattern (CSP) [13]–[15], etc., can beapplied to decode users’ intention in a BCI system. If the featurespace is high-dimensional and the training data are limited, themovement decoding algorithm must be carefully designed toprevent thedecoder from over-fitting the training data. To addressthis over-fitting problem, feature selection [6], [12] and/or regu-larization [8], [10] are often applied. For instance, diagonal LDA(DLDA) [11] and regularized LDA (RLDA) [8], [10] have beenused in several BCI systems. Both of them pose extra constraintson BCI features to address the aforementioned dimensionalityissue. In particular, DLDA assumes mutual independence amongall features so that their covariance matrix can beapproximated asa diagonal matrix. On the other hand, RLDA applies a Bayesianinference where a simple prior with diagonal covariance matrixis assumed for all features. In other words, both DLDA andRLDA rely on the prior knowledge that all features are mutuallyindependent. While these two methods have been successfullyapplied to many practical BCI problems, they may not guaranteehigh decoding accuracy if the underlying prior knowledge doesnot represent the actual correlation structure of features.
In this paper, we propose a clustering linear discriminantanalysis (CLDA) algorithm for BCI movement decoding. Un-like DLDA or RLDA, CLDA utilizes a unique group structureto model the correlation information of BCI features. It parti-tions all features into several groups where the within-groupcorrelation is maximized and the between-group correlation isminimized. As such, the covariance matrix of all features canbe approximated as a block diagonal matrix, thereby facilitatingus to accurately extract the correlation information required bymovement decoding from a small set of training data. Note thatthe traditional DLDA method can be conceptually viewed as aspecial case of CLDA where each group only contains a single
1534-4320/$26.00 © 2011 IEEE
222 IEEE TRANSACTIONS ON NEURAL SYSTEMS AND REHABILITATION ENGINEERING, VOL. 19, NO. 3, JUNE 2011
feature and, hence, no within-group correlation is modeled.From this point of view, the proposed CLDA algorithm is ageneralized version of DLDA. It aims to achieve improveddecoding accuracy by accurately capturing the correlationinformation among all features. As will be demonstrated by theexperimental results in Section IV, CLDA achieves superiordecoding accuracy over other traditional approaches. Theaverage accuracy of CLDA is 87% for single-trial movementdecoding of four directions (i.e., up, down, left, and right).
An important contribution of this paper is to apply a spectralclustering algorithm [16]–[19] to automatically identify the un-derlying group structure of BCI features and assign each featureto the appropriate group. The spectral clustering method firstrepresents the correlation information of BCI features in formof a similarity graph. Next, an optimal partition is constructedto split the graph into several sub-graphs (i.e., groups) based onits Laplacian matrix. The optimal number of groups is automat-ically determined by measuring the “quality” of the clusteringresults [18]. In this paper, the spectral clustering algorithm isused, since it is not sensitive to the error of the correlation modelestimated from a small set of training data, as is demonstratedby both theoretical studies and application examples in the ma-chine learning community [16]–[19].
In addition, several theoretical aspects of the proposed CLDAalgorithm are further examined in order to explain the reason whyCLDA outperforms other traditional decoding techniques. Anerror bound is derived to quantitatively assess the approximationaccuracy of the block diagonal covariance matrix and its impacton the final decoding accuracy. It can be shown that the decodingerror of CLDA is directly related to the condition number of anormalized covariance matrix . If the condition number ofis sufficiently small, the accuracy of CLDA is close to that ofan optimal classifier. These results provide theoretical evidenceto support the practical utility of the proposed CLDA method.
The remainder of this paper is organized as follows. In Sec-tion II, we briefly review the background of LDA, and thenpropose our CLDA algorithm in Section III. The efficiency ofCLDA is demonstrated by a number of experimental examplesin Section IV. Several theoretical and practical aspects of CLDAare further discussed in Section V. Finally, we conclude in Sec-tion VI.
II. BACKGROUND
In this section, we briefly review the background of LDAand two of its modified versions: DLDA and RLDA. Con-sider two sets of training data and
corresponding to two classes, whereis the feature vector of
the th trial from the th class, stands for the number offeatures, and and represent the numbers of trainingsamples for these two classes, respectively. The key idea ofLDA is to find the optimal projection direction sothat the between-class scatter is maximized and the within-classscatter is minimized [29]. Define the within-class scatter matrix
as
(1)
where and stand for the mean ofand , respectively. If (1) is nonsin-gular, can be determined as [29]
(2)
Once is found, the following decision function can beconstructed for two-class classification:
(3)
The aforementioned two-class LDA can be extended to multipleclasses. More details of LDA can be found in [29].
If there are a sufficient number of training samples, in (1)is an accurate estimator of the covariance matrix and LDA yieldsthe optimal projection direction that maximizes classifica-tion accuracy. However, if only a small number of training sam-ples are available for a high-dimensional feature space, it is ex-tremely difficult to accurately estimate the covariance matrix re-quired by LDA. To address this dimensionality issue, DLDA [11]and RLDA [8], [10] have been proposed. DLDA assumes mutualindependence among all features, thereby forcing to be diag-onal. Alternatively, RLDA adds an additional regularization termto theestimator: ,where isan identitymatrixandisaregularizationparameter that is typicallydeterminedbycross-validation. Both DLDA (with a diagonal within-class scatter ma-trix) and RLDA (using a diagonal covariance matrix to model theprior distribution for Bayesian inference) rely on the prior knowl-edge that all BCI features are mutually independent. While thesetwo methods have been successfully applied to a broad range ofpractical applications, they cannot guarantee high decoding ac-curacy if the underlying prior knowledge does not represent theactual correlation structure of BCI features. In addition, as willbedemonstratedby theexperimental results in Section IV,simplefeature selection (e.g., by using Fisher criterion [29]) does notlead to high decoding accuracy. These observations, therefore,motivate us to develop a new CLDA algorithm to achieve im-proved classification accuracy by carefully modeling the mutualcorrelation among all features.
III. CLUSTERING LINEAR DISCRIMINANT ANALYSIS
The proposed CLDA algorithm relies on a unique groupstructure to extract the correlation information required formovement decoding. Namely, we assign each feature to theappropriate group so that the within-group correlation ismaximized and the between-group correlation is minimized.Note that such a feature clustering task is not trivial, since thecorrelation information extracted from training data is likely tobe inaccurate, especially if only a limited number of trainingsamples are available for a high-dimensional feature space. Inother words, the challenging issue here is how to develop arobust clustering scheme that is not sensitive to the error of thecorrelation model estimated from a small set of training data.
In this section, we propose to borrow the spectral clus-tering algorithm [16]–[19] from graph theory [27] to addressthe aforementioned challenge on feature clustering. Spectralclustering is one of the most important clustering techniquesdeveloped by the machine learning community. It first formsa similarity graph based on the mutual correlation of different
ZHANG et al.: CLUSTERING LINEAR DISCRIMINANT ANALYSIS FOR MEG-BASED BRAIN COMPUTER INTERFACES 223
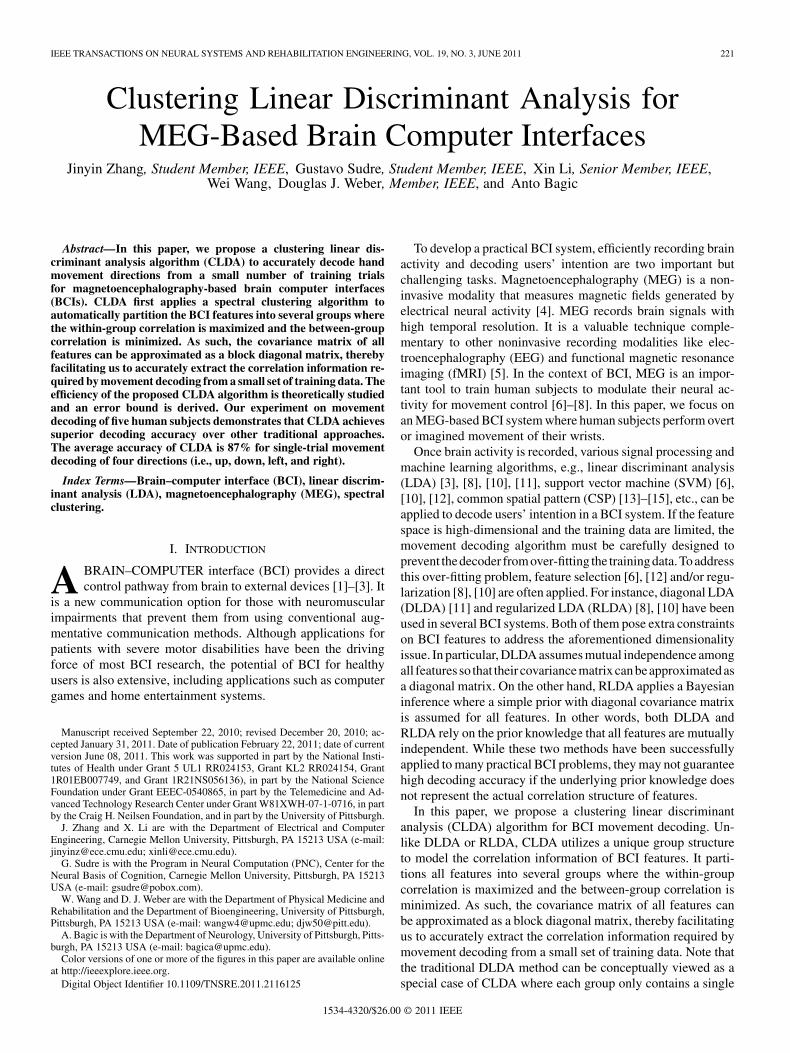
Fig. 1. Simple example of within-class scatter matrix for four BCI features�� � � � � � � � and the corresponding similarity graph.
features. Next, the features are partitioned into several groupsbased on the Laplacian matrix of the similarity graph. Here,the spectral clustering algorithm is selected, because it canprovide robust performance, even if the input data are noisy, asis demonstrated by both theoretical studies and application ex-amples in the machine learning community [16]–[19]. Hence,the spectral clustering algorithm perfectly fits the need of ourfeature clustering problem. Based upon spectral clustering, amodified LDA algorithm (i.e., CLDA) is further proposed forBCI movement decoding using the grouped features. In whatfollows, we will describe the technical details of the algorithmsand highlight their novelties.
A. Feature Clustering
Given a set of BCI features , thegoal of feature clustering is to partition all features into severalgroups such that the features in the same group are similar anddifferent features in different groups are dissimilar to each other.In our application, correlation is the criterion to quantitativelymeasure the “similarity” between features. Namely, we wantto maximize the within-group correlation and simultaneouslyminimize the between-group correlation.
To mathematically define the aforementioned featureclustering problem, we represent all features
in form of a weighted undirected graphthat is referred to as similarity graph in [19].
In this graph , each vertex represents a feature where. Two vertices and are connected by
an edge , if and only if the correlation between these twofeatures is non-zero. The weight of is equal to thecorrelation coefficient
(4)
where stands for the th element of the within-class scatter matrix in (1). For each vertex , there is aself-edge and the weight is equal to 1. In (4), thecorrelation coefficient is defined by the within-class scatter ma-trix and is always nonnegative. Fig. 1 shows a simple exampleof within-class scatter matrix for four featuresand the corresponding similarity graph.
Based on the similarity graph , we want topartition into several sub-graphs such that the edges betweendifferent sub-graphs have small weights (i.e., the correspondingfeatures are weakly correlated) and the edges within the samesub-graph have large weights (i.e., the corresponding featuresare strongly correlated). Such a partition can be constructedby using the Laplacian matrix of . In what follows, we will
first define several important terminologies in graph theory[19], [27].
The adjacency matrix of the similarity graphis defined as
......
. . ....
(5)
Namely, the th element of is the weight of theedge . If two vertices and are not connected,is simply set to zero. Since the similarity graph is undirected,the adjacency matrix is symmetric. Based on the adjacencymatrix , the degree of a vertex is defined as
(6)
Remember that the weight is nonzero, if and only if thevertices and are connected. Hence, the degree in(6) is determined by all edges that are connected to . Thedegree matrix is defined as a diagonal matrix with
on its diagonal
(7)
Now, we are ready to define the Laplacian matrixof the similarity graph
(8)
It can be shown that the Laplacian matrix in (8) is positivesemi-definite. All of its eigenvalues are within the interval [0, 1].In particular, is one of its eigenvalues (i.e., the smallesteigenvalue) and the corresponding eigenvector is
(9)
More details on Laplacian matrix can be found in [19], [27].If the similarity graph can be exactly partitioned into
sub-graphs (i.e., there is no edge con-necting any two sub-graphs) and all vertices are appropriatelyordered (i.e., the vertices in the same sub-graph are grouped to-gether), it is straightforward to verify that the Laplacian matrix
of the graph is block diagonal
(10)
where is the Laplacian matrix of the sub-graph . Sinceis a Laplacian matrix, is one of its eigenvalues and
we represent the corresponding eigenvector as . Similar to(9), can be determined by the degrees of the vertices in thesub-graph . Based on these observations, we can concludethat the Laplacian matrix in (10) has different eigenvectorsthat is associated with the same eigenvalue
......
. . ....
(11)
224 IEEE TRANSACTIONS ON NEURAL SYSTEMS AND REHABILITATION ENGINEERING, VOL. 19, NO. 3, JUNE 2011
where each column of the matrix in (11) is aneigenvector of the Laplacian matrix , and the symbol denotesa zero vector (i.e., all elements in are zero).
Next, we normalize each row of the matrix to unit length,resulting in
......
. . ....
(12)
where the symbol denotes a vector in which all elements areone. Studying the matrix in (12), one would noticethat each row of corresponds to a vertex of the similaritygraph (i.e., the BCI feature ). We can conceptually con-sider the th row of as the coordinate of the th feature
in a “transformed” feature space . For all features in thesame sub-graph , their coordinates are identical. Hence, wecan use the “normalized” eigenvectors in (12) to partition allBCI features into groups (e.g., by applying K-means clus-tering [29]). Such a feature clustering scheme is based on spec-tral graph theory [27] and, hence, is referred to as spectral clus-tering in the literature [16]–[19].
While the above discussion covers the key idea of the pro-posed feature clustering based on spectral graph theory, thereare three important implementation issues that should be fur-ther considered. First, our previous discussion assumes that allvertices of the similarity graph are appropriately ordered sothat the Laplacian matrix in (10) is block diagonal. In prac-tice, this is never the case and the correct ordering of all verticesshould be the output of the clustering algorithm. Note that ifthe ordering of the vertices is changed, the Laplacian matrix ofthe similarity graph can be written as a linear transformationof the block diagonal matrix in (10): where isa permutation matrix (i.e., an identity matrix with its rows re-ordered [27]). Compared to the matrix , the matrixhas identical eigenvalues. The eigenvectors of andonly differ by a simple permutation. In other words, the afore-mentioned properties for eigenvalues and eigenvectors still holdand, hence, the spectral clustering scheme can be applied to ap-propriately identify the subgraphs, even if all vertices in the sim-ilarity graph are arbitrarily ordered.
Second, the sub-graphs are not nec-essarily disconnected in most practical applications, since theBCI features and in different sub-graphs can be weaklycorrelated and, hence, the weight of the edge is notexactly zero. In addition, since the weight in (4) is calcu-lated from the within-class scatter matrix in (1) based on aset of training data, the estimation of can be inaccurate, es-pecially if the feature space is high-dimensional and only a smallset of training data are available. In these cases, the Laplacianmatrix in (8) is not exactly block diagonal. However, the spec-tral clustering result is not sensitive to the small perturbationpresented in the correlation model. In other words, even if theLaplacian matrix deviates from the ideal (i.e., block diagonal)case, spectral clustering can still yield the correct clustering re-sults, as is demonstrated by both theoretical studies and appli-cation examples in the machine learning community [16]–[19].For instance, a detailed perturbation analysis of the invariantsubspace (i.e., the subspace spanned by eigenvectors) has been
studied in [19] for spectral clustering. It provides theoretical ev-idence that the spectral clustering method offers robust perfor-mance and, hence, perfectly fits the needs of our proposed fea-ture clustering problem.
Third, the number of clusters (i.e., ) is not known in ad-vance when the proposed feature clustering scheme is appliedto BCI movement decoding. In other words, the optimal valueof must be automatically determined as part of the clusteringprocedure. To this end, we borrow the concept of quality func-tion from [18]. Namely, is defined to measure thequality of different clustering results with different values
(13)
where the function measures the similarity betweentwo sub-graphs and based on their weights
(14)
It has been empirically demonstrated by a broad range of sim-ulated and real-world examples in [18] that a large im-plies an improved clustering result. Hence, we can repeatedlyperform feature clustering with different values and calcu-late the “quality” in (13) for the clustering results. Theoptimal value of is then determined by finding the largestquality function .
Algorithm 1: Feature Clustering
1) Start from the training dataand corresponding to theBCI features of two classes.
2) Calculate the within-class scatter matrixin (1). Construct the similarity graph . Calculate theadjacency matrix in (4), (5), the degreematrix in (6), (7), and the Laplacianmatrix in (8).
For each3) Find the smallest eigenvalues and the corresponding
eigenvectors. Form the matrix whereeach column is one of the eigenvectors.
4) Normalize each row of the matrix to unit length,resulting in the matrix .
5) Consider each row of as the coordinate of a BCIfeature in the space , and apply K-means clustering[29] to partition the featuresinto groups.
6) Calculate the quality function in (13).End For7) Find the optimal value at which the quality
function reaches its maximum. Use the clusteringresult at to partition all features intogroups.
Algorithm 1 summarizes the major steps of the proposed fea-ture clustering method. During the clustering procedure, the op-timal number of clusters is automatically determined by evalu-
ZHANG et al.: CLUSTERING LINEAR DISCRIMINANT ANALYSIS FOR MEG-BASED BRAIN COMPUTER INTERFACES 225
ating the quality function in (13). Once the features are appro-priately partitioned into groups, a modified LDA algorithm(i.e., CLDA) can be applied for movement decoding using thegrouped features. The details of CLDA will be discussed in thenext subsection.
B. Discriminant Analysis
Once the BCI features are parti-tioned into groups, all features are ordered according totheir group assignment. Since the mutual correlation betweendifferent groups is almost zero, the within-class scatter matrix
can be approximated by a block diagonal form
(15)
where stands for the within-class scatter matrix for the fea-tures in the th group. The key idea of CLDA is to estimate theblock diagonal matrix in (15), and use it to replacein (2) to calculate the optimal projection direction . Sincethe block diagonal matrix is more constrained than theoriginal within-class scatter matrix is less sensitiveto the dimensionality issue posed by high-dimensional featurespace and small training data set. In other words, the proposedCLDA can efficiently approximate the within-class scatter ma-trix using a block diagonal form and then accurately estimatethe optimal projection direction , even if the feature spaceis high-dimensional and the training data are limited. This is theprimary advantage of CLDA over LDA.
On the other hand, CLDA can be viewed as a direct ex-tension of DLDA [11]. Unlike DLDA that approximates thewithin-class scatter matrix by a diagonal matrix and com-pletely ignores the correlation between different features, theproposed CLDA is able to automatically identify the criticalcorrelation information (i.e., by partitioning all features intodifferent groups) and then accurately extract the correlation(i.e., by estimating a block diagonal within-class scatter matrix)from a small set of training data. For this reason, CLDA cancapture the mutual correlation of BCI features more accuratelythan DLDA. Hence, it is expected to achieve superior decodingaccuracy over DLDA.
Algorithm 2: Clustering Linear Discriminant Analysis
1) Start from the training dataand corresponding to theBCI features of two classes.
2) Apply Algorithm 1 to partition all features intogroups.
3) Order all features according to their group assignment.Construct the block diagonal within-class scattermatrix in (15).
4) Replace in (2) by to calculate the optimalprojection direction .
5) Create the two-class classifier for movement decodingbased on the decision function in (3).
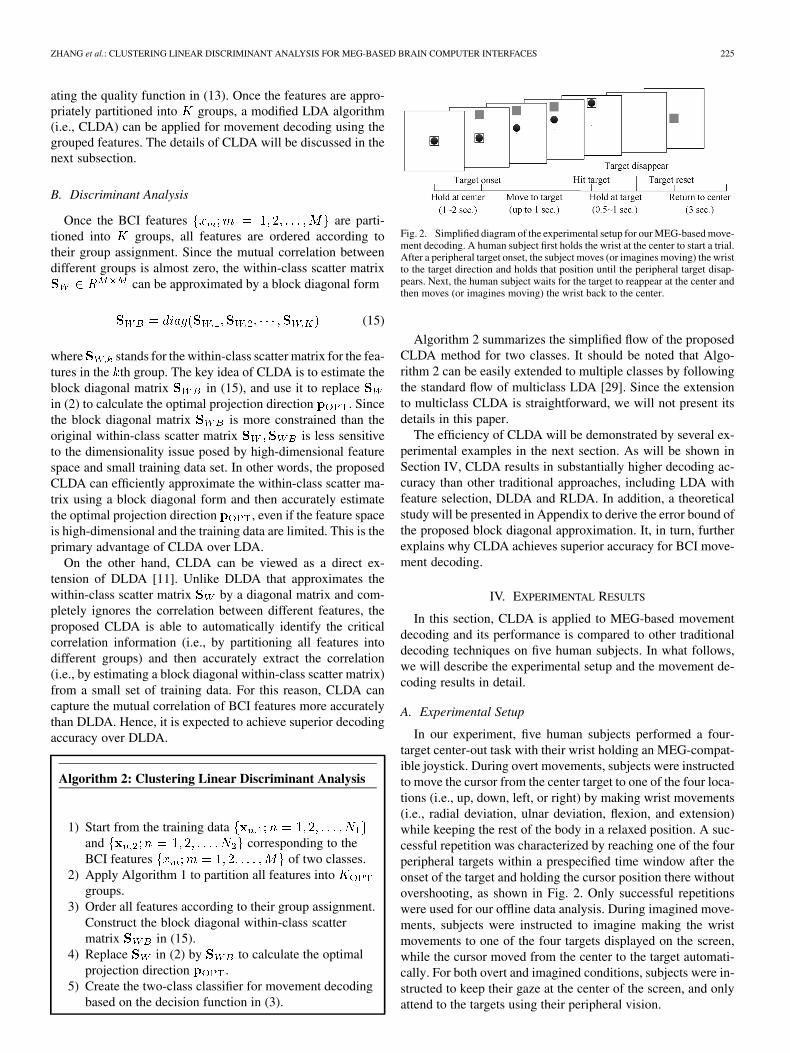
Fig. 2. Simplified diagram of the experimental setup for our MEG-based move-ment decoding. A human subject first holds the wrist at the center to start a trial.After a peripheral target onset, the subject moves (or imagines moving) the wristto the target direction and holds that position until the peripheral target disap-pears. Next, the human subject waits for the target to reappear at the center andthen moves (or imagines moving) the wrist back to the center.
Algorithm 2 summarizes the simplified flow of the proposedCLDA method for two classes. It should be noted that Algo-rithm 2 can be easily extended to multiple classes by followingthe standard flow of multiclass LDA [29]. Since the extensionto multiclass CLDA is straightforward, we will not present itsdetails in this paper.
The efficiency of CLDA will be demonstrated by several ex-perimental examples in the next section. As will be shown inSection IV, CLDA results in substantially higher decoding ac-curacy than other traditional approaches, including LDA withfeature selection, DLDA and RLDA. In addition, a theoreticalstudy will be presented in Appendix to derive the error bound ofthe proposed block diagonal approximation. It, in turn, furtherexplains why CLDA achieves superior accuracy for BCI move-ment decoding.
IV. EXPERIMENTAL RESULTS
In this section, CLDA is applied to MEG-based movementdecoding and its performance is compared to other traditionaldecoding techniques on five human subjects. In what follows,we will describe the experimental setup and the movement de-coding results in detail.
A. Experimental Setup
In our experiment, five human subjects performed a four-target center-out task with their wrist holding an MEG-compat-ible joystick. During overt movements, subjects were instructedto move the cursor from the center target to one of the four loca-tions (i.e., up, down, left, or right) by making wrist movements(i.e., radial deviation, ulnar deviation, flexion, and extension)while keeping the rest of the body in a relaxed position. A suc-cessful repetition was characterized by reaching one of the fourperipheral targets within a prespecified time window after theonset of the target and holding the cursor position there withoutovershooting, as shown in Fig. 2. Only successful repetitionswere used for our offline data analysis. During imagined move-ments, subjects were instructed to imagine making the wristmovements to one of the four targets displayed on the screen,while the cursor moved from the center to the target automati-cally. For both overt and imagined conditions, subjects were in-structed to keep their gaze at the center of the screen, and onlyattend to the targets using their peripheral vision.
226 IEEE TRANSACTIONS ON NEURAL SYSTEMS AND REHABILITATION ENGINEERING, VOL. 19, NO. 3, JUNE 2011
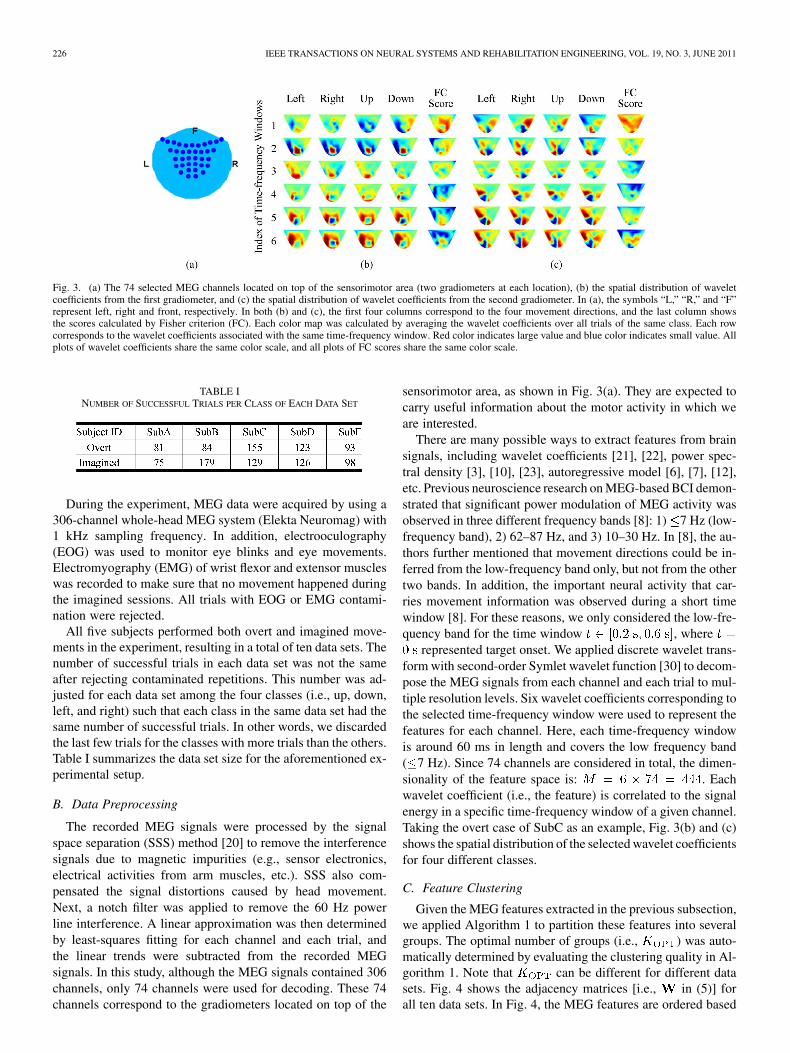
Fig. 3. (a) The 74 selected MEG channels located on top of the sensorimotor area (two gradiometers at each location), (b) the spatial distribution of waveletcoefficients from the first gradiometer, and (c) the spatial distribution of wavelet coefficients from the second gradiometer. In (a), the symbols “L,” “R,” and “F”represent left, right and front, respectively. In both (b) and (c), the first four columns correspond to the four movement directions, and the last column showsthe scores calculated by Fisher criterion (FC). Each color map was calculated by averaging the wavelet coefficients over all trials of the same class. Each rowcorresponds to the wavelet coefficients associated with the same time-frequency window. Red color indicates large value and blue color indicates small value. Allplots of wavelet coefficients share the same color scale, and all plots of FC scores share the same color scale.
TABLE INUMBER OF SUCCESSFUL TRIALS PER CLASS OF EACH DATA SET
During the experiment, MEG data were acquired by using a306-channel whole-head MEG system (Elekta Neuromag) with1 kHz sampling frequency. In addition, electrooculography(EOG) was used to monitor eye blinks and eye movements.Electromyography (EMG) of wrist flexor and extensor muscleswas recorded to make sure that no movement happened duringthe imagined sessions. All trials with EOG or EMG contami-nation were rejected.
All five subjects performed both overt and imagined move-ments in the experiment, resulting in a total of ten data sets. Thenumber of successful trials in each data set was not the sameafter rejecting contaminated repetitions. This number was ad-justed for each data set among the four classes (i.e., up, down,left, and right) such that each class in the same data set had thesame number of successful trials. In other words, we discardedthe last few trials for the classes with more trials than the others.Table I summarizes the data set size for the aforementioned ex-perimental setup.
B. Data Preprocessing
The recorded MEG signals were processed by the signalspace separation (SSS) method [20] to remove the interferencesignals due to magnetic impurities (e.g., sensor electronics,electrical activities from arm muscles, etc.). SSS also com-pensated the signal distortions caused by head movement.Next, a notch filter was applied to remove the 60 Hz powerline interference. A linear approximation was then determinedby least-squares fitting for each channel and each trial, andthe linear trends were subtracted from the recorded MEGsignals. In this study, although the MEG signals contained 306channels, only 74 channels were used for decoding. These 74channels correspond to the gradiometers located on top of the
sensorimotor area, as shown in Fig. 3(a). They are expected tocarry useful information about the motor activity in which weare interested.
There are many possible ways to extract features from brainsignals, including wavelet coefficients [21], [22], power spec-tral density [3], [10], [23], autoregressive model [6], [7], [12],etc. Previous neuroscience research on MEG-based BCI demon-strated that significant power modulation of MEG activity wasobserved in three different frequency bands [8]: 1) 7 Hz (low-frequency band), 2) 62–87 Hz, and 3) 10–30 Hz. In [8], the au-thors further mentioned that movement directions could be in-ferred from the low-frequency band only, but not from the othertwo bands. In addition, the important neural activity that car-ries movement information was observed during a short timewindow [8]. For these reasons, we only considered the low-fre-quency band for the time window , where
represented target onset. We applied discrete wavelet trans-form with second-order Symlet wavelet function [30] to decom-pose the MEG signals from each channel and each trial to mul-tiple resolution levels. Six wavelet coefficients corresponding tothe selected time-frequency window were used to represent thefeatures for each channel. Here, each time-frequency windowis around 60 ms in length and covers the low frequency band( 7 Hz). Since 74 channels are considered in total, the dimen-sionality of the feature space is: . Eachwavelet coefficient (i.e., the feature) is correlated to the signalenergy in a specific time-frequency window of a given channel.Taking the overt case of SubC as an example, Fig. 3(b) and (c)shows the spatial distribution of the selected wavelet coefficientsfor four different classes.
C. Feature Clustering
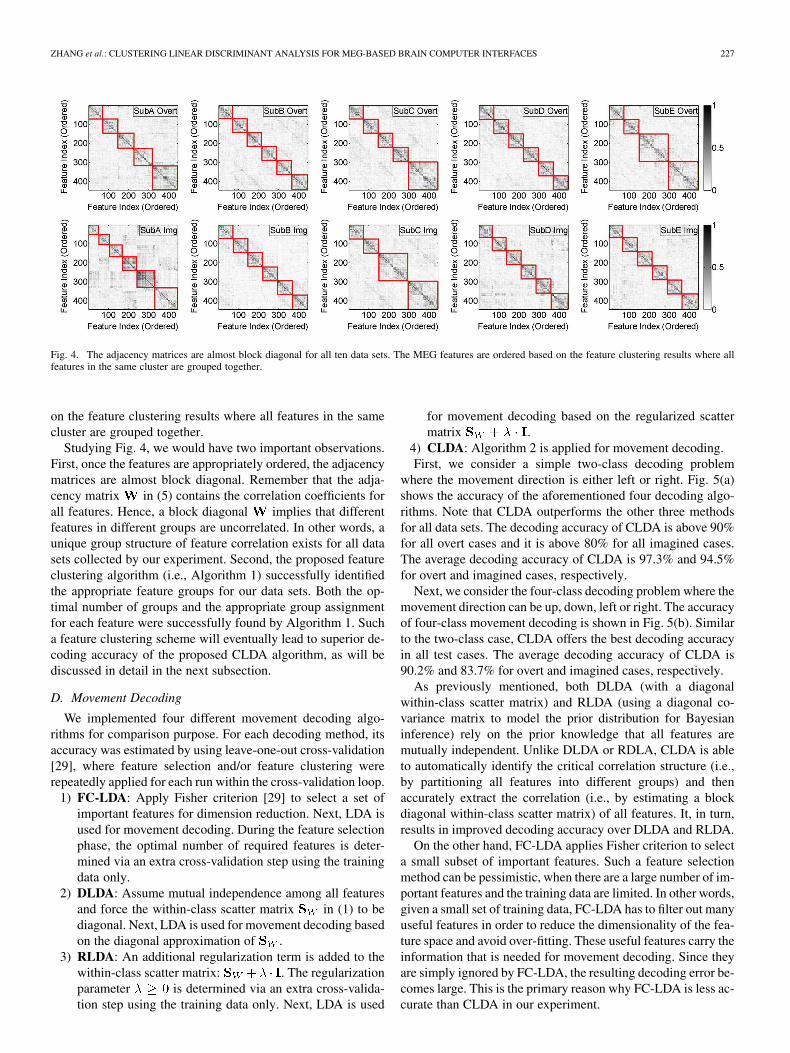
Given the MEG features extracted in the previous subsection,we applied Algorithm 1 to partition these features into severalgroups. The optimal number of groups (i.e., ) was auto-matically determined by evaluating the clustering quality in Al-gorithm 1. Note that can be different for different datasets. Fig. 4 shows the adjacency matrices [i.e., in (5)] forall ten data sets. In Fig. 4, the MEG features are ordered based
ZHANG et al.: CLUSTERING LINEAR DISCRIMINANT ANALYSIS FOR MEG-BASED BRAIN COMPUTER INTERFACES 227
Fig. 4. The adjacency matrices are almost block diagonal for all ten data sets. The MEG features are ordered based on the feature clustering results where allfeatures in the same cluster are grouped together.
on the feature clustering results where all features in the samecluster are grouped together.
Studying Fig. 4, we would have two important observations.First, once the features are appropriately ordered, the adjacencymatrices are almost block diagonal. Remember that the adja-cency matrix in (5) contains the correlation coefficients forall features. Hence, a block diagonal implies that differentfeatures in different groups are uncorrelated. In other words, aunique group structure of feature correlation exists for all datasets collected by our experiment. Second, the proposed featureclustering algorithm (i.e., Algorithm 1) successfully identifiedthe appropriate feature groups for our data sets. Both the op-timal number of groups and the appropriate group assignmentfor each feature were successfully found by Algorithm 1. Sucha feature clustering scheme will eventually lead to superior de-coding accuracy of the proposed CLDA algorithm, as will bediscussed in detail in the next subsection.
D. Movement Decoding
We implemented four different movement decoding algo-rithms for comparison purpose. For each decoding method, itsaccuracy was estimated by using leave-one-out cross-validation[29], where feature selection and/or feature clustering wererepeatedly applied for each run within the cross-validation loop.
1) FC-LDA: Apply Fisher criterion [29] to select a set ofimportant features for dimension reduction. Next, LDA isused for movement decoding. During the feature selectionphase, the optimal number of required features is deter-mined via an extra cross-validation step using the trainingdata only.
2) DLDA: Assume mutual independence among all featuresand force the within-class scatter matrix in (1) to bediagonal. Next, LDA is used for movement decoding basedon the diagonal approximation of .
3) RLDA: An additional regularization term is added to thewithin-class scatter matrix: . The regularizationparameter is determined via an extra cross-valida-tion step using the training data only. Next, LDA is used
for movement decoding based on the regularized scattermatrix .
4) CLDA: Algorithm 2 is applied for movement decoding.First, we consider a simple two-class decoding problem
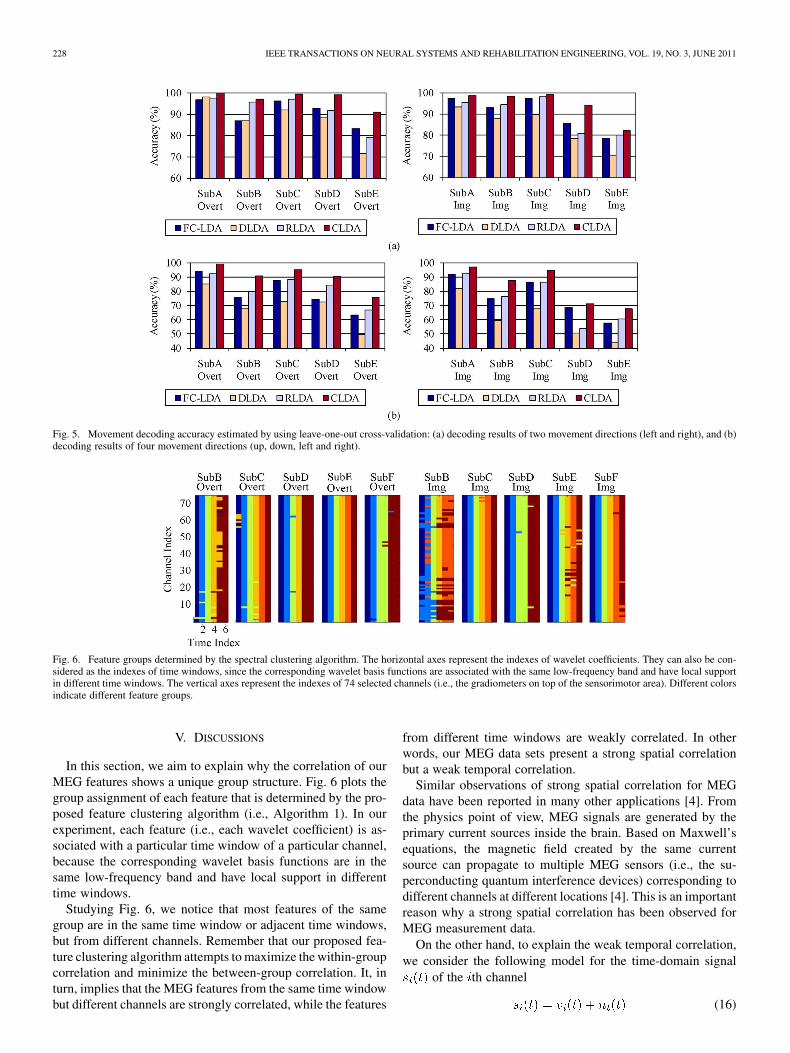
where the movement direction is either left or right. Fig. 5(a)shows the accuracy of the aforementioned four decoding algo-rithms. Note that CLDA outperforms the other three methodsfor all data sets. The decoding accuracy of CLDA is above 90%for all overt cases and it is above 80% for all imagined cases.The average decoding accuracy of CLDA is 97.3% and 94.5%for overt and imagined cases, respectively.
Next, we consider the four-class decoding problem where themovement direction can be up, down, left or right. The accuracyof four-class movement decoding is shown in Fig. 5(b). Similarto the two-class case, CLDA offers the best decoding accuracyin all test cases. The average decoding accuracy of CLDA is90.2% and 83.7% for overt and imagined cases, respectively.
As previously mentioned, both DLDA (with a diagonalwithin-class scatter matrix) and RLDA (using a diagonal co-variance matrix to model the prior distribution for Bayesianinference) rely on the prior knowledge that all features aremutually independent. Unlike DLDA or RDLA, CLDA is ableto automatically identify the critical correlation structure (i.e.,by partitioning all features into different groups) and thenaccurately extract the correlation (i.e., by estimating a blockdiagonal within-class scatter matrix) of all features. It, in turn,results in improved decoding accuracy over DLDA and RLDA.
On the other hand, FC-LDA applies Fisher criterion to selecta small subset of important features. Such a feature selectionmethod can be pessimistic, when there are a large number of im-portant features and the training data are limited. In other words,given a small set of training data, FC-LDA has to filter out manyuseful features in order to reduce the dimensionality of the fea-ture space and avoid over-fitting. These useful features carry theinformation that is needed for movement decoding. Since theyare simply ignored by FC-LDA, the resulting decoding error be-comes large. This is the primary reason why FC-LDA is less ac-curate than CLDA in our experiment.
228 IEEE TRANSACTIONS ON NEURAL SYSTEMS AND REHABILITATION ENGINEERING, VOL. 19, NO. 3, JUNE 2011
Fig. 5. Movement decoding accuracy estimated by using leave-one-out cross-validation: (a) decoding results of two movement directions (left and right), and (b)decoding results of four movement directions (up, down, left and right).
Fig. 6. Feature groups determined by the spectral clustering algorithm. The horizontal axes represent the indexes of wavelet coefficients. They can also be con-sidered as the indexes of time windows, since the corresponding wavelet basis functions are associated with the same low-frequency band and have local supportin different time windows. The vertical axes represent the indexes of 74 selected channels (i.e., the gradiometers on top of the sensorimotor area). Different colorsindicate different feature groups.
V. DISCUSSIONS
In this section, we aim to explain why the correlation of ourMEG features shows a unique group structure. Fig. 6 plots thegroup assignment of each feature that is determined by the pro-posed feature clustering algorithm (i.e., Algorithm 1). In ourexperiment, each feature (i.e., each wavelet coefficient) is as-sociated with a particular time window of a particular channel,because the corresponding wavelet basis functions are in thesame low-frequency band and have local support in differenttime windows.
Studying Fig. 6, we notice that most features of the samegroup are in the same time window or adjacent time windows,but from different channels. Remember that our proposed fea-ture clustering algorithm attempts to maximize the within-groupcorrelation and minimize the between-group correlation. It, inturn, implies that the MEG features from the same time windowbut different channels are strongly correlated, while the features
from different time windows are weakly correlated. In otherwords, our MEG data sets present a strong spatial correlationbut a weak temporal correlation.
Similar observations of strong spatial correlation for MEGdata have been reported in many other applications [4]. Fromthe physics point of view, MEG signals are generated by theprimary current sources inside the brain. Based on Maxwell’sequations, the magnetic field created by the same currentsource can propagate to multiple MEG sensors (i.e., the su-perconducting quantum interference devices) corresponding todifferent channels at different locations [4]. This is an importantreason why a strong spatial correlation has been observed forMEG measurement data.
On the other hand, to explain the weak temporal correlation,we consider the following model for the time-domain signal
of the th channel
(16)
ZHANG et al.: CLUSTERING LINEAR DISCRIMINANT ANALYSIS FOR MEG-BASED BRAIN COMPUTER INTERFACES 229
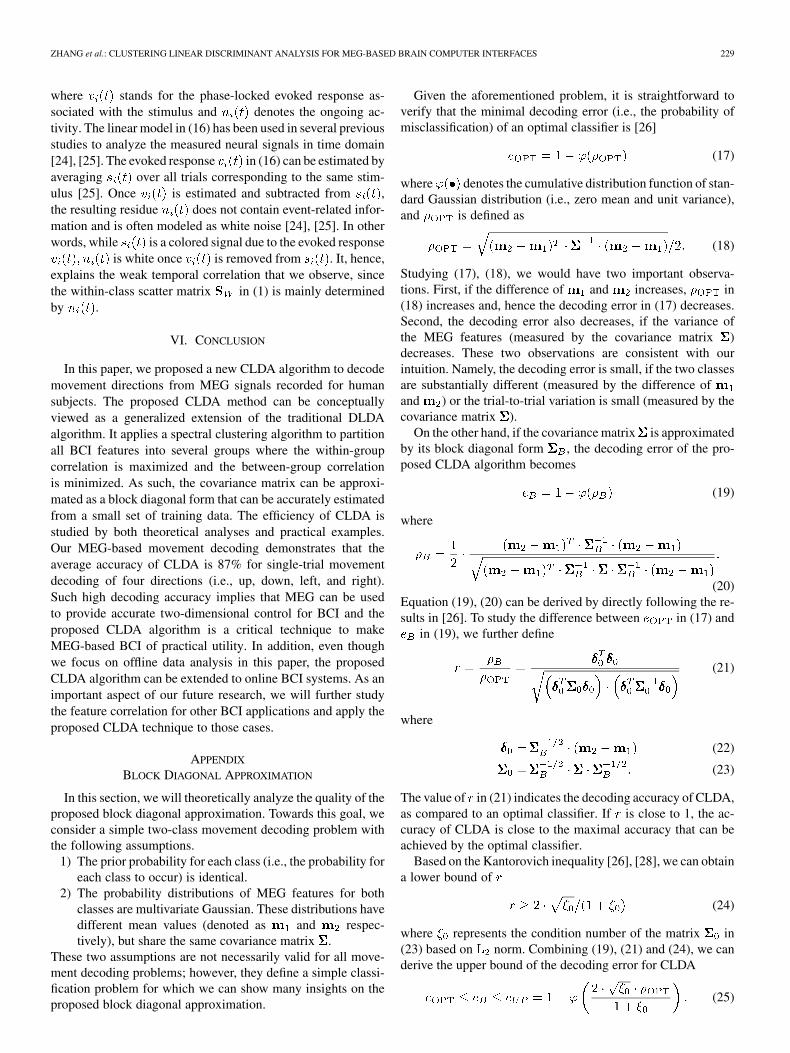
where stands for the phase-locked evoked response as-sociated with the stimulus and denotes the ongoing ac-tivity. The linear model in (16) has been used in several previousstudies to analyze the measured neural signals in time domain[24], [25]. The evoked response in (16) can be estimated byaveraging over all trials corresponding to the same stim-ulus [25]. Once is estimated and subtracted from ,the resulting residue does not contain event-related infor-mation and is often modeled as white noise [24], [25]. In otherwords, while is a colored signal due to the evoked response
is white once is removed from . It, hence,explains the weak temporal correlation that we observe, sincethe within-class scatter matrix in (1) is mainly determinedby .
VI. CONCLUSION
In this paper, we proposed a new CLDA algorithm to decodemovement directions from MEG signals recorded for humansubjects. The proposed CLDA method can be conceptuallyviewed as a generalized extension of the traditional DLDAalgorithm. It applies a spectral clustering algorithm to partitionall BCI features into several groups where the within-groupcorrelation is maximized and the between-group correlationis minimized. As such, the covariance matrix can be approxi-mated as a block diagonal form that can be accurately estimatedfrom a small set of training data. The efficiency of CLDA isstudied by both theoretical analyses and practical examples.Our MEG-based movement decoding demonstrates that theaverage accuracy of CLDA is 87% for single-trial movementdecoding of four directions (i.e., up, down, left, and right).Such high decoding accuracy implies that MEG can be usedto provide accurate two-dimensional control for BCI and theproposed CLDA algorithm is a critical technique to makeMEG-based BCI of practical utility. In addition, even thoughwe focus on offline data analysis in this paper, the proposedCLDA algorithm can be extended to online BCI systems. As animportant aspect of our future research, we will further studythe feature correlation for other BCI applications and apply theproposed CLDA technique to those cases.
APPENDIX
BLOCK DIAGONAL APPROXIMATION
In this section, we will theoretically analyze the quality of theproposed block diagonal approximation. Towards this goal, weconsider a simple two-class movement decoding problem withthe following assumptions.
1) The prior probability for each class (i.e., the probability foreach class to occur) is identical.
2) The probability distributions of MEG features for bothclasses are multivariate Gaussian. These distributions havedifferent mean values (denoted as and respec-tively), but share the same covariance matrix .
These two assumptions are not necessarily valid for all move-ment decoding problems; however, they define a simple classi-fication problem for which we can show many insights on theproposed block diagonal approximation.
Given the aforementioned problem, it is straightforward toverify that the minimal decoding error (i.e., the probability ofmisclassification) of an optimal classifier is [26]
(17)
where denotes the cumulative distribution function of stan-dard Gaussian distribution (i.e., zero mean and unit variance),and is defined as
(18)
Studying (17), (18), we would have two important observa-tions. First, if the difference of and increases, in(18) increases and, hence the decoding error in (17) decreases.Second, the decoding error also decreases, if the variance ofthe MEG features (measured by the covariance matrix )decreases. These two observations are consistent with ourintuition. Namely, the decoding error is small, if the two classesare substantially different (measured by the difference ofand ) or the trial-to-trial variation is small (measured by thecovariance matrix ).
On the other hand, if the covariance matrix is approximatedby its block diagonal form , the decoding error of the pro-posed CLDA algorithm becomes
(19)
where
(20)Equation (19), (20) can be derived by directly following the re-sults in [26]. To study the difference between in (17) and
in (19), we further define
(21)
where
(22)
(23)
The value of in (21) indicates the decoding accuracy of CLDA,as compared to an optimal classifier. If is close to 1, the ac-curacy of CLDA is close to the maximal accuracy that can beachieved by the optimal classifier.
Based on the Kantorovich inequality [26], [28], we can obtaina lower bound of
(24)
where represents the condition number of the matrix in(23) based on norm. Combining (19), (21) and (24), we canderive the upper bound of the decoding error for CLDA
(25)
230 IEEE TRANSACTIONS ON NEURAL SYSTEMS AND REHABILITATION ENGINEERING, VOL. 19, NO. 3, JUNE 2011
Note that the accuracy of CLDA strongly depends on . If issufficiently small, is close to . Namely, the accuracyof CLDA is close to that of an optimal classifier. In the extremecase, if the covariance matrix is exactly block diagonal, wehave , and . Therefore, CLDA is equiv-alent to the optimal classifier and both of them yield the samedecoding accuracy. This result provides theoretical guidelinesto quantitatively assess the quality of the proposed block diag-onal approximation for CLDA.
REFERENCES
[1] J. Vidal, “Toward direct brain-computer communication,” Annu. Rev.Biophys. Bioeng., vol. 2, pp. 157–180, 1973.
[2] J. Wolpaw, N. Birbaumer, W. Heetderks, D. McFarland, P. Peckham,G. Schalk, E. Donchin, L. Quatrano, C. Robinson, and T. Vaughan,“Brain-computer interface technology: A review of the first interna-tional meeting,” IEEE Trans. Rehab. Eng., vol. 8, no. 2, pp. 164–173,Jun. 2000.
[3] G. Pfurtscheller, C. Neuper, C. Guger, W. Harkam, H. Ramoser, A.Schlogl, B. Obermaier, and M. Pregenzer, “Current trends in Grazbrain-computer interface (BCI) research,” IEEE Trans. Rehab. Eng.,vol. 8, no. 2, pp. 216–219, Jun. 2000.
[4] M. Hamalainen, R. Hari, R. Ilmoniemi, J. Knuutila, and O. Lounasmaa,“Magnetoencephalography—Theory, instrumentation, and applica-tions to noninvasive studies of the working human brain,” Rev. ModernPhys., vol. 65, no. 2, pp. 413–497, 1993.
[5] B. He and Z. Liu, “Multimodal functional neuroimaging: Integratingfunctional MRI and EEG/MEG,” IEEE Rev. Biomed. Eng., vol. 1, pp.23–40, 2008.
[6] T. Lal, M. Schroder, N. Hill, H. Preissl, T. Hinterberger, J. Mellinger,M. Bogdan, W. Rosenstiel, T. Hofmann, N. Birbaumer, and B.Scholkopf, “A brain computer interface with online feedback basedon magnetoencephalography,” in Proc. Int. Conf. Mach. Learn., 2005,pp. 465–472.
[7] J. Mellinger, G. Schalk, C. Braun, H. Preissl, W. Rosenstiel, N. Bir-baumer, and A. Kuebler, “An MEG-based brain-computer interface(BCI),” NeuroImage, vol. 36, pp. 581–593, Jul. 2007.
[8] S. Waldert, H. Preissl, E. Demandt, B. Christoph, B. Niels, A. Aertsen,and C. Mehring, “Hand movement direction decoded from MEG andEEG,” J. Neurosci., vol. 28, no. 4, pp. 1000–1008, Jan. 2008.
[9] W. Wang, G. Sudre, R. Kass, J. Collinger, A. Degenhart, A. Bagic,and D. Weber, “Decoding and cortical source localization for intendedmovement direction with MEG,” J. Neurophysiol., vol. 104, pp.2451–2461, Aug. 2010.
[10] P. Shenoy, K. Miller, J. Ojemann, and R. Rao, “Generalized featuresfor electrocorticographic BCIs,” IEEE Trans. Biomed. Eng., vol. 55,no. 1, pp. 273–280, Jan. 2008.
[11] J. Kronegg, G. Chanel, and S. Voloshynovskiy, “EEG-based synchro-nized brain-computer interfaces: A model for optimizing the numberof mental tasks,” IEEE Trans. Neural Syst. Rehabil. Eng., vol. 15, no.1, pp. 50–58, Mar. 2007.
[12] T. Lal, M. Schroder, T. Hinterberger, J. Weston, M. Bogdan, N. Bir-baumer, and B. Scholkopf, “Support vector channel selection in BCI,”IEEE Trans. Biomed. Eng., vol. 51, no. 6, pp. 1003–1010, Jun. 2004.
[13] H. Ramoser, J. Mueller-Gerking, and G. Pfurtscheller, “Optimal spatialfiltering of single trial EEG during imagined hand movement,” IEEETrans. Rehabil. Eng., vol. 8, no. 4, pp. 441–446, Dec. 2000.
[14] G. Blancharda and B. Blankertz, “BCI competition 2003—Data set IIa:Spatial patterns of self-controlled brain rhythm modulations,” IEEETrans. Biomed. Eng., vol. 51, no. 6, pp. 1062–1066, Jun. 2004.
[15] M. Grosse-Wentrup and M. Buss, “Multiclass common spatial patternsand information theoretic feature extraction,” IEEE Trans. Biomed.Eng., vol. 55, no. 8, pp. 1991–2000, Aug. 2008.
[16] A. Ng, M. Jordan, and Y. Weiss, “On spectral clustering: Analysisand an algorithm,” in Proc. Adv. Neural Inf. Process. Syst., 2001, pp.849–856.
[17] F. Bach and M. Jordan, “Learning spectral clustering,” in Proc. Adv.Neural Inf. Process. Syst., 2004, pp. 305–312.
[18] M. Newman and M. Girvan, “Finding and evaluating community struc-ture in networks,” Phys. Rev. E, vol. 69, no. 026113, 2004.
[19] U. Luxburg, “A tutorial on spectral clustering,” Stat. Comput., vol. 17,no. 4, pp. 395–416, 2007.
[20] S. Taulu, J. Simola, and M. Kajola, “Applications of the signal spaceseparation method,” IEEE Trans. Signal Process., vol. 53, no. 9, pp.3359–3372, Sep. 2005.
[21] I. Clark, R. Biscay, M. Echeverria, and T. Virues, “Multiresolutiondecomposition of non-stationary EEG signals: A preliminary study,”Comput. Biol. Med., vol. 25, no. 4, pp. 373–382, Jul. 1995.
[22] B. Graimann, J. Huggins, S. Levine, and G. Pfurtscheller, “Towarda direct brain interface based on human subdural recordings andwavelet-packet analysis,” IEEE Trans. Biomed. Eng., vol. 51, no. 6,pp. 954–962, Jun. 2004.
[23] E. Leuthardt, G. Schalk, J. Wolpaw, J. Ojemann, and D. Moran,“A brain-computer interface using electrocorticographic signals inhumans,” J. Neural Eng., vol. 1, no. 2, pp. 63–71, 2004.
[24] P. Karjalainen, J. Kaipio, A. Koistinen, and M. Vauhkonen, “Subspaceregularization method for the single-trial estimation of evoked poten-tials,” IEEE Trans. Biomed. Eng., vol. 46, no. 7, pp. 849–860, Jul. 1999.
[25] W. Truccolo, M. Ding, K. Knuth, R. Nakamura, and S. Bressler,“Trial-to-trial variability of cortical evoked responses: Implicationsfor the analysis of functional connectivity,” Clin. Neurophysiol., vol.113, pp. 206–226, 2002.
[26] P. Bickel and E. Levina, “Some theory for fisher’s linear discrimi-nant function, ‘naive Bayes’, and some alternatives when there aremany more variables than observations,” Bernoulli, vol. 10, no. 6, pp.989–1010, 2004.
[27] F. Chung, Spectral Graph Theory. Providence, RI: Am. Math. Soc.,1997.
[28] D. Luenberger, Linear and Nonlinear Programming. Reading, MA:Addison-Wesley, 1984.
[29] C. Bishop, Pattern Recognition and Machine Learning. New York:Springer, 2006.
[30] D. Percival and A. Walden, Wavelet Methods for Time Series Ana-ysis. Cambridge, U.K.: Cambridge Univ. Press, 2006.
Jinyin Zhang (S’11) received the B.S. and M.S.degrees in computer science from Beijing Universityof Astronautics and Aeronautics, Beijing, China,in 2002 and 2005, respectively. She is currentlyworking toward the Ph.D. degree in electrical andcomputer engineering at Carnegie Mellon Uni-versity, Pittsburgh, PA, advised by Dr. X. Li. Herresearch interests include signal processing, machinelearning and optimization with specific interests intheir application to neural signal processing.
Gustavo Sudre (S’06) received the B.S. degreein computer science at the University of Kansasin 2006, where he performed research on artificialintelligence, data mining, and knowledge representa-tion. He received the M.S. degree in bioengineeringat the University of Pittsburgh, Pittsburgh, PA, in2008, where he was advised by Dr. D. Weber andused MEG to investigate the influence of somatosen-sory input in motor cortex activity. He is currentlyworking toward the Ph.D. degree in neural computa-tion at Carnegie Mellon University, Pittsburgh, PA,
advised by Dr. T. Michell, and combines brain imaging data with machinelearning techniques to investigate knowledge representation in the brain.
Xin Li (M’01–SM’06) received the B.S. and M.S. de-grees in electronics engineering from Fudan Univer-sity, Shanghai, China, in 1998 and 2001, respectively,and the Ph.D. degree in electrical and computer engi-neering from Carnegie Mellon University, Pittsburgh,PA, in 2005,
He is currently an Assistant Professor in the De-partment of Electrical and Computer Engineering,Carnegie Mellon University, Pittsburgh, PA. In 2005,he co-founded Xigmix Inc. to commercialize hisPh.D. research, and served as the Chief Technical
Officer until the company was acquired in 2007. Since 2009, he has been ap-pointed as the Assistant Director for FCRP Focus Research Center for Circuit& System Solutions (C2S2). His research interests include computer-aideddesign, neural signal processing, and power system analysis and design.
ZHANG et al.: CLUSTERING LINEAR DISCRIMINANT ANALYSIS FOR MEG-BASED BRAIN COMPUTER INTERFACES 231
Wei Wang received the M.D. degree from PekingUniversity Health Science Center, Beijing, China,in 1999, the M.Sc. degree in biomedical engineeringfrom University of Tennessee Health Science Center,Memphis, TN, in 2002, and the Ph.D. degree inbiomedical engineering from Washington University,St. Louis, MO, in 2006.
Prior to joining the University of Pittsburgh in2007, he served as a Senior Scientist at St. Jude Med-ical, Inc., Sylmar, CA. He is currently an AssistantProfessor in the Department of Physical Medicine
and Rehabilitation with a secondary appointment in the Department of Bioengi-neering and the Clinical and Translational Sciences Institute at the Universityof Pittsburgh, Pittsburgh, PA. His current research interests include neuralengineering, motor neuroprosthetics, brain–computer interface, ECoG, MEG,rehabilitation of movement disorders, and motor system neurophysiology.
Douglas J. Weber (M’94) received the B.S. degree inbiomedical engineering from the Milwaukee Schoolof Engineering in Milwaukee, WI, in 1994 and theM.S. and Ph.D. degrees in bioengineering from Ari-zona State University, Tempe, AZ, in 2000 and 2001,respectively.
He is currently an Assistant Professor in the De-partment of Physical Medicine and Rehabilitation,University of Pittsburgh, Pittsburgh, PA. He is also afaculty member in the Department of Bioengineeringand the Center for the Neural Basis of Cognition.
Previously, he was a Postdoctoral Fellow and then an Assistant Professor inthe Centre for Neuroscience at the University of Alberta, Edmonton, AB,Canada. His primary research area is neural engineering. Specific researchinterests include functional electrical stimulation, activity-based neuromotorrehabilitation, neural coding, and neural control of prosthetic devices.
Anto Bagic is a Neurologist at Georgetown Uni-versity, Washington, DC, sub-specialized clinicalneurophysiology, epilepsy, sleep disorders, andmagnetoencephalography, National Institutes ofHealth (NIH), Bethesda, MD. His clinical practiceis focused on epilepsy and similar paroxysmal dis-orders. He is an Associate Professor of Neurology,Chief of Epilepsy Division, Director of the Univer-sity of Pittsburgh Comprehensive Epilepsy Center(UPCEC), Founding Director of the 1st Centerfor Advanced Brain Magnetic Source Imaging
(CABMSI), Pittsburgh, PA, Director of the UPMC MEG Epilepsy Programand Chief Scientific Advisor for MEG Research at University of Pittsburgh,Pittsburgh, PA. His research interests include applications of MEG in studyingfundamental neural processes as they pertain to neurological disorders.


![IEEE TRANSACTIONS ON NEURAL NETWORKS AND LEARNING …xiaopingwu.cn/assets/paper/tnnls2019_spbl.pdf · 2020-04-20 · 2 IEEE TRANSACTIONS ON NEURAL NETWORKS AND LEARNING SYSTEMS [19],](https://img.pdfslide.us/doc/110x75/5f0ffba07e708231d446db9c/ieee-transactions-on-neural-networks-and-learning-2020-04-20-2-ieee-transactions.jpg)