Embed Size (px)
Citation preview

Therapeutics, Targets, and Chemical Biology
IDH1 Mutations Alter Citric Acid Cycle Metabolism andIncrease Dependence on Oxidative MitochondrialMetabolism
Alexandra R. Grassian1, Seth J. Parker4, Shawn M. Davidson3, Ajit S. Divakaruni5, Courtney R. Green4,Xiamei Zhang1, Kelly L. Slocum1, Minying Pu1, Fallon Lin1, Chad Vickers1, Carol Joud-Caldwell1,Franklin Chung1, Hong Yin1, Erika D. Handly4, Christopher Straub1, Joseph D. Growney1,Matthew G. Vander Heiden2,3, Anne N. Murphy5, Raymond Pagliarini1, and Christian M. Metallo4,6
AbstractOncogenic mutations in isocitrate dehydrogenase 1 and 2 (IDH1/2) occur in several types of cancer, but the
metabolic consequences of these genetic changes are not fully understood. In this study, we performed 13Cmetabolic flux analysis on a panel of isogenic cell lines containing heterozygous IDH1/2 mutations. We observedthat under hypoxic conditions, IDH1-mutant cells exhibited increased oxidative tricarboxylic acid metabolismalong with decreased reductive glutamine metabolism, but not IDH2-mutant cells. However, selective inhibitionof mutant IDH1 enzyme function could not reverse the defect in reductive carboxylation activity. Furthermore,this metabolic reprogramming increased the sensitivity of IDH1-mutant cells to hypoxia or electron transportchain inhibition in vitro. Lastly, IDH1-mutant cells also grew poorly as subcutaneous xenografts within a hypoxicin vivo microenvironment. Together, our results suggest therapeutic opportunities to exploit the metabolicvulnerabilities specific to IDH1 mutation. Cancer Res; 74(12); 1–15. �2014 AACR.
IntroductionMutations in the metabolic enzymes isocitrate dehydroge-
nase 1 and 2 (IDH1/2) have been identified in a variety of tumortypes, including acute myelogenous leukemia (AML), gliomas,cholangiocarcinomas, and chondrosarcomas (1–9). Thesemuta-tions are almost exclusively heterozygous point mutations thatoccur in specific residues within the catalytic pocket, and aresuggestive of activating, oncogenic mutations. Although IDHmutants are no longer capable of efficiently carrying out thenormal oxidative reaction [converting isocitrate and NADPþ toa-ketoglutarate (aKG), CO2, and NADPH), IDHmutations resultin a novel gain-of-function involving the reductive, NADPH-dependent conversion of aKG to (D)2-hydroxyglutarate (2-HG;
refs. 10, 11). 2-HG is not typically present at high levels in normalcells but accumulates considerably in cells with IDH1/2 muta-tions as well as in the tumors of patients with IDH1/2mutations,and has thus been termed an "oncometabolite" (10–12).
Research into the oncogenic function of mutant IDH1/2 hasfocused in large part on the effects of 2-HG. Numerous reportshave linked 2-HG accumulation to epigenetic changes, whichare thought to contribute to alterations in cellular differenti-ation status (13–22). Additional mutant IDH phenotypes havealso been reported, including changes in collagen maturationand hypoxia inducible factor-1a (HIF1a) stabilization (21, 23).These changes likely occur through inhibition of aKG-depen-dent dioxygenase activity by high levels of 2-HG. However, thediverse roles thataKG-dependent dioxygenases play in the celland the numerous phenotypes associated with mutant IDHand 2-HG suggest that the phenotypes downstream of 2-HGinduction could be cell type- or context-specific. We hypoth-esize that metabolic alterations induced by IDH mutationsmay also be present and might be a general phenotype thatoffers additional approaches to target these tumors. Previouswork suggests that overexpression of mutant IDH alters thelevels of several metabolites (24) and leads to increased sen-sitivity to glutaminase inhibitors (25). Studies by Leonardi andcolleagues have indicated that the IDH1-mutant enzymescompromise the ability of this enzyme to catalyze the reductivecarboxylation reaction (26). However, it is unclear howIDH mutations affect central carbon metabolism in the het-erozygous cellular setting, and further exploration into howthese metabolic differences could be therapeutically exploitedis warranted. An important distinction between IDH1 andIDH2 is their localization in the cytosol/peroxisome and
Authors' Affiliations: 1Novartis Institutes for Biomedical Research;2Koch Institute for Cancer Research, 3Massachusetts Institute of Tech-nology, Cambridge, Massachusetts; Departments of 4Bioengineeringand 5Pharmacology; and 6Moores Cancer Center, University of Califor-nia, San Diego, La Jolla, California
Note: Supplementary data for this article are available at Cancer ResearchOnline (http://cancerres.aacrjournals.org/).
A.R. Grassian and S.J. Parker contributed equally to this work.
Current address of A.R. Grassian: Epizyme, Cambridge, MA.
CorrespondingAuthors:ChristianM.Metallo, University ofCalifornia, SanDiego, 9500 Gilman Drive, MC-0412, La Jolla, CA 92093. Phone: 858-534-8209; Fax: 858-534-5722; E-mail: [email protected]; and RaymondPagliarini, Novartis Institutes for Biomedical Research, 250MassachusettsAvenue, Cambridge, MA 02139. Phone: 617-871-4307; E-mail:[email protected]
doi: 10.1158/0008-5472.CAN-14-0772-T
�2014 American Association for Cancer Research.
CancerResearch
www.aacrjournals.org OF1
Research. on September 4, 2018. © 2014 American Association for Cancercancerres.aacrjournals.org Downloaded from
Published OnlineFirst April 22, 2014; DOI: 10.1158/0008-5472.CAN-14-0772-T
Parental normoxia
Parental hypoxiaIDH1 R132H/+ normoxia
IDH1 R132H/+ hypoxia
60
50
40
30
20
10
0Citr
ate
MID
from
[U-13
C5]g
luta
min
e (%
)
M0 M1 M2 M3 M4 M5 M6
A B
Gln Glu 2-HG
0.08
0.06
0
0.04
0.02
Parental normoxia
Parental hypoxiaIDH1 R132H/+ normoxia
IDH1 R132H/+ hypoxia
I
Cit
αKG
SucFum
Mal
Oac
Glu
Gln
CitAcCoA
Oac
AcCoA
Palmitate
Mal
Glc
Fum
Asp
PyrReductive Metabolism
Oxidative Metabolism
Lipo
geni
c A
cCoA
from
[5-13
C]g
luta
min
e (%
)
Paren
tal
IDH1
R132H
/+0
5
10
15
20
25
30
35
40 NormoxiaHypoxia
C D
4
0
8
12
16
20Oxidative IDH flux
Citrate αKG + CO212
10
8
6
4
2
0
Reductive IDH fluxαKG + CO2 Citrate 60
50
40
30
20
10
0
Flu
x (f
mol
/cel
l*hr
)
Glutamine anaplerosisGlutamate αKG
HF
Flu
x (f
mol
/cel
l*hr
)
Flu
x (f
mol
/cel
l*hr
)
1.6
1.2
0
0.8
0.4
Glucose Lactate
Upt
ake/
secr
etio
n flu
x (p
mol
/cel
l*hr
)
G
Flu
x (f
mol
/cel
l*hr
)
αKGDH fluxαKG Suc + CO2
0
10
20
30
40
50
60
70
Normoxia Hypoxia
E
Par
IDH
1R
132H
/+
Par
IDH
1R
132H
/+
Normoxia Hypoxia
Par
IDH
1R
132H
/+
Par
IDH
1R
132H
/+
Normoxia Hypoxia
Par
IDH
1R
132H
/+
Par
IDH
1R
132H
/+
Normoxia Hypoxia
Par
IDH
1R
132H
/+
Par
IDH
1R
132H
/+
Pyr*
Cit
aKG Mal*
Oac*
AcCoA*
Glu
Gln
Gluc
Lac
HCT116 parental hypoxia (2%) vs. normoxia (21%)
AcCoA* Lipids
Fum*
Pyr*
Cit
aKG Mal*
Oac*
AcCoA*
Glu
Gln
Gluc
Lac
HCT116 IDH1 R132H/+ 2H1 vs. parentalhypoxia (2%)
AcCoA* Lipids
Fum*
0.5
5
50
100
Metabolite flux (fmol/cell/hr)
500
1500
2x decrease
3x increase
2x increase
Change in flux
2.5x increase 1.5x decrease
2.5x decrease
No change
1.5x increase No change 10x decrease
M5
10
0
15
5
Upt
ake/
secr
etio
n flu
x (p
mol
/cel
l*hr
)
Grassian et al.
Cancer Res; 74(12) June 15, 2014 Cancer ResearchOF2
Research. on September 4, 2018. © 2014 American Association for Cancercancerres.aacrjournals.org Downloaded from
Published OnlineFirst April 22, 2014; DOI: 10.1158/0008-5472.CAN-14-0772-T

mitochondria, respectively, which may influence the ultimatemetabolic phenotype of tumor cells with mutations in eitherenzyme.Systems-based approaches that use stable isotope tracers (e.g.,
[13C]glutamine), mass spectrometry, and network modelingto estimate metabolic fluxes offer a unique means of character-izing intracellularmetabolism (27). To understand themetabolicimpact of heterozygous IDH mutation in vitro, we have applied13C metabolic flux analysis (MFA) to a panel of cell lines thatdiffer only with respect to their IDH1- and IDH2-mutant status.Using this approach, we have characterized how cells with wild-type (WT) and mutant IDH1/2 respond to hypoxia and phar-macologic induction of mitochondrial dysfunction.
Materials and MethodsCell cultureHCT116 and MCF-10A isogenic clones were obtained from
Horizon Discovery Ltd and IDH1/2 mutational status wasverified by sequencing (28). HCT116 cells were cultured inMcCoy's 5A Modified Medium with 10% FBS. D-2-HG treat-ments were done at 10mmol/L and replenished every 48 hours.MCF-10A cells were cultured as described previously (28). HT-1080, SW1353, A549, and 143B cells were cultured in DMEMsupplemented with 10% FBS. HT-1080 and SW1353 cells wereobtained from the ATCC, and cells were tested and authenti-cated by single-nucleotide polymorphism fingerprinting. A549cells were obtained from ATCC and were not further tested orauthenticated. 143B cells were kindly provided by Dr. LeonardGuarente (Massachusetts Institute of Technology, Cambridge,MA) and were not further tested or authenticated. Cells wereroutinely cultured in normoxia (21% O2) and then moved tohypoxia (1%–3% O2, as indicated in the figure legends) for48 to 72 hours where indicated. Generation of the r0 cells isdescribed in the Supplementary Methods. Xenograft assays aredescribed in Supplementary Methods.Steady-state labeling of organic, amino, and fatty acids was
accomplished by culturing subconfluent cells in triplicate intracermedium for 72 hours in a 6-well plate. Labeling studies ofHCT116, SW1353,HT1080, A549, and143Bcellswereperformedin glucose or glutamine-free DMEM containing 10% FBS and17.5mmol/L [1,2-13C2]glucose, 4 mmol/L [U-13C5]glutamine, or4 mmol/L [5-13C]glutamine. For the HCT116 isogenic cells, theinitial seeding density was 150,000 cells per well except for theIDH1 R132H/þ 2H1, IDH1 R132C/þ 2A9, and IDH1 R32C/þ3A4, which were 250,000 cells per well. Labeling studies of theMCF-10A cells were done in glutamine-free DMEM containing4 mmol.mg/L [U-13C5]glutamine, 5% horse serum, 20 ng/mL
EGF, 10 mg/mL insulin, 0.5 mg/mL hydrocortisone, and100 ng/mL cholera toxin. Gas chromatographymass spectrom-etry (GC-MS) analysis is described in Supplementary Methods.
MFA13C MFA was conducted using INCA, a software package
based on the EMU framework (http://mfa.vueinnovations.com; ref. 29). Intracellular concentrations of free metabolitesand intra- and extracellularfluxeswere assumed to be constantover the course of the tracing experiment. Fluxes through ametabolic network comprising of glycolysis, the pentose phos-phate pathway, the TCAcycle, biomass synthesis, and fatty acidsynthesis were estimated by minimizing the sum of squaredresiduals between experimental and simulated MIDs andextracellular fluxes using nonlinear least squares regression(30). The best global fit was found after estimating 100 timesusing random initial guesses for all fluxes in the network. A c2
statistical test was applied to assess the goodness-of-fit usingaof 0.01. The 95% confidence intervals for all fluxes in thenetwork were estimated by evaluating the sensitivity of thesum of squared residuals to flux variations (30). IsotopomerSpectral Analysis was performed as previously described (31).See Supplementary Methods for further details of MFA.
ReagentsThe following reagents were used at the doses indicated and
as described in the text/figure legends: [1,2-13C2]glucose,[3-13C]glucose, [U-13C5]glutamine, [1-13C]glutamine, and[5-13C]glutamine (all from Cambridge Isotope Laboratories);IDH-C277 (Xcessbio); HIF1a antibody (610958, BD Bioscinces).Synthesis of IDH1i A is described in Supplementary Methods.
Determination of oxygen consumptionHCT 116 cells were grown at either normoxia or hypoxia (3%
O2), and respiration was measured using an XFe96 analyzer(Seahorse Bioscience). Cell growth and assays at 3% O2 wereconducted using the Coy Dual Hypoxic Chambers for SeahorseXFe Analyzer (Coy Laboratory Products, Inc.) as described inSupplementary Methods.
Proliferation assaysTo calculate doubling time, cells were trypsinized and viable
cells were quantified on a ViCell (Beckman-Coulter). Doublingtimes are presented as the average of three or more indepen-dent experiments.
To generate longer-term growth curves, cells were plated at3,000 cells per well in a 96-well plate in triplicate. Twenty-four
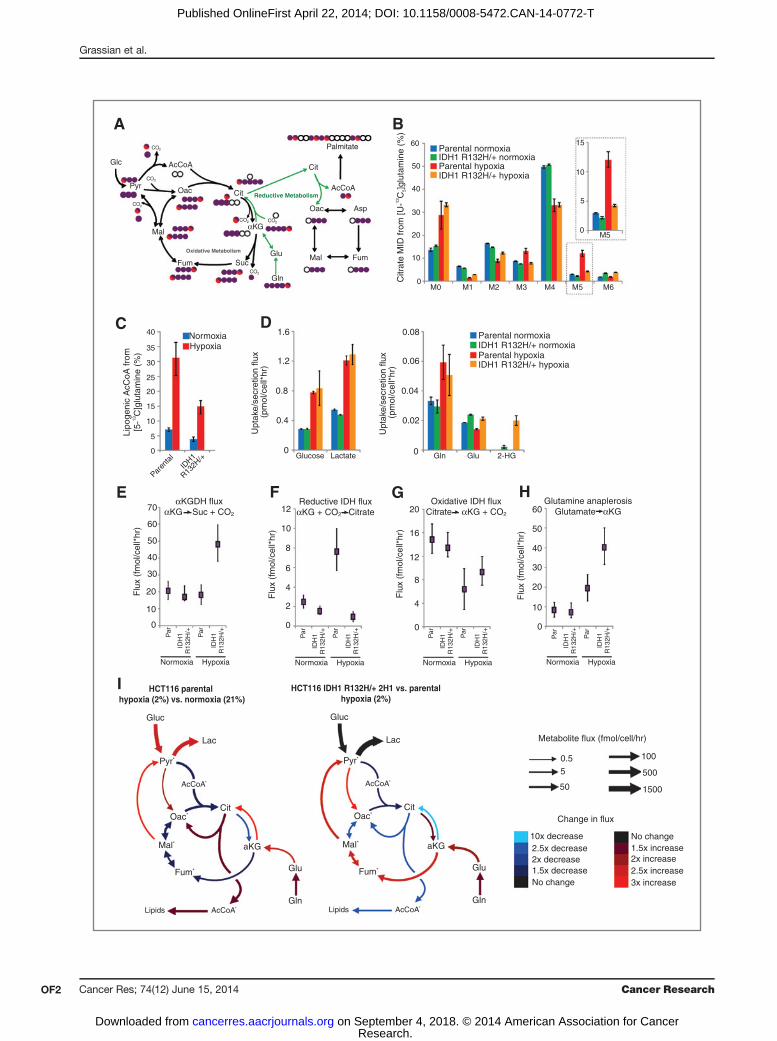
Figure 1. Isogenic IDH1mutation compromisesmetabolic reprogramming under hypoxia. A, carbon atom (represented by circles) transitions and tracers usedto detect changes in flux: [U-13C5]glutamine (purple circles) or [5-13C]glutamine (circlewith red). The fifth carbon is lost during oxidative TCAmetabolismbut isretained on citrate, AcCoA, and palmitate in the reductive pathway (green arrows). B, citrate MID labeling from [U-13C5]glutamine from HCT116 parentaland HCT116 IDH1 R132H/þ clone 2H1 cells cultured in normoxia or hypoxia (2% oxygen) for 72 hours. Data, representative of more than three independentexperiments. Inset highlights changes in % M5 citrate. C, contribution of [5-13C]glutamine to lipogenic AcCoA from cells cultured as in Fig. 1B. D,uptake and secretion fluxes for cells cultured as in Fig. 1B. E–H, a-Ketoglutarate dehydrogenase (E), reductive IDH (F), oxidative IDH (G), and glutamineanaplerosis (H) flux estimates and 95%confidence intervals by the 13CMFAmodel. I, graphical representation of fluxes determined viaMFA. Arrow thickness,level of flux inHCT116 cells cultured in hypoxia. Color, fold difference between hypoxic and normoxic parental HCT116 cells (left) or between hypoxicHCT116IDH1 R132H/þ 2H1 cells and hypoxic HCT116 parental cells (right). �, metabolites that were modeled as existing in separate mitochondrial and cytosolicpools. aKG, a-Ketoglutarate; cit, citrate; fum, fumarate; gluc, glucose; glu, glutamate; gln, glutamine; lac, lactate; mal, malate; oac, oxaloacetate;pyr, pyruvate. See also Supplementary Methods, Supplementary Fig. S2, and Supplementary Tables S1–S4 for details of MFA model, results, and data.
IDH1 Mutations Sensitize Cells to Mitochondrial Inhibitors
www.aacrjournals.org Cancer Res; 74(12) June 15, 2014 OF3
Research. on September 4, 2018. © 2014 American Association for Cancercancerres.aacrjournals.org Downloaded from
Published OnlineFirst April 22, 2014; DOI: 10.1158/0008-5472.CAN-14-0772-T

A
Paren
tal
2C11 2H
1
IDH1R132H/+
2A9
3A4
IDH1R132C/+
8G12
Paren
tal
+ 2-
HG 47C2
45G3
IDH2R172K/+
NormoxiaHypoxia
0M5
citr
ate,
nor
mal
ized
to p
aren
tal
cells
in n
orm
oxia
2
4
6
8
M5
citr
ate
(%)
MCF-1
0A
Paren
tal
Normoxia
Hypoxia
0
5
10
15
20
25
30
35
40
1A2
1F11
IDH1R132H/+
G
Lipo
geni
c A
cCoA
from
[U-13
C5]g
luta
min
e (%
)
MCF-1
0A
Paren
tal
Normoxia
Hypoxia
1A2
1F11
IDH1R132H/+
0
5
10
15
20
25
30
35
40
45H
D
Lipo
geni
c A
cCoA
from
[U-13
C5]g
luta
min
e (%
)
Paren
tal
2H1
2A9
8G12
Paren
tal
+ 2-
HG 47C2
0
5
10
15
20
25
30
35
40
45
Lipo
geni
c A
cCoA
from
[U-13
C5]g
luta
min
e (%
)
0
10
15
20
25
30
35
5
2H1
Paren
tal
IDH
2R
140Q
/+
IDH
2R
172K
/+
IDH
1R
132H
/+
IDH
1R
132H
/+
IDH
1R
132C
/+
shIDH1 shIDH2
F
M5
citr
ate
(%)
0
5
10
15
20
25
NTC A B A B
***
**
***
Normoxia
Hypoxia
C
αKG
/citr
ate
0
1
Normoxia
Hypoxia
ParentalIDH1 mutantIDH2 mutant
%M
5 ci
trat
e in
hyp
oxia
, nor
mal
ized
to
par
enta
l cel
ls in
nor
mox
ia
4
2
0
6
8
2-HG ng/1 million cells
0 300100 400200 500
E
2
3
4
5
Paren
tal
2H1
IDH1R132H/+
2C11
IDH1 R132H
IDH1GAPDH
B
HCT116
Normoxia
Hypoxia
Normoxia
Hypoxia
10
IDH2R140Q/+
17H5
Lipo
geni
c A
cCoA
from
[U-13
C5]g
luta
min
e (%
)
Normoxia
Hypoxia
0
10
20
30
40
45
3A4
2C11
Parent
al
IDH
1R
132H
/+
IDH
1R
132C
/+
45G9
59F10
Paren
tal
2C11 2H
1
IDH1R132H/+
2A9
3A4
IDH1R132C/+
8G12
Paren
tal
+ 2-
HG 47C2
45G3
IDH2R172K/+
IDH2R140Q/+
17H5
45G9
59F10
0
10
20
30
40
50
60
70
80
Lipo
geni
c A
cCoA
from
[U-13
C5]g
luta
min
e (%
)
Normoxia
Hypoxia
59F10
45G9
Paren
tal
IDH2R172K/+
Figure 2. Compromised reductive TCA metabolism is specific to cells with mutant IDH1. A, relative level of reductive glutamine metabolism, determined by M5labelingofcitrate from[U-13C5]glutamine inHCT116parentalcellswithorwithout10mmol/LD-2-HG,orHCT116 IDH1/2-mutant isogeniccellscultured innormoxiaorhypoxia (2%oxygen).PercentageofM5citrate levelsarenormalizedtoHCT116parental cells innormoxiaforeachexperiment. (Continuedonthefollowingpage.)
Grassian et al.
Cancer Res; 74(12) June 15, 2014 Cancer ResearchOF4
Research. on September 4, 2018. © 2014 American Association for Cancercancerres.aacrjournals.org Downloaded from
Published OnlineFirst April 22, 2014; DOI: 10.1158/0008-5472.CAN-14-0772-T

hours later, the indicated treatment was started and con-fluency measurements were taken every 12 hours for 108 to216 hours using an Incucyte Kinetic Imaging System (EssenBioScience). Confluency data were modeled using a general-ized logistic growth equation (equation 1), and the maximumgrowth rate was estimated using nonlinear regression:
Y ¼ U � L
1þ e�mmaxðt�t0Þ þ L ð1Þ
where U and L represent upper and lower asymptotes, t0represents the time at which cell confluency reaches 50%, andmmax represents the maximum growth rate per hour.Pharmacologic profiling of the CCLE was performed as
previously described (32). The growth inhibition assays aredescribed in Supplementary Methods.
Statistical analysisAll results shown as averages of multiple independent
experiments are presented as mean � SE; results shown asaverages of technical replicates are presented as mean � SD.P values were calculated using a Student two-tailed t test; �,P value between 0.005 and 0.05; ��, P value between 0.001 and0.005; ���, P value <0.001. All errors associated with MFA andISA of lipogenesis are 95% confidence intervals determined viasensitivity analysis.
ResultsMutant IDH1 compromises metabolic reprogrammingunder hypoxiaWe and others have previously demonstrated that tricar-
boxylic acid (TCA) metabolism is reprogrammed under hyp-oxia, and flux through WT IDH1 and/or IDH2 become criticalin these contexts (31, 33–37). Oncogenic mutations in IDH1and IDH2 mitigate these enzymes' WT function and, in par-ticular, the ability to catalyze the reductive carboxylationreaction while inducing a neomorphic activity that results inthe accumulation of D-2-HG (11, 26). Therefore, we hypothe-sized that cancer cells harboring mutations in either IDH1 orIDH2may be compromised in their ability tomodulate metab-olism under low oxygen tensions. To identify metabolic liabil-ities induced by IDH1 mutations, we applied 13C MFA toisogenic HCT116 colon cancer cells withWT IDH1/2 (parental)or a heterozygous IDH1mutation, IDH1 R132H/þ (clone 2H1).The IDH1-mutant, but not WT, cells have previously beenshown to produce high levels of 2-HG (28). To gauge relativeflux through the TCA cycle, each cell line was cultured in thepresence of [U-13C5]glutamine (uniformly 13C-labeled gluta-mine) under normoxic or hypoxic (2% oxygen) conditions for
72 hours, and isotope enrichment in various metabolites wasdetermined via mass spectrometry (Fig. 1A). Both cell linesdisplayed decreased oxidative TCA flux (as evidenced bydecreased M3 aKG) in hypoxia (Supplementary Fig. S1A).Although minimal changes in labeling were detected whencomparing the mass isotopomer distribution (MID) of citratein each cell type grown in normoxia (designated asM0,M1,M2,etc. mass isotopomers, corresponding to ion fragments con-taining zero, one, or two 13C, respectively), more significantdeviations occurred in cells proliferating under hypoxia (Fig.1B). Parental cells under hypoxia exhibited increased M5labeling indicative of reductive carboxylation (Fig. 1B), as hasbeen seen previously formanyWT IDH1/2 cell lines (31, 33, 35).In contrast, the IDH1 R132H/þ cells showed only a slightincrease in the abundance of this mass isotopomer underhypoxia (Fig. 1B). M5 citrate can also be produced via M6citrate and glutaminolysis (38); however, no increase in the lowbasal levels of M6 citrate was observed in hypoxia (Fig. 1B). Weobserved similar changes in the labeling of other TCA meta-bolites, including M3 fumarate, malate, and aspartate (derivedfrom oxaloacetate), further supporting our finding that IDH1-mutant cells display compromised reductive glutaminemetab-olism in hypoxia (Fig. 1A and Supplementary Fig. S1B–S1D). Tofurther quantify the metabolism of glutamine through thereductive carboxylation pathway in these cells, we determinedthe contribution of [5-13C]glutamine to palmitate synthesisusing isotopomer spectral analysis (ISA), as this tracer specif-ically labels acetyl coenzyme A (AcCoA) through the reductivecarboxylation pathway (Fig. 1A; ref. 39). Although parental cellsincreased the contribution of glutamine to lipogenic AcCoAalmost 5-fold under hypoxia, cells with a mutant IDH1 allelewere compromised in their ability to increase this reductivecarboxylation flux (Fig. 1C).
To characterize the metabolic phenotype of HCT116 cellswith WT or IDH1 R132H/þ in a more comprehensive andunbiased manner, we incorporated uptake/secretion fluxesand mass isotopomer data into a network of central carbonmetabolism. This model included glycolysis, the pentose phos-phate pathway (PPP), TCA metabolism, and various biosyn-theticfluxes using [U-13C5]glutamine and [1,2-13C2]glucose (forthe oxidative PPP bifurcation), as these tracers provide optimalflux resolution throughout central carbonmetabolism (40). Anelementary metabolite unit (EMU)–based algorithm was usedto estimate fluxes and associated confidence intervals in thenetwork (41, 30), and a detailed description of the model,assumptions, and the complete data set are included asSupplementary Material. As expected, glucose and lactatefluxes were significantly increased by hypoxia in both celllines, and significant 2-HG secretion occurred only in IDH1
(Continued.) B, Western blot of HCT116 parental, HCT116 IDH1 R132H/þ clone 2C11, and HCT116 IDH1 R132H/þ clone 2H1 showing levels of IDH1R132H and total levels of IDH1. C, ratio of a-ketoglutarate to citrate from cells cultured as in Fig. 2A. D, contribution of [U-13C5]glutamine to lipogenicAcCoA from cells cultured as in Fig. 2A. Four independent experiments are shown. E, correlation of reductive glutamine metabolism in 2% oxygen(as measured by % M5 citrate from [U-13C5]glutamine) to 2-HG ng/1 million cells. Note that HCT116 IDH2 R172K/þ 45G9 and 59F10 are not included inthis figure. F, relative level of reductive glutamine metabolism, determined by M5 labeling of citrate from [U-13C5]glutamine in HCT116 parental cells, whichwere stably infected with doxycycline-inducible shRNA's targeting IDH1 or IDH2, or nontargeting control (NTC). Cells were cultured for 48 hours innormoxia or hypoxia (1% oxygen) in the presence of 100 ng/mL doxycycline. Citrate labeling was determined via liquid chromatography/massspectrometry. G, relative level of reductive glutamine metabolism, determined by M5 labeling of citrate from [U-13C5]glutamine in MCF-10A cells culturedin normoxia or hypoxia (2% oxygen) for 72 hours. H, contribution of [U-13C5]glutamine to lipogenic AcCoA from cells cultured as in Fig. 2G.
IDH1 Mutations Sensitize Cells to Mitochondrial Inhibitors
www.aacrjournals.org Cancer Res; 74(12) June 15, 2014 OF5
Research. on September 4, 2018. © 2014 American Association for Cancercancerres.aacrjournals.org Downloaded from
Published OnlineFirst April 22, 2014; DOI: 10.1158/0008-5472.CAN-14-0772-T
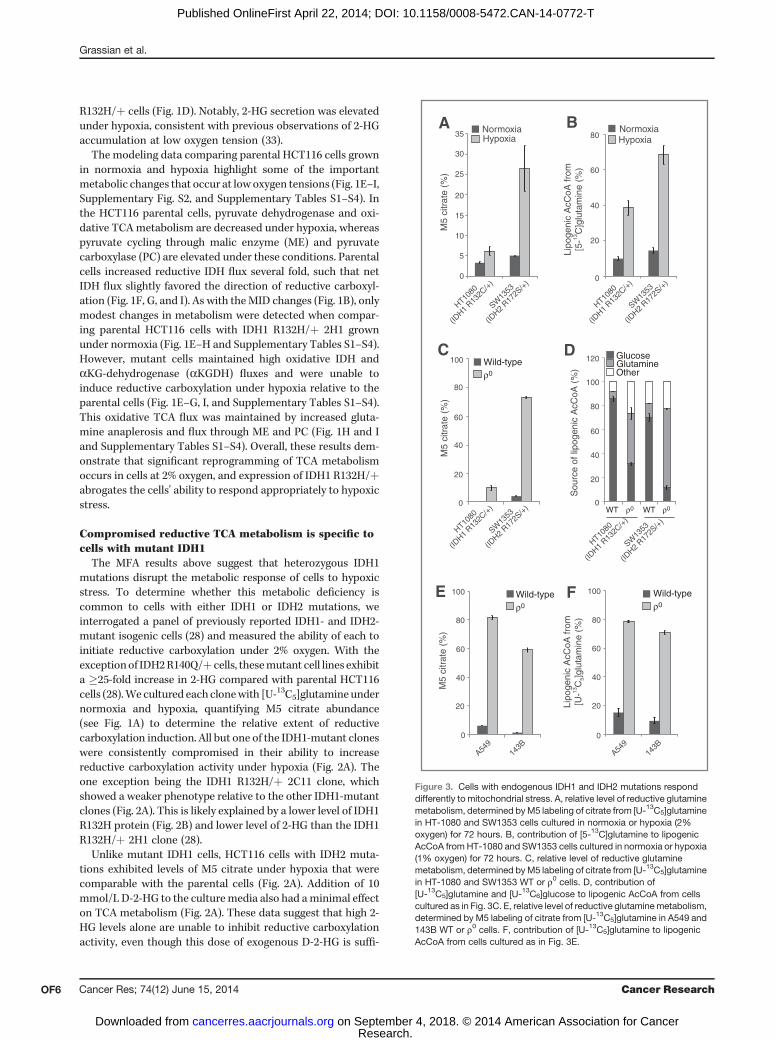
R132H/þ cells (Fig. 1D). Notably, 2-HG secretion was elevatedunder hypoxia, consistent with previous observations of 2-HGaccumulation at low oxygen tension (33).
The modeling data comparing parental HCT116 cells grownin normoxia and hypoxia highlight some of the importantmetabolic changes that occur at lowoxygen tensions (Fig. 1E–I,Supplementary Fig. S2, and Supplementary Tables S1–S4). Inthe HCT116 parental cells, pyruvate dehydrogenase and oxi-dative TCAmetabolism are decreased under hypoxia, whereaspyruvate cycling through malic enzyme (ME) and pyruvatecarboxylase (PC) are elevated under these conditions. Parentalcells increased reductive IDH flux several fold, such that netIDH flux slightly favored the direction of reductive carboxyl-ation (Fig. 1F, G, and I). As with theMID changes (Fig. 1B), onlymodest changes in metabolism were detected when compar-ing parental HCT116 cells with IDH1 R132H/þ 2H1 grownunder normoxia (Fig. 1E–H and Supplementary Tables S1–S4).However, mutant cells maintained high oxidative IDH andaKG-dehydrogenase (aKGDH) fluxes and were unable toinduce reductive carboxylation under hypoxia relative to theparental cells (Fig. 1E–G, I, and Supplementary Tables S1–S4).This oxidative TCA flux was maintained by increased gluta-mine anaplerosis and flux through ME and PC (Fig. 1H and Iand Supplementary Tables S1–S4). Overall, these results dem-onstrate that significant reprogramming of TCA metabolismoccurs in cells at 2% oxygen, and expression of IDH1 R132H/þabrogates the cells' ability to respond appropriately to hypoxicstress.
Compromised reductive TCA metabolism is specific tocells with mutant IDH1
The MFA results above suggest that heterozygous IDH1mutations disrupt the metabolic response of cells to hypoxicstress. To determine whether this metabolic deficiency iscommon to cells with either IDH1 or IDH2 mutations, weinterrogated a panel of previously reported IDH1- and IDH2-mutant isogenic cells (28) and measured the ability of each toinitiate reductive carboxylation under 2% oxygen. With theexceptionof IDH2R140Q/þ cells, thesemutant cell lines exhibita �25-fold increase in 2-HG compared with parental HCT116cells (28).We cultured each clonewith [U-13C5]glutamineundernormoxia and hypoxia, quantifying M5 citrate abundance(see Fig. 1A) to determine the relative extent of reductivecarboxylation induction. All but one of the IDH1-mutant cloneswere consistently compromised in their ability to increasereductive carboxylation activity under hypoxia (Fig. 2A). Theone exception being the IDH1 R132H/þ 2C11 clone, whichshowed a weaker phenotype relative to the other IDH1-mutantclones (Fig. 2A). This is likely explained by a lower level of IDH1R132H protein (Fig. 2B) and lower level of 2-HG than the IDH1R132H/þ 2H1 clone (28).
Unlike mutant IDH1 cells, HCT116 cells with IDH2 muta-tions exhibited levels of M5 citrate under hypoxia that werecomparable with the parental cells (Fig. 2A). Addition of 10mmol/L D-2-HG to the culturemedia also had aminimal effecton TCA metabolism (Fig. 2A). These data suggest that high 2-HG levels alone are unable to inhibit reductive carboxylationactivity, even though this dose of exogenous D-2-HG is suffi-
A
M5
citr
ate
(%)
NormoxiaHypoxia
HT1080
(IDH1
R132C
/+)
SW13
53
(IDH2
R172S
/+)
0
5
10
15
20
25
30
35
Wild-typeρ0
M5
citr
ate
(%)
HT1080
(IDH1
R132C
/+)
SW13
53
(IDH2
R172S
/+)
B
HT1080
(IDH1
R132C
/+)
SW13
53
(IDH2
R172S
/+)
0
20
40
60
80
100
C
Sou
rce
of li
poge
nic
AcC
oA (
%)
0
20
40
60
80
100
A549
143B
M5
citr
ate
(%)
D
Wild-typeρ0
E
0
20
40
60
80
100
A549
143B
Wild-typeρ0
Lipo
geni
c A
cCoA
from
[U-13
C5]
glut
amin
e (%
)
0
20
40
60
80
Lipo
geni
c A
cCoA
from
[5-13
C]g
luta
min
e (%
)
NormoxiaHypoxia
F
HT1080
(IDH1
R132C
/+)
SW13
53
(IDH2
R172S
/+)
0
20
40
60
80
100 Glucose
OtherGlutamine
120
ρ0ρ0WT WT
Figure 3. Cells with endogenous IDH1 and IDH2 mutations responddifferently to mitochondrial stress. A, relative level of reductive glutaminemetabolism, determined byM5 labeling of citrate from [U-13C5]glutaminein HT-1080 and SW1353 cells cultured in normoxia or hypoxia (2%oxygen) for 72 hours. B, contribution of [5-13C]glutamine to lipogenicAcCoA from HT-1080 and SW1353 cells cultured in normoxia or hypoxia(1% oxygen) for 72 hours. C, relative level of reductive glutaminemetabolism, determined byM5 labeling of citrate from [U-13C5]glutaminein HT-1080 and SW1353 WT or r0 cells. D, contribution of[U-13C5]glutamine and [U-13C6]glucose to lipogenic AcCoA from cellscultured as in Fig. 3C. E, relative level of reductive glutaminemetabolism,determined by M5 labeling of citrate from [U-13C5]glutamine in A549 and143B WT or r0 cells. F, contribution of [U-13C5]glutamine to lipogenicAcCoA from cells cultured as in Fig. 3E.
Grassian et al.
Cancer Res; 74(12) June 15, 2014 Cancer ResearchOF6
Research. on September 4, 2018. © 2014 American Association for Cancercancerres.aacrjournals.org Downloaded from
Published OnlineFirst April 22, 2014; DOI: 10.1158/0008-5472.CAN-14-0772-T
cient to induce the 2-HG–dependent epithelial–mesenchymaltransition (EMT) phenotype previously described in thesecell lines (28). Consistent changes were observed whennormalizing M5 citrate to M5 glutamate (SupplementaryFig. S3A), and levels of M6 citrate were not high in any of theclones (Supplementary Fig. S3B), providing evidence thatsuch changes are specific to the IDH/aconitase node ofmetabolism. Similar trends were also observed when mea-suring the ratio of aKG/citrate under normoxia and hypoxia(Fig. 2C), another metric that describes the extent of reduc-tive versus oxidative IDH flux (36, 42). Finally, the contri-bution of glutamine to lipogenic AcCoA under hypoxia wassignificantly lower in cells with IDH1 mutations but notthose with IDH2 mutations or exogenous 2-HG (Fig. 2D).Overall, the extent that each IDH1-mutant cell line produced2-HG correlated with their ability to activate reductivecarboxylation flux under hypoxia (Fig. 2E), whereas IDH2-mutant cells did not adhere to this trend.We next conducted shRNA-mediated knockdown of IDH1
and IDH2 in parental HCT116 cells to examine the roles of WT
IDH1 and IDH2 in mediating reductive glutamine metabolism(Supplementary Fig. S3C and S3D). Knockdown of IDH1decreased levels of M5 citrate in cell populations culturedwith [U-13C5]glutamine, whereas cells expressing shRNAs tar-geting IDH2 exhibited the same or higher M5 citrate (Fig. 2F).These results are consistent with previous studies in other celllines (31), highlighting the importance of WT IDH1 expressionin reprogramming TCA metabolism under hypoxia, and fur-ther suggest that IDH1mutation selectively impedesWT IDH1function in these cells.
To determine whether this mutant IDH1-inducedmetabolicdeficiency is specific to the HCT116 genetic background ormore broadly applicable to cells of different tissue origin, weperformed similar analyses using MCF-10A immortalizedmammary epithelial cells with heterozygous IDH1 mutations(28). When cultured for 3 days under normoxia or hypoxia, twodistinct IDH1 R132H/þ clones were compromised in theirability to generate M5 citrate or lipogenic AcCoA from[U-13C5]glutamine (Fig. 2G and H and Supplementary Fig.S3E). Thus, cells with heterozygous IDH1 mutations, but not
C
0
50
100
2-H
G L
evel
s in
xen
ogra
fts,
rela
tive
to p
aren
tal
Paren
tal
2H1
IDH
1R
132H
/+
2A9
IDH
1R
132C
/+
0
0.05
0.10
0.15
0.20
nMol
s αK
G/n
Mol
s ci
trat
e in
xen
ogra
fts
0.25
Paren
tal
2H1
IDH
1R
132H
/+
2A9
IDH
1R
132C
/+
***
E
***
Paren
tal
2H1
IDH
1R
132H
/+
2A9
IDH
1R
132C
/+
0
0.05
0.10
0.15
0.20
M1
αKG
/M1
Gln
in x
enog
rafts
0.25
0.30
0.35*
*
150
200
250
300
F
***
***
A
20
[1-13
C]g
luta
min
e en
richm
ent
(%)
in p
lasm
a
30
40
0
10
Paren
tal
2H1
IDH
1R
132H
/+
2A9
IDH
1R
132C
/+
50
60
D
0
2
M1
αKG
from
[1-13
C]g
luta
min
ein
xen
ogra
fts (
%)
Paren
tal
2H1
IDH
1R
132H
/+
2A9
IDH
1R
132C
/+
4
6
8
10
20
[1-13
C]g
luta
min
e en
richm
ent
(%)
in tu
mor
30
0
10
Paren
tal
2H1
IDH
1R
132H
/+
2A9
IDH
1R
132C
/+
40B
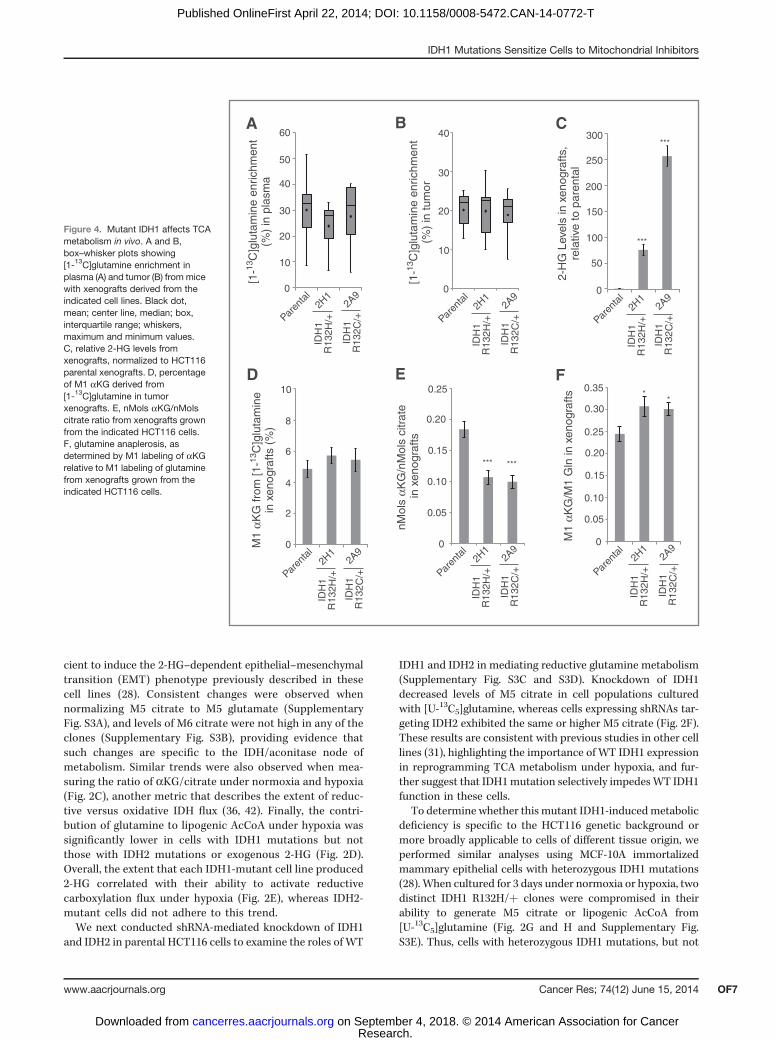
Figure 4. Mutant IDH1 affects TCAmetabolism in vivo. A and B,box–whisker plots showing[1-13C]glutamine enrichment inplasma (A) and tumor (B) from micewith xenografts derived from theindicated cell lines. Black dot,mean; center line, median; box,interquartile range; whiskers,maximum and minimum values.C, relative 2-HG levels fromxenografts, normalized to HCT116parental xenografts. D, percentageof M1 aKG derived from[1-13C]glutamine in tumorxenografts. E, nMols aKG/nMolscitrate ratio from xenografts grownfrom the indicated HCT116 cells.F, glutamine anaplerosis, asdetermined by M1 labeling of aKGrelative to M1 labeling of glutaminefrom xenografts grown from theindicated HCT116 cells.
IDH1 Mutations Sensitize Cells to Mitochondrial Inhibitors
www.aacrjournals.org Cancer Res; 74(12) June 15, 2014 OF7
Research. on September 4, 2018. © 2014 American Association for Cancercancerres.aacrjournals.org Downloaded from
Published OnlineFirst April 22, 2014; DOI: 10.1158/0008-5472.CAN-14-0772-T
A
D
EIDH1 R132H/+ 2H1 DMSOIDH1 R132H/+ 2H1 3d 10 μmol/L IDH1i AIDH1 R132H/+ 2H1 31d 10 μmol/L IDH1i AIDH1 R132C/+ 2A9 DMSO
60
50
40
30
20
10
0
Citr
ate
MID
from
[U-13
C5]g
luta
min
e(%
) in
hyp
oxia
M0 M1 M2 M3 M4 M5 M6
IDH1 R132C/+ 2A9 3d 10 μmol/L IDH1i AIDH1 R132C/+ 2A9 31d 10 μmol/L IDH1i A
DMSO3d 10 μmol/L IDH1i A 31d 10 μmol/L IDH1i A
αKG
/citr
ate
in h
ypox
ia
0
0.2
0.4
0.6
0.8
1.0
IDH1 R132H/+
2H1
IDH1 R132C/+
2A9
FDMSO3d 10 μmol/L IDH1i A31d 10 μmol/L IDH1i A
0
4
6
8
10
16
18
20
IDH1 R132H/+
2H1
IDH1 R132C/+
2A9
G
Lipo
geni
c A
cCoA
from
[U-13
C5]g
luta
min
e (%
) in
hyp
oxia
2
DMSO10 μmol/L IDH1i A
Dou
blin
g tim
e (h
)
IDH1 R132H/+
2H1
IDH1 R132C/+
2A9
0
5
10
15
20
25
30
C
Met
abol
ite le
vels
(re
lativ
e to
DM
SO
) in
hyp
oxia
2-HG0
0.5
1.0
1.5
2.0
2.5
O
NO
O
NHN
O
F
Cl
IDH1i A
Pyr Lac Ala Gly Suc Ser Akg Mal Asp Glu Gln Pro Cit
IDH1 R132H/+ 2H1 DMSOIDH1 R132H/+ 2H1 3d 10 μmol/L IDH1i AIDH1 R132H/+ 2H1 31d 10 μmol/L IDH1i AIDH1 R132C/+ 2A9 DMSOIDH1 R132C/+ 2A9 3d 10 μmol/L IDH1i AIDH1 R132C/+ 2A9 31d 10 μmol/L IDH1i A
12
14
H
DMSO
3 μmol/L IDH1i A1 μmol/L IDH1i A
5 μmol/L IDH1i A10 μmol/L IDH1i A
IDH1 R132H/+ 2H1 IDH1 R132C/+ 2A92-H
G le
vels
(re
lativ
e to
DM
SO
)
B
0
0.2
1.0
1.2
0.4
0.8
0.6
IC50 0.0199 μmol/L 15.6 μmol/LIDH1 R132H IDH1 wild-type
DMSO1 μmol/L IDH1-C2273 μmol/L IDH1-C227
IDH1 R132H/+
2H1
IDH1 R132C/+
2A9
2-H
G le
vels
(re
lativ
e to
DM
SO
)
0
0.2
0.4
0.6
0.8
1.0
1.2
H DMSO3d 1 μmol/L IDH1-C227 12d 1 μmol/L IDH1-C227
M5
Citr
ate
(%)
in h
ypox
ia
0
1
2
3
4
IDH1 R132H/+
2H1
IDH1 R132C/+
2A9
I DMSO
IDH1 R132C/+
2A9
Lipo
geni
c A
cCoA
from
[U-13
C5]g
luta
min
e (%
) in
hyp
oxia
0
4
8
12
16
20
K3d 1 μmol/L IDH1-C227 12d 1 μmol/L IDH1-C227
IDH1 R132H/+
2H1
IDH1 R132C/+
2A9
DMSO3d 1 μmol/L IDH1-C227 12d 1 μmol/L IDH1-C227
αKG
/citr
ate
in h
ypox
ia
0
0.2
0.4
0.6
0.8
1.0
1.2
J
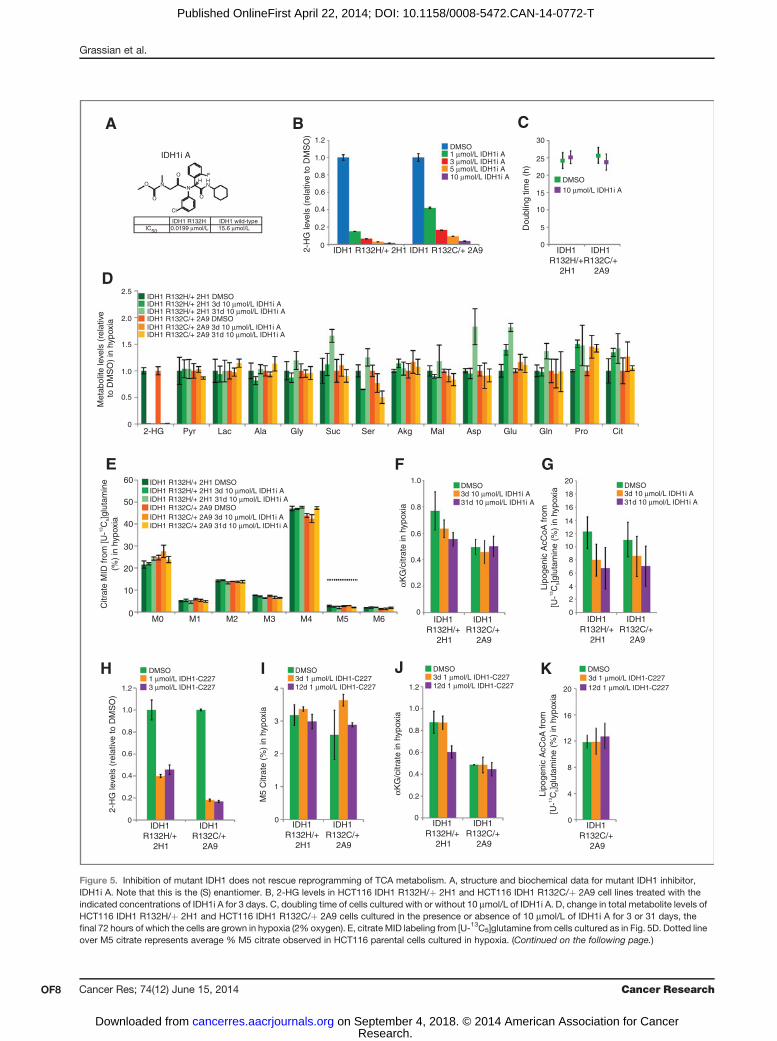
Figure 5. Inhibition of mutant IDH1 does not rescue reprogramming of TCA metabolism. A, structure and biochemical data for mutant IDH1 inhibitor,IDH1i A. Note that this is the (S) enantiomer. B, 2-HG levels in HCT116 IDH1 R132H/þ 2H1 and HCT116 IDH1 R132C/þ 2A9 cell lines treated with theindicated concentrations of IDH1i A for 3 days. C, doubling time of cells cultured with or without 10 mmol/L of IDH1i A. D, change in total metabolite levels ofHCT116 IDH1 R132H/þ 2H1 and HCT116 IDH1 R132C/þ 2A9 cells cultured in the presence or absence of 10 mmol/L of IDH1i A for 3 or 31 days, thefinal 72 hours of which the cells are grown in hypoxia (2% oxygen). E, citrate MID labeling from [U-13C5]glutamine from cells cultured as in Fig. 5D. Dotted lineover M5 citrate represents average % M5 citrate observed in HCT116 parental cells cultured in hypoxia. (Continued on the following page.)
Grassian et al.
Cancer Res; 74(12) June 15, 2014 Cancer ResearchOF8
Research. on September 4, 2018. © 2014 American Association for Cancercancerres.aacrjournals.org Downloaded from
Published OnlineFirst April 22, 2014; DOI: 10.1158/0008-5472.CAN-14-0772-T

IDH2 mutations or exogenous 2-HG, are compromised forglutamine reductive carboxylation under hypoxia.
Cells with endogenous IDH1 and IDH2 mutationsrespond differently to mitochondrial stressTo examine whether these trends are observed in cell
lines from cancers with endogenous IDH mutations, weevaluated the ability of two cell lines harboring IDH1 orIDH2 mutations to activate reductive carboxylation underconditions of mitochondrial stress. When switched to hyp-oxic growth, HT1080 IDH1 R132C/þ fibrosarcoma cellsexhibited a significantly decreased ability to induce reduc-tive glutamine metabolism in comparison with SW1353IDH2 R172S/þ chondrosarcoma cells (Fig. 3A and Supple-mentary Fig. S4A). HT-1080 cells also used less glutamine forde novo lipogenesis than the SW1353 cells in 1% oxygentension (Fig. 3B). Thus, a cell line with an endogenousmutation in IDH1, but not IDH2, displays compromisedreductive glutamine metabolism in hypoxia.In addition to low oxygen tensions, an alternative means
of inducing reductive TCA metabolism is through the inhi-bition of oxidative phosphorylation (OXPHOS; refs. 34, 42).To compromise OXPHOS, we generated r0 cells that lack afunctional electron transport chain (ETC) from various celllines using established methods (43). As expected, oxidativemitochondrial metabolism was virtually extinguished, asevidenced by M3 and M3/M5 labeling of aKG in r0 cellsgenerated from IDH-mutant cells (HT1080 and SW1353) orother cancer cell lines with WT IDH1/2 (143B osteosarcoma,A549 non–small cell lung cancer; Supplementary Fig. S4B–S4E). However, HT1080 IDH1 R132C/þ r0 cells were com-promised in their ability to generate citrate and palmitatethrough reductive glutamine metabolism, whereas SW1353and both of the IDH1/2 WT r0 cell lines were able toefficiently induce reductive carboxylation and use glutaminefor lipid synthesis (Fig. 3C–F). Both the HT1080 and SW1353r0 cells continued to use glucose for lipid synthesis, and thiscontribution was higher in the HT1080 r0 cells (Fig. 3D). Theincreased glucose utilization in HT1080 r0 cells comparedwith SW1353 r0 cells was facilitated by anaplerosis throughpyruvate carboxylase, as demonstrated by increased labelingin TCA intermediates from [3-13C]glucose (SupplementaryFig. S4F and S4G). These results provide evidence thathypoxia and mitochondrial dysfunction drive reprogram-ming of the TCA cycle, and cells with spontaneouslyacquired IDH1 mutations are unable to efficiently reprogrammetabolism to induce reductive glutamine carboxylation.
Mutant IDH1 affects TCA metabolism in vivoThe metabolic deficiencies of IDH1-mutant cells occur at
oxygen tensions that are likely to occur in solid tumors andsome normal tissues (44). To determine whether these
metabolic phenotypes arise in vivo, we generated subcuta-neous xenografts using parental, IDH1 R132H/þ 2H1, andIDH1 R132C/þ 2A9 HCT116 cells. After tumors achieved aminimum diameter of 0.8 cm, mice were infused with[1-13C]glutamine for 6 hours to achieve steady-state isotopeenrichment in plasma and tumor (Fig. 4A and B; ref. 45). Atargeted metabolomic analysis was performed on plasmaand tumor extracts to quantify isotope enrichment andmetabolite abundances. Significant 2-HG was detected onlyin the IDH1-mutant tumors (Fig. 4C). Insufficient isotopeenrichment was achieved in plasma and intratumoral glu-tamine/aKG to detect label on citrate via reductive carbox-ylation (Fig. 4A, B, and D). However, in agreement with theresults obtained from in vitro studies, the aKG/citrate ratiowas significantly lower in IDH1-mutant tumors comparedwith those generated using parental HCT116 cells (Fig. 4E),indicating that TCA metabolism may also be perturbed intumors comprised of IDH1-mutant cells. In addition, thecontribution of glutamine anaplerosis to the aKG pool wassignificantly elevated in IDH1 R132H/þ and IDH1 R132C/þtumors (Fig. 4F), which was also observed in our MFA results(Fig. 1H and I). Thus, the available data are consistent withour in vitro MFA results and provide evidence that TCAmetabolism is similarly compromised by IDH1 mutationsin vivo.
Inhibition of mutant IDH1 does not rescuereprogramming of TCA metabolism
One possible explanation for the decrease in reductivecarboxylation flux in IDH1-mutant cells is that localizedsubstrate (aKG and NADPH) consumption by the mutantenzyme for production of 2-HG compromises this activity.Therefore, we examined whether pharmacologic inhibitionof mutant IDH1 could increase reductive carboxylationactivity and rescue the ability of cells to use this pathwayfor growth under hypoxia. To test this hypothesis, we treatedIDH1 R132H/þ 2H1 or IDH1 R132C/þ 2A9 cells with amutant IDH1 inhibitor (IDH1i A) similar to a previouslydescribed structural class (Fig. 5A; refs. 22, 46). Doses of 10mmol/L were able to decrease 2-HG levels more than 25-foldin both clones (Fig. 5B). As would be expected from anengineered cell line that does not exhibit growth dependenceon mutant IDH1 or 2-HG, 10 mmol/L of IDH1i A had noappreciable effect on the growth rate of either cell line (Fig.5C). Both short-term (3 day) and long-term (31 day) treat-ment with 10 mmol/L IDH1i A induced minimal changes inmetabolite abundances beyond 2-HG (Fig. 5D) and effec-tively reversed the mutant IDH-dependent EMT phenotypeexhibited by these cells (Supplementary Fig. S5A).
IDH1i A did not rescue the ability of cells to initiate reductiveTCA metabolism under hypoxia, as labeling of citrate (Fig. 5E)and other metabolites (Supplementary Fig. S5B–S5D) from
(Continued.) F, aKG/citrate ratio from cells cultured as in Fig. 5D. G, contribution of [U-13C5]glutamine to lipogenic AcCoA from cells cultured as in Fig. 5D.H, 2-HG levels in HCT116 IDH1 R132H/þ 2H1 and HCT116 IDH1 R132C/þ 2A9 cell lines treated with the indicated concentration of IDH1-C227 for 3 days.I, relative level of reductive glutamine metabolism, determined by M5 labeling of citrate from [U-13C5]glutamine in HCT116 IDH1 R132H/þ 2H1 andHCT116 IDH1 R132C/þ 2A9 cell lines treated with 1 mmol/L of IDH1-C227 for 3 or 12 days, the final 72 hours of which the cells are grown in hypoxia (2%oxygen). J, aKG/citrate ratio from cells cultured as in Fig. 5I. K, contribution of [U-13C5]glutamine to lipogenic AcCoA from cells cultured as in Fig. 5I.
IDH1 Mutations Sensitize Cells to Mitochondrial Inhibitors
www.aacrjournals.org Cancer Res; 74(12) June 15, 2014 OF9
Research. on September 4, 2018. © 2014 American Association for Cancercancerres.aacrjournals.org Downloaded from
Published OnlineFirst April 22, 2014; DOI: 10.1158/0008-5472.CAN-14-0772-T

IDH1 R132H/+ 2H1 IDH1 R132C/+ 2A9Parental IDH1 R132C/+ 3A4
DMSO50 nmol/L rotenone100 nmol/L rotenone
0
0
Con
fluen
cy (
%)
40
60
80
100
20
12 24 36 48 60 72 84 96 1080 12 24 36 48 60 72 84 96 1080 12 24 36 48 60 72 84 96 1080 12 24 36 48 60 72 84 96 1080
Con
fluen
cy (
%)
40
60
80
100
20
DMSO25 μmol/L phenformin50 μmol/L phenformin
0
Con
fluen
cy (
%)
40
60
80
100
20
DMSO5 nmol/L piericidin A
Time (h)Time (h)Time (h)Time (h)
F
Manassantin A
Manassantin B
Piericidin A
Sesquicillin A
HT-1080(IDH1 R132C/+)
SW1353(IDH2 R172S/+)
G
Δ2%†
Δ27%
Δ28%
Δ50%
Δ34%
Δ49%
Δ13%
Δ57%
Δ6%
Δ61% Δ40%
Δ68%
Δ42%
Δ59%
Δ25%
Δ67%
Δ29%
Δ45% Δ45% Δ36%
% C
ell G
row
th R
elat
ive
to D
MS
O
0
40
60
80
20
100
Phenformin (μM)
10
H
SW1353HT-1080
†ΔX%=change in specific growth rate relative to DMSO
A
Paren
tal
2C11 2H
1
IDH1R132H/+
2A9
3A4
IDH1R132C/+
8G12
IDH
2R
140Q
/+
47C2
45G3
IDH2R172K/+
Normoxia
Hypoxia
0
Dou
blin
g tim
e (h
)
10
20
30
40
50
1.00.0−3.0
Log(IC50), μmol/L
120
0 100 1000
C Par
enta
lGAPDH
HIF-1α
HC
T11
6 ID
H1
R13
2H/+
2H
1
HCT116 IDH1 R132H/+2H1 xenografts
Days after implant
HCT116 parentalHCT116 IDH1 R132H/+ 2H1
0
Tum
or v
olum
e (m
m3 )
500
1,000
1,500
2,000
2,500
7 14 21
HCT116 IDH1 R132C/+ 2A9
B D E
2H1
2A9
IDH
1R
132H
/+
IDH
1R
132C
/+Paren
tal
0
40
60
80
100
120
140
20
Rel
ativ
e AT
P-li
nked
resp
iratio
n in
nor
mox
ia
2H1
2A9
IDH
1R
132H
/+
IDH
1R
132C
/+Paren
tal
0
40
60
80
100
120
140
20
Rel
ativ
e AT
P-li
nked
resp
iratio
n in
hyp
oxia
160 * *
HCT116 parental xenografts
Cancer Res; 74(12) June 15, 2014 Cancer ResearchOF10
Grassian et al.
Research. on September 4, 2018. © 2014 American Association for Cancercancerres.aacrjournals.org Downloaded from
Published OnlineFirst April 22, 2014; DOI: 10.1158/0008-5472.CAN-14-0772-T
[U-13C5]glutamine was not increased compared with vehicletreatment. Other indices of reductive TCAmetabolism, includ-ing the ratio of aKG/citrate and contribution of glutamine tolipid biosynthesis, also indicated that IDH1i A failed to rescuereductive carboxylation flux in these cells (Fig. 5F and G). At 10mmol/L, the dose that showedmaximal 2-HG inhibition, IDH1iA mildly inhibited reductive carboxylation in the WT parentalcells (Supplementary Fig. S5E and S5F), potentially due to off-target effects on WT IDH1 at high concentrations. To furtheraddress this issue, we also treated the IDH1-mutant cells withan additional inhibitor of mutant IDH1 at more moderateconcentrations (Fig. 5H). We again observed no rescue inreductive glutamine metabolism (Fig. 5I–K), providing evi-dence that inhibition of IDH1-mutant activity may be insuf-ficient to remove the block in metabolic reprogramming inresponse to hypoxic stress.
Cells expressing mutant IDH1 are sensitive topharmacologic inhibition of mitochondrial oxidativemetabolismIn comparing the growth rates of the HCT116 panel under
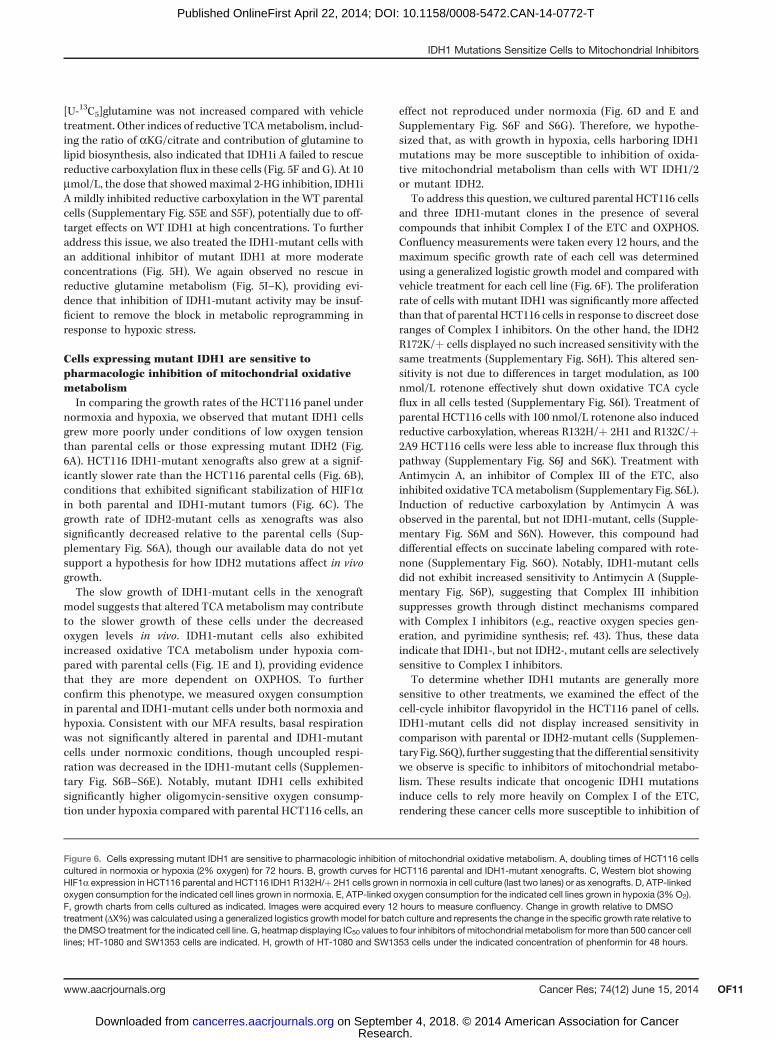
normoxia and hypoxia, we observed that mutant IDH1 cellsgrew more poorly under conditions of low oxygen tensionthan parental cells or those expressing mutant IDH2 (Fig.6A). HCT116 IDH1-mutant xenografts also grew at a signif-icantly slower rate than the HCT116 parental cells (Fig. 6B),conditions that exhibited significant stabilization of HIF1ain both parental and IDH1-mutant tumors (Fig. 6C). Thegrowth rate of IDH2-mutant cells as xenografts was alsosignificantly decreased relative to the parental cells (Sup-plementary Fig. S6A), though our available data do not yetsupport a hypothesis for how IDH2 mutations affect in vivogrowth.The slow growth of IDH1-mutant cells in the xenograft
model suggests that altered TCA metabolismmay contributeto the slower growth of these cells under the decreasedoxygen levels in vivo. IDH1-mutant cells also exhibitedincreased oxidative TCA metabolism under hypoxia com-pared with parental cells (Fig. 1E and I), providing evidencethat they are more dependent on OXPHOS. To furtherconfirm this phenotype, we measured oxygen consumptionin parental and IDH1-mutant cells under both normoxia andhypoxia. Consistent with our MFA results, basal respirationwas not significantly altered in parental and IDH1-mutantcells under normoxic conditions, though uncoupled respi-ration was decreased in the IDH1-mutant cells (Supplemen-tary Fig. S6B–S6E). Notably, mutant IDH1 cells exhibitedsignificantly higher oligomycin-sensitive oxygen consump-tion under hypoxia compared with parental HCT116 cells, an
effect not reproduced under normoxia (Fig. 6D and E andSupplementary Fig. S6F and S6G). Therefore, we hypothe-sized that, as with growth in hypoxia, cells harboring IDH1mutations may be more susceptible to inhibition of oxida-tive mitochondrial metabolism than cells with WT IDH1/2or mutant IDH2.
To address this question, we cultured parental HCT116 cellsand three IDH1-mutant clones in the presence of severalcompounds that inhibit Complex I of the ETC and OXPHOS.Confluency measurements were taken every 12 hours, and themaximum specific growth rate of each cell was determinedusing a generalized logistic growth model and compared withvehicle treatment for each cell line (Fig. 6F). The proliferationrate of cells with mutant IDH1 was significantly more affectedthan that of parental HCT116 cells in response to discreet doseranges of Complex I inhibitors. On the other hand, the IDH2R172K/þ cells displayed no such increased sensitivity with thesame treatments (Supplementary Fig. S6H). This altered sen-sitivity is not due to differences in target modulation, as 100nmol/L rotenone effectively shut down oxidative TCA cycleflux in all cells tested (Supplementary Fig. S6I). Treatment ofparental HCT116 cells with 100 nmol/L rotenone also inducedreductive carboxylation, whereas R132H/þ 2H1 and R132C/þ2A9 HCT116 cells were less able to increase flux through thispathway (Supplementary Fig. S6J and S6K). Treatment withAntimycin A, an inhibitor of Complex III of the ETC, alsoinhibited oxidative TCAmetabolism (Supplementary Fig. S6L).Induction of reductive carboxylation by Antimycin A wasobserved in the parental, but not IDH1-mutant, cells (Supple-mentary Fig. S6M and S6N). However, this compound haddifferential effects on succinate labeling compared with rote-none (Supplementary Fig. S6O). Notably, IDH1-mutant cellsdid not exhibit increased sensitivity to Antimycin A (Supple-mentary Fig. S6P), suggesting that Complex III inhibitionsuppresses growth through distinct mechanisms comparedwith Complex I inhibitors (e.g., reactive oxygen species gen-eration, and pyrimidine synthesis; ref. 43). Thus, these dataindicate that IDH1-, but not IDH2-, mutant cells are selectivelysensitive to Complex I inhibitors.
To determine whether IDH1 mutants are generally moresensitive to other treatments, we examined the effect of thecell-cycle inhibitor flavopyridol in the HCT116 panel of cells.IDH1-mutant cells did not display increased sensitivity incomparison with parental or IDH2-mutant cells (Supplemen-tary Fig. S6Q), further suggesting that the differential sensitivitywe observe is specific to inhibitors of mitochondrial metabo-lism. These results indicate that oncogenic IDH1 mutationsinduce cells to rely more heavily on Complex I of the ETC,rendering these cancer cells more susceptible to inhibition of
Figure 6. Cells expressing mutant IDH1 are sensitive to pharmacologic inhibition of mitochondrial oxidative metabolism. A, doubling times of HCT116 cellscultured in normoxia or hypoxia (2% oxygen) for 72 hours. B, growth curves for HCT116 parental and IDH1-mutant xenografts. C, Western blot showingHIF1a expression in HCT116 parental and HCT116 IDH1 R132H/þ 2H1 cells grown in normoxia in cell culture (last two lanes) or as xenografts. D, ATP-linkedoxygen consumption for the indicated cell lines grown in normoxia. E, ATP-linked oxygen consumption for the indicated cell lines grown in hypoxia (3%O2).F, growth charts from cells cultured as indicated. Images were acquired every 12 hours to measure confluency. Change in growth relative to DMSOtreatment (DX%) was calculated using a generalized logistics growth model for batch culture and represents the change in the specific growth rate relative tothe DMSO treatment for the indicated cell line. G, heatmap displaying IC50 values to four inhibitors of mitochondrial metabolism for more than 500 cancer celllines; HT-1080 and SW1353 cells are indicated. H, growth of HT-1080 and SW1353 cells under the indicated concentration of phenformin for 48 hours.
www.aacrjournals.org Cancer Res; 74(12) June 15, 2014 OF11
IDH1 Mutations Sensitize Cells to Mitochondrial Inhibitors
Research. on September 4, 2018. © 2014 American Association for Cancercancerres.aacrjournals.org Downloaded from
Published OnlineFirst April 22, 2014; DOI: 10.1158/0008-5472.CAN-14-0772-T
this pathway compared with cells with WT IDH1/2 or mutantIDH2 alleles.
Finally, to evaluatewhether these results are relevant to othercells, we interrogated the Cancer Cell Line Encyclopedia (CCLE;ref. 32), which contains compound sensitivity data across morethan 500 cell lines for four ETC inhibitors (Fig. 6G; ref. 47). Celllines clustered well into sensitive and insensitive groups, sug-gesting these compounds show consistent behavior across awide panel of cell lines. Notably, IDH1-mutant HT1080 cells fellinto the sensitive group,whereas IDH2-mutant SW1353 cells fellinto the insensitive group (Fig. 6G). The differential effects ofmitochondrial metabolism inhibitors were not likely due toHT1080 being generally more sensitive to compound treat-ments, as the sensitivities of HT1080 and SW1353 to a broadarray ofmore than 1,300 compoundswerewithin one SDof eachother (Supplementary Fig. S6R). Furthermore, HT1080 cellswere significantly more sensitive than SW1353 cells to phen-formin treatment, a compound that was not included in theCCLE screening set (Fig. 6H). Together, these data indicate thatIDH1 mutation may substantially sensitize cells to inducers ofmitochondrial stress.
DiscussionSince the discovery of oncogenic mutations in IDH1 and
IDH2, significant efforts have been made to elucidate themechanisms driving tumorigenesis in these cancers. Owingto the accumulation of D-2-HG in these tumors, researchershave focused on the role of this oncometabolite in regulatingthe phenotype of IDH1/2-mutant cancer cells. For example,high D-2-HG levels and other metabolites regulate the activityof aKG-dependent dioxygenases that control many distinctcellular processes (12). However, the diverse roles of theseenzymes in mediating activities ranging from collagen hydrox-ylation and HIF stabilization to epigenetics regulation com-
plicate identification of the specific process(es) driving tumor-igenesis in each tumor type.
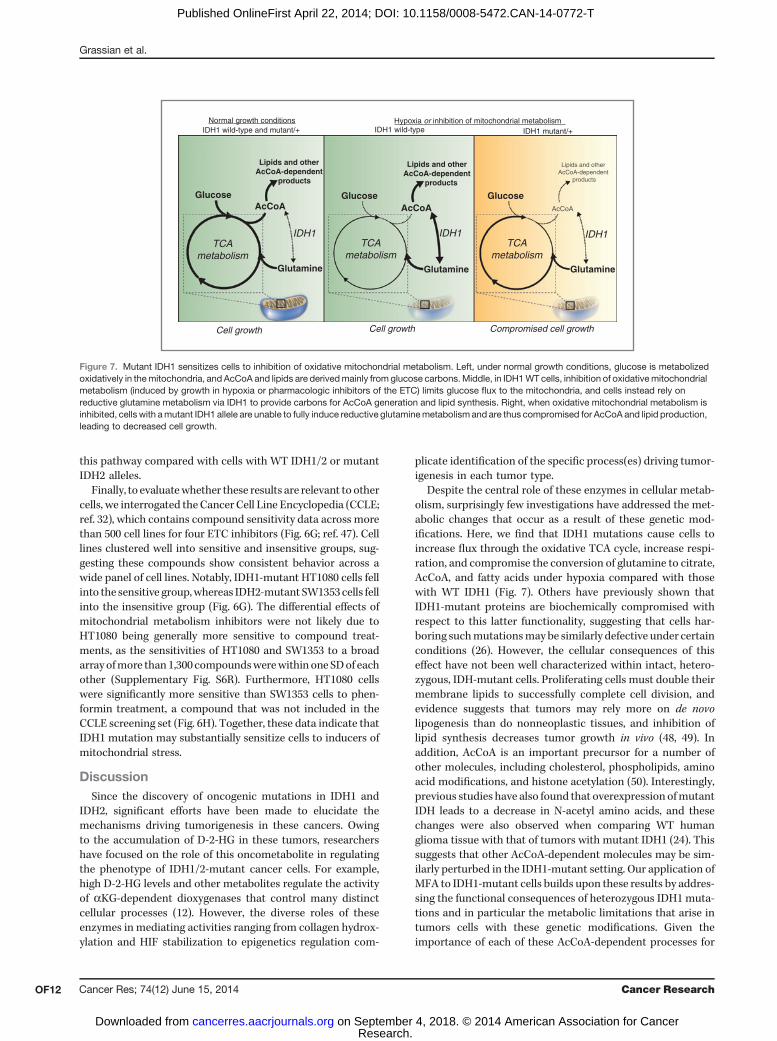
Despite the central role of these enzymes in cellular metab-olism, surprisingly few investigations have addressed the met-abolic changes that occur as a result of these genetic mod-ifications. Here, we find that IDH1 mutations cause cells toincrease flux through the oxidative TCA cycle, increase respi-ration, and compromise the conversion of glutamine to citrate,AcCoA, and fatty acids under hypoxia compared with thosewith WT IDH1 (Fig. 7). Others have previously shown thatIDH1-mutant proteins are biochemically compromised withrespect to this latter functionality, suggesting that cells har-boring suchmutationsmay be similarly defective under certainconditions (26). However, the cellular consequences of thiseffect have not been well characterized within intact, hetero-zygous, IDH-mutant cells. Proliferating cells must double theirmembrane lipids to successfully complete cell division, andevidence suggests that tumors may rely more on de novolipogenesis than do nonneoplastic tissues, and inhibition oflipid synthesis decreases tumor growth in vivo (48, 49). Inaddition, AcCoA is an important precursor for a number ofother molecules, including cholesterol, phospholipids, aminoacid modifications, and histone acetylation (50). Interestingly,previous studies have also found that overexpression ofmutantIDH leads to a decrease in N-acetyl amino acids, and thesechanges were also observed when comparing WT humanglioma tissue with that of tumors with mutant IDH1 (24). Thissuggests that other AcCoA-dependent molecules may be sim-ilarly perturbed in the IDH1-mutant setting. Our application ofMFA to IDH1-mutant cells builds upon these results by addres-sing the functional consequences of heterozygous IDH1 muta-tions and in particular the metabolic limitations that arise intumors cells with these genetic modifications. Given theimportance of each of these AcCoA-dependent processes for
IDH1 wild-type IDH1 mutant/+
Glucose
Glutamine
AcCoA
Lipids and other AcCoA-dependent
products
Cell growth Cell growth Compromised cell growth
TCAmetabolism
Glucose
Glutamine
AcCoA
Lipids and other AcCoA-dependent
products
IDH1 wild-type and mutant/+
TCAmetabolism
TCAmetabolism
IDH1 IDH1 IDH1
Glucose
Glutamine
AcCoA
Lipids and other AcCoA-dependent
products
Hypoxia or inhibition of mitochondrial metabolism Normal growth conditions
Figure 7. Mutant IDH1 sensitizes cells to inhibition of oxidative mitochondrial metabolism. Left, under normal growth conditions, glucose is metabolizedoxidatively in themitochondria, and AcCoA and lipids are derivedmainly from glucose carbons.Middle, in IDH1WT cells, inhibition of oxidativemitochondrialmetabolism (induced by growth in hypoxia or pharmacologic inhibitors of the ETC) limits glucose flux to the mitochondria, and cells instead rely onreductive glutamine metabolism via IDH1 to provide carbons for AcCoA generation and lipid synthesis. Right, when oxidative mitochondrial metabolism isinhibited, cells with amutant IDH1 allele are unable to fully induce reductive glutaminemetabolism and are thus compromised for AcCoA and lipid production,leading to decreased cell growth.
Cancer Res; 74(12) June 15, 2014 Cancer ResearchOF12
Grassian et al.
Research. on September 4, 2018. © 2014 American Association for Cancercancerres.aacrjournals.org Downloaded from
Published OnlineFirst April 22, 2014; DOI: 10.1158/0008-5472.CAN-14-0772-T

cellular homeostasis and proliferation, we speculate that thereduced metabolic flexibility of these cells contributes to thedecrease in growth rate that we observe in the IDH1-mutantcells under conditions of decreased oxidative mitochondrialmetabolism.Although 2-HG–mediated control of aKG-dependent diox-
ygenase activity clearly plays a role in tumorigenesis driven byIDHmutations (13–18, 20–23), our results provide insights intotherapeutic strategies that exploit themetabolic vulnerabilitiescaused by partial loss of WT IDH1 function. Interestingly, weobserve that IDH1-mutant cells do not exhibit pronouncedmetabolic differences in normoxia; however, growth in lowoxygen tensions or with pharmacologic inhibitors of mito-chondrial metabolism results in the emergence of dramaticmetabolic changes. Our MFA results identify several enzymesand pathways that are altered under hypoxia and in particularin the context of IDH1 mutations. Although compartment-specific IDH fluxes cannot be resolved with these data, thesefindings further highlight the importance of WT IDH1 activityin mediating reductive glutamine metabolism. Importantly,our results provide evidence that IDH1 mutations functionallycompromise cellular metabolism under conditions of lowoxygen levels, with the most pronounced effects beingincreased dependence on oxidativemitochondrial metabolismand an inability to induce reductive glutaminemetabolism.Weartificially induced such stresses using pharmacologic inhibi-tors of Complex I or manipulation of the oxygen tensions, andobserved selective growth rate reductions in several IDH1-mutant cells, but not in parental or IDH2-mutant cancer cells.Other recent studies have also highlighted the importance ofoxidativemitochondrial metabolism for tumor cell growth andsurvival both in vitro and in vivo (45, 51).These results suggest that compromised IDH1 functionmay
affect the proliferative capacity of tumor cells and furthermorethat IDH1-mutant tumors may be sensitive to inhibitors thatperturbmitochondrial metabolism.When comparing themet-abolic phenotype of tumor xenografts derived from parental orIDH1-mutant cells with our in vitro results, similar changeswere detected, including increased glutamine anaplerosis anda decreased aKG to citrate ratio. The increase in glutamineanaplerosis we observe in the IDH1-mutant cells is in agree-ment with previous findings, which suggest that IDH1-mutantcells display an increased sensitivity to glutaminase inhibitors(25). The similar metabolic changes that could be reliablymeasured in vivo suggest that the altered sensitivity we observeto inhibitors of mitochondrial metabolism in vitromay also betrue in vivo. Additional studies are required to determine ifcellular proliferation in the tumor microenvironment alonecan drive hypoxia and induce reductive glutaminemetabolism.Regardless, tumors would still be expected to increase theirreliance on WT IDH1 (or cytosolic TCA) activity when treatedwith phenformin or other inhibitors of mitochondrial metab-olism, suggesting that these strategies could be efficacious inIDH1-mutant cancers. As such, this increased susceptibility ofcultured IDH1-mutant cells relative to parental cells or IDH2-mutant cells provides intriguing evidence of a potential ther-apeutic strategy associated with IDH1 mutational status andwarrants further investigation in preclinical models.
We find that inhibition of mutant IDH1 is unable to reversethe observed metabolic phenotype. The DNA hypermethylatorphenotype, which is highly associated with IDH mutation, isalso not entirely reverted by a mutant IDH1 inhibitor (22),providing further evidence that some, but not all, mutant IDH-dependent phenotypes may be reversed by inhibitors targeting2-HGproduction.Mechanistically, this result also suggests thatthe metabolic defect we observe may be independent of 2-HGproduction. A previous study used biochemical assays toquantify the effects of IDH1 mutations on reductive carbox-ylation activity, and, in agreement with our findings here,demonstrated that the mutant enzymes are unable to catalyzethe conversion of aKG and CO2 to isocitrate (26). This studyconcluded that the subunits in a WT/mutant heterodimerfunction independently; however, our modeling data indicatethat heterozygous IDH1mutations lead to amuch greater than50% inhibition of reductive glutamine metabolism (Fig. 1F),suggesting a possible dominant effect of the mutant protein incells or alternatively global metabolic reprogramming inresponse to the compromised cytosolic IDH1 activity causedby these mutations.
Importantly, as small molecules capable of inhibitingmutant IDH1 enzymatic activity and preventing D-2-HGaccumulation fail to rescue mutant cell metabolism underhypoxia, this suggests that combinatorial therapeutic strat-egies that block oncogenic D-2-HG production (e.g., via amutant-selective inhibitor of enzyme function), while simul-taneously targeting mutant IDH1-induced metabolic liabil-ities, may be a viable option for therapy. Such an approachcould involve IDH1-mutant inhibitor treatment to attenuateany prosurvival or dedifferentiation effects of D-2-HG, whileincreasing the tumor's reliance on WT IDH1 activity throughan inhibitor of oxidative mitochondrial metabolism. Asdrugs that could target the mutant IDH1 metabolic pheno-type are already in the clinic (metformin, phenformin) andinhibitors of mutant IDH1 are currently being developed(22, 46), it is hoped that this hypothesis will be tested in theclinic in the near future.
Disclosure of Potential Conflicts of InterestA.S. Divakaruni is a consultant/advisory board member of Seahorse
Bioscience. M.G. Vander Heiden has ownership interest and is a consul-tant/advisory board member of Agios Pharmaceuticals. A.N. Murphy receiveda commercial research grant and is a consultant/advisory board member ofSeahorse Bioscience. C. Straub, J.D. Growney, and R. Pagliarini have owner-ship interest in Novartis. C.M. Metallo has honoraria from the speakers'bureau of Agios Pharmaceuticals. No potential conflicts of interest weredisclosed by the other authors.
Authors' ContributionsConception anddesign:A.R. Grassian, S.J. Parker, X. Zhang, F. Lin,M.G. VanderHeiden, A.N. Murphy, R. Pagliarini, C.M. MetalloDevelopment of methodology: A.R. Grassian, S.J. Parker, S.M. Davidson,A.S. Divakaruni, X. Zhang, C. Vickers, C. Joud-Caldwell, F. Chung, H. YinAcquisition of data (provided animals, acquired and managed patients,provided facilities, etc.): A.R. Grassian, S.J. Parker, S.M. Davidson, A.S. Diva-karuni, C.R. Green, X. Zhang, K.L. Slocum, M. Pu, F. Lin, F. Chung, H. Yin,E.D. Handly, C. Straub, J.D. Growney, A.N. Murphy, C.M. MetalloAnalysis and interpretation of data (e.g., statistical analysis, biostatistics,computational analysis): A.R. Grassian, S.J. Parker, S.M. Davidson, A.S. Diva-karuni, C.R. Green, X. Zhang, M. Pu, F. Lin, C. Joud-Caldwell, H. Yin, J.D. Growney,A.N. Murphy, R. Pagliarini, C.M. Metallo
www.aacrjournals.org Cancer Res; 74(12) June 15, 2014 OF13
IDH1 Mutations Sensitize Cells to Mitochondrial Inhibitors
Research. on September 4, 2018. © 2014 American Association for Cancercancerres.aacrjournals.org Downloaded from
Published OnlineFirst April 22, 2014; DOI: 10.1158/0008-5472.CAN-14-0772-T
Writing, review, and/or revision of the manuscript: A.R. Grassian,S.J. Parker, S.M. Davidson, C.R. Green, X. Zhang, F. Lin, F. Chung, C. Straub,M.G. Vander Heiden, R. Pagliarini, C.M. MetalloAdministrative, technical, or material support (i.e., reporting or orga-nizing data, constructing databases): A.R. Grassian, S.J. Parker, M. Pu, R.PagliariniStudy supervision:A.R. Grassian, S.J. Parker,M.G. Vander Heiden, A.N.Murphy,R. Pagliarini, C.M. Metallo
AcknowledgmentsThe authors thank Nicholas Keen, William Sellers, Jonathan Coloff, Julian
Levell, Charles Stiles, Juliet Williams, Brant Firestone, Wenlin Shao, JonathanSolomon, Frank Stegmeier, and the Novartis Postdoctoral Fellows for helpfuldiscussions of this work.
Grant SupportThis work was supported by Novartis Institutes for BioMedical Research,
American Cancer Society Institutional Research Grant 70-002 (C.M. Metallo),
the DOD Lung Cancer Research Program Grant W81XWH-13-1-0105 (C.M.Metallo), and a UC Cancer Research Coordinating Committee grant (C.M.Metallo). S.J. Parker is supported by the NIH/National Institute of Biomed-ical Imaging and Bioengineering Interfaces Training Grant. A.R. Grassian isthe recipient of a presidential postdoctoral fellowship from Novartis Insti-tutes for Biomedical Research. M.G. Vander Heiden and S.M. Davidsonacknowledge support from NIH grants R01CA168653 and 5-P30-CA14051-39, and support from the Koch Institute/DFHCC Bridge Project, the Bur-rough's Wellcome Fund, the Smith Family, the Ludwig Foundation, and theDamon Runyon Cancer Research Foundation.
The costs of publication of this article were defrayed in part by thepayment of page charges. This article must therefore be hereby markedadvertisement in accordance with 18 U.S.C. Section 1734 solely to indicatethis fact.
ReceivedMarch 14, 2014; acceptedMarch 21, 2014; publishedOnlineFirst April22, 2014.
References1. AraiM,NobusawaS, IkotaH, TakemuraS,NakazatoY. Frequent IDH1/
2mutations in intracranial chondrosarcoma: apossible diagnostic cluefor its differentiation from chordoma. Brain Tumor Pathol 2012;29:201–6.
2. Cairns RA, Iqbal J, Lemonnier F, Kucuk C, de Leval L, Jais JP, et al.IDH2 mutations are frequent in angioimmunoblastic T-cell lymphoma.Blood 2012;119:1901–3.
3. Hayden JT, Fruhwald MC, Hasselblatt M, Ellison DW, Bailey S, CliffordSC. Frequent IDH1 mutations in supratentorial primitive neuroecto-dermal tumors (sPNET) of adults but not children. Cell Cycle2009;8:1806–7.
4. Parsons DW, Jones S, Zhang X, Lin JC, Leary RJ, Angenendt P, et al.An integrated genomic analysis of human glioblastoma multiforme.Science 2008;321:1807–12.
5. Yan H, Parsons DW, Jin G, McLendon R, Rasheed BA, Yuan W, et al.IDH1 and IDH2 mutations in gliomas. N Engl J Med 2009;360:765–73.
6. Mardis ER, Ding L, Dooling DJ, Larson DE,McLellanMD, Chen K, et al.Recurring mutations found by sequencing an acute myeloid leukemiagenome. N Engl J Med 2009;361:1058–66.
7. Amary MF, Bacsi K, Maggiani F, Damato S, Halai D, Berisha F, et al.IDH1 and IDH2 mutations are frequent events in central chondrosar-coma and central and periosteal chondromas but not in other mes-enchymal tumours. J Pathol 2011;224:334–43.
8. Borger DR, TanabeKK, FanKC, LopezHU, Fantin VR, StraleyKS, et al.Frequent mutation of isocitrate dehydrogenase (IDH)1 and IDH2 incholangiocarcinoma identified through broad-based tumor genotyp-ing. Oncologist 2012;17:72–9.
9. WangP, DongQ, ZhangC, KuanPF, Liu Y, JeckWR, et al. Mutations inisocitrate dehydrogenase 1 and 2 occur frequently in intrahepaticcholangiocarcinomas and share hypermethylation targets with glio-blastomas. Oncogene 2012:1–10.
10. Ward PS, Patel J, Wise DR, Abdel-Wahab O, Bennett BD, Coller HA,et al. The common feature of leukemia-associated IDH1 andIDH2 mutations is a neomorphic enzyme activity convertingalpha-ketoglutarate to 2-hydroxyglutarate. Cancer Cell 2010;17:225–34.
11. Dang L, White DW, Gross S, Bennett BD, Bittinger MA, Driggers EM,et al. Cancer-associated IDH1mutations produce 2-hydroxyglutarate.Nature 2009;462:739–44.
12. Yen KE, Schenkein DP. Cancer-associated isocitrate dehydrogenasemutations. Oncologist 2012;17:5–8.
13. XuW,YangH, Liu Y, YangY,WangP, KimSH, et al. Oncometabolite 2-hydroxyglutarate is a competitive inhibitor of alpha-ketoglutarate-dependent dioxygenases. Cancer Cell 2011;19:17–30.
14. Figueroa ME, Abdel-Wahab O, Lu C, Ward PS, Patel J, Shih A, et al.Leukemic IDH1 and IDH2 mutations result in a hypermethylationphenotype, disrupt TET2 function, and impair hematopoietic differen-tiation. Cancer Cell 2010;18:553–67.
15. Lu C, Ward PS, Kapoor GS, Rohle D, Turcan S, Abdel-Wahab O, et al.IDH mutation impairs histone demethylation and results in a block tocell differentiation. Nature 2012;483:474–8.
16. Turcan S, Rohle D, Goenka A, Walsh LA, Fang F, Yilmaz E, et al. IDH1mutation is sufficient to establish the glioma hypermethylator pheno-type. Nature 2012;483:479–83.
17. Chowdhury R, Yeoh KK, Tian YM, Hillringhaus L, Bagg EA, Rose NR,et al. The oncometabolite 2-hydroxyglutarate inhibits histone lysinedemethylases. EMBO Rep 2011;12:463–9.
18. Sasaki M, Knobbe CB,Munger JC, Lind EF, Brenner D, Brustle A, et al.IDH1(R132H) mutation increases murine haematopoietic progenitorsand alters epigenetics. Nature 2012;488:656–9.
19. Wang F, Travins J, DeLaBarre B, Penard-Lacronique V, Schalm S,Hansen E, et al. Targeted inhibition of mutant IDH2 in leukemia cellsinduces cellular differentiation. Science 2013;340:622–6.
20. Losman JA, Looper RE, Koivunen P, Lee S, Schneider RK, McMahonC, et al. (R)-2-hydroxyglutarate is sufficient to promote leukemogen-esis and its effects are reversible. Science 2013;339:1621–5.
21. Koivunen P, Lee S, Duncan CG, Lopez G, Lu G, Ramkissoon S, et al.Transformation by the (R)-enantiomer of 2-hydroxyglutarate linked toEGLN activation. Nature 2012;483:484–8.
22. Rohle D, Popovici-Muller J, Palaskas N, Turcan S, Grommes C,Campos C, et al. An inhibitor of mutant IDH1 delays growth andpromotes differentiation of glioma cells. Science 2013;340:626–30.
23. Sasaki M, Knobbe CB, Itsumi M, Elia AJ, Harris IS, Chio II, et al. D-2-hydroxyglutarate produced by mutant IDH1 perturbs collagen matu-ration and basement membrane function. Genes Dev 2012;26:2038–49.
24. Reitman ZJ, Jin G, Karoly ED, Spasojevic I, Yang J, Kinzler KW, et al.Profiling the effects of isocitrate dehydrogenase 1 and 2 mutations onthe cellular metabolome. Proc Natl Acad Sci U S A 2011;108:3270–5.
25. Seltzer MJ, Bennett BD, Joshi AD, Gao P, Thomas AG, Ferraris DV,et al. Inhibition of glutaminase preferentially slows growth of gliomacells with mutant IDH1. Cancer Res 2010;70:8981–7.
26. Leonardi R, Subramanian C, Jackowski S, Rock CO. Cancer-associ-ated isocitrate dehydrogenase mutations inactivate NADPH-depen-dent reductive carboxylation. J Biol Chem 2012;287:14615–20.
27. Zamboni N. 13Cmetabolic fluxanalysis in complex systems.CurrOpinBiotechnol 2011;22:103–8.
28. Grassian AR, Lin F, Barrett R, Liu Y, JiangW, Korpal M, et al. Isocitratedehydrogenase (IDH)mutations promote a reversible ZEB1/microRNA(miR)-200-dependent epithelial-mesenchymal transition (EMT). J BiolChem 2012;287:42180–94.
29. Antoniewicz MR, Kelleher JK, Stephanopoulos G. Elementary metab-olite units (EMU): a novel framework for modeling isotopic distribu-tions. Metab Eng 2007;9:68–86.
30. Antoniewicz MR, Kelleher JK, Stephanopoulos G. Determination ofconfidence intervals of metabolic fluxes estimated from stable isotopemeasurements. Metab Eng 2006;8:324–37.
Cancer Res; 74(12) June 15, 2014 Cancer ResearchOF14
Grassian et al.
Research. on September 4, 2018. © 2014 American Association for Cancercancerres.aacrjournals.org Downloaded from
Published OnlineFirst April 22, 2014; DOI: 10.1158/0008-5472.CAN-14-0772-T
31. Metallo CM, Gameiro PA, Bell EL, Mattaini KR, Yang J, Hiller K, et al.Reductive glutamine metabolism by IDH1mediates lipogenesis underhypoxia. Nature 2012;481:380–4.
32. Barretina J, Caponigro G, Stransky N, Venkatesan K, Margolin AA,Kim S, et al. The Cancer Cell Line Encyclopedia enables predic-tive modelling of anticancer drug sensitivity. Nature 2012;483:603–7.
33. Wise DR,Ward PS, Shay JE, Cross JR, Gruber JJ, SachdevaUM, et al.Hypoxia promotes isocitrate dehydrogenase-dependent carboxyla-tion of alpha-ketoglutarate to citrate to support cell growth andviability. Proc Natl Acad Sci U S A 2011;108:19611–6.
34. Mullen AR,WheatonWW, Jin ES, Chen PH, Sullivan LB, Cheng T, et al.Reductive carboxylation supports growth in tumour cells with defec-tive mitochondria. Nature 2012;481:385–8.
35. Scott DA, Richardson AD, Filipp FV, Knutzen CA, Chiang GG, RonaiZA, et al. Comparative metabolic flux profiling of melanomacell lines: beyond the Warburg effect. J Biol Chem 2011;286:42626–34.
36. Fendt SM, Bell EL, Keibler MA, Olenchock BA, Mayers JR, Wasy-lenko TM, et al. Reductive glutamine metabolism is a function of thealpha-ketoglutarate to citrate ratio in cells. Nat Commun 2013;4:2236.
37. Gameiro PA, Yang J, Metelo AM, Perez-Carro R, Baker R, Wang Z,et al. In vivo HIF-mediated reductive carboxylation is regulated bycitrate levels and sensitizes VHL-deficient cells to glutamine depriva-tion. Cell Metab 2013;17:372–85.
38. Le A, Lane AN, Hamaker M, Bose S, Gouw A, Barbi J, et al. Glucose-independent glutamine metabolism via TCA cycling for proliferationand survival in B cells. Cell Metab 2012;15:110–21.
39. Metallo CM, Vander Heiden MG. Understanding metabolic regulationand its influence on cell physiology. Mol Cell 2013;49:388–98.
40. MetalloCM,Walther JL, StephanopoulosG. Evaluation of 13C isotopictracers for metabolic flux analysis in mammalian cells. J Biotechnol2009;144:167–74.
41. Young JD, Walther JL, Antoniewicz MR, Yoo H, StephanopoulosG. An elementary metabolite unit (EMU) based method of isoto-
pically nonstationary flux analysis. Biotechnol Bioeng 2008;99:686–99.
42. Fendt SM, Bell EL, Keibler MA, Davidson SM, Wirth GJ, Fiske B, et al.Metformin decreases glucose oxidation and increases the dependen-cy of prostate cancer cells on reductive glutaminemetabolism. CancerRes 2013;73:4429–38.
43. McClintock DS, Santore MT, Lee VY, Brunelle J, Budinger GR, ZongWX, et al. Bcl-2 familymembers and functional electron transport chainregulate oxygen deprivation-induced cell death. Mol Cell Biol 2002;22:94–104.
44. Hockel M, Vaupel P. Tumor hypoxia: definitions and current clini-cal, biologic, and molecular aspects. J Natl Cancer Inst 2001;93:266–76.
45. Marin-Valencia I, Yang C, Mashimo T, Cho S, Baek H, Yang XL, et al.Analysis of tumormetabolism revealsmitochondrial glucose oxidationin genetically diverse human glioblastomas in the mouse brain in vivo.Cell Metab 2012;15:827–37.
46. Popovici-Muller J, Saunders JO, Salituro FG, Travins JM, Yan SQ,Zhao F, et al. Discovery of the first potent inhibitors ofmutant IDH1 thatlower tumor 2-HG in vivo. ACS Med Chem Lett 2012;3:850–5.
47. Lai K, Selinger DW, Solomon JM, Wu H, Schmitt E, Serluca FC, et al.Integrated compound profiling screens identify the mitochondrialelectron transport chain as themolecular target of the natural productsmanassantin, sesquicillin, and arctigenin. ACS Chem Biol 2013;8:257–67.
48. Medes G, Thomas A, Weinhouse S. Metabolism of neoplastic tissue.IV. A study of lipid synthesis in neoplastic tissue slices in vitro. CancerRes 1953;13:27–9.
49. Hatzivassiliou G, Zhao F, Bauer DE, Andreadis C, ShawAN, Dhanak D,et al. ATP citrate lyase inhibition can suppress tumor cell growth.Cancer Cell 2005;8:311–21.
50. Kaelin WG Jr, McKnight SL. Influence of metabolism on epigeneticsand disease. Cell 2013;153:56–69.
51. Grassian AR, Metallo CM, Coloff JL, Stephanopoulos G, Brugge JS.Erk regulation of pyruvate dehydrogenase flux through PDK4 mod-ulates cell proliferation. Genes Dev 2011;25:1716–33.
www.aacrjournals.org Cancer Res; 74(12) June 15, 2014 OF15
IDH1 Mutations Sensitize Cells to Mitochondrial Inhibitors
Research. on September 4, 2018. © 2014 American Association for Cancercancerres.aacrjournals.org Downloaded from
Published OnlineFirst April 22, 2014; DOI: 10.1158/0008-5472.CAN-14-0772-T

Published OnlineFirst April 22, 2014.Cancer Res Alexandra R. Grassian, Seth J. Parker, Shawn M. Davidson, et al. MetabolismIncrease Dependence on Oxidative Mitochondrial IDH1 Mutations Alter Citric Acid Cycle Metabolism and
Updated version
10.1158/0008-5472.CAN-14-0772-Tdoi:
Access the most recent version of this article at:
Material
Supplementary
http://cancerres.aacrjournals.org/content/suppl/2014/04/22/0008-5472.CAN-14-0772-T.DC1
Access the most recent supplemental material at:
E-mail alerts related to this article or journal.Sign up to receive free email-alerts
Subscriptions
Reprints and
To order reprints of this article or to subscribe to the journal, contact the AACR Publications
Permissions
Rightslink site. (CCC)Click on "Request Permissions" which will take you to the Copyright Clearance Center's
.http://cancerres.aacrjournals.org/content/early/2014/05/27/0008-5472.CAN-14-0772-TTo request permission to re-use all or part of this article, use this link
Research. on September 4, 2018. © 2014 American Association for Cancercancerres.aacrjournals.org Downloaded from
Published OnlineFirst April 22, 2014; DOI: 10.1158/0008-5472.CAN-14-0772-T