Embed Size (px)
Citation preview
Dynamic Systems and Applications 29 (2020) 87-100
IDENTIFICATION OF STRUCTURAL DAMAGE TOTRANSMISSION TOWER STRUCTURE BASED ON DYNAMIC
FINGERPRINTING AND BAYES DATA FUSION
XIUFENG WU1,*, YONGFENG ZUO1, LIANG BING1, CHUNLING YANG1,AND ZHENGNAN GE2
1LiaoNing Technical University, FuXin City, LiaoNing Province, China2YuRun Group, NanJing City, JiangSu Province, China*Corresponding author. E-mail: [email protected]
ABSTRACT. This paper focuses on damage identification in transmission tower structure duringoperation. Using the dynamic principle of fingerprint identification, studied that the structuraldamage identification effect of two characteristic factors, curvature modal loss and average numericalmodal strain energy of transmission tower structure. Then, Bayes data fusion is carried out withthese two kinds of data, and the probability model of transmission tower structure damage calculationbased on Bayes network classifier is established. Then, the study analyzes the impact of noise on theaccuracy of damage identification. The results show that Bayes data fusion based on curvature modalloss and average numerical modal strain energy is beneficial to the identification of transmissiontower structure damage location and degree, and improves the identification calculation efficiencyand accuracy.
AMS Subject Classification. 15B15
Keywords. dynamic fingerprint; curvature modal loss; modal strain energy; data fusion; Bayes
network; structural damage identification.
1. Introduction
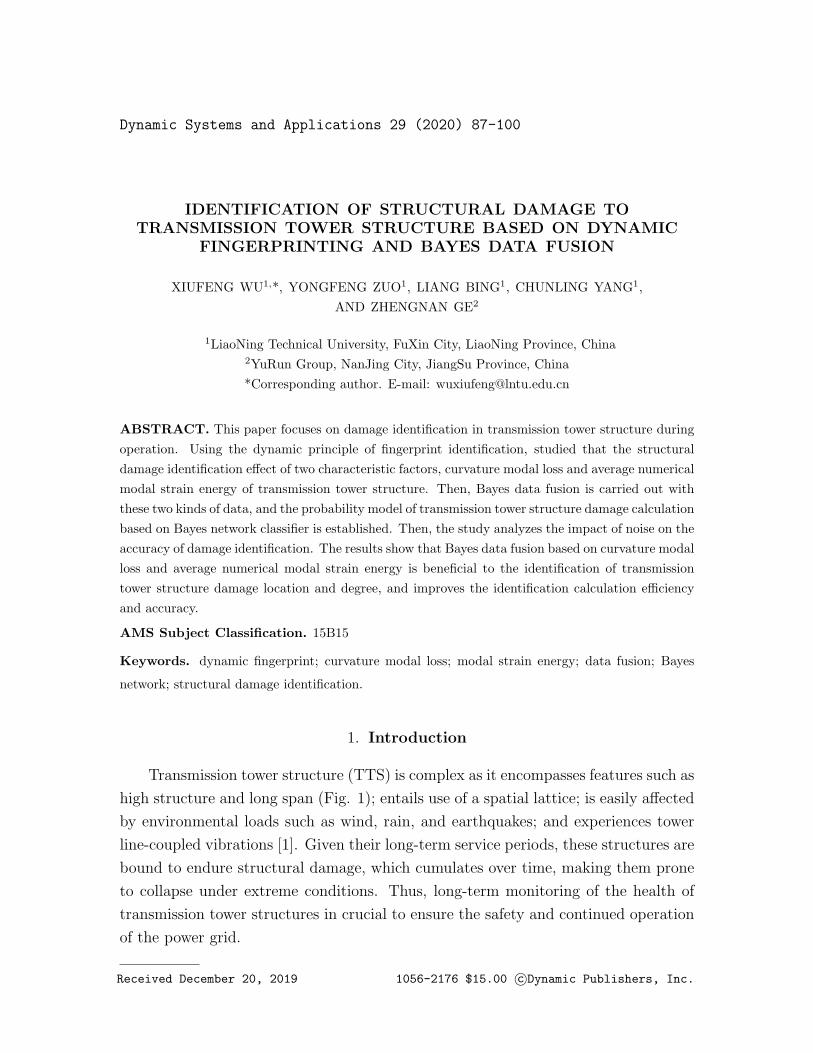
Transmission tower structure (TTS) is complex as it encompasses features such as
high structure and long span (Fig. 1); entails use of a spatial lattice; is easily affected
by environmental loads such as wind, rain, and earthquakes; and experiences tower
line-coupled vibrations [1]. Given their long-term service periods, these structures are
bound to endure structural damage, which cumulates over time, making them prone
to collapse under extreme conditions. Thus, long-term monitoring of the health of
transmission tower structures in crucial to ensure the safety and continued operation
of the power grid.
Received December 20, 2019 1056-2176 $15.00 c©Dynamic Publishers, Inc.
88 X. WU, Y. ZUO, L. BING, C. YANG, AND Z. GE
Figure 1. Seismic damage map of transmission tower
In recent decades, research on structural damage identification has been a popular
topic in the engineering field and remarkable progress has been made in this area.
The basic power fingerprints studied thus far can be generalized into four categories
[2]: direct modal parameter class (encompassing parameters such as frequency and
vibration mode) [3], modal parameter function class (including parameters such as
the square of frequency, modal strain energy, modal guarantee criteria, coordinate
modality assurance criteria, modal flexibility, and residual force vector) [4], curvature
class (including parameters such as modal curvature, and flexibility curvature) [5],
and vibration signal non-modal processing (encompassing Fourier transform, short-
time Fourier transform, wavelet/package analysis, blind source separation, and so on.
Generally, using strain parameters (strain, modal strain energy, curvature mode, etc.)
as the basis for identifying damage location is preferable to utilizing displacement
parameters (displacement, displacement mode, and flexibility matrix).
In recent years, the data fusion method has been applied to structural damage
identification. This method avoids the misjudgment in the degree of damage that
using a single index (modal curvature and modal strain energy) would entail, and
confers the advantage of strong noise immunity as it modifies and merges multi-sensor
data. Currently, popular data fusion methods include neural networks, Bayes theory
[6], D-S evidence theory [7], and Fuzzy set theory [8]. Bayes data fusion method,
which is effective when there is less data, can deal with multiple types of problems.
This study divides the discussion on damage identification into two parts. First,
it is imperative to locate the damage and estimate the extent of damage to the TTS
using the finite element model (FEM). Two damage identification methods, namely,
the mean curvature mode difference factor and the average modal strain energy change
rate, are used in this study. Second, fusing the dynamic fingerprint data through
Bayes reasoning allows accurate location identification of difficult to detect structural
damage in the presence of noise. Third, the Bayes network classification algorithm is
IDENTIFICATION OF STRUCTURAL DAMAGE TO TRANSMISSION TOWER STRUCTURE 89
applied to analyze different damage conditions. The proposed numerical simulation
method provides ideal test results, wherein even minor damage can be detected easily.
The validity of this method was thus verified.
2. Evaluation indexes for damage location in TTS
Curvature-based damage identification was proposed by Pandey and Biswas (1994)
[9]. This method has been shown to have good sensitivity to structural damage.
Stubbs et al. were the first to devise a formula for modal strain energy before and af-
ter damage occurred using the Euler-Bernoulli beam theory [10]. Thus, they deduced
the damage index related to the stiffness before and after damage. Thereafter, many
scholars have helped improve upon the identification of damage location in complex
structures. Sohn and Law(2015) extended Bayes model correction method to the case
of multiple damage of structures, and solved the multiple damage identification prob-
lems of multi-storey frame structures and concrete bridge piers respectively [11]. The
Bayes model correction method for on-line monitoring of the structure, use a series of
identified modal parameters are calculated by continuous correction model stiffness
parameters, in a specific ratio is less than the corresponding initial model of stiffness
parameters of probability, the maximum possible reduction of stiffness at a certain
position within the structure is taken as a pointer to damage at the corresponding
position.
2.1. Average curvature mode damage factor (CMDave). According to material
mechanics, the relationship between curvature and bending stiffness can be expressed
as
(1) k(x) =1
ρ(x)=
M(x)
E(x)I(x)
where k(x) is the curvature, ρ(x) is the radius of curvature after deformation of the
beam axis, M(x) is the bending moment, and E(x)I(x) is the bending stiffiness. x
refers to the beam’s axis coordinate.
Curvature modal analysis cannot provide direct estimates; it provides an approx-
imate calculation using the displacement mode provided by the formula on curvature
center difference. Considering order i and modal node j, curvature kij is given by
Yang et al. (2015) [12].
(2) kij =∅i(j−1) − 2∅ij + ∅i(j+1)
(∆x)2
∅i(j−1), ∅ij, and ∅i(j+1) denote the displacement mode values for order i and modal
nodes j − 1, j and j + 1, respectively, and ∆x is the distance between two adjacent
points.

90 X. WU, Y. ZUO, L. BING, C. YANG, AND Z. GE
Considering order i and modal node j, the curvature mode difference factor
CMDij is defined as
(3) CMDij =∣∣kdij − kuij∣∣
where kuij and kdij respectively are the curvature of order i and modal node j before
and after the structural damage occurs.
For multiple orders i and node j, the following formula for average curvature
mode damage factor is applicable.
(4) CMDavej =1
m
m∑i=1
CMDij
Here, m is the total number of modes.
2.2. Average modal strain energy change rate (MSEave). The modal strain
energy MSEuij and MSEd
ij before and after structural damage for order i and modal
node j can be respectively defined as [13]:
(5) MSEuij =
1
2
{∅ui,j}T [
Kuj
] {∅ui,j}
(6) MSEdij =
1
2
{∅di,j}T [
Kdj
] {∅di,j}
where{∅ui,j}
and{∅di,j}
respectively denote the vibration mode vector before and
after structural damage, and[Kuj
]and
[Kdj
]respectively refer to the element stiff-
ness matrix before and after structural damage. When element j is damaged and
its struffness is unknown, one can use element j′ stiffness matrix in the calculation
instead.
An elements modal strain energy variety (MSEC) before and after structural
damage can be expressed as below (note that higher orders are disregarded here).
(7) MSEi,j = MSEdi,j −MSEu
i,j
Element MSEC is a factor sensitive to the location of the structural damage.
Thus, it can be used to judge the position of damage in a structure (Wei et al. 2016)
[14]. This indicator, also called the modal strain energy rate (MSE), can be expressed
as
(8) MSEi,j =
∣∣MSEdi,j −MSEu
i,j
∣∣MSEu
i,j
To reduce the influence of noise in the modal vibration mode, one uses the mul-
timodal mode vibration mode to judge the positions of damage in the structure. The

IDENTIFICATION OF STRUCTURAL DAMAGE TO TRANSMISSION TOWER STRUCTURE 91
average modal strain energy change rate AMSECRj for element j and modal vibration
mode m is defined as
(9) MSEavej =1
m
m∑i=1
MSEi,j
Before calculating the structures strain energy, the minimal error method can be
extended with the tested vibration mode to an untested degree of freedom [15].
Dividing the vibration mode into two parts is dependent on whether the test
has been completed. Thus, the ith order vibration mode equation can be written as
follows:
(10)
{[[Kαα] [Kαβ]
[Kβα] [Kββ]
]− τi
[[Mαα] [Mαβ]
[Mβα] [Mββ]
]}{{∅αi}{φβi}
}≈ {0}
where α and β respectively correspond to the measured and untested degrees of
freedom. In order to facilitate analysis, the matrix in the left-hand bracket of the
equation is denoted as [N ], such that
(11) [N ] =
[[Kαα] [Kαβ]
[Kβα] [Kββ]
]− τi
[[Mαα] [Mαβ]
[Mβα] [Mββ]
]=
[[Nαα] [Nαβ]
[Nβα] [Nββ]
]
After extending the order, the ith order modal’s residual vector {δi} is expressed
as seen below and the formula’s right-hand side becomes {0}.
(12) {δi} =
[[Nαα]
[Nβα]
][[Nαβ]
[Nββ]
]{{{∅αi}{{φβi}
}
The square sum error of mode i is expressed as Si
Si = {δi}T {δi} =[{∅αi}T {∅βi}T
]
(13)
[[Nαα]T [Nβα]T
[Nβα]T [Nββ]T
][[Nαα] [Nαβ]
[Nβα] [Nββ]
]{{∅αi}{φβi}
}
If µSiµ{ρβi} = {0}, Si attains its minimum value, such that
{∅βi} =− {[Nβα] [Nαα] + [Nββ] [Nβα]} {∅αi} {[Nβα] [Nαβ]
+ [Nββ] [Nββ]}−1(14)
3. Damage identification based on Bayes theorem data fusion
3.1. Bayes theorem data fusion method. The application of Bayes theorem in
data fusion can be expressed such that A = A1, A2, . . . , An for n recognition targets,
92 X. WU, Y. ZUO, L. BING, C. YANG, AND Z. GE
B = {B1, B2, . . . , Bm} for sensor m, and prior probability is P (Ai) . The following
conditional probability matrix can be obtained for sensor m:P (B1|A1) · · · P (B1|An)
.... . .
...
P (Bm|A1) · · · P (Bm|An)
The recognition probability of target Ai is
P (Ai|B) =P (B|Ai)P (Ai)∑ni=1 P (B|Ai)P (Ai)
=
∏mj=1 P (Bj|Ai)P (Ai)∑n
i=1
[∏nj=1 P (Bj|Ai)P (Ai)
](15)
3.2. Application of Bayes classifier. Bayes classifier uses the Bayes network clas-
sification algorithm to identify the degree of structural damage. This network includes
class node C, where the value of C is derived from the class collection (C1, C2, . . . , Cn) ,
and it also contains a set of nodes X = (x1, x2, . . . , xm) , which are features for the
classification. To enable TTS damage identification using the Bayes network classifi-
cation algorithm, a damage location is identified alongside the classification charac-
teristic value for X = (x1, x2, . . . , xm) . The probability of damage degree for category
Ci is denoted as:
(16) P (C = Ci|X = x) =P (X = x|C = Ci)P (C = Ci)
P (X = x)
The Bayes network classifier can be categorized into two stages. The first stage is
Bayes network classifier learning, namely, constructing classifiers from sample data, as
well structure learning and conditional probability tables (CPTs). This stage analyzes
dynamic fingerprint data sets to arrive at a characteristic value, and calculates the
damage degree as a set of classes. In the second stage, the results of the structure
learning and CPTs aid the completion of Bayes classifier network reasoning; the
conditional probability of class nodes is calculated and the test sample is classified.
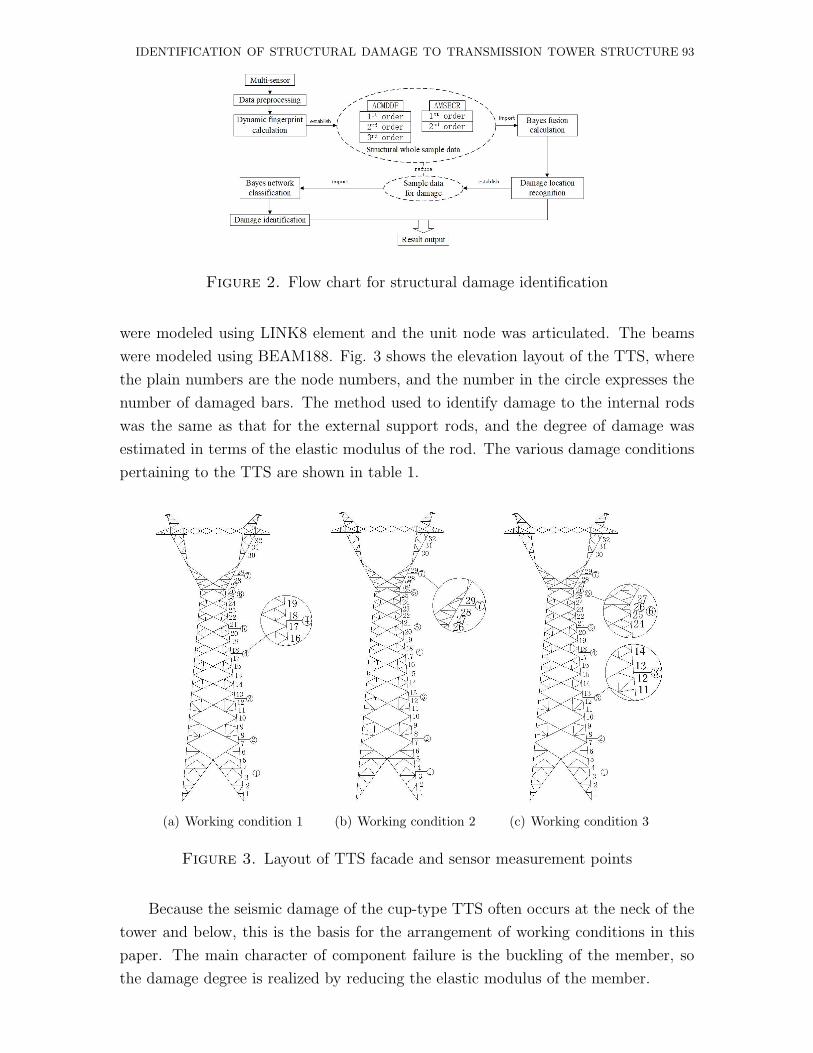
The process for TTS damage identification is shown in Fig. 2.
4. Numerical simulation of damage identification based on Bayes data
fusion
4.1. Damage model for TTS. This study referred to cup-type TTS and conducted
the numerical simulation using the lumped mass point method to attach the wires and
insulators to the suspension point. The height of the TTS was assumed to be 51 m.
ANSYS software was used to model the beam and truss elements, that structural steel
is used for all the truss members. The basic parameters of the FEM were as follows:
elastic modulus E = 2.06× 10⁵MPa and density = 7800kg/m3. The rod elements
IDENTIFICATION OF STRUCTURAL DAMAGE TO TRANSMISSION TOWER STRUCTURE 93
Figure 2. Flow chart for structural damage identification
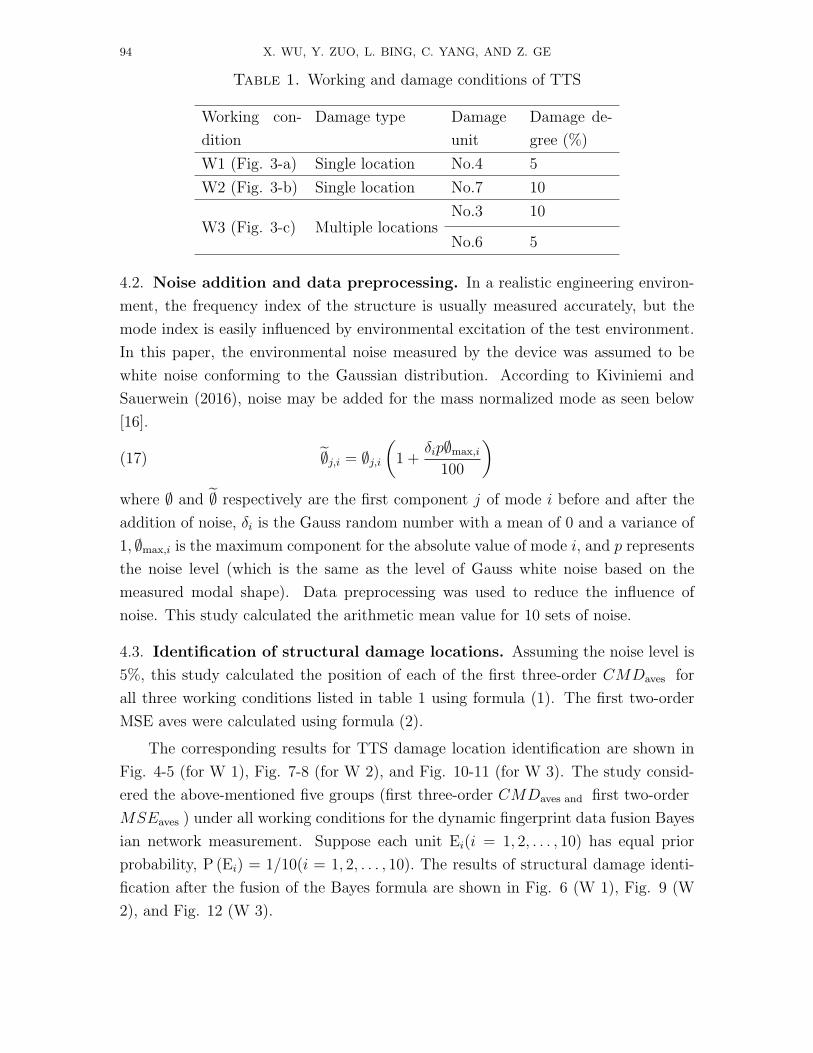
were modeled using LINK8 element and the unit node was articulated. The beams
were modeled using BEAM188. Fig. 3 shows the elevation layout of the TTS, where
the plain numbers are the node numbers, and the number in the circle expresses the
number of damaged bars. The method used to identify damage to the internal rods
was the same as that for the external support rods, and the degree of damage was
estimated in terms of the elastic modulus of the rod. The various damage conditions
pertaining to the TTS are shown in table 1.
(a) Working condition 1 (b) Working condition 2 (c) Working condition 3
Figure 3. Layout of TTS facade and sensor measurement points
Because the seismic damage of the cup-type TTS often occurs at the neck of the
tower and below, this is the basis for the arrangement of working conditions in this
paper. The main character of component failure is the buckling of the member, so
the damage degree is realized by reducing the elastic modulus of the member.
94 X. WU, Y. ZUO, L. BING, C. YANG, AND Z. GE
Table 1. Working and damage conditions of TTS
Working con-
dition
Damage type Damage
unit
Damage de-
gree (%)
W1 (Fig. 3-a) Single location No.4 5
W2 (Fig. 3-b) Single location No.7 10
W3 (Fig. 3-c) Multiple locationsNo.3 10
No.6 5
4.2. Noise addition and data preprocessing. In a realistic engineering environ-
ment, the frequency index of the structure is usually measured accurately, but the
mode index is easily influenced by environmental excitation of the test environment.
In this paper, the environmental noise measured by the device was assumed to be
white noise conforming to the Gaussian distribution. According to Kiviniemi and
Sauerwein (2016), noise may be added for the mass normalized mode as seen below
[16].
(17) ∅j,i = ∅j,i(
1 +δip∅max,i
100
)where ∅ and ∅ respectively are the first component j of mode i before and after the
addition of noise, δi is the Gauss random number with a mean of 0 and a variance of
1, ∅max,i is the maximum component for the absolute value of mode i, and p represents
the noise level (which is the same as the level of Gauss white noise based on the
measured modal shape). Data preprocessing was used to reduce the influence of
noise. This study calculated the arithmetic mean value for 10 sets of noise.
4.3. Identification of structural damage locations. Assuming the noise level is
5%, this study calculated the position of each of the first three-order CMDaves for
all three working conditions listed in table 1 using formula (1). The first two-order
MSE aves were calculated using formula (2).
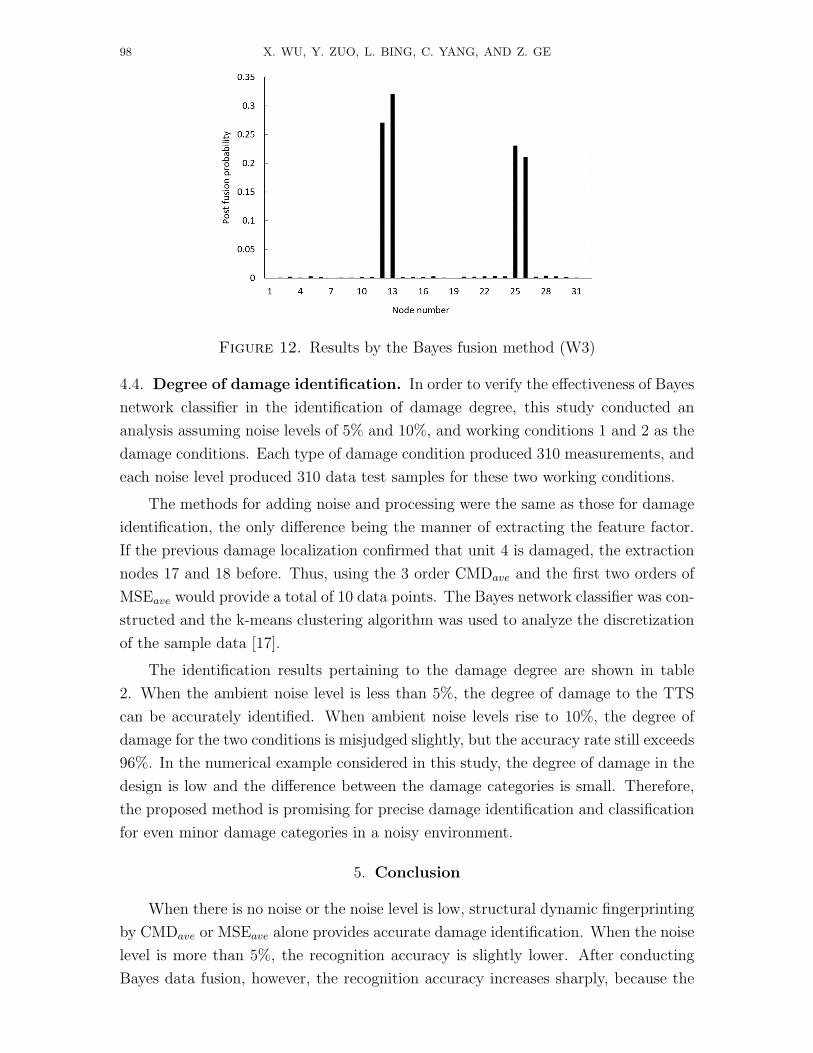
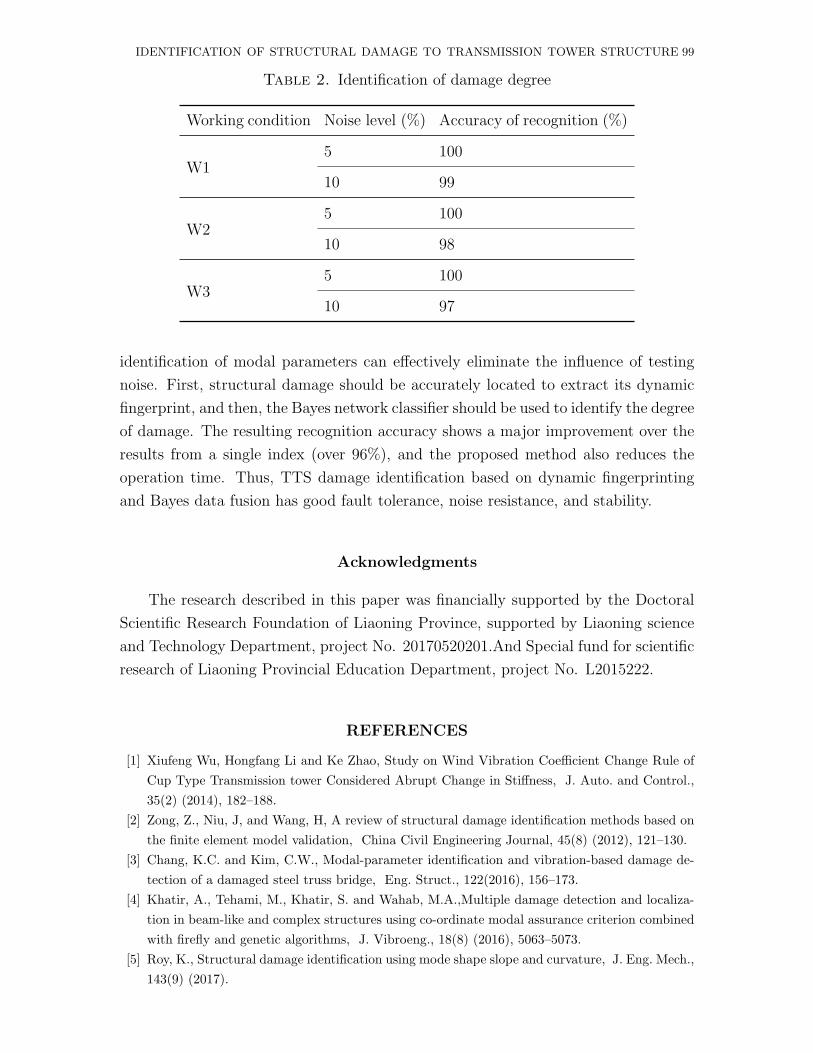
The corresponding results for TTS damage location identification are shown in
Fig. 4-5 (for W 1), Fig. 7-8 (for W 2), and Fig. 10-11 (for W 3). The study consid-
ered the above-mentioned five groups (first three-order CMDaves and first two-order
MSEaves ) under all working conditions for the dynamic fingerprint data fusion Bayes
ian network measurement. Suppose each unit Ei(i = 1, 2, . . . , 10) has equal prior
probability, P (Ei) = 1/10(i = 1, 2, . . . , 10). The results of structural damage identi-
fication after the fusion of the Bayes formula are shown in Fig. 6 (W 1), Fig. 9 (W
2), and Fig. 12 (W 3).
IDENTIFICATION OF STRUCTURAL DAMAGE TO TRANSMISSION TOWER STRUCTURE 95
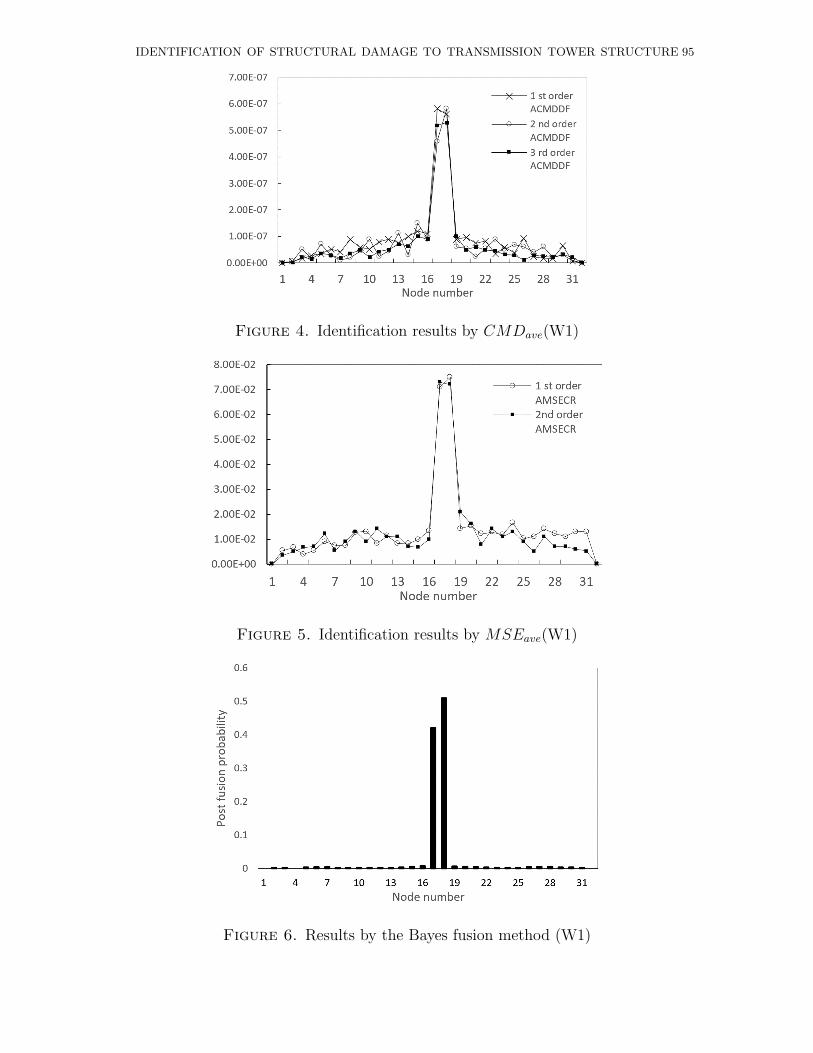
Figure 4. Identification results by CMDave(W1)
Figure 5. Identification results by MSEave(W1)
Figure 6. Results by the Bayes fusion method (W1)
96 X. WU, Y. ZUO, L. BING, C. YANG, AND Z. GE
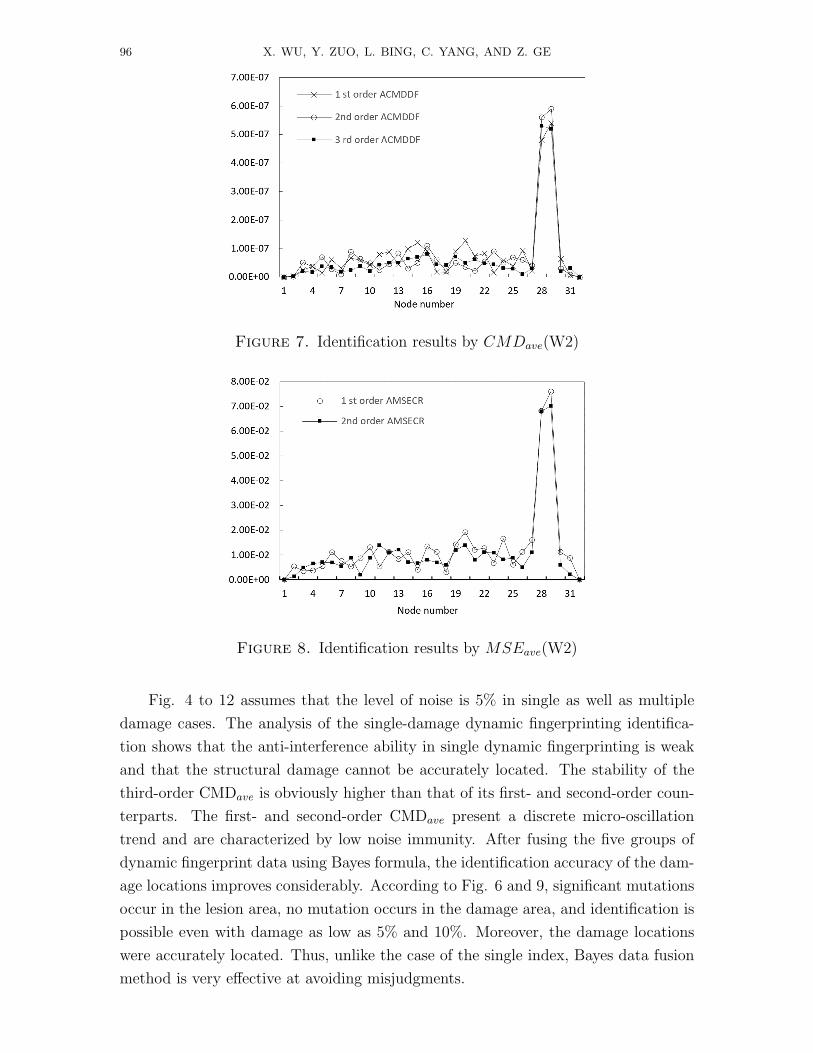
Figure 7. Identification results by CMDave(W2)
Figure 8. Identification results by MSEave(W2)
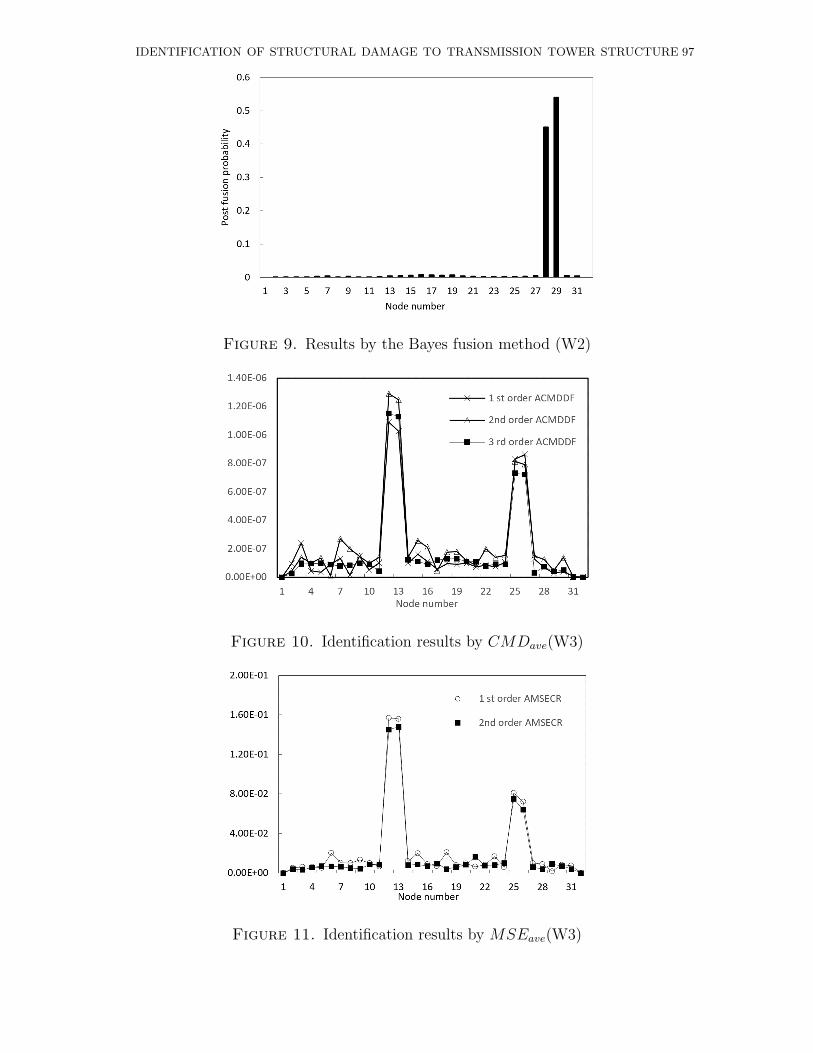
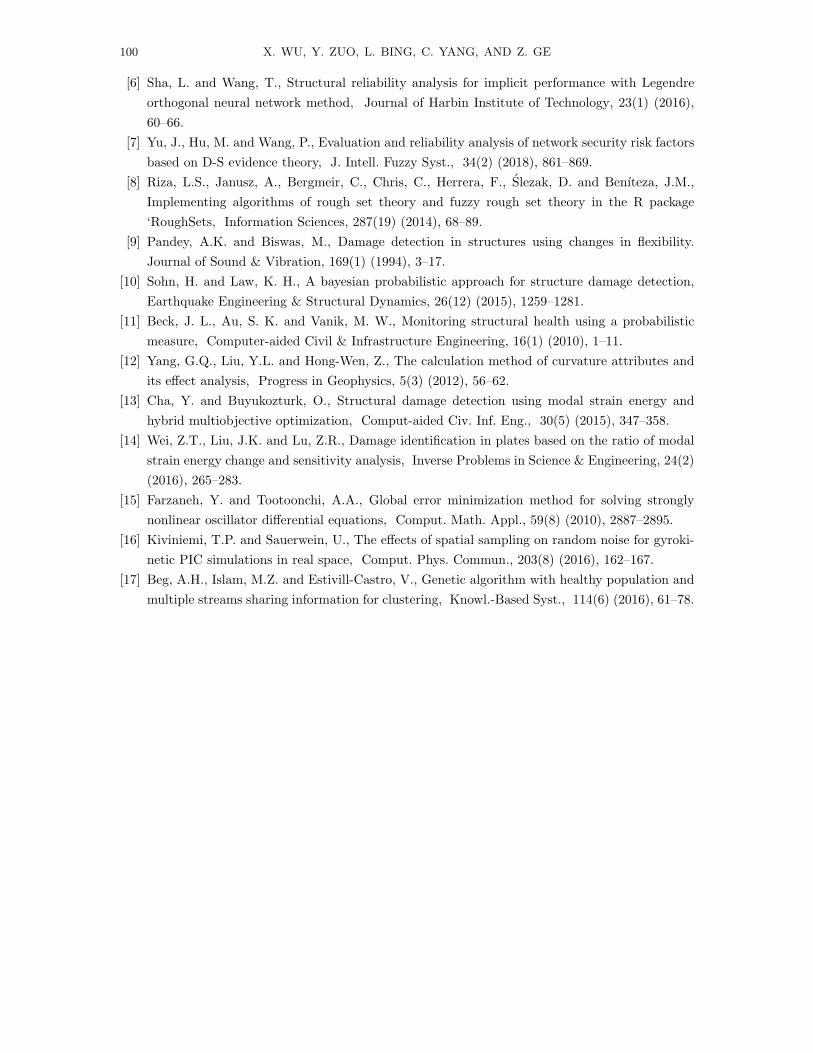
Fig. 4 to 12 assumes that the level of noise is 5% in single as well as multiple
damage cases. The analysis of the single-damage dynamic fingerprinting identifica-
tion shows that the anti-interference ability in single dynamic fingerprinting is weak
and that the structural damage cannot be accurately located. The stability of the
third-order CMDave is obviously higher than that of its first- and second-order coun-
terparts. The first- and second-order CMDave present a discrete micro-oscillation
trend and are characterized by low noise immunity. After fusing the five groups of
dynamic fingerprint data using Bayes formula, the identification accuracy of the dam-
age locations improves considerably. According to Fig. 6 and 9, significant mutations
occur in the lesion area, no mutation occurs in the damage area, and identification is
possible even with damage as low as 5% and 10%. Moreover, the damage locations
were accurately located. Thus, unlike the case of the single index, Bayes data fusion
method is very effective at avoiding misjudgments.
IDENTIFICATION OF STRUCTURAL DAMAGE TO TRANSMISSION TOWER STRUCTURE 97
Figure 9. Results by the Bayes fusion method (W2)
Figure 10. Identification results by CMDave(W3)
Figure 11. Identification results by MSEave(W3)
98 X. WU, Y. ZUO, L. BING, C. YANG, AND Z. GE
Figure 12. Results by the Bayes fusion method (W3)
4.4. Degree of damage identification. In order to verify the effectiveness of Bayes
network classifier in the identification of damage degree, this study conducted an
analysis assuming noise levels of 5% and 10%, and working conditions 1 and 2 as the
damage conditions. Each type of damage condition produced 310 measurements, and
each noise level produced 310 data test samples for these two working conditions.
The methods for adding noise and processing were the same as those for damage
identification, the only difference being the manner of extracting the feature factor.
If the previous damage localization confirmed that unit 4 is damaged, the extraction
nodes 17 and 18 before. Thus, using the 3 order CMDave and the first two orders of
MSEave would provide a total of 10 data points. The Bayes network classifier was con-
structed and the k-means clustering algorithm was used to analyze the discretization
of the sample data [17].
The identification results pertaining to the damage degree are shown in table
2. When the ambient noise level is less than 5%, the degree of damage to the TTS
can be accurately identified. When ambient noise levels rise to 10%, the degree of
damage for the two conditions is misjudged slightly, but the accuracy rate still exceeds
96%. In the numerical example considered in this study, the degree of damage in the
design is low and the difference between the damage categories is small. Therefore,
the proposed method is promising for precise damage identification and classification
for even minor damage categories in a noisy environment.
5. Conclusion
When there is no noise or the noise level is low, structural dynamic fingerprinting
by CMDave or MSEave alone provides accurate damage identification. When the noise
level is more than 5%, the recognition accuracy is slightly lower. After conducting
Bayes data fusion, however, the recognition accuracy increases sharply, because the
IDENTIFICATION OF STRUCTURAL DAMAGE TO TRANSMISSION TOWER STRUCTURE 99
Table 2. Identification of damage degree
Working condition Noise level (%) Accuracy of recognition (%)
W15 100
10 99
W25 100
10 98
W35 100
10 97
identification of modal parameters can effectively eliminate the influence of testing
noise. First, structural damage should be accurately located to extract its dynamic
fingerprint, and then, the Bayes network classifier should be used to identify the degree
of damage. The resulting recognition accuracy shows a major improvement over the
results from a single index (over 96%), and the proposed method also reduces the
operation time. Thus, TTS damage identification based on dynamic fingerprinting
and Bayes data fusion has good fault tolerance, noise resistance, and stability.
Acknowledgments
The research described in this paper was financially supported by the Doctoral
Scientific Research Foundation of Liaoning Province, supported by Liaoning science
and Technology Department, project No. 20170520201.And Special fund for scientific
research of Liaoning Provincial Education Department, project No. L2015222.
REFERENCES
[1] Xiufeng Wu, Hongfang Li and Ke Zhao, Study on Wind Vibration Coefficient Change Rule ofCup Type Transmission tower Considered Abrupt Change in Stiffness, J. Auto. and Control.,35(2) (2014), 182–188.
[2] Zong, Z., Niu, J, and Wang, H, A review of structural damage identification methods based onthe finite element model validation, China Civil Engineering Journal, 45(8) (2012), 121–130.
[3] Chang, K.C. and Kim, C.W., Modal-parameter identification and vibration-based damage de-tection of a damaged steel truss bridge, Eng. Struct., 122(2016), 156–173.
[4] Khatir, A., Tehami, M., Khatir, S. and Wahab, M.A.,Multiple damage detection and localiza-tion in beam-like and complex structures using co-ordinate modal assurance criterion combinedwith firefly and genetic algorithms, J. Vibroeng., 18(8) (2016), 5063–5073.
[5] Roy, K., Structural damage identification using mode shape slope and curvature, J. Eng. Mech.,143(9) (2017).
100 X. WU, Y. ZUO, L. BING, C. YANG, AND Z. GE
[6] Sha, L. and Wang, T., Structural reliability analysis for implicit performance with Legendreorthogonal neural network method, Journal of Harbin Institute of Technology, 23(1) (2016),60–66.
[7] Yu, J., Hu, M. and Wang, P., Evaluation and reliability analysis of network security risk factorsbased on D-S evidence theory, J. Intell. Fuzzy Syst., 34(2) (2018), 861–869.
[8] Riza, L.S., Janusz, A., Bergmeir, C., Chris, C., Herrera, F., Slezak, D. and Benıteza, J.M.,Implementing algorithms of rough set theory and fuzzy rough set theory in the R package‘RoughSets, Information Sciences, 287(19) (2014), 68–89.
[9] Pandey, A.K. and Biswas, M., Damage detection in structures using changes in flexibility.Journal of Sound & Vibration, 169(1) (1994), 3–17.
[10] Sohn, H. and Law, K. H., A bayesian probabilistic approach for structure damage detection,Earthquake Engineering & Structural Dynamics, 26(12) (2015), 1259–1281.
[11] Beck, J. L., Au, S. K. and Vanik, M. W., Monitoring structural health using a probabilisticmeasure, Computer-aided Civil & Infrastructure Engineering, 16(1) (2010), 1–11.
[12] Yang, G.Q., Liu, Y.L. and Hong-Wen, Z., The calculation method of curvature attributes andits effect analysis, Progress in Geophysics, 5(3) (2012), 56–62.
[13] Cha, Y. and Buyukozturk, O., Structural damage detection using modal strain energy andhybrid multiobjective optimization, Comput-aided Civ. Inf. Eng., 30(5) (2015), 347–358.
[14] Wei, Z.T., Liu, J.K. and Lu, Z.R., Damage identification in plates based on the ratio of modalstrain energy change and sensitivity analysis, Inverse Problems in Science & Engineering, 24(2)(2016), 265–283.
[15] Farzaneh, Y. and Tootoonchi, A.A., Global error minimization method for solving stronglynonlinear oscillator differential equations, Comput. Math. Appl., 59(8) (2010), 2887–2895.
[16] Kiviniemi, T.P. and Sauerwein, U., The effects of spatial sampling on random noise for gyroki-netic PIC simulations in real space, Comput. Phys. Commun., 203(8) (2016), 162–167.
[17] Beg, A.H., Islam, M.Z. and Estivill-Castro, V., Genetic algorithm with healthy population andmultiple streams sharing information for clustering, Knowl.-Based Syst., 114(6) (2016), 61–78.