Embed Size (px)
Citation preview
Agrifood Research Reports 133 Agrifood Research Reports 133
Sirja Viitala
133 Identification of genes controlling milk production in dairy cattle. Doctoral Dissertation
Animal Production
Identification of genes controlling milk production in dairy cattle
Doctoral Dissertation

MTT Agrifood Research Finland
Agrifood Research Reports 133 76 pages, 5 appendices
Identification of genes controlling milk production in dairy cattle
Doctoral Dissertation
Sirja Viitala
Academic DissertationTo be presented, with the permission of the Faculty of
Mathematics and Natural Sciences of the University of Turku, for public criticism in Auditorium II of Main Building,
on November 28th 2008, at 12 o’clock.

2
Supervisor: Dr. Johanna Vilkki
MTT Agrifood Research Finland
Reviewers: Professor Moshe Soller
The Hebrew University of Jerusalem, Israel
Professor Jeremy F. Taylor
University of Missouri-Columbia, USA
Opponent: Professor Sigbjørn Lien
Norwegian University of Life Sciences
Custos: Professor Craig Primmer
University of Turku, Finland
ISBN 978-952-487-199-0 (Printed version) ISBN 978-952-487-200-3 (Electronic version)
ISSN 1458-5073 (Printed version) ISSN 1458-5081 (Electronic version) http://www.mtt.fi/met/pdf/met133.pdf
Copyright MTT Agrifood Research Finland
Sirja Viitala Distribution and sale
MTT Agrifood Research Finland, Information Management FI-31600 Jokioinen, Finland, phone + 358 3 4188 2327, e-mail [email protected]
Printing year 2008
Cover picture Tapio Tuomela/MTT:n arkisto
Printing house Tampereen Yliopistopaino - Juvenes Print Oy

3
To women of my family

4
Identification of genes controlling milk production in dairy cattle
Sirja Viitala
MTT Agrifood Research Finland, Department of Biotechnology and Food Research, FI-31600 Jokioinen, Finland, [email protected]
AbstractThe main motivations for mapping quantitative trait loci (QTL) in dairy cattle are based not only on the biological interest to understand the complex genetic architecture of trait variation but also on applying genomic information to prac-tical breeding schemes in order to enhance selection programs. The use of mo-lecular genetic information in marker assisted selection (MAS) would be most effective if the genetic architecture of quantitative traits of interest is understood completely. This level of understanding seems to be remote. With the current mapping approaches it is possible to detect QTL that have major effects on trait variation but the true challenge is the identification of gene(s) and nucleotide variant(s) underlying the QTL effect. In this study QTL affecting milk production traits (milk yield, protein yield, fat yield, protein content and fat content) were mapped in Finnish Ayrshire dairy cattle. A whole genome scan was conducted by 12 half-sib families in a graddaughter design. A male genetic linkage map covering all 29 autosomes was constructed by genotyping 150 markers in these families. The map was utilised in interval mapping using a multiple marker regression approach. The empirical significance thresholds were estimated by permutation. The genome scan based on single chromosome analysis uncovered two significant QTL at 5% genome-wise significance, and 14 suggestive QTL at 5% chromosome-wise significance. This approach was extended to analyse multiple chromosomes simultaneously using the 14 suggestive QTL as cofactors in order to increase the power and the precision of QTL detection. The analysis revealed in total 31 genome-wise significant QTL (Pgenome < 0.0029).
One of the highest test statistics observed in the initial genome scan was detected on chromosome 20. Two candidate genes that have important roles in mammary gland physiology were mapped to the region of interest – the genes encoding receptor molecules of growth hormone (GHR) and prolactin (PRLR). The po-tential roles of GHR and PRLR in milk production was studied in two popula-tions, in Dutch Holstein-Friesian and in Finnish Ayrshire. Sequence analysis revealed four missense mutations in GHR (F279Y, N528T, A541S, S555G) and two in PRLR (S18N, L186P). In both breeds the GHR F279Y polymorphism was clearly associated with milk yield and composition. It was considered unlikely, however, that F279Y accounts for the entire chromosome 20 QTL effect. In Finnish Ayrshire the QTL effect was partly explained by another polymorphism, PRLR S18N. The results provide strong evidence that the effect of PRLR S18N is distinct from the GHR F279Y effect. In particular, F279Y has the highest influ-
5
ence on content traits while S18N influences yield traits. This, and the observed interaction between the two loci, supports the hypothesis that both GHR and PRLR contribute to the QTL effects of chromosome 20.
A method for trait associated gene diagnosis from bovine embryos was also developed in order to apply the gene mapping results at a more practical level. GHR F279Y and PRLR S18N together with a selection marker for sex were genotyped from in vitro and in vivo embryos. The method proved to be highly accurate but needs to be adjusted for substantially higher number of markers in order to respond to the needs of modern breeding applications.
Key words: dairy cattle, milk, QTL, QTN, gene mapping, GHR, PRLR, MAS

6
List of original articlesThe thesis is a summary and discussion of the following articles, which are re-ferred to by their Roman numerals I-V.
I Viitala,S.M.; Schulman,N.F.; de Koning,D.J.; Elo,K.; Kinos,R.; Virta,A.; Virta,J.; Maki-Tanila,A.; Vilkki,J.H. Quantitative trait loci affecting milk production traits in Finnish Ayrshire dairy cattle. J.Dairy Sci., 2003, 86, 5, 1828-1836.
II Moisio,S.; Elo,K.; Kantanen,J.; Vilkki,J. Polymorphism within the 3’ flan-king region of the bovine growth hormone receptor gene. Anim.Genet., 1998, 29, 1, 55-57.
III Blott,S.; Kim,J.J.; Moisio,S.; Schmidt-Kuntzel,A.; Cornet,A.; Berzi,P.; Cambisano,N.; Ford,C.; Grisart,B.; Johnson,D.; Karim,L.; Simon,P.; Snell,R.; Spelman,R.; Wong,J.; Vilkki,J.; Georges,M.; Farnir,F.; Coppieters,W. Mo-lecular dissection of a quantitative trait locus: a phenylalanine-to-tyrosine substitution in the transmembrane domain of the bovine growth hormone receptor is associated with a major effect on milk yield and composition Ge-netics, 2003, 163, 1, 253-266
IV Viitala,S.; Szyda,J.; Blott,S.; Schulman,N.; Lidauer,M.; Maki-Tanila,A.; Georges,M.; Vilkki,J. The role of the bovine growth hormone receptor and prolactin receptor genes in milk, fat and protein production in Finnish Ayr-shire dairy cattle. Genetics, 2006, 173, 4, 2151-2164
V Peippo,J.; Viitala,S.; Virta,J.; Raty,M.; Tammiranta,N.; Lamminen,T.; Aro,J.; Myllymaki,H.; Vilkki,J. Birth of correctly genotyped calves after multiplex marker detection from bovine embryo microblade biopsies. Mol.Reprod.Dev., 2007, 74, 11, 1373-1378
Reprints of the original articles I, II, III, IV and V are published with the kind permission of the copyright owners: American Dairy Science Association (I), Wiley-Blackwell (II), Genetics Society of America (III, IV) and Wiley-Liss, Inc. (a subsidiary of John Wiley & Sons, Inc; V).

7
Contribution of the author Viitala (née Moisio):
I The author carried out the genotyping of the microsatellite markers and constructed linkage maps for several chromosomes (approxima-tely one third). The author carried out the data editing, the part of the statistical analyses, participated in interpreting the results and was the main author of the paper.
II The author carried out all the molecular work, constructed the linka-ge map, performed concordance analysis, participated in interpreting the results and was the main author of the paper.
III & IV The author together with her supervisor came up with the original idea of GHR and PRLR being candidate genes for lactation related trait QTL on chromosome 20. The author carried out part of the mo-lecular work (approximately one half) and participated in interpreting the results (III & IV). For paper III the statistical analyses were main-ly done by Jong-Joo Kim, and the writing of the first draft of the ma-nuscript by Sarah Blott. For paper IV the collection of new material and the additional molecular studies were done under supervision of the author and the statistical analyses were done by the author and Jo-anna Szyda (University of Wroclaw). The author wrote the manusc-ript.
V The findings from III and IV were utilised in paper V. The author su-pervised the molecular work on SNP detection and wrote the mole-cular genetics part of the manuscript and participated in the editing of the paper.

8
Symbols and abbreviations
ABCG2 ATP-binding cassette, subfamily G, member 2AI artificial inseminationBAC bacterial artificial chromosomeBES BAC end sequenceBIC Bayesian information criterionBTA bovine (Bos taurus) chromosomeCI confidence intervalcM centi MorganDD daughter designDGAT1 diacylglycerol O-acyltransferase 1DNA deoxyribonucleic acidDYD daughter yield deviationEBV estimated breeding valueECD extracellular domainF% fat content (%)FISH fluorecence in situ hybridizationFY fat yield (kg)GDD granddaughter designGDF-8 growth differentiation factor 8 (myostatin)GH growth hormoneGHR growth hormone receptorGT galactosyltransferaseIBD identical by decentIC information contentICD intracellular domainIGF1 insulin-like growth factor 1IGF2 insulin-like growth factor 2JAK2 Janus kinase 2α-LA α-lactalbuminLD linkage disequilibriumLRT likelihood-ratio testMAS marker assisted selectionMOET multiple ovulation embryo transfermRNA messenger ribonucleic acidMTT Agrifood Research FinlandMY milk yield (kg)P% protein content (%)PCR polymerase chain reactionPIC polymorphism information contentPL placental lactogen

9
PRL prolactinPRLR prolactin receptorPY protein yield (kg)QTL quantitative trait locus/lociQTN quantitative trait nucleotideRFLP restriction fragment length polymorphismRH radiation hybridSNP single nucleotide polymorphismSTAT signal transducers and activators of transcriptionTMD transmembrane domainUTR untranslated regionWGS whole genome shot-gun
10
Contents1 Introduction ............................................................................................. 12
1.1 Mapping quantitative trait loci in dairy cattle .............................. 12
1.1.1 Quantitative trait loci (QTL) and QTL mapping ............. 12
1.1.2 Experimental designs ....................................................... 13
1.1.3 Genetic markers ............................................................... 15
1.1.4 Gene maps and other genomic resources ......................... 16
1.1.5 QTL linkage mapping ...................................................... 17
1.1.6 QTL fine mapping ............................................................ 19
1.1.7 Gene identification and confirmation ............................... 21
1.2 QTL studies and practical applications in dairy cattle ................. 23
2 Objective ................................................................................................. 26
3 Materials and methods ............................................................................ 26
3.1 Animal material and family structure .......................................... 26
3.2 Phenotypes ................................................................................... 26
3.3 Candidate gene polymorphisms ................................................... 27
3.4 Marker genotyping and linkage maps .......................................... 28
3.5 Statistical methods ....................................................................... 29
4 Results ..................................................................................................... 31
4.1 Identification of QTL affecting milk yield and composition ....... 31
4.1.1 Construction of a genetic linkage map of the bovine ge-nome ................................................................................. 31
4.1.2 QTL for milk production traits ........................................ 34
4.2 Molecular dissection of the milk production QTL on BTA20 ..... 35
4.2.1 Chromosomal assignment of candidate genes ................. 35
4.2.2 DNA sequence polymorphism in the candidate genes ..... 35
4.2.3 QTL for milk production traits – a confirmation ............ 37
4.2.4 Effect of candidate gene polymorphisms on milk yield and composition ...................................................................... 38
4.3 Genotyping bovine embryos – a practical application ................. 39
5 Discussion .............................................................................................. 42

11
5.1 Identification of QTL affecting milk production traits in Finnish Ayrshire ....................................................................................... 42
5.2 GHR and PRLR are strong candidates for the QTL effect on chromosome 20 ............................................................................ 44
5.3 Detection of DNA sequence polymorphism in GHR and PRLR . 46
5.4 Confirmation of the QTL effects in extended population ............ 48
5.5 The effects on milk composition can be explained by two distinct genes ............................................................................................ 49
5.6 GHR F279Y is a strong candidate for the observed QTL effect . 50
5.7 The importance of variation in the GHR cytoplasmic domain .... 53
5.8 PRLR S18N is likely to be in LD with the true mutation causing the effect....................................................................................... 54
5.9 Proving causality is difficult and needs to be based on multiple pieces of evidence ........................................................................ 55
5.10 Practical applications of the trait associated polymorphisms ...... 58
6 Conclusions ............................................................................................. 60
7 Acknowledgements ................................................................................. 63
8 References ............................................................................................... 65
9 Appendices ............................................................................................. 77

12
Introduction1
Mapping quantitative trait loci in dairy cattle1.1
Quantitative trait loci (QTL) and QTL mapping1.1.1
Most biological traits, such as growth, behavior, reproductive fitness, and dise-ase resistance, have a complex inheritance, which means that they are controlled by multiple genes and influenced by environmental factors. These traits show continuous distribution of phenotypic values rather than discrete values as is the case with qualitative, monogenic traits (e.g. Falconer and Mackay 1996). Quan-titative variation plays important roles in biology and therefore understanding of the genetic and environmental factors behind such variation is important in several biological contexts including e.g. medicine, agriculture and understan-ding evolution. The recent development of analytical tools and genomic resour-ces for various species have made it possible to unravel the genetic architectu-re of quantitative traits by identifying chromosomal loci affecting these traits. These chromosomal regions are generally termed quantitative trait loci (QTL; Falconer and Mackay 1996; Geldermann 1975).
The rationale of QTL mapping in domestic animals is based not only on the biological interest to understand the complex genetic architecture of trait varia-tion but also on applying genomic information to practical breeding schemes in order to enhance selection programs (Andersson 2001; Dekkers and Hospi-tal 2002). By applying quantitative genetic approaches to breeding, enormous advances have been achieved in livestock and crop productivity in the past few decades without detailed knowledge of the genetic architecture underlying the selected characters (Dekkers and Hospital 2002). The recent advantages in do-mestic animal genomics have raised the promise of molecular genetic tools that could assist selection especially in such cases where a quantitative genetics ap-proach is less powerful. In order to understand the molecular nature of quan-titative trait variation several successful efforts to map loci that affect econo-mically important, quantitative traits in dairy cattle have been reported (revie-wed by Khatkar et al. 2004). With the current mapping approaches it is, howe-ver, possible to detect only those loci that have major effects on trait variation and therefore the understanding of complex trait inheritance to such a degree that all genetic factors are identified and their effects, interactions and respon-ses to different environmental conditions are fully understood seems to be re-mote. However, QTL mapping is a successful opening in order to unravel the inheritance of complex traits.
The general idea of identifying QTL is to search for correlation between neut-ral genetic markers (inherited DNA polymorphisms) and a quantitative pheno-

13
type in a structured pedigree. The use of neutral markers for QTL mapping is based on the existence of linkage disequilibrium (LD) between the marker and the QTL (e.g. Mackay 2001a). The marker-QTL LD exists always within fami-lies and leads to an association between the markers and the phenotype that is affected by the QTL. A usual strategy for QTL mapping is a genome scan whe-re whole genome linkage mapping is first used to identify a chromosomal re-gion affecting the trait and then the size of the QTL region and thus the num-ber of potential candidate genes is reduced by higher resolution mapping (e.g. Andersson 2001). If genomic sequence or comparative sequence information is available the most promising candidates in that region are further studied (po-sitional candidate-gene approach) or if not the defined region is cloned and se-quenced for gene identification (positional cloning). In both cases mutations are then searched for until the gene associated with the trait is discovered. If a promising candidate is known at an early stage of the study it is also possible to reverse the strategy so that the association between a phenotype and a candi-date gene (or markers nearby) is tested first and then confirmed with genetic or functional analysis (candidate gene approach). However, this strategy has be-come less attractive because with the present-day knowledge of genes and their functions it is difficult to say how many and which genes are involved in trait variation, making the candidate gene approach uncertain (Andersson 2001). In practice, however, promising candidate genes can be and usually are included as markers in initial linkage analyses if sequence polymorphisms for the can-didates are available.
The basic resources needed for QTL mapping are appropriate pedigrees of po-pulations with samples of genomic DNA and records for the traits of interest, and the selection of molecular markers and statistical methods that utilize the preceding information in order to identify QTL and to estimate their positions and effects. The essential resources for cattle QTL mapping are briefly pre-sented in the following sections.
Experimental designs1.1.2
QTL have been identified both from experimental and existing populations. The most powerful way to map QTL is to use experimental crossings of inbred strains or lines that are genetically different for the traits of interest (Lynch and Walsh 1998). The idea is to mix two types of genomes through repeated cros-sings in order to create variation in traits that are fixed in inbred parental lines. There are several ways to create mapping populations and also to study associa-tion between quantitative phenotypes and genetic markers (reviewed by Doer-ge 2002). Regardless of the experimental design the beauty of inbred line cros-ses is that the environment can be controlled, the parental origin of each alle-le is known and the first offspring generation is genetically identical showing complete LD. In domestic animals inbred line crossings are practical only in

14
the chicken. In chicken QTL mapping the practice has been to cross two high-ly divergent lines, either two inbred lines or an outbred line with an inbred line (reviewed by Abasht et al. 2006).
For most domestic animals inbred lines are not available. Experimental crosses of outbred populations are usually impractical and expensive particularly for large animals. An experiment with reasonable power to detect QTL in the F2 pedigree requires hundreds of offspring and further improvement of the map-ping resolution requires thousands of additional offspring (Darvasi 1998). The nature of the traits also poses challenges; some traits are only measurable af-ter a few years in production or after slaughter and some traits are measurable only from one sex. In animal breeding the main interest is in variation within breeds and therefore crossing two different breeds for QTL identification does not provide any additional value. However, some experimental crosses have been implemented in order to get particularly interesting phenotypic data or in-formation about the genes underlying domestication. For example, experimen-tal crosses between domesticated Large White pigs and their wild-type proge-nitors, European Wild Boars, have been generated to identify QTL for growth and fatness (Andersson et al. 1994). In cattle an intercross between bovine subs-pecies, Bos taurus and Bos indicus, was utilized to localize the locus respon-sible for the ‘polled’ phenotype (Brenneman et al. 1996).
The difficulty in applying designs such as experimental crosses to map QTL in large animals with long generation times and the usual aim to identify QTL for a particular population has motivated the exploitation of existing pedigree structures. In dairy cattle the use of artificial insemination (AI) creates lar-ge half-sib families where the number of daughters of a single bull can reach thousands or even more. These paternal half-sister or half-brother pedigrees are useful for QTL mapping experiments. The most popular experimental design has been the granddaughter design (GDD) described by Weller et al. (1990). A single three-generation family of a granddaughter design comprises a grandsire and a random sample of his sons (20 or more) each having 100 or more daugh-ters (granddaughters). Marker genotyping and linkage analysis are performed for the grandsire and his sons and the phenotypic observations are made on the granddaughters. The phenotypic observations are further transformed to highly reliable breeding values for the sons. In the more classical scheme, the daughter design (DD; Neimann-Sorensen and Robertson 1961), a single family compri-ses two generations, a sire and daughters. In the daughter design all individu-als are genotyped for the markers and the phenotypic observations are made on the daughters.
The popularity of the GDD can be explained by its QTL detection power relative to genotyping costs. Weller et al. (1990) estimated and compared the power of the two designs and showed that for equivalent power smaller numbers of mar-

15
ker assays are needed for a GDD compared to a daughter design. The increase of power of the GDD over the DD is a result of highly accurate estimates of the breeding values for the sires. The greatest advantage is gained if the QTL effect is small and the heritability of the trait is small or moderate (Weller et al. 1990). In addition, sample collection for sires is easier to organize than the extensive blood sample collection needed for a DD – the number of samples needed for a GDD is smaller and usually the bull semen samples are available and centrali-zed in national AI centers. The DD can be advantageous if other than routinely recorded phenotypic data are needed because compared to a GDD less pheno-types need to be collected. Georges et al. (1995) first applied the granddaugh-ter design to real data after which a large number of similar studies have been reported for diverse breeds of cattle (reviewed by Khatkar et al. 2004).
Genetic markers1.1.3
A marker is any genetic element which can be detected by phenotype, cytolo-gical or molecular techniques, and used to follow a chromosome or chromo-somal segment during genetic analysis (http://www.everythingbio.com/glos/index.php). Since the invention of recombinant DNA technology and in vitro amplification of DNA in the 1980’s DNA markers have gradually replaced ot-her marker types. The first DNA markers used in linkage studies were rest-riction fragment length polymorphisms (RFLP; Botstein et al. 1980). In the RFLP technique DNA sequence polymorphisms are detected as differences in restriction fragment banding patterns which are due to the presence or ab-sence of a restriction enzyme cleavage site at given place in the genome. In the 1990’s microsatellites superseded the widely used RFLPs (Weber and May 1989). Microsatellites are stretches of tandemly repeated DNA in which a re-peat element can vary from 1 to 6 nucleotides (Vaiman 2005). The numbers of repeat elements are usually highly variable between individuals and the allelic differences are seen as length variation of fragments amplified by polymerase chain reaction with primers flanking the repeat region. Because microsatelli-tes are relatively evenly situated throughout mammalian genomes they are use-ful for gene mapping. Microsatellites have been the predominant marker type in genetic linkage maps of cattle until now (Barendse et al. 1994; Bishop et al. 1994; Barendse et al. 1997; Kappes et al. 1997; Ihara et al. 2004). Presently, a high number of single nucleotide polymorphisms (SNPs) are being discovered alongside sequencing of genomes of various species including cattle. The pro-cess of bovine genome sequencing has resulted in nearly 2 million identified SNPs (http://www.ensembl.org; http://www.hgsc.bcm.tmc.edu/projects/bovi-ne/). With microarray technology tens or hundreds of thousands of SNPs can be genotyped for the same price as few hundred microsatellites and therefore such high-density SNP panels will become the standard genotyping system in many species including domestic animals in the near future (Georges 2007).

16
Gene maps and other genomic resources1.1.4
DNA markers can be ordered into gene maps. A genetic linkage map is an es-sential tool providing the framework for linkage analysis of monogenic as well as complex traits. A linkage map is an abstract representation of a chromosome that shows the position of loci (e.g. markers) relative to each other in terms of re-combination. The first cattle genetic maps were constructed with a few hundred markers and had incomplete genomic coverage (Barendse et al. 1994; Bishop et al. 1994; Georges et al. 1995; Ma et al. 1996). Barendse et al. (1997) and Kappes et al. (1997) described second generation linkage maps where the resolution was improved from a few hundred to approximately one thousand markers and the genomic coverage was nearly complete. The most comprehensive genetic linka-ge map consists of 3960 markers with an average interval of 1.4 cM and covers 3160 cM of 29 autosomes and the X chromosome (Ihara et al. 2004).
The marker density of these maps has been sufficient for detecting QTL in geno-me scans but inadequate for fine mapping or positional cloning. Radiation hy-brid (RH) mapping is a powerful way to improve map resolution and to integ-rate maps of different origins (Chowdhary and Raudsepp 2005). The advantage of RH mapping over linkage mapping is that any piece of sequence informati-on can be assigned and ordered onto chromosomes without the need for poly-morphisms or a pedigree. Several whole genome RH panels are available for cattle (Womack et al. 1997; Rexroad et al. 2000; Williams et al. 2002; Itoh et al. 2005) and have been used to construct RH maps of different resolution and for diverse purposes (e.g. Rexroad et al. 1999; Band et al. 2000; Amaral et al. 2002; Williams et al. 2002; Larkin et al. 2003; Everts-van der Wind et al. 2004; Itoh et al. 2005; Jann et al. 2006; Snelling et al. 2007).
All mapping approaches are prone to errors for different reasons. The accura-cy and reliability of maps can be improved by combining information derived from different maps to produce integrated composite maps. Jann et al. (2006) constructed a second generation bovine RH map of 3966 markers by integrating a novel RH map with previously reported RH (Everts-van der Wind et al. 2005) and linkage maps (Ihara et al. 2004). The possibility to integrate different maps and comparative information makes the RH method a powerful tool for trans-ferring genomic information from one species to another. An efficient strategy for building comparative maps especially for map-poor species is to utilize bac-terial artificial clone (BAC) libraries to produce BAC-end sequences (BESs) for the species of interest and then to map the sequences that align with the human genome sequence by RH mapping (Fujiyama et al. 2002; Gregory et al. 2002). BAC libraries have been constructed also for cattle (Cai et al. 1995; Eggen et al. 2001; Warren et al. 2000; http://bacpac.chori.org/bovine240.htm). Larkin et al. (2003) reported the first BAC clone-based, multispecies comparative map of cattle. The comparative clone maps are an important resource for the identifi-

17
cation of genes affecting biologically or economically important traits. These maps also provide the framework for sequencing new genomes and the founda-tion for studying the evolution and organization of mammalian genomes.
The ultimate molecular map would be a reliably assembled genomic sequence. In July 2005 a preliminary assembly of bovine genomic sequence was launched for public use (http://www.ensembl.org/index.html). The sequencing combined BAC shotgun reads with whole-genome-shotgun (WGS) reads of small insert libraries and BAC end sequences (http://www.ensembl.org). Presently, the bo-vine genomic sequence (Btau_4.0) has 7x coverage but it still suffers from lar-ge gaps and inconsistencies. The sequence assembly could be greatly improved by integrating clone based physical maps, composite marker maps and compa-rative sequence information. Snelling et al. (2007) reported a detailed physi-cal map of the bovine genome which combines a novel bovine BAC fingerprint map, a human-bovine comparative map (Everts-van der Wind et al. 2004), com-parative BES alignments and a new composite marker map based on previous-ly reported linkage data (Ihara et al. 2004; Snelling et al. 2005; McKay et al. 2007) and RH maps (Everts-van der Wind et al. 2005; Itoh et al. 2005; Jann et al. 2006). The concordance between these maps is better than the alignment of the maps and the bovine genome assembly (Btau_3.1).
QTL linkage mapping1.1.5
The simplest way to test the existence of potential QTL is to identify single mar-kers that are segregating with the traits of interest. The offspring are sorted to marker genotype classes and the differences in mean trait values are statistically tested. The basic weakness of this method is that it does not provide informati-on about QTL position or effect because it is not possible to distinguish between closely linked QTL with small effect from more distantly located QTL with lar-ge effect (Haley and Andersson 1997). A solution to both detect QTL and esti-mate effect and location simultaneously is to apply information about marker intervals in an approach called interval mapping (Lander and Botstein 1989).
In interval mapping a genetic linkage map is used as the framework for testing the presence of QTL in fixed intervals between marker pairs whose position are known. The position that best explains the phenotypic difference between geno-typic classes pinpoints the most likely QTL position. Because it is not possible to say with certainty to which class an individual belongs at a particular posi-tion within the interval, the issue is solved by using probabilities that are condi-tional on flanking marker genotypes (Lynch and Walsh 1998). In outbred popu-lations only a proportion of individuals will be heterozygous for a given marker (or QTL) and the probability that an individual is heterozygous for both a mar-ker and QTL can be small. Thus the information content varies from interval to interval causing biased QTL location estimates because these tend towards

18
the most informative marker rather than the correct one (Haley et al. 1994). One solution to overcome this problem is to use information from multiple markers simultaneously (Georges et al. 1995; Knott et al. 1996). In principle, if one mar-ker of a marker pair is uninformative it can be replaced with another linked and informative marker. In dairy cattle the most commonly used QTL mapping met-hods are based on interval mapping with multiple marker information (Georges et al. 1995; Knott et al. 1996). In a half sib pedigree the conditional probability of an offspring inheriting the alternative alleles of a sire’s homologues is calcu-lated in every position along the chromosome at fixed intervals. These probabi-lities are then used usually in maximum likelihood (Georges et al. 1995) or li-near regression (Knott et al. 1996) methods to statistically test the presence of QTL under a null hypothesis of “no QTL”. QTL analysis in a half sib pedigree is nested within families because the linkage relationship between marker and QTL alleles can differ from one family to another (Haley and Andersson 1997). This means that the same marker allele can be linked to a QTL allele of positi-ve effect in one family and to a QTL allele of negative effect in another family. If the analysis is carried out across all sires instead of within families there is a risk that the segregation of QTL is masked by opposing linkage relationships between QTL and marker alleles in different families.
In order to control false positive claims a significance threshold needs to be set for the QTL signal. The significance level cannot be determined using standard statistical distributions because the tests in linkage analysis do not fit the as-sumption of independence (Liu 1998). In QTL analysis multiple tests are perfor-med, some of which are not independent because there is a linkage relationship between markers (or chromosomal segments) and interactions between loci. To overcome this problem Churchill and Doerge (1994) suggested a technique of permutation testing that can be used to create empirical distributions of the test statistics for the data under study under the null hypothesis of “no QTL”. The empirical distribution is obtained from a collection of simulated data sets that are created from the real data by randomly shuffling the phenotypes of the in-dividuals. In a half sib design this is done within families. QTL linkage ana-lyses are then performed with simulated data and the highest test statistics are stored and ranked. The resulting empirical distribution of the test statistics is then used to determine the chromosome-wise or experiment-wise significance level of the observed QTL signal.
When the marker density is low it is good to have an idea of how accurate the QTL location is. The statistical certainty of QTL position can be expressed as confidence intervals (CI). A bootstrap method can be applied to estimate the CI of QTL positions (Visscher et al. 1996). Here the real data from N indivi-duals are used to create new data sets of N individuals (bootstrap samples) by sampling so that some individuals can be randomly represented multiple times. The process is repeated N times to create N bootstrap samples. Then the inter-

19
val mapping is used to detect QTL from the bootstrap samples and estimates of the most likely QTL positions are ordered. The 95% CI is the chromosomal segment that comprises 95% of the observations around the empirical centre of the most likely positions of the bootstrapped samples.
QTL fine mapping1.1.6
In cattle the confidence intervals for QTL locations are usually tens of centi-morgans at best (Georges 2007). This resolution is not adequate for positional cloning and gene identification. The main factor limiting mapping resolution in linkage analysis is the frequency of recombination in the genotyped progeny. In experimental line crosses the mapping resolution can be improved by increa-sing the number of recombinations using larger families or advanced genera-tions (Darvasi and Soller 1995). Thousands of offspring are, however, required to reduce the QTL interval to such a level that positional cloning or gene iden-tification is possible (5 cM or less) (Darvasi 1998). The large number of pro-geny needed for fine mapping is not achievable with most outbred populations and therefore an alternative strategy is needed. One possibility is to use the re-combination events that have occurred in the history of the population (e.g. Hastbacka et al. 1992). This is done by exploiting the population level LD bet-ween QTL and closely linked markers. The principle is based on the assump-tion that QTL polymorphism is due to a single mutation in a specific ancestor. During following generations the LD between the mutant allele and the sur-rounding haplotype is gradually broken down by recombination and therefore in the current population the original haplotype remains only for the closest re-gion around the original mutation. These haplotypes are said to be identical by descent (IBD) and they are expected to have similar effects on the quantitative trait. The LD between marker haplotypes and QTL can therefore be measured by estimating the effect of the marker haplotypes on the quantitative trait (Meu-wissen and Goddard 2000).
An isolated population with small effective population size and/or recent foun-der event is expected to show longer tracks of LD compared to large, mixed populations (Mackay 2001a). Cattle populations usually originate from a limi-ted number of founder individuals followed by rapid expansion due to effective mating systems like AI. The effective population size in dairy cattle is small, usually less than one hundred (Taberlet et al. 2008), and it is further maintained by highly controlled or completely prevented migration between breeds. It has been estimated that in dairy cattle LD can be found over large distances, from a few centimorgans to several tens of centimorgans (Farnir et al. 2000; Khatkar et al. 2006a). The advantage of extensive LD in LD mapping is that the density of markers required for detecting QTL is lower than in populations where LD extends only short distances. In cattle the available microsatellite marker densi-ty has been suggested to be sufficient for LD mapping (Farnir et al. 2000). The

20
disadvantage of extensive LD is that it limits the mapping precision because it is not possible to narrow down the region beyond the extent of LD.
The methodology to detect QTL by exploiting LD has evolved gradually (e.g. III; Riquet et al. 1999; Meuwissen and Goddard 2000; Meuwissen and God-dard 2001; Farnir et al. 2002; Meuwissen et al. 2002; Meuwissen and Goddard 2004). The goal of these methods is either to detect QTL or to fine map a pre-viously detected QTL. In the latter case a simple solution is, for example, to es-timate the effect of the specific haplotypes identified from sires segregating for QTL on the quantitative trait in the general population in order to identify the minimum haplotype causing the effect (III). The method has some uncertainty because it is possible that in a population there is more than one common QTL haplotype because the mutation might have occurred more than once or addi-tional mutations have occurred later in the progeny of the common ancestor (Ron and Weller 2007). Moreover, it is not always possible to identify segrega-ting individuals with certainty. However, there can still be significant LD bet-ween QTL and closely located markers. It is possible to calculate the probabi-lity that two chromosomes are IBD at a given position based on marker haplo-types (Meuwissen and Goddard 2000; Meuwissen and Goddard 2001). In the-se methods the idea is to search for correlation between these IBD probabilities and trait variation. Because LD can be found over long distances (Farnir et al. 2000; Khatkar et al. 2006a) pure LD analysis can easily result in the detection of false positives (Meuwissen and Goddard 2004). By combining LD and lin-kage analysis spurious long distance associations can be avoided because the linkage analysis information will not confirm such associations (Meuwissen et al. 2002; Meuwissen and Goddard 2004). In dairy cattle combined linkage and LD analysis has been used successfully to improve the QTL mapping resoluti-on in a few instances (III; Farnir et al. 2002; Meuwissen et al. 2002; Olsen et al. 2005; Olsen et al. 2007; Sahana et al. 2008).
The first estimates of the extent of LD in cattle are most likely biased because the marker density was poor, the estimates were based on microsatellite data and only pair wise measures of LD were calculated (Khatkar et al. 2007). Re-cent studies in humans have suggested that the LD structure is complex and varies from one region of the genome to another, as well as between different populations (reviewed by Pritchard and Przeworski 2001). The LD between microsatellites is suggested to extend over longer distances compared to esti-mates of LD based on high-density SNP data (Pritchard and Przeworski 2001). High density genome-wide SNP panels are now available also for cattle. At the moment tens of thousands of SNPs can be genotyped on a single microarray. This will likely affect the way QTL mapping is performed in the near future so that a whole genome scan can be directly performed by combining linkage and LD analysis or replaced by direct genome-wide association mapping in popu-lations with no family structure (Georges 2007). To be able to design panels of

21
optimally spaced and informative markers for these novel approaches it is es-sential to understand the structure of LD, its extent in the population of interest and how much it varies from one chromosomal region to another. The first ef-forts to understand the LD structure in cattle have been made but these studies suffer from low SNP density and poor accuracy of SNP map positions (Khat-kar et al. 2006b; Khatkar et al. 2007). The development of methods that utili-ze the genome-wide LD information is an ongoing process and it remains to be seen whether these novel approaches will improve the prospects of unraveling the inheritance of complex traits.
Gene identification and confirmation1.1.7
In high-resolution mapping the QTL is usually mapped to intervals that contain several genes and numerous DNA sequence variants. One of the greatest chal-lenges is to determine which gene(s) and nucleotide variant(s) (quantitative trait nucleotide(s), QTN(s)) are causing the QTL effect (Mackay 2001a). In many ca-ses the QTL will map to a region where there are no obvious candidate genes or any of the genes could be considered as candidate genes fit to the candidate gene status. The possibility that the QTL effect may reflect the combined acti-on of multiple linked QTNs in a single or multiple genes complicates the matter even more. There is no simple solution to overcome this difficulty. Quantitative complementation might be the best way to identify the gene(s) underlying the QTL effect (e.g. Flint and Mott 2001; Mackay 2001a). In this approach a mu-tant (knockout) for each gene in the interval of interest is required. Systematic series of crosses are made in order to produce a series of heterozygous indivi-duals bearing either the decreaser or increaser QTL allele in one homolog and a wild type or one of the mutant alleles in the other homolog. The only assump-tions are that the QTL has two alleles and it lies within the region of interest. If the mutant gene has an effect on phenotype the difference between the QTL al-leles in combination with the mutant homolog is larger than with the wild type homolog. The test is rather simple, however, it is feasible only for organisms in which controlled crosses can be made and mutant stocks for all loci in the regi-on of interest are available. In fact, for other species there is no practical appro-ach to clearly pinpoint which genes are underlying the QTL effect.
It is essential to find the relevant gene, however, this doesn’t give informati-on about the molecular nature of the QTL and therefore the QTNs that are the actual cause of the observed effect in the trait phenotype need to be identified (Mackay 2001a). The difficulty is that each gene may include numerous DNA sequence variants, some of which are located in coding region and others in the flanking genomic regions (Glazier et al. 2002). Another complicating fac-tor is that the QTN does not have to be locate in close proximity to the gene it influences, it might be tens of kilobases away in an intragenic region (Freking et al. 2002; Smit et al. 2003) or even in another, functionally unrelated gene

22
(Higgs et al. 1990). There is no simple approach to assist the identification of functional candidates based on sequence information only because our know-ledge about sequence characteristics, especially in regulatory regions, is poor. It has been speculated that the variation underlying complex traits is more often regulatory than coding e.g. (Mackay 2001b). Therefore the optimal strategy to search for causal QTN(s) is to consider each nucleotide variant as well as their combination in one or several genes (Glazier et al. 2002). One way to search for causal QTNs (or genes) is to systematically test the association of detected sequence polymorphisms and the phenotype of interest, preferably in different populations (Flint and Mott 2001). This approach, however, suffers from the same problems as LD-mapping: it is difficult to distinguish a causal associati-on from association due to linkage (Flint and Mott 2001). In practice, becau-se with current technology the optimal strategy to search for causal genes and QTNs is most often beyond the resources of the experimenter, some prioritiza-tion is usually made. Currently, the chances to identify the causal gene(s) in li-vestock species rely on fine-mapping success, current knowledge about the ge-nes, and sometimes just pure luck.
The most conclusive evidence that a QTN has been identified is a demonstrati-on that the replacement of the variant nucleotide results in swapping one pheno-typic variant for another (Glazier et al. 2002). This again requires knock-out and gene targeting technologies and cannot be applied to most species. Mackay (2001a) noted that “in such cases where the formal proof of causality cannot be provided by standard approaches the only option is to collect multiple pieces of evidence, no single one of which is convincing, but which together consistent-ly point to a candidate gene”. Ron and Weller (2007) provided some guidelines for collecting statistical and functional evidence for QTN validation in livestock species. With the granddaughter design one way to validate the QTN is to de-termine the concordance between QTL genotypes of the sires and the putative QTN (e.g. Ron and Weller 2007). Complete concordance is obtained if all indi-viduals homozygous for the QTL are also homozygous for the QTN and all in-dividuals heterozygous for the QTL are also heterozygous for the QTN. In addi-tion, the same QTL allele should be associated with the same allele of the QTN for all heterozygous animals. Because complete concordance can be expected only if the QTL is due to a single QTN, the concordance is considered as sup-portive evidence of QTN detection only if it is statistically tested (Ron and Wel-ler 2007). Additional pieces of statistical evidence can be collected, for examp-le by testing whether the same QTN is segregating in different populations and whether the changes in the allelic frequencies of the QTN correspond to the se-lection goals over time (Ron and Weller 2007). Functional tests are usually ex-pected to provide convincing proof, however, it is usually difficult to say with certainty which physiological level, developmental or functional, the mutation affects and which are the critical tissues. In addition, because transgenic techno-logies are available only for model organisms, the functional role of a QTN can

23
be studied in most species only under in vitro conditions or by using model or-ganisms as ‘models’ for the species of interest. These observations cannot be directly related to the in vivo phenotype of the species of interest and therefo-re do not provide comprehensive proof. The prospects of providing functional proof at any level are case specific and dependent on how well the physiology of the trait and the nature of the gene of interest is understood.
QTL studies and practical applications in dairy 1.2 cattle
Gene mapping of domestic animals reflects the interest of breeding and thus the main focus of mapping has been in economically important quantitative traits. Monogenic traits have a less important role because simple genetic disorders have been effectively eliminated from the populations by selective breeding (Andersson 2001). A large number of QTL affecting various phenotypes have been identified in livestock animal species within the last decade. In a public, literature based Animal QTL database (http://www.animalgenome.org/QTLdb/; situation in July 2008) there were 1123 QTL representing 101 different traits in cattle, 1831 QTL representing 316 traits in pigs and 657 QTL representing 112 traits in poultry. By comparison, in the database of Online Mendelian Inheritan-ce in Animals (http://omia.angis.org.au/; Jul 2008) the total number of reported phenotypes in cattle was 373, from of which 72 have been located to genome and 40 have been characterized at the molecular level. Most of these are inhe-rited monogenic disorders.
In dairy cattle both partial and full genome scans have been conducted usual-ly by applying the granddaughter design (e.g. Georges et al. 1995; Vilkki et al. 1997; Zhang et al. 1998; Heyen et al. 1999; Schnabel et al. 2005). The daugh-ter design has been applied in order to map QTL by selective DNA pooling (Lipkin et al. 1998; Mosig et al. 2001) and in a few instances as part of a larger study (Heyen et al. 1999; Grisart et al. 2002). Mapping QTL in dairy cattle in existing populations is restricted to those traits that are recorded in the bree-ding schemes. The majority of reports are related to milk production because these traits are routinely recorded and therefore available in several countries. In some countries there has been a long tradition to pay special attention also to health and fertility in dairy cattle breeding. In several studies QTL affecting traits that indicate especially udder health (e.g. Klungland et al. 2001; Holm-berg and Andersson-Eklund 2004; Schulman et al. 2004) and female fertility (e.g. Kuhn et al. 2003; Holmberg and Andersson-Eklund 2006; Schulman et al. 2008) have been reported. In addition, conformation traits have gained some at-tention ( Schrooten et al. 2000; Buitenhuis et al. 2007). There have been seve-ral efforts to fine map QTL, many of which are related to milk production (e.g. Riquet et al. 1999; Farnir et al. 2002; Grisart et al. 2002; Grisart et al. 2004;

24
Olsen et al. 2004; Olsen et al. 2005; Schnabel et al. 2005; Olsen et al. 2007) and some to health and fertility traits (Meuwissen et al. 2002; Holmberg et al. 2007; Sahana et al. 2008).
The true challenge is the identification of genes and the mutations underlying QTL. Despite numerous QTL mapping reports in domestic animals in only four cases have the causal QTNs been identified with strong supportive evidence: the DGAT1 (Grisart et al. 2002; Winter et al. 2002; Grisart et al. 2004) and ABCG2 (Olsen et al. 2007) missense mutations that affect milk composition in dairy catt-le and the IGF2 (Jungerius et al. 2004) and GDF-8 (Clop et al. 2006) regulatory mutations that have been shown to influence muscle mass in pig and sheep, res-pectively. The situation is fairly similar in other species too, including man and mice, where the mapping success has not been much better (Glazier et al. 2002). Considering the current achievements QTN identification seems to be a challen-ging task. However, the ongoing increase of biological information and the rapid technological development of functional genomics might enable some of the li-mitations of QTN identification to be overcome in the future.
One of the main motivations of QTL mapping in domestic animals has been the expectation that molecular genetic information could accelerate the genetic prog-ress of phenotype-driven selection programs. Breeding strategies for livestock or plants that utilize molecular genetic information, genes or genomic regions, are broadly referred to as marker-assisted selection (MAS; reviewed by Dekkers and Hospital 2002; Dekkers 2004). It is obvious that the use of molecular genetic in-formation in selection programs would be most effective if the genetic architec-ture of quantitative traits of interest is completely understood but this is, howe-ver, far from reality. In order to respond to the diverse needs of the breeding in-dustry several strategies to integrate molecular data into selection programs have been developed for dairy cattle (reviewed by Dekkers 2004). These applications rely on the existence of trait associated markers. The most effective markers for MAS would be the causal mutations but these are the most difficult to detect and causality is difficult to prove. The markers that are in strong LD with the QTL at a population level and therefore located close to causal mutations are almost as good but the identification of such markers by fine mapping has proven to be laborious and expensive. The causal and LD markers are most suitable for MAS because these markers allow selection across populations and the associations remain from generation to generation (Dekkers 2004). Less effective marker ty-pes for MAS would be the easiest markers to detect – the markers that are lin-ked to the causal mutation within families. Because linkage phases differ from family to family these markers are applicable only within families. In addition, the loose LD between marker and causal mutation erodes gradually due to re-combination. Different marker types have different potential in MAS. However, in all cases the major issue is that only a minor fraction of the loci affecting trait variance can be detected with the current gene mapping approaches.

25
A new form of marker assisted selection, called genomic selection (Meuwissen et al. 2001), bypasses the need QTL detection and QTN identification. The ap-proach is based on the assumption that potentially all genetic variance can be explained when high-density markers covering the whole genome are used be-cause with sufficient marker density all QTL are expected to be in LD with at least one of the markers. In the near future the most likely strategy to imple-ment genomic information in genetic evaluation schemes is to combine it with phenotypic and pedigree information. In the long term, however, there is an optimistic belief that the estimation of breeding values will be based entirely on molecular information (Goddard and Hayes 2007). Although the suggested genomic selection approach fulfills the enthusiastic expectations, and the QTN does not need to be identified for selection purposes, there is still a need to un-derstand the genetic architecture of quantitative trait variation. Without ques-tion there is always an interest to improve the basic understanding of biology but in addition better understanding of the physiology of quantitative traits will be beneficial for practical applications. When large numbers of individuals are genotyped with high-density SNP panels for selection purposes excellent map-ping data for population level LD mapping is created in the process. The futu-re will show how this information will improve our understanding of complex trait genetics.

26
Objective2 The objectives of this work were 1) to map QTL for economically important milk production traits in Finnish Ayrshire dairy cattle by utilizing an existing half-sib pedigree (I), 2) to unravel the molecular nature of one selected milk production QTL identified on bovine chromosome 20 (II, III. IV), and 3) to develop a fast and reliable method for trait associated gene diagnosis from bo-vine embryos in order to respond to the needs of commercial embryo produc-tion (V).
Materials and methods3
Animal material and family structure3.1
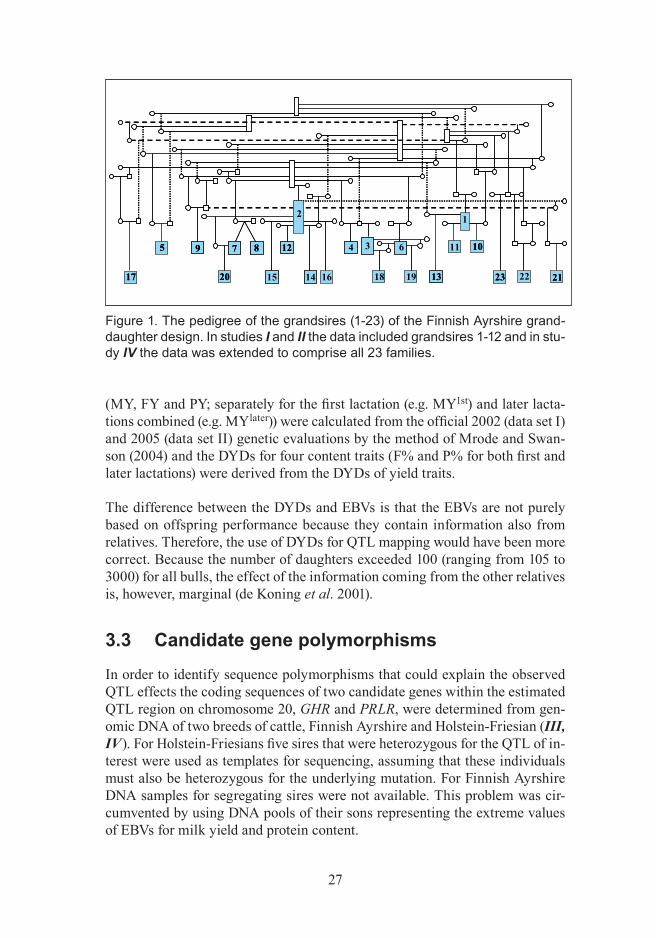
In order to map QTL for milk production traits twelve Finnish Ayrshire half-sib families were analyzed in a granddaughter design (Weller et al. 1990) (I). The total number of progeny tested AI bulls were 493, ranging from 21 to 82 per sire. The families used for QTL linkage mapping are relatively old, from a popula-tion of grand-sires from the early 1970s to 1980s. The population has been ex-tended and updated for fine-mapping purposes and also to represent better the breeding population of today (IV). The pedigree of the Finnish Ayrshire grand-daughter design is presented in Figure 1.
In the analysis of chromosome 20 two independent “data sets” were used, the first being the extension of the original sample used in the first QTL search and the second being an independent sample from the Finnish Ayrshire population (IV). The first sample (data set I) was used for both QTL linkage mapping and association analysis. Data set I includes 23 half-sib families containing a total of 810 progeny tested AI bulls. The second sample (data set II) was collected to confirm the observed effects of candidate gene polymorphisms on milk produc-tion traits in the independent Finnish Ayrshire population. This sample compri-ses 718 progeny-tested AI bulls, not belonging to the half-sib families of data set I, born between 1971 and 2001.
Phenotypes3.2
Estimated breeding values (EBV) were used as phenotypes for the whole geno-me scan (I) and daughter yield deviations (DYD) for chromosome 20 QTL fine mapping and association analyses of candidate gene polymorphisms (IV). The EBVs for milk yield (MY), fat yield (FY), protein yield (PY), fat content (F%) and protein content (P%) were obtained from the 1998 national genetic evalu-ation (Finnish Animal Breeding Association). The DYDs for six yield traits
27
(MY, FY and PY; separately for the first lactation (e.g. MY1st) and later lacta-tions combined (e.g. MYlater)) were calculated from the official 2002 (data set I) and 2005 (data set II) genetic evaluations by the method of Mrode and Swan-son (2004) and the DYDs for four content traits (F% and P% for both first and later lactations) were derived from the DYDs of yield traits.
The difference between the DYDs and EBVs is that the EBVs are not purely based on offspring performance because they contain information also from relatives. Therefore, the use of DYDs for QTL mapping would have been more correct. Because the number of daughters exceeded 100 (ranging from 105 to 3000) for all bulls, the effect of the information coming from the other relatives is, however, marginal (de Koning et al. 2001).
Candidate gene polymorphisms3.3
In order to identify sequence polymorphisms that could explain the observed QTL effects the coding sequences of two candidate genes within the estimated QTL region on chromosome 20, GHR and PRLR, were determined from gen-omic DNA of two breeds of cattle, Finnish Ayrshire and Holstein-Friesian (III, IV). For Holstein-Friesians five sires that were heterozygous for the QTL of in-terest were used as templates for sequencing, assuming that these individuals must also be heterozygous for the underlying mutation. For Finnish Ayrshire DNA samples for segregating sires were not available. This problem was cir-cumvented by using DNA pools of their sons representing the extreme values of EBVs for milk yield and protein content.
2
1212
15 14 16
55 88
2020
99
1717 2123 22 212318 19 1313
77
2
34 6
1
11 1010
Figure 1. The pedigree of the grandsires (1-23) of the Finnish Ayrshire grand-daughter design. In studies I and II the data included grandsires 1-12 and in stu-dy IV the data was extended to comprise all 23 families.

28
To be able to sequence the entire coding sequences information from the intro-nic sequences flanking exons was needed. The bovine genomic sequence was not available at that time and therefore the sequences were obtained from gen-omic clones of bovine bacterial artificial chromosomes (BAC) including the corresponding candidate genes. The bovine genomic BAC library (Warren et al. 2000) was screened with probes for GHR and PRLR. The positive clones were identified and cultured and the DNA extracted. All sequencing was per-formed with standard protocols. The primers were designed based on the pre-diction of exon/intron boundaries by comparison to mammalian species (hu-man, mouse).
Marker genotyping and linkage maps3.4
The genomic DNA was extracted from sperm with standard protocols (I, II, IV). A total of 150 markers were selected and genotyped for whole genome QTL map-ping (I). To ensure that the selected markers were sufficiently polymorphic for linkage mapping, the number and frequency of the marker alleles were estima-ted from a pooled sample of 50 randomly selected cows representing the Finnish Ayrshire population. Three of the markers were candidate gene polymorphisms for milk production: a casein gene haplotype (Velmala et al. 1995), a growth hormone receptor (GHR) 3’ untranslated region (UTR) polymorphism (II) and a prolactin receptor (PRLR) single nucleotide polymorphism (SNP). The rest of the markers were published bovine microsatellites (Barendse et al. 1994; Bishop et al. 1994; Barendse et al. 1997; Ma et al. 1996; Kappes et al. 1997).
GHR was mapped to bovine chromosome 20 by synteny mapping and linka-ge analysis (II). The sequence polymorphism in the 3’ UTR of the bovine GHR gene was identified and used for linkage map construction together with five microsatellite markers (Ma et al. 1996; Kappes et al. 1997). The linkage analy-sis was performed using ANIMAP (Georges et al. 1995). In order to confirm the chromosomal location, GHR was physically assigned to bovine chromosomes using a bovine-rodent hybrid cell panel (Womack and Moll 1986).
For genotyping markers with length variants, fragment analysis based on ampli-fication and electrophoresis was performed (I, II, IV). For size determination the amplified fragments were separated on a denaturing gel or gel matrix with au-tomated gel or capillary electrophoresis and analyzed with the appropriate soft-ware. The same methodology was used for all DNA sequencing (II, III, IV). Coding sequence variations of candidate genes were genotyped using two met-hods, primer extension and allele discrimination (IV). The former is also a frag-ment analysis application that combines minisequencing and fragment analysis, the latter combines amplification and probe hybridization with real-time PCR. Real-time PCR was also applied for multiplex genotyping of in vitro and in vivo produced bovine embryos (V). The genotypes of the trait associated candidate

29
gene polymorphisms were determined from embryo biopsies in a two step pro-tocol that combined nested PCR and allele discrimination.
For QTL mapping a 2764 cM male genetic linkage map was constructed with ANIMAP (Georges et al. 1995; I). Altogether, the selected markers covered all 29 autosomes of the bovine genome at ~20 cM intervals. The polymorphism in-formation content (PIC) for each marker and the average information content (IC) of linkage maps were calculated. In order to improve QTL mapping resolu-tion of chromosome 20 and to identify new segregating families a new genetic linkage map comprising a new set of markers was constructed from the exten-ded family data with CRI-MAP 2.4 (Green et al. 1990; IV).
Statistical methods3.5
QTL linkage analysis based on interval mapping with multiple marker infor-mation was performed to estimate the QTL positions and effects for indivi-dual chromosomes by applying the multiple marker regression method (Kno-tt et al. 1996; I, IV). The regression model for every chromosome was: Yij = ai + biXij + eij, where Yij is the trait score of individual j, offspring of parent i, ai is the polygenic effect for half-sib family i, bi is the regression coefficient wit-hin family i (i.e., allele substitution effect for a putative QTL), Xij is the condi-tional probability for individual j of inheriting the first haplotype from parent i, and eij is the residual effect. The regression analysis was nested within fami-lies and the breeding values were weighted by their reliabilities (that is, number of daughters). The analysis provides F-ratios along the linkage group with the maximum value being the most likely position of the QTL. To test for the pre-sence of two QTL the linkage analysis was performed with a two-QTL model (Spelman et al. 1996).
Permutation tests were performed to obtain empirical significance thresholds and P-values for each linkage group separately (Churchill and Doerge 1994; I, IV). The chromosome-wise risk levels were adjusted by Bonferroni correction for multiple tests of the whole genome to obtain genome-wise significance le-vels. The genome-wise P-values (Pgenome) were obtained as follows: Pgenome = 1 – (1 – Pchr)
c, where the c is the number of bovine chromosomes.
In order to take into account the effects of possible unlinked QTL an iterative QTL approach (de Koning et al. 2001) was performed (I). In this analysis the empirical thresholds were estimated also by permutation.
To test for the presence of two QTL on chromosome 20 and to identify new segregating families QTL mapping was performed with the extended popula-tion and a new set of markers similarly as in the initial QTL analysis (IV). The confidence intervals for QTL position were calculated using QTLexpress (Sea-

30
ton et al. 2002). QTLexpress was also used to test the effects of individual GHR and PRLR SNPs by fitting them as fixed effects in the linkage model.
The association of the GHR and PRLR polymorphisms with the milk production traits in Finnish Ayrshire data was analyzed by applying the following statisti-cal model (IV): y = Xβ + Zα + e, where y is a vector of DYDs for one of the ten milk production traits considered, standardized to have variance equal to 1 and zero mean; β is a vector of fixed effects comprising the general mean and the SNP genotypes effects of GHR snp1 (F279Y), snp2 (N528T), snp3 (A541S) and snp4 (S555G) and PRLR snp5 (S18N) and snp6 (L186P); α is a vector of random polygenic effects assuming α ~ N (0,Aσ2α) where A is the additive relationships among individuals and σ2α is the total additive genetic variance; e is a vector of random errors assuming e ~ N (0,Dσ2e), D being a diagonal matrix with re-ciprocal of the effective number of daughters used for the calculation of DYD of the ith bull and σ2e denoting the error variance; and X, Z are corresponding design matrices. The pedigree included the relationships of sons, sires, dams and maternal grandsires. The parameters underlying the above model were es-timated via a maximum-likelihood method (i.e. β, α, e). Due to the small samp-le size the variance components were not estimated from the data, the variance components were assumed as known (σ2α = 0.30, σ2e = 0.70).
To test various hypotheses corresponding to SNP genotype effects on milk pro-duction traits a likelihood-ratio test (LRT) was performed. The full model in-cluding all the SNP genotypes and the interaction term were compared against various submodels comprising different combinations of SNPs. The model se-lection procedure is presented in Figure 1 in article IV. In addition to the like-lihood-ratio test, a nonparametric approach (BIC) was also applied for model comparison.
The observed association of GHR snp1 (F279Y) and PRLR snp5 (S18N) geno-types with milk production traits in half-sib families was confirmed in the in-dependent sample of Finnish Ayrshire. The analysis was performed similarly as for the family data except that only snp1, snp5 and their interaction was te-sted.
The materials and methods used in this work are discussed in more detail in the corresponding articles.

31
Results4
Identification of QTL affecting milk yield and 4.1 composition
A QTL linkage analysis was conducted to map quantitative trait loci (QTL) af-fecting milk production traits in Finnish Ayrshire dairy cattle (I). Twelve half-sib families containing a total of 494 bulls were analyzed in a granddaughter design (Weller et al. 1990). Interval mapping using the multiple marker regres-sion approach (Knott et al. 1996) was performed to analyze each of the 29 bo-vine autosomal chromosomes separately. In order to increase the power and the precision of QTL detection the approach was extended to analyze multiple chromosomes simultaneously (de Koning et al. 2001). The results are summa-rized here. A more detailed description and discussion of the results is given in the corresponding article (I).
Construction of a genetic linkage map of the 4.1.1 bovine genome
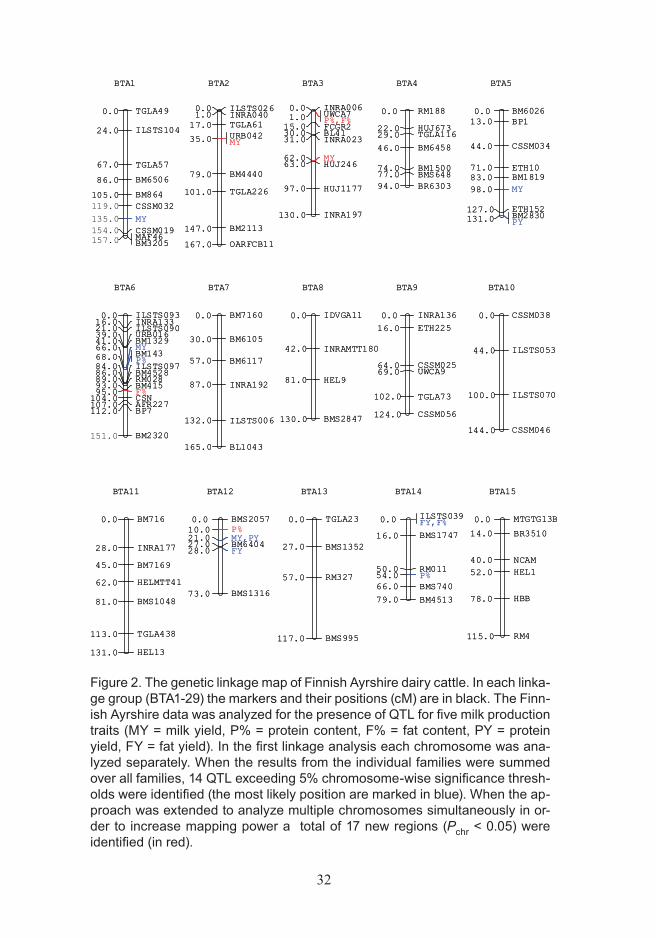
The constructed 2764 cM male genetic linkage map of Finnish Ayrshire compri-ses 29 autosomal linkage groups and includes 150 DNA markers with an ave-rage spacing of ~18 cM (I). The X-chromosome was not analyzed because the male pedigree does not provide linkage information for the X chromosome. The mean heterozygosity of all markers within the 12 families used for map construction was 68% and the average PIC of all markers was 0.65. A heterozy-gosity value of greater than 60% and a PIC value exceeding 0.60 are conside-red to indicate that the marker is potentially useful for linkage mapping (Curran 1997). The average IC along the chromosomes varied from 0.37 (chromosome 10) to 0.68 (chromosome 23), the average at the genome level being 0.53. In in-terval mapping of inbred line crosses where markers are completely informati-ve a marker interval of 20 cM is considered to be adequate for QTL detection (Lander and Botstein 1989). In fact, a marker density higher than one marker per 20 cM increases only a little the power to detect QTL and the major limi-tation to accurately locate QTL is actually the number of meioses and thus the size of the mapping population. In an outbred population the markers are not completely informative and therefore the decision of adequate marker spacing depends on the IC of the markers in the population under study. With microsa-tellite markers of IC = 0.5 the marker density requirement is twice the density of completely informative markers and therefore a marker spacing of 10 cM is suggested to be adequate in such situations (Haley and Andersson 1997). The genetic linkage map of Finnish Ayrshire is presented in Figure 2 (see also Tab-le 1 of article I). Comparison of the marker order of the 29 autosomal linka-
32
TGLA490.0
ILSTS10424.0
TGLA5767.0
BM650686.0
BM864105.0CSSM032119.0MY135.0CSSM019154.0MAF46BM3205157.0
BTA1
ILSTS0260.0INRA0401.0TGLA6117.0URB042MY35.0
BM444079.0
TGLA226101.0
BM2113147.0
OARFCB11167.0
BTA2
INRA0060.0UWCA7P%,F%1.0FCGR215.0BL4130.0INRA02331.0
MY62.0HUJ24663.0
HUJ117797.0
INRA197130.0
BTA3
RM1880.0
HUJ67322.0TGLA11629.0BM645846.0
BM150074.0BMS64877.0BR630394.0
BTA4
BM60260.0BP113.0
CSSM03444.0
ETH1071.0BM181983.0MY98.0
ETH152127.0BM2830PY131.0
BTA5
ILSTS0930.0INRA13316.0ILSTS09021.0URB01639.0BM132941.0MY66.0BM143P%68.0ILSTS09784.0BM452886.0RM02889.0BM41593.0F%95.0CSN104.0AFR227107.0BP7112.0
BM2320151.0
BTA6
BM71600.0
BM610530.0
BM611757.0
INRA19287.0
ILSTS006132.0
BL1043165.0
BTA7
IDVGA110.0
INRAMTT18042.0
HEL981.0
BMS2847130.0
BTA8
INRA1360.0ETH22516.0
CSSM02564.0UWCA969.0
TGLA73102.0
CSSM056124.0
BTA9
CSSM0380.0
ILSTS05344.0
ILSTS070100.0
CSSM046144.0
BTA10
BM7160.0
INRA17728.0
BM716945.0
HELMTT4162.0
BMS104881.0
TGLA438113.0
HEL13131.0
BTA11
BMS20570.0P%10.0MY,PY21.0BM640427.0FY28.0
BMS131673.0
BTA12
TGLA230.0
BMS135227.0
RM32757.0
BMS995117.0
BTA13
ILSTS039FY,F%0.0
BMS174716.0
RM01150.0P%54.0BMS74066.0
BM451379.0
BTA14
MTGTG13B0.0
BR351014.0
NCAM40.0HEL152.0
HBB78.0
RM4115.0
BTA15
TGLA490.0
ILSTS10424.0
TGLA5767.0
BM650686.0
BM864105.0CSSM032MYCSSM019MAF46BM3205
BTA1
ILSTS0260.0INRA0401.0TGLA6117.0URB042MY35.0
BM444079.0
TGLA226101.0
BM2113147.0
OARFCB11167.0
BTA2
INRA0060.0UWCA7P%,F%1.0FCGR215.0BL4130.0INRA02331.0
MY62.0HUJ24663.0
HUJ117797.0
INRA197130.0
BTA3
RM1880.0
HUJ67322.0TGLA11629.0BM645846.0
BM150074.0BMS64877.0BR630394.0
BTA4
BM60260.0BP113.0
CSSM03444.0
ETH1071.0BM181983.0MY98.0
ETH152127.0BM2830PY131.0
BTA5
ILSTS0930.0INRA13316.0ILSTS09021.0URB01639.0BM132941.0MY66.0BM143P%68.0ILSTS09784.0BM452886.0RM02889.0BM41593.0F%95.0CSN104.0AFR227107.0BP7112.0
BM2320
BTA6
BM71600.0
BM610530.0
BM611757.0
INRA19287.0
ILSTS006132.0
BL1043165.0
BTA7
IDVGA110.0
INRAMTT18042.0
HEL981.0
BMS2847130.0
BTA8
INRA1360.0ETH22516.0
CSSM02564.0UWCA969.0
TGLA73102.0
CSSM056124.0
BTA9
CSSM0380.0
ILSTS05344.0
ILSTS070100.0
CSSM046144.0
BTA10
BM7160.0
INRA17728.0
BM716945.0
HELMTT4162.0
BMS104881.0
TGLA438113.0
HEL13131.0
BTA11
BMS20570.0P%10.0MY,PY21.0BM640427.0FY28.0
BMS131673.0
BTA12
TGLA230.0
BMS135227.0
RM32757.0
BMS995117.0
BTA13
ILSTS039FY,F%0.0
BMS174716.0
RM01150.0P%54.0BMS74066.0
BM451379.0
BTA14
MTGTG13B0.0
BR351014.0
NCAM40.0HEL152.0
HBB78.0
RM4115.0
BTA15
Figure 2. The genetic linkage map of Finnish Ayrshire dairy cattle. In each linka-ge group (BTA1-29) the markers and their positions (cM) are in black. The Finn-ish Ayrshire data was analyzed for the presence of QTL for five milk production traits (MY = milk yield, P% = protein content, F% = fat content, PY = protein yield, FY = fat yield). In the first linkage analysis each chromosome was ana-lyzed separately. When the results from the individual families were summed over all families, 14 QTL exceeding 5% chromosome-wise significance thresh-olds were identified (the most likely position are marked in blue). When the ap-proach was extended to analyze multiple chromosomes simultaneously in or-der to increase mapping power a total of 17 new regions (Pchr < 0.05) were identified (in red).

33
ge groups with the latest, high-density bovine linkage map (Ihara et al. 2004) reveals that the genomic coverage of the Finnish ayrshire map is quite good and the order of the markers is similar. The location of only three marker pairs were in disagreement with the high-density map, two pairs in chromosome 1 (BM864 - CSSM032 and MAF46 – BM3205) and one in chromosome 6 (BM4528 – ILSTS097). Some of the Finnish ayrshire maps have been recalculated later in order to add new markers and the marker order of chromosome 1 has been cor-rected (Schulman et al. 2008).
BM13110.0
IDVGA4934.0
BM170662.0
BTA16
BMS9410.0
BM812539.0
BM123362.0
BTA17
BMS13550.0
BMS221326.0
BMS263976.0
TGLA227110.0
BTA18
HEL100.0
URB04423.0BP2033.0
CSSM06556.0MAP2C65.0F%67.0IOBT3468.0
ETH390.0
BTA19
BM35170.0
TGLA30419.0
BM71346.0GHR57.0PRLR64.0ILSTS07265.0P%68.0
MY89.0BM500497.0
BTA20
RM1510.0
MY24.0
INRA10340.0
TGLA12268.0
BTA21
CSSM0260.0
BM152045.0
OARFCB30470.0
BTA22
CSSM0050.0MY4.0RM03311.0
BM1258P%21.0
BOLA-DRB131.0RM18538.0
CSSM02453.0
BTA23
BMS22700.0
BMS46640.0
BTA24
BMC4216P%0.0
BMS13013.0
PY44.0
BMS135359.0
AF5MY70.0
BTA25
HEL110.0
BMS2567F%15.0
BTA26
BMS6410.0
INRA134MY,PY29.0
BTA27
BMS5100.0
BMS171418.0
BTA28
JAB50.0ILSTS0574.0
BMC801224.0PY28.0MY34.0
BMC120677.0
BTA29
Figure 2. Continues.

34
QTL for milk production traits4.1.2
The Finnish Ayrshire data was analyzed for the presence of QTL for five milk production traits (I). In the first linkage analysis each chromosome was analy-zed separately. When the results for the individual families were summed over all families, two QTL exceeding 5% genome-wise significance thresholds and 14 QTL exceeding 5% chromosome-wise significance thresholds were identi-fied (Figure 2, see also Table 2 in article I). QTL affecting milk yield (MY) were identified in bovine (Bos taurus) chromosomes (BTA) 1, 5, 6, 12 and 20, fat yield (FY) in BTA 12 and 14, and protein yield (PY) in BTA 5, 12 and 25. QTL affecting fat content (F%) and protein content (P%) were found on BTA 14 and on BTA6, 14 and 23, respectively.
This approach was extended to analyze multiple chromosomes simultaneous-ly in order to increase mapping power. The 14 QTL identified in the initial lin-kage analysis at the 5% chromosome-wise threshold level were included as co-factors in further analysis. When cofactors were used the number of identified QTL increased from 2 genome-wise significant (Pgenome < 0.05) and 12 sugges-tive (Pchr < 0.05) to 31 genome-wise significant (Pgenome < 0.05) QTL (Figure 2, see also Table 3 in article I). A total of 17 new regions were identified; seven for MY, four for F% and P% and two for PY.
In Finnish Ayrshire the most striking observations were made for BTA12 and BTA14. In the linkage analysis of individual chromosomes a genome-wise sig-nificant QTL (Pgenome < 0.0029) for F% and a chromosome-wise significant QTL (Pchr < 0.05) for FY were detected at the centromeric end of BTA14. The effect on F% was observed in three families and on FY in one family. The si-zes of the effect for F% in individual families were 0.29 %-units, 0.36 %-units and 0.65 %-units, varying from 1 to almost 2.5 phenotypic standard deviations of EBV. The effect for FY was 21 kg, which is more than one standard deviati-on of EBV. An effect for P% was also observed but the chromosomal position was different.
A genome-wide significant QTL for FY (Pgenome < 0.0029) was detected bet-ween BM2507 and BM6404 on BTA12. A single BM6404 allele out of nine seems to be associated with higher FY in two families, the allele substitution effect being 0.72 and 0.94 standard deviations of EBV, about 11.7 kg and 15.2 kg, respectively. In one of the two families the same BM6404 allele was also associated with higher MY and PY. After the cofactor analysis the parallel ef-fects on MY and PY were also seen in the other family. The QTL on BTA12 is the only QTL detected in Finnish Ayrshire that influences all yield traits (MY, PY and FY).

35
Molecular dissection of the milk production 4.2 QTL on BTA20
One of the highest test statistics observed in the initial genome scan was de-tected on BTA20. In the analysis of individual chromosomes QTL affecting milk yield was detected between ILSTS072 and BM5004 (Pchr < 0.0019). When the cofactors were used the status of this QTL was changed from chromosome-wise significant to genome-wise significant (Pgenome < 0.0029) and a QTL effect for P% was also identified in the same marker interval. The QTL on BTA20 was selected for fine mapping because similar observations have been made for a number of different populations, giving confidence that this QTL is genuine e.g. (Georges et al. 1995; Arranz et al. 1998; Zhang et al. 1998; Olsen et al. 2002). Secondly, two interesting candidate genes map to the QTL region, the genes encoding receptor molecules for growth hormone (GHR) and prolactin (PRLR). Both GHR and PRLR have major roles in the regulation of diverse actions of growth hormone (GH) and prolactin (PRL) in the mammary gland and were therefore potential candidate genes that could be responsible for QTL effects observed on BTA20. To unravel the molecular nature of the QTL on BTA20 the QTL mapping resolution was improved and the potential role of GHR and PRLR in milk production was studied.
Chromosomal assignment of candidate genes4.2.1
In the early stage of this work the chromosomal location of GHR was confirmed by synteny mapping (II). The highest concordance (98.3%) was detected bet-ween GHR and 5-hydoxy-tryptamine receptor 1 A on BTA20. The assignment was further supported by constructing a genetic linkage map with a sequence polymorphism identified from the 3´ UTR of bovine GHR and five microsatel-lite markers. Bovine GHR was linked to microsatellite marker ILSTS072 with a maximum lod score of 2.45 at θ = 0.08. The most likely order was BM3517-BM713-GHR-ILSTS072-BM4107 suggesting that GHR is located in the middle of the linkage group. The chromosomal location of GHR was further supported by Kollers et al. (2000) who physically assigned GHR and also PRLR to the BTA20 QTL interval by fluorescence in situ hybridization (FISH), giving the candidate gene status of both genes support at a more physical level.
DNA sequence polymorphism in the candidate 4.2.2 genes
The coding sequence of GHR and PRLR and the sequence of three well-charac-terized GHR promoters were screened in order to find DNA variation that could explain the observed QTL effects on bovine chromosome 20 (III, IV). The as-

36
sumption was that either GHR or PRLR or both would account for at least part of the QTL effects on BTA20 and the sires segregating for this QTL would be he-terozygous for the causal mutation(s). The coding sequences of GHR and PRLR were screened in two populations, Dutch Holstein-Friesian (III) and Finnish Ayrshire (IV). In Holstein-Friesians the sequences were obtained from five si-res assumed to be segregating for the QTL but in Finnish Ayrshire samples of the two sires originally segregating for the QTL were not available and the se-quences were obtained from pooled samples of their sons.
In GHR two amino acid substitutions, a phenylalanine-tyrosine (F279Y) sub-stitution in the transmembrane domain (TMD) and an asparagine-threonine substitution (N528T) in the intracellular domain (ICD), were detected in both breeds (Figure 3). In Finnish Ayrshire two additional substitutions were obser-ved, an alanine-serine (A541S) and a serine-glysine substitution (S555G) in the ICD. In PRLR two missense mutations were observed in both breeds, resulting in a S18N substitution in the signal peptide of the protein, and L186P in the ex-tracellular, ligand binding domain (ECD) (Figure 3). The allele frequencies of GHR and PRLR SNPs in data set I are presented in Figure 3.
Several alternative promoters have been reported for bovine GHR, three of which have been well characterized (Hauser et al. 1990; Heap et al. 1996; Lucy et al. 1998; Jiang et al. 1999). The three promoters were sequenced in Finnish Ayrshire without finding any sequence polymorphism (IV).
IA II III IV V VI VII VIII IX X
F279Y N528T A541S S555G
GHR
I II III IV V VI VII VIII IX X
S18N L186P
PRLR
0.89/0.11 0.63/0.37 0.90/0.10 0.87/0.13
0.86/0.14 0.45/0.55
IB IC IA II III IV V VI VII VIII IX X
F279Y N528T A541S S555G
GHR
I II III IV V VI VII VIII IX X
S18N L186P
PRLR
0.89/0.11 0.63/0.37 0.90/0.10 0.87/0.13
0.86/0.14 0.45/0.55
IB IC
Figure 3. Schematic representation of the bovine GHR and PRLR genes and the observed SNPs and allele frequencies in data set I. The sequenced coding sequences are shown in violet, sequenced 3’ and 5’ UTRs are shown in dark grey and unsequenced UTRs in light grey.

37
Multiple sequence alignment was performed with ClustalW (http://www.ebi.ac.uk) in order to estimate the importance of the observed mutations. The com-parison of the TMD of GHR revealed that the phenylalanine residue at the po-sition of F279Y is highly conserved among mammals except cows (see Figure 2 in article IV). The observed three substitutions in the GHR ICD were not lo-cated in highly conserved positions but the comparison revealed that the threo-nine (T) residue at N528T, the serine (S) at A541S and the glysine (G) at S555G are all bovine specific. Comparison of the PRLR ECD suggests that at the po-sition of L186P glycine is highly conserved except in artiodactyls. At the po-sition of S18N both serine and asparagine residues were quite common among the studied species.
QTL for milk production traits – a confirmation 4.2.3
Conventional multimarker regression analysis was performed in order to refine the map position of the QTL, to identify more segregating families and to test for the existence of multiple QTL in the same linkage group (IV). The sample is an extension of the original QTL mapping data (I) with respect to the num-ber of animals and marker density.
A new genetic linkage map of bovine chromosome 20 was constructed with se-ven microsatellite markers, PRLR (S18N) and a GHR haplotype (N528T, A541S and S555G) (Figure 4). The across-family analysis confirmed the presence of QTL on BTA20 as expected (Figure 4, see also Table 6 in IV). The strongest effect was seen on P%later (Pchr < 0.00005), with the most likely position at 43 cM. The effect on P%1st was of nearly the same magnitude (Pchr < 0.0009). The QTL also affects F%1st and F% later and MY later (Pchr < 0.01) and to a lesser ex-tent yield traits (Pchr < 0.05). The within-family analysis revealed that in the ex-tended sample four families out of 23 were segregating for the QTL: family 5 (MY, PY), family 12 (MY, F%, P%), family 14 (MY, P%, F%, PY) and family 21 (F%, P%; see Table 7 in IV). The results were very similar for first and la-ter lactations.
The possible presence of multiple QTL on BTA20 was tested by fitting a two QTL model to QTL analysis (Spelman et al. 1996). The two-QTL model sup-ports the existence of two QTL for P% (1 QTL vs. no QTL, Pchr < 0.00005; 2 QTL vs. no QTL, Pchr < 0.00001; 2 QTL vs. 1 QTL, Pchr < 0.01) at map positions 35 cM and 45 cM. Some caution should be taken, however, in the interpretation of the results because the F-test for two QTL vs. one QTL is only an approxi-mate test and therefore the evidence for two QTL may be too optimistic.

38
Effect of candidate gene polymorphisms on 4.2.4 milk yield and composition
To estimate the effects of the identified GHR and PRLR polymorphisms on milk yield and composition an association analysis was performed on two in-dependent data sets (IV). The results suggest that GHR F279Y (snp1) and PRLR S18N (snp5) have the largest impact on milk production traits in Finnish Ayr-shire while the effects of the remaining SNPs are close to zero. It seems that the effects are separate, F279Y has the highest impact on content traits while S18N affects yield.
The effect of snp1 (F279Y) was clearly detected in protein and fat content. The size of the effects of genotypes FF and FY compared to the YY genotype ex-pressed as standard deviations of DYDs were 2.04 and 1.35 for P%1st and 1.79 and 1.08 for P%later, respectively. For fat content the size of the corresponding effects were 1.16 and 0.58 for F%1st and 1.25 and 0.61 for F%later. The other traits were not affected by the F279Y mutation. Snp5 (S18N) was associated with all the yield traits. The size of the effects of genotypes NN and NS compared to the SS genotype were 1.41 and 1.17 for PY1st and 1.83 and 2.02 for PY later, res-
Start0BM35172
TGLA30413
BM71329GHR34
PRLR41
AFR221570
End76
Mb
BM35170
TGLA30414
BM71335GHR39TGLA15340DIK1543PRLR44AGLA2945
AFR221569
P%MY
F%PY
FY
0 1 2 3 4
cM
P%MYF%PYFY
F-ratio
Start0BM35172
TGLA30413
BM71329GHR34
PRLR41
AFR221570
End76
Mb
BM35170
TGLA30414
BM71335GHR39TGLA15340DIK1543PRLR44AGLA2945
AFR221569
P%MY
F%PY
FY
0 1 2 3 4
cM
P%MYF%PYFY
F-ratio
Figure 4. Genetic linkage map of bovine chromosome 20 (cM), the genomic po-sitions of corresponding markers (Mb) and the test statistics (F-ratio) of the re-sults of the across family analysis for five milk production traits (MY, PY, FY, P% and F%, later lactations). The 5% chromosome-wise significance threshold is shown for P% and F% (dashed line) and for MY, PY and FY (dotted line).

39
pectively. For fat yield the corresponding effects were 0.93 and 1.46 for FY1st and 0.72 and 2.11 for FYlater and for milk yield 0.91 and 1.22 for MY1st and 1.39 and 1.84 for MYlater respectively. The point estimates of SNP genotype effects are presented in Figures 3 and 4 in article IV.
The effects of individual SNPs were also tested by fitting them as fixed effects one at a time in the linkage model. Inclusion of GHR F279Y as a fixed effect causes a clear decrease in the test statistic in both content traits suggesting that F279Y explains most of the QTL variance observed in milk content (Figure 5). The PRLR S18N causes a modest decrease in test statistics in milk and protein yield suggesting that S18N explains only part of the QTL variance observed in yield. The other SNPs had no effect on QTL variance for any of the traits.
In order to show which SNPs best explain the nonpolygenic part of the trait va-riation a model comparison was performed. Two methods, a likelihood-ratio test (LRT) and a nonparametric approach (BIC), were applied. Several different mo-dels were tested against the full model including all SNPs and the interaction between genes was also included. These results were confusing. First of all, for most traits several SNPs were selected in the model although the point estimates strongly support the importance of GHR snp1 (F279Y) and PRLR snp5 (S18N). Secondly the different methods favor different models so that the LRT prefers models with more parameters than the BIC. It seems that in data set I the LRT favors models with interaction while the BIC suggests models without interac-tion. It is noteworthy, however, that for protein yield BIC selects the model that includes only PRLR snp1 (S18N) and for protein and fat content the preferable model includes only GHR snp1 (F279Y).
The association of GHR F279Y and PRLR S18N polymorphisms with milk pro-duction traits was confirmed in an independent sample of progeny tested bulls (data set II). The results are in good agreement with the observations for data set I: the effect of PRLR S18N (snp5) predominates on yield traits and GHR F279Y (snp1) on content traits. Interaction is suggested since the model with interacti-on is selected as the best model for most of the traits. For this data both of the applied model selection criteria (LRT and BIC) were in agreement.
Genotyping bovine embryos – a practical app-4.3 lication
It has been suggested that the benefits of marker assisted selection programs will be much greater when molecular technology is integrated with reproducti-ve technologies such as in vitro embryo production and embryo transfer becau-se these technologies reduce generation intervals (e.g. Meuwissen et al. 2001). In order to develop a fast and reliable method for genotyping embryos, GHR F279Y and PRLR S18N together with a selection marker for sex (ZFX/ZFY)

40
were genotyped in in vitro (experiment I) and in vivo (experiment II) embryos by applying nested PCR and allelic discrimination (V).
A total of 134 in vitro embryos were genotyped. The embryos from which the biopsies were taken were used as genotyping controls. The genotypes were in disagreement between the biopsy and the respective embryo only three times (see Table 2 in article V). In four cases the amplification failed.
Milk yield
0
0.5
1
1.5
2
2.5
3
3.51 6 11 16 21 26 31 36 41 46 51 56 61 66
cM
F
Protein yield
0
0.5
1
1.5
2
2.5
3
3.5
1 6 11 16 21 26 31 36 41 46 51 56 61 66
cM
F
Protein content
0
0.5
1
1.5
2
2.5
3
3.5
1 6 11 16 21 26 31 36 41 46 51 56 61 66
cM
F
Fat content
0
0.5
1
1.5
2
2.5
3
3.5
1 6 11 16 21 26 31 36 41 46 51 56 61 66
cM
F
0
0.5
1
1.5
2
2.5
3
3.51 6 11 16 21 26 31 36 41 46 51 56 61 66
cM
F
0
0.5
1
1.5
2
2.5
3
3.5
1 6 11 16 21 26 31 36 41 46 51 56 61 66
cM
F
0
0.5
1
1.5
2
2.5
3
3.5
1 6 11 16 21 26 31 36 41 46 51 56 61 66
cM
F
0
0.5
1
1.5
2
2.5
3
3.5
1 6 11 16 21 26 31 36 41 46 51 56 61 66
cM
F
not fixed GHR snp1 fixed PRLR snp5 fixed snp1 and snp5 fixed 0.05
Figure 5. Results of the linkage analysis with fixed effects for five milk produc-tion traits (milk yield, protein yield, protein content and fat content; later lacta-tions). Colored lines indicate the different F-curves. The thin black line repre-sents the 0.05 chromosome-wide significance threshold (10000 permutations) for the analysis without fixed effects. The other analyses were also permutat-ed but because the thresholds are approximately the same only the first one is reported. Inclusion of GHR F279Y as a fixed effect causes a clear decrease in the test statistic in both content traits suggesting that F279Y explains most of the QTL variance observed in milk content. Together GHR F279Y and PRLR S18N explain most of the variation in milk yield. PRLR S18N causes a modest decrease in test statistics in protein yield alone suggesting that S18N explains only part of the QTL variance observed in protein yield.

41
A total of 150 biopsies from in vivo produced embryos were genotyped with the same markers. All three markers were successfully analyzed from 142 biopsi-es, in eight cases the amplification failed. Altogether, 57 female embryos were transferred to synchronized recipients and 18 calves were born. To control the success of genotyping the born calves were genotyped. All born calves were females and correctly genotyped.
The in vitro genotyping method itself proved to be highly accurate. However, the limitation of nested PCR is that only a few markers can be analyzed at the same time. Considering the modern practical applications such as genomic se-lection (Meuwissen et al. 2001) tens or hundreds of thousands of SNP geno-types are required for each individual. The novel genotyping technology with high-density SNP panels requires a much higher DNA concentration than is achievable directly from embryo biopsies. Therefore, a reliable method for who-le genome amplification is needed to be able to respond the needs of practical applications. When this problem is solved it will be possible to genotype large numbers of SNPs from a single biopsy.

42
Discussion 5
Identification of QTL affecting milk production 5.1 traits in Finnish Ayrshire
In this work QTL linkage analysis was conducted in order to map quantitati-ve trait loci affecting milk production traits in Finnish Ayrshire. Two QTL ex-ceeding 5% genome-wise significance thresholds and 14 QTL exceeding 5% chromosome-wise significance thresholds were detected in single chromosome analysis (I). QTL have been successfully identified in several dairy cattle po-pulations (reviewed by Khatkar et al. 2004). Since the seminal paper of Geor-ges et al. (1995) more than 1000 QTL affecting ~100 different traits have been reported in dairy cattle and the number is still increasing (http://www.animal-genome.org/QTLdb/).
QTL identified in Finnish Ayrshire are supported by other studies. The studies cannot be directly compared because they were carried out in distinct popula-tions using different approaches (reviewed by Khatkar et al. 2004). The QTL on BTA12 is the only QTL detected in Finnish Ayrshire that influences overall yield. Reports for QTL on BTA12 in other populations have been rare. Rodri-guez-Zas et al. (2002) detected QTL for FY and PY in one US Holstein-Friesian family and Mosig et al. (2001) have reported a QTL affecting P% in Israeli Hol-stein-Friesian cattle. In the case of QTL on BTA14 there are a number of parallel observations. Grisart et al. (2002), Winter et al. (2002) and Grisart et al. (2004) have provided strong evidence that variant in the diacylglycerol O-acyltransfe-rase 1 (DGAT1) gene on BTA14 has a major effect on milk composition – parti-cularly on fat content – in two different Holstein-Friesian populations. It is quite likely that the QTL detected in Finnish Ayrshire is also due to DGAT1 variation because the position of the QTL is compatible with the genomic location of the gene, the nature of the effect is similar and the K232A substitution is associated with the same phenotype (unpublished observation).
In some chromosome areas QTL in nearly the same positions affected several milk production traits, as expected due to the genetic correlations among the traits. For BTA12 the observed allele substitution effect of BM6404 has the same, positive direction for all yield traits (MY, FY, PY). The estimates of genetic cor-relation between all yield traits are positive for all lactations in Finnish Ayrshire (Mäntysaari et al. 2006) whereas the genetic correlations between milk yield and content traits are negative (Juga 1992). In several cases the QTL effect was seen in milk yield and either or both content traits so that the effects were op-posed to each other. This means that either the high QTL allele for MY segre-gates with the low QTL allele for F% or P% (or both) or vice versa or the obser-ved effects reflect the pleiotropic action of one gene. The within-family analysis

43
revealed the tendency of opposite effects for BTA1, 3, 6, 20, 21 and 23. In our data the effects seen for MY and F% or P% (or both) were never reflected in fat and protein yields except for BTA25, where QTL for MY, P% and PY were de-tected. One explanation could be that the observed opposite effects reflect the amount of water in milk as the increase in milk water content decreases the pro-portions of milk solids. This is of course an assumption. It is possible that some of the correlated effects were missed because the power of the analysis was li-mited and thus the true nature of the trait could have been misinterpreted. Ho-wever, similar findings have been made in other populations (e.g. Arranz et al. 1998; Zhang et al. 1998).
The power of mapping complex traits depends largely on the heritability of the trait, size of the QTL effect and number of animals tested. Our granddaughter design that was used in the initial genome scan (I) comprised 12 bulls and their half-sib sons. The number of sons ranged from 21 to 82 per grandsire, with an average of 41, and the breeding values (EBVs) were based on records from 105 to over 3000 daughters per son. In light of the power estimations for the grand-daughter design (Weller et al. 1990) the power of our design could have been improved by increasing the number of sons per sire. Unfortunately, this wasn’t possible because these were the largest families available for Finnish Ayrshire cattle. The marker density of the genetic linkage map for Finnish Ayrshire cor-responds fairly well with the density suggested to be adequate for QTL detecti-on in outbred populations (Haley and Andersson 1997). However, some impro-vement could have been achieved especially for some of the smallest chromo-somes with only two or three markers typed to make sure that at least one mar-ker would have been informative in every family for these chromosomes.
The use of information from multiple chromosomes simultaneously seemed to increase the statistical power of analysis. When the analysis was augmented by cofactors the number of QTL identified in the original linkage analysis of indi-vidual chromosomes was more than doubled. The addition of the cofactors inc-reased the test statistics of the QTL identified in the initial analysis and in some cases also revealed additional information at the family level. The largest chan-ge in test statistics was seen for the F% QTL on BTA14 where the F-ratio inc-reasesd from 5.83 to 10.74. For BTA14 (F%) as well as BTA6 (MY) and BTA23 (P%) the original estimate of the most likely position of the QTL remained the same. In most cases the position estimates moved a few centimorgans from the original position. Only the position of the protein yield QTL on BTA5 was clear-ly shifted from 131 cM to 77 cM. Minor position shifting is not a critical issue because the position estimates are generally poor in the whole genome scan. The given QTL position estimates are only the positions of the highest F-values on chromosomes. In this study confidence intervals (CI) for QTL positions were not estimated, but based on similar studies in different populations the confidence intervals are expected to be long, usually spanning large parts of the chromo-somes (e.g. Zhang et al. 1998).

44
Sahana et al. (2006) have provided evidence that cofactor analysis gives false positives rather than increases the power of the analysis. There is a high risk of false positives particularly if the family size is small. In our data the avera-ge number of sons per sire was 41. Sahana et al. (2006) suggest that with such small family sizes the power of detection of true QTL increases under both high and low heritability conditions, but there is also a high false positive rate among the additional QTL. The majority of the additional QTL detected here are sup-ported by other studies. Moreover, many of the additional QTL appear on the same chromosomes or even at the same position(s) where QTL for one or more correlated traits were originally detected. These points give some confidence in the results, however, in light of the given criticism (Sahana et al. 2006) the results should be taken with caution.
By applying iterative linkage analysis some improvement was made in detec-ting QTL compared to the conventional QTL analysis. However, this did not solve the poor resolution of QTL locations in the linkage analysis. In cattle the confidence intervals for QTL locations are typically 20-40 cM, corresponding approximately 20-40 million base pairs of genomic sequence (Georges 2007). This resolution is not adequate for positional cloning and gene identification. The main factor limiting mapping resolution in linkage analysis is the frequen-cy of recombination in the genotyped progeny. In order to obtain higher map-ping resolution thousands of offspring are required which is not usually achie-vable with outbred livestock populations (Georges 2007). In an outbred popu-lation the solution is to use the recombination events that have happened during the history of the population. Meuwissen et al. (2002) have proposed a method that combines linkage analysis and linkage diequilibrium analysis. This met-hod has proven to be effective in improving QTL mapping resolution in dairy cattle populations (e.g. Meuwissen et al. 2002; Grisart et al. 2004; Olsen et al. 2004; Olsen et al. 2005; Schnabel et al. 2005; Olsen et al. 2007). The same met-hod was applied in study III.
GHR 5.2 and PRLR are strong candidates for the QTL effect on chromosome 20
The QTL region for milk traits on BTA20 was selected for further characteri-zation. Similar observations were reported in different populations giving con-fidence that this QTL is genuine ( e.g. Georges et al. 1995; Arranz et al. 1998; Zhang et al. 1998). In addition, two interesting candidate genes, growth hormo-ne receptor (GHR) and prolactin receptor (PRLR), were assumed to be located in the region. This assumption was based on the earlier assignment of GHR to bo-vine chromosome 20 (Moody et al. 1995) and information from the correspon-ding genomic region of human and mice (e.g. Solinas-Toldo et al. 1995; Chowd-hary et al. 1996). The chromosomal location of GHR was first ascertained by
45
synteny and linkage mapping (II) and later the location of PRLR was also con-firmed (I). These two genes were selected as candidate genes in the very begin-ning of the study. The selection of candidate genes at this level of resolution is a risk because the number of known potential genes within such regions is usu-ally high, our knowledge of most genes and their function is in its infancy and some of the genes are yet to be identified.
The selection of candidate genes was more founded on knowledge about the ge-nes. Both GHR and PRLR have important roles in mammary gland physiology. Growth hormone (GH) and prolactin (PRL) are multifunctional hormones that act in a variety of tissues including the mammary gland via specific receptors located in plasma membrane of target cells (reviewed by Kelly et al. 1991; Bo-le-Feysot et al. 1998; Kelly et al. 2002). The corresponding receptors, GHR and PRLR, activate further signaling pathways that are believed to initiate a varie-ty of biological programs.
Mammary gland development and differentiation is a complex process that be-gins in the fetus and proceeds during puberty until maturity and pregnancy. The lactating mammary gland is composed of epithelial structures, such as al-veoli and ducts, and the associated connective tissue, stroma (Hurley 2007). It has been shown that administration of GH to young peripubertal heifers stimu-lates mammary gland development substantially (Sejrsen et al. 1986). Based on gene deletion experiments in mice, GH has been suggested to be necessary for normal ductal outgrowth and branching during mammary gland morphogene-sis in puberty since in GHR-null mice the ductal growth and side-branching is greatly retarded (Gallego et al. 2001). PRL is not needed for this developmen-tal stage since PRL-null epithelium transplanted to wild-type hosts forms nor-mal mammary ducts (Horseman et al. 1997; Ormandy et al. 1997; Gallego et al. 2001). Instead, PRL and PRLR are essential for the development and diffe-rentiation of lobuloalveolar structures during pregnancy (Brisken et al. 1999; Gallego et al. 2001). It is not possible to study mammary gland development and lactation in PRL or PRLR deficient mice (PRL-/- or PRLR -/-) because these mice are infertile (Horseman et al. 1997; Ormandy et al. 1997). However, mice hemizygous for PRLR show impaired mammary development and alveolar dif-ferentiation and fail to lactate.
Both genes can also be connected directly to lactation. At parturition, the lo-buloalveolar epithelium is converted to a secretory phenotype and milk pro-teins, lactose and lipogenic enzymes are synthesized (Kelly et al. 2002). PRL has been suggested to be the hormone primarily responsible for the synthesis of milk proteins, lactose, and lipids, all major components of milk (reviewed by Bole-Feysot et al. 1998). In rodents it has been well established that PRL is the primary factor regulating lactation (Bole-Feysot et al. 1998) but there are considerable differences in hormonal requirements for the induction and main-

46
tenance of lactation between species. In lactating cows administration of PRL does not alter milk yield or milk components (Plaut et al. 1987) but GH instead increases milk yield without altering the concentrations of milk protein, fat and lactose (Bauman 1999). The mechanism of GH action has been unclear. It was assumed that in mammary gland the effects of GH were mediated by the insu-lin-like growth factor I (IGF-I) system, which is known to mediate many of the growth related and metabolic effects of GH (Bauman 1999). It has been sugge-sted, however, that GH might act directly on mammary epithelia cells because both GHR mRNA and protein are expressed in mammary epithelial and sur-rounding connective tissue (Hauser et al. 1990; Jiang et al. 1999; Sinowatz et al. 2000). GH-treated cows express 35% more β-casein mRNA than untreated cows (Yang et al. 2005). Higher levels of β-casein mRNA are also expressed in cultured bovine mammary cells under PRL and GH stimuli (Yang et al. 2005). Just recently Zhou et al. (2008) showed using an over expressing bovine mam-mary epithelial derived MAC-T cell line as a model that GH acts on MAC-T cells by stimulating transcription of major milk protein genes, αS1-casein, αS2-casein, β-casein, and α-lactalbumin. Based on various studies it seems that GH can directly stimulate transcription of multiple milk protein genes in the mam-mary gland in a similar manner to PRL. GHR and PRLR are evidently invol-ved in development, differentiation and regulation of the functional mammary gland and therefore either of these genes could explain the observed QTL ef-fects on milk production traits in dairy cattle.
Detection of DNA sequence polymorphism in 5.3 GHR and PRLR
Because of the important role of GHR and PRLR in mammary gland physiolo-gy these genes were selected for sequencing in order to find sequence polymor-phisms that could explain the QTL effects observed for BTA20. Individuals heterozygous for the QTL of interest can be used as templates for sequencing candidate genes, assuming that the individuals segregating the QTL must also be heterozygous for the QTN. However, it cannot be expected that the QTN is the same in every segregating family and therefore any sequence polymor-phism identified in any of these families was accepted.
In this study the sequences of Holstein-Friesians were obtained from five sires segregating for the QTL but in Finnish Ayrshire the samples of the two segre-gating sires were not available and the sequences were obtained from pooled samples of their sons. Samples were pooled within families to keep the sequen-cing expenses low, but also because in sequencing the polymorphic SNPs are detected as double peaks in the sequence graph and the size of the peak reflects the frequency of the allele in the pooled sample, there was a risk of ignoring rarer alleles. Therefore, two pools of sons representing the extreme values of

47
EBVs for milk yield and protein content were used in both families. Using the extreme trait values as a selection criterion it cannot be expected that the pools of sons would represent alternative QTN alleles perfectly. It would have been more accurate to use the predicted segregation of the sire’s alternative chro-mosomes from the linkage studies instead of extreme EBVs.
Only minor proportions (<5%) of the ~200-kb genes were sequenced. A total of four missense mutations were detected in GHR and two in PRLR in Finnish Ayrshire. Based on sequence alignments the GHR F279Y mutation was identi-fied in the transmembrane domain (TMD) at a position that was highly conser-ved among mammals whereas the remaining three were located in less conser-ved positions in the GHR intracellular domain (ICD). Interestingly, however, for each of the four GHR polymorphisms observed the rare allele is bovine-specific. In PRLR at the position of L186P there was some variation in artio-dactyls but for other mammalian and the avian species the position was con-served. PRLR S18N was a less promising causal substitution since both ami-no acid residues were common among the studied species, suggesting that the observed variation may have low structural or functional importance. These conclusions should be taken with some caution because the comparisons are based only on a few species and each species is represented by a single indi-vidual. Moreover, in closely related species similarity may reflect history rat-her than function.
It has been speculated that the variation underlying complex traits is more of-ten regulatory than coding (e.g. Mackay 2001b). Of the four causal QTN iden-tified with strong support in domestic animals, DGAT1 K232A (Grisart et al. 2002; Grisart et al. 2004) and ABCG2 Y581S (Cohen-Zinder et al. 2005; Ol-sen et al. 2007) that affect milk composition in cattle are missense mutations whereas nucleotide substitutions in IGF2 (Jungerius et al. 2004) and GDF-8 (Clop et al. 2006) that influence muscle mass in pig and sheep are regulatory mutations. It was not assumed that the QTN would preferentially be a missen-se mutation although the main focus in this work was in the coding regions. The genes are large, ~ 200 kb, and therefore only a minority of the sequence was analyzed. The sequencing of the entire GHR and PRLR genes would have been technically difficult since there was only some genomic sequence avai-lable and sequencing of the complete genes including all introns and 5’ and 3’ regions would have been an enormous and expensive task. However, three al-ternative leader exons of GHR were sequenced from Finnish Ayrshire without finding any sequence polymorphism but then again six other alternative leader exons have been reported in cattle (Jiang and Lucy 2001).

48
Confirmation of the QTL effects in extended 5.4 population
A new genetic linkage map of bovine chromosome 20 was constructed with the candidate genes and seven microsatellite markers (Figure 4). In the linka-ge analysis the highest test statistic was observed for P%later (Pchr < 0.00005), the most likely position being at the position of marker DIK15 (43 cM). Kno-wing the poor resolution of QTL linkage analysis it is surprising that the most likely position of P% QTL in Holstein-Friesian study is exactly the same (III). However, in both studies the 95% CI covers approximately the distal half of the chromosome.
The order of the microsatellite markers shared between the two maps is the same but the position of PRLR is in conflict. In Finnish Ayrshire PRLR is loca-ted between DIK15 and AGLA29 but in the Holstein-Friesian map PRLR is lo-cated more distally (see Figure 2 in III). The position in the Finnish Ayrshire map is more compatible with the current bovine genomic sequence (Figure 4) and also with the genomic sequence of human, mouse and dog (http://www.en-sembl.org/index.html). In the current version of the bovine genome (Btau_4.0) GHR is located at 33.90-34.21 Mb and PRLR at 41.25-41.49 Mb, the distance between them being ~7 Mb (http://www.ensembl.org/index.html). This distan-ce is quite comparable to human, mouse and dog genomic sequences in which the distances between the two genes varies by ~ 6-7 Mb.
The linkage analysis with the two-QTL model suggested that two QTL segre-gate on bovine chromosome 20. In the earlier QTL analysis suggestive eviden-ce for the presence of two QTL was found only on chromosome 3 but not on any other chromosome (I). It is possible that in our data the number of families with several informative markers per chromosome was too small in the initial whole genome scan for the detection of multiple QTL within a single linkage group. The discrepancy for BTA20 might indeed be due to the map differences assuming that the selected candidate genes are both responsible for the obser-ved effects. In the original linkage map there were no markers between GHR and PRLR but in the new map two informative markers (TGLA153 and DIK15) were included between the genes (Figure 4). The sample size was also exten-ded, which might have increased the power to detect multiple QTL in the same linkage group.
The assumption was that the sires segregating for the QTL would be heterozy-gous for the mutation(s) that are either causing the genes to be functionally dif-ferent or tightly linked to the causal mutation. Sires 12 and 14 were heterozygo-us for both candidate genes and sire 21 for GHR. Family 5 did not fit to the can-didate gene hypothesis since the sire was homozygous for both genes (see Table 5 in IV). It is of course possible that in this family another QTN causes the QTL

49
effect but a closer look at the data revealed that many sons inherited the rare GHR and PRLR alleles from their dams and by chance these sons inherited the same paternal chromosomal segment and therefore fell within the same group in QTL linkage analysis. This is quite unusual but explains the conflict well.
In order to reduce the size of the QTL region methods that exploit population le-vel LD information have been used successfully in different dairy cattle popu-lations (e.g. Grisart et al. 2002; Meuwissen et al. 2002; Olsen et al. 2004; Sch-nabel et al. 2005; Olsen et al. 2007). In Holstein-Friesians the QTL region was narrowed down using a dense marker map and LD (III). Two distinct appro-aches that exploited LD information led to similar conclusions – the QTL ef-fect on milk yield and composition is due to a relatively narrow region around TGLA153 and GHR. No evidence for such an effect was found in the vicinity of PRLR. It is noteworthy, however, that the location of the gene in the linkage map used in III is likely to be incorrect. The LD information was not utilized in the Finnish Ayrshire study (IV). The similarities in QTL position and effect and candidate gene variation between the breeds gave some confidence that at least part of the QTL effect could be due to the same gene. However, linkage analysis with the two-QTL model supported the existence of two QTL for P% in Finnish Ayrshire which was further supported by the location scores from the linkage analysis of the Holstein-Friesian sample. In addition, two segregating sires in Holstein-Friesians were homozygous for the proposed causal mutation in GHR suggesting that other genes might contribute to the effect as well. The-refore, both candidate genes were selected for association analysis.
The effects on milk composition can be exp-5.5 lained by two distinct genes
In Finnish Ayrshire the observed QTL effects on milk production traits can be explained by variation in GHR and PRLR. GHR F279Y was associated with a major effect on milk protein content and PRLR S18N was associated with mo-derate effect on yield traits (IV). The effects of the remaining SNPs in these two candidate genes were practically zero. Both effects were confirmed in an inde-pendent sample of progeny-tested bulls (IV). The effect of GHR F279Y in Fin-nish Ayrshire is in good agreement with observations in five different Holstein-Friesian and Jersey populations (III). The polymorphism behaved in very simi-lar fashion in all populations so that the effect was strongest for protein content and clearly detectable for fat content. The effect was detectable for milk yield but to a lesser extent. It is possible that PRLR variation is associated with yield traits only in Finnish Ayrshire since there was no evidence for such associati-on in Holstein-Friesians. However, the incorrect location of PRLR in the Hol-stein-Friesian map leaves some uncertainty to the results. Moreover, the diffe-rent PRLR SNPs were not tested individually in the Holstein-Friesian sample

50
and therefore the question of whether the effect is Ayrshire-specific remains to be resolved.
Based on the model comparison results it is possible that interaction between GHR F279Y and PRLR S18N exists since the effect of interaction was signifi-cant for most of the models. However, the result was not clear because the two different analysis methods favored different models in data set I. Such interac-tion would not be surprising, however. Although GH and PRL have clear and distinct functions in mammary gland development there appears to be extensi-ve functional overlap in many respects (Bole-Feysot et al. 1998; Gallego et al. 2001; Kelly et al. 2002). PRL is the major regulator of synthesis of milk com-ponent in most mammalian species but it seems that GH synergizes with PRL in the lactogenic process (Gallego et al. 2001). Quite recently it has been shown that GH can act directly on bovine mammary epithelium by stimulating the ex-pression of milk protein genes in vitro and in vivo (Yang et al. 2005; Zhou et al. 2008). In addition, there is some evidence that GHR and PRLR can form a GHR-PRLR heterodimer that is suggested to act as a receptor of placental lac-togens (PLs) (Herman et al. 2000; Gertler and Djiane 2002). The functional similarities may reflect the origin of these hormones since GH, PRL and PLs have been suggested to have evolved from a common ancestral gene (Niall et al. 1971) and the receptors (PRLR, GHR), members of a cytokine receptor fa-mily, are also closely related (Kelly et al. 2002).
GHR F279Y5.6 is a strong candidate for the obser-ved QTL effect
In Finnish Ayrshire F279Y stood out as a strong candidate for the mutation cau-sing the observed QTL effect as only the sires segregating for the QTL were he-terozygous for the substitution and the phenylalanine residue proved to be con-served among all mammals analyzed. The effect of GHR F279Y polymorphism on milk yield and composition has been shown in three breeds of cattle and in several independent data sets using distinct approaches. In each population the same Y-allele was associated with lower protein and fat content. Moreover, the QTL effect on P% was largely removed when F279Y was used as a fixed ef-fect in QTL linkage analysis (Figure 5). In the Finnish Ayrshire bull populati-on the frequency of the favorable F-allele is high, the average being ~ 0.90, but it has slightly increased since the late 1970’s (unpublished observations). This might reflect the breeding objectives in Finland because milk protein has been a central target since the 1980’s. Together these pieces of evidence provide st-rong support that the GHR F279Y substitution is responsible for a large part of the effect observed on BTA20. However, it cannot be ruled out that instead of being the causal mutation F279Y is just tightly linked to the true mutation. Fun-ctional analysis is needed to make the distinction between these two possibi-

51
lities. GHR is indeed expressed in mammary gland (Hauser et al. 1990; Jiang et al. 1999; Sinowatz et al. 2000) and has proven to be important regulator of mammary development, differentiation and lactation (e.g. Bole-Feysot et al. 1998; Kelly et al. 2002). However, due to the multifaceted nature of GHR acti-on it is impossible to say with certainty which developmental or functional sta-ge the mutation affects or whether the effect is cumulative. Moreover signaling, downstream of GH/GHR action includes several pathways and numerous sig-naling proteins (Frank 2001; Lanning and Carter-Su 2006) making the functio-nal analysis even more complicated. Although it might be challenging to prove the causality of the F279Y substitution at a functional level, there are many in-teresting possibilities in sight.
Quite recently it has been suggested that the membrane spanning sequence is important in maintaining the correct orientation between extracellular and int-racellular domains of certain cytokine receptors (Constantinescu et al. 2001; Brown et al. 2005). The ligand-induced signaling of cytokine receptors requires di- or oligomerization of the transmembrane receptor monomers which through the communication between extracellular and intracellular domains leads to the activation of cytoplasmic tyrosine kinase JAK2 and the following downstream signaling cascades (Lanning and Carter-Su 2006). A mechanism where GH binding causes the intracellular domains (ICDs) of the predimerized GHR to undergo rotation has been suggested (Brown et al. 2005). This conformational change brings two JAK2 molecules into sufficient proximity to allow transau-tophosphorylation and thus the activation of the JAK2 molecules. The predime-rization may be mediated by the receptor’s transmembrane domain (TMD), the domain that has been shown to be polymorphic (F279Y) in bovine GHR (Figu-re 6). It is still unclear how GH binding to predimerizied GHR leads to JAK2 activation (Brown et al. 2005; Yang et al. 2007; Yang et al. 2008). It has been proposed that precise orientation of the cytosolic juxtamembrane region bet-ween the membrane bilayer and box1 element (see Figure 6) is critical for cy-tokine receptor signaling, including GHR (Constantinescu et al. 2001; Brown et al. 2005) and that the orientation of the TMD is essential for the orientation of key residues in the juxtamembrane region. Recently, Yang et al. (2007) have shown that the composition and length of the GHR TMD have some effects on the conformation of the extracellular domain (ECD). It is tempting to propo-se that the F279Y mutation in a highly conserved position of the bovine GHR TMD could affect the conformational properties of the TMD and further the functional properties of GHR. Just recently Maj et al. (2007) demonstrated that the hormone binding capacity of bovine GHR differs significantly between the F279Y genotypes FF and FY.
Zhou and Jiang (2006) have demonstrated that the two F279Y alleles do not differ in mediating GH-induced STAT5 activation of gene expression in vitro. The signal transducers and activators of transcription (STAT) family has been

52
Figu
re 6
. Stru
ctur
e an
d am
ino
acid
seq
uenc
e re
latio
nshi
p of
the
bovi
ne G
HR
. A) G
HR
dim
er m
edia
tes
the
sign
al o
f GH
thro
ugh
the
com
-m
unic
atio
n of
ext
race
llula
r (E
CD
) an
d in
trace
llula
r do
mai
ns (I
CD
) an
d ac
tivat
es th
e cy
topl
asm
ic ty
rosi
ne k
inas
e JA
K2
and
the
follo
win
g do
wns
tream
sig
nalin
g ca
scad
es. I
t has
bee
n pr
opos
ed th
at p
reci
se o
rient
atio
n of
cyt
osol
ic ju
xtam
embr
ane
regi
on (J
uxtM
R) b
etw
een
the
mem
bran
e bi
laye
r and
Box
1 el
emen
t is
criti
cal f
or c
ytok
ine
rece
ptor
sig
nalin
g an
d th
at th
e or
ient
atio
n of
the
trans
mem
bran
e do
mai
n (T
MD
) is
ess
entia
l for
the
orie
ntat
ion
of th
e ke
y re
sidu
es in
the
juxt
amem
bran
e re
gion
. The
Box
1 el
emen
t is
requ
ired
for J
AK
2 bi
ndin
g. T
he s
ix
pote
ntia
l pho
spho
tyro
sine
s ar
e m
arke
d w
ith Y
XX
X. B
) The
am
ino-
acid
seq
uenc
e of
bov
ine
GH
R (1
-634
). D
iffer
ent d
omai
ns a
re m
arke
d w
ith c
olor
ed b
ars:
sig
nal p
eptid
e in
gre
en, E
CD
in g
rey,
TM
D in
red,
ICD
in b
lue.
The
am
ino
acid
s th
at a
re s
how
n to
be
poly
mor
phic
in b
o-vi
ne a
re m
arke
d in
red
and
tyro
sine
s (Y
) are
mar
ked
in b
lue.
The
juxt
amem
rane
regi
on (2
85 -
292)
is m
arke
d w
ith a
blu
e lin
e an
d th
e B
ox1
(293
- 30
1) w
ith a
red
line.
The
JA
K2
bind
ing
site
(290
- 37
5) is
mar
ked
with
a y
ello
w li
ne. C
onse
nsus
seq
uenc
es th
at fa
vor S
tat5
bin
ding
ar
e th
e D
-x-Y
mot
if at
Y32
8, Y
483
and
Y562
and
the
sequ
ence
that
incl
udes
an
aspa
ragi
ne (N
) at p
ositi
on -2
or -
1, a
nd a
hyd
roph
obic
res-
idue
at p
ositi
ons
+1 a
nd +
3 at
Y53
0.
cell
mem
bran
e
ICD
TMD
GH
ICD
TMD
ECD
ECD
JuxtMR
Box1
JuxtMR
Box1
KIKGIDPDLL KEGKLEEVNT ILAIHDNYK
H EFYNDDSWVE FIELDIDDPD
EKTEGSDTDR
LETFSCHWTD GANHSLQSPG SVQMFYIRRD IQEWKECPDY VSAGENSCYF NSSYTSVWTP
KQQRIK MLILPPVPVP
FPWFLIIIFG ILGLAVTLFL
LIFS
EVLLITFPQM NPSACEEDFQS GSEATPAFLV RASQSLQILY PVLETNSSGN PKFTKCRSPE
MDLWQLLLTL AVAGSSDAF
YCIKLTSNGG IVDHKCFSVE DIVQPDPPVG LNWTLLNISL TEIHADILVK WEPPPNTDVK
MGWIILEYEL HYKELNETQW KMMDPLMVTS VPMYSLRLDK EYEVRVRTRQ RNTEKYGKFS
LLSNDHEKSL NIFGAKDDDS GRTSCYE
PDI LEADFHVSDM CDGTSEVAQP QRLKGEADIS
CLDQKNQNNS PSNDAAPASQ
QPSVILVEEN KPRPLLIGGT ESTHQAVHTQ LSNPSSLANI
DFYA
QVSDIT PAGNVVLSPG QKNKTGNPQC DTHPEVVTPC
QANF
IVDNA
YFCEVDAK
KYI
ALAPHVEAES HVEPSF
NQED IYI
TTESLTT TAGRSGTAEH VPSSEIPVPD YT
SIHIVQSP
QGLVLNATAL PLPDKEFLSS CGYV
STDQLN KIMP
10
20
30
40
50
60
70
80
90
100
110
120
130
140
150
160
170
180
190
200
210
220
230
240
250
260
270
280
290
300
310
320
330
340
350
360
370
380
390
400
410
420
430
440
450
460
470
480
490
500
510
520
530
540
550
560
570
580
590
600
610
620
630
B
Y 623
Y 483
Y 530
Y 562
Y 591
Y 539
JAK
2 bi
ndin
g si
te29
0-37
5
Y 623
Y 483
Y 530
Y 562
Y 591
Y 539
cell
mem
bran
eTTTTTTTTTTTTTTTTTTTTTTTTTTTMMMMMMMM
DDDDDDDDDDDDDDDDDDDDDDDDDDDTTTTTTTTTTTTTTTTTTTTTTTTTTTMMMMMMMM
DDDDDDDDDDDDDDDDDDDDDDDDDDDce
ll m
embr
ane
ICD
TMD
GH
ICD
TMD
ECD
ECD
JuxtMR
Box1
JuxtMR
Box1
KIKGIDPDLL KEGKLEEVNT ILAIHDNYK
H EFYNDDSWVE FIELDIDDPD
EKTEGSDTDR
LETFSCHWTD GANHSLQSPG SVQMFYIRRD IQEWKECPDY VSAGENSCYF NSSYTSVWTP
KQQRIK MLILPPVPVP
FPWFLIIIFG ILGLAVTLFL
LIFS
EVLLITFPQM NPSACEEDFQ
KQQRIK MLILPPVPVP
FPWFLIIIFG ILGLAVTLFL
LIFS
EVLLITFPQM NPSACEEDFQS GSEATPAFLV RASQSLQILY PVLETNSSGN PKFTKCRSPE
MDLWQLLLTL AVAGSSDAF
S GSEATPAFLV RASQSLQILY PVLETNSSGN PKFTKCRSPE
MDLWQLLLTL AVAGSSDAF
YCIKLTSNGG IVDHKCFSVE DIVQPDPPVG LNWTLLNISL TEIHADILVK WEPPPNTDVK
MGWIILEYEL HYKELNETQW KMMDPLMVTS VPMYSLRLDK EYEVRVRTRQ RNTEKYGKFS
LLSNDHEKSL NIFGAKDDDS GRTSCYE
PDI LEADFHVSDM CDGTSEVAQP QRLKGEADIS
CLDQKNQNNS PSNDAAPASQ
QPSVILVEEN KPRPLLIGGT ESTHQAVHTQ LSNPSSLANI
DFYA
QVSDIT PAGNVVLSPG QKNKTGNPQC DTHPEVVTPC
QANF
IVDNA
YFCEVDAK
KYI
ALAPHVEAES HVEPSF
NQED IYI
TTESLTT TAGRSGTAEH VPSSEIPVPD YT
SIHIVQSP
QGLVLNATAL PLPDKEFLSS CGYV
STDQLN KIMP
10
20
30
40
50
60
10
20
30
40
50
60
70
80
90
100
110
120
70
80
90
100
110
120
130
140
150
160
170
180
130
140
150
160
170
180
190
200
210
220
230
240
190
200
210
220
230
240
250
260
270
280
290
300
250
260
270
280
290
300
310
320
330
340
350
360
310
320
330
340
350
360
370
380
390
400
410
420
370
380
390
400
410
420
430
440
450
460
470
480
430
440
450
460
470
480
490
500
510
520
530
540
490
500
510
520
530
540
550
560
570
580
590
600
550
560
570
580
590
600
610
620
630
610
620
630
A
Y 623
Y 483
Y 530
Y 562
Y 591
Y 539
JAK
2 bi
ndin
g si
te29
0-37
5
Y 623
Y 483
Y 530
Y 562
Y 591
Y 539
GH

53
shown to play a particularly important role in the GH induced regulation of gene transcription (Herrington et al. 2000; Lanning and Carter-Su 2006). STATs are phosphorylated by JAK2 or GHR (or both) after which they can either mediate signals in cytoplasm or form homo- or heterodimers, translocate to the nucle-us and act as transcription factors of many GH-regulated genes (Herrington et al. 2000). Zhou and Jiang (2006) tested only a single STAT protein (Stat5b) but there are also other STAT proteins and other pathways under GH control (Herrington et al. 2000) and the network of interactions is probably far more complicated than is currently known. It is also possible that the allelic differen-ce between FF and FY is modest and therefore difficult to detect reliably with current techniques. Therefore, the work of Zhou and Jiang (2006) does not rule out the possibility that the different GHR alleles have different abilities to me-diate GH signal.
Another interesting point is that the QTL effect on milk yield and content traits was often opposing (I). In Finnish Ayrshire the Y-allele was associated with lower protein and fat content and slightly higher milk yield. This could mean that the difference between the two alleles reflects the amount of water in milk as an increase in milk water content decreases the proportion of milk solids. GH can directly stimulate transcription of multiple milk proteins including α-lactalbumin (α-LA) in bovine MAC-T cells (Zhou et al. 2008). α-LA modi-fies the substrate specificity of a galactosyltransferase (GT) by forming lactose synthase, the enzyme that synthesizes lactose from glucose and UPD-galacto-se in the mammary gland (Hurley 2007). α-LA is the limiting factor of lacto-se synthesis since the rate of synthesis appears to be dependent upon the α-LA to GT ratio (Hurley 2007). Lactose is the major osmotic molecule in milk and therefore α-LA is suggested to have a critical role in determining milk volu-me. Stinnakre et al. (1994) have shown that the milk of mice lacking functio-nal α-LA is more concentrated than milk of wild-type mice. The over expressi-on of α-LA on the other hand increases milk volume at the expense of protein content (Boston et al. 2001; Noble et al. 2002).
The importance of variation in the GHR cytop-5.7 lasmic domain
We have postulated that F279Y (or a tightly linked mutation) is responsible for at least part of the QTL effect on BTA20. The other GHR polymorphisms in Fin-nish Ayrshire (N528T, A541S and S555G) did not show any evidence for associa-tion with milk production traits. However, considering the molecular nature of the receptor one question is whether the analysis should have been performed so that the dependencies between different SNPs would have been considered. The four variants exist as six different GHR haplotypes in Finnish Ayrshire.

54
There are some interesting features related to the variation in the GHR cytoplas-mic domain. Varvio et al. (2008) studied the molecular character of the cytop-lasmic domain of bovine GHR and showed that in sixteen breeds of cattle (beef, dairy, native and East African breeds) there is high level of interesting molecu-lar variation. Within a 900 bp sequence of exon 10 (~ 90% of the cytoplasmic domain) 14 SNPs were identified of which seven result in amino acid substituti-on (S439N, P519S, N523D, N528T, A536T, A541S, S555G). Most of the polymor-phic amino-acid sites cluster around highly conserved tyrosine sites (at bovine positions 483, 530, 562, 591 and 623) which are suggested to be critical for int-racellular signaling (Frank 2001). In the same region there is a ruminant-specific tyrosine residue at position 539 that could be an additional target for phosphory-lation. Five of the seven polymorphic amino acid sites are located in an area of low divergence across 34 mammalian species (P519-P544 in Figure 6; Varvio et al. 2008). Tyrosines that correspond to bovine Y483, Y530, Y562 and Y623 have been identified as being required for GH-dependent tyrosylphosphoryla-tion of Stat5 (Wang et al. 1996). In some cytokine receptors, including GHR, a D-x-Y motif has been proposed as a putative Stat5-binding motif (Smit et al. 1996). In bovine GHR the motif is seen at Y328, Y483 and Y562 (Figure 6). It has also been suggested that a consensus sequence that includes an asparagine (N) at position -2 or -1, and hydrophobic residues at positions +1 and +3 with respect to the phosphotyrosine could favor Stat5 binding in cytokine receptors (May et al. 1996). In GHR Y530 has an N at position -2 and a hydrophobic re-sidue at position +1. As seen in Figure 6 the N528T polymorphism detected in Holstein-Friesian and Finnish Ayrshire cattle mutates this consensus sequence. A541S is also in close proximity to bovine specific Y539, between hydrophobic residues at position +1 and +3.
PRLR S18N5.8 is likely to be in LD with the true mutation causing the effect
Knowing the evidently important role of PRL in mammary gland differentiation and lactation (Bole-Feysot et al. 1998), PRLR S18N has the potential to be the causal mutation behind the observed effect on yield traits. The effect of PRLR S18N polymorphism on yield was shown in two independent ‘data sets’ of Fin-nish Ayrshire, but there was no evidence for such association in the Holstein-Friesian breed. In Finnish Ayrshire the rare N-allele was associated with higher yield in both data sets. The concordance between the sires heterozygous for the QTL and the sires heterozygous for S18N was not, however, complete. Seven out of twenty-three sires were heterozygous for this polymorphism. Moreover, the comparison of signal peptide sequences of different species revealed that at the position of the S18N substitution serine (S) and asparagine (N) are both fairly common. Based on this evidence it is unlikely that S18N is the causal mu-tation. Because the S18N polymorphism was identified in both breeds but the

55
association was detected only in Finnish Ayrshire it is possible that S18N is in LD with the true mutation in Finnish Ayrshire but not in Holstein-Friesian. It is noteworthy, however, that the frequency of the N-allele has increased from 0.09 to 0.31 between the late 1970’s and 1990’s in the Finnish Ayrshire bull po-pulation (unpublished observations). In the MTT ASMO-nucleus herd (multiple ovulation embryo transfer (MOET) breeding scheme in Finland) the frequen-cy is currently 0.35. Protein yield has been a central target of dairy cattle bree-ding in Finland since the 1980’s and therefore the observation fits well with the breeding objectives (Mäntysaari E., personal communication). Whether the ob-served effects on yield traits are caused by variation in PRLR or another gene remains to be resolved, however, S18N has the potential to be useful in marker assisted selection.
Proving causality is difficult and needs to be 5.9 based on multiple pieces of evidence
Only a handful of QTL have been characterized to such a level that the causal gene(s) and QTN(s) are identified and their effects are formally proven (Gla-zier et al. 2002). The principle challenge is not so much the detection of QTL, but the identification and verification of the genes that underlie them. The few approaches that allow unambiguous identification of the genes underlying the QTL effect and provide conclusive evidence that the candidate polymorphism is indeed a QTN require knock-out and gene targeting technologies and cannot be applied to most species. In such cases the only option as noted by Mackay (2001a) is to collect multiple pieces of evidence which together consistently point to a candidate gene. Glazier et al. (2002) have proposed standards of evi-dence to establish formal proof for gene discovery in a wide variety of orga-nisms. With livestock species comprehensive proof is hardly achievable but a collection of statistical and functional evidence might provide convincing proof (Ron and Weller 2007).
In this study the selection of the QTL for further characterization was based on the statistically significant linkage signal (Pchr < 0.05) and supported by seve-ral independent studies (e.g. Georges et al. 1995; Arranz et al. 1998; Zhang et al. 1998). Two genes, GHR and PRLR, were selected as candidate genes in very beginning of the study based on the knowledge about the genes. The confiden-ce intervals of the QTL were not calculated in the whole genome scan but they were assumed to span most of the chromosomes. For BTA20 the location sco-res suggested that the QTL lies in the distal half of the linkage group where the candidate genes were also assumed to be located.
The coding sequence of GHR and PRLR and the sequence of three well-cha-racterized GHR promoters were sequenced in order to find DNA variation that

56
could explain the observed QTL effects for bovine chromosome 20. The stra-tegy was not optimal because both genes might have numerous DNA sequence variants, coding or regulatory, each of which might contribute to the QTL effect alone or in combination. Therefore a better strategy would have been to search for nucleotide variants throughout the entire genes and after identification con-sider each variant as a putative QTN (Glazier et al. 2002). However, the genes are large, ~ 200 kb, and only some genomic sequences were available, and so the sequencing of complete genes was not possible with the available resources.
In early efforts to fine map QTL in dairy cattle the common strategy was to search for sequence polymorphisms in the most likely candidate genes. Wit-hout question this strategy was not very effective, but the marker density was poor and the fine mapping methods suitable for half sib family structure were just beginning to be developed. With the current QTL fine-mapping methodo-logy and marker panels it is possible to narrow down the QTL interval so that it comprises only a limited number of genes. As an example, Olsen et al. (2005) succeeded in reducing the CI of the QTL affecting milk composition on BTA6 to a 420-kb interval containing six genes by applying combined linkage and LD analysis and a high density marker map. Because it is possible that the QTL ef-fect is due to the combined action of multiple linked QTNs in a single or mul-tiple genes, a good practice is to reduce the size of the critical interval as much as possible (Glazier et al. 2002). In this study the LD information was not app-lied for Finnish Ayrshire. It would have required a new, denser marker set to be genotyped. This study relied on the fine-mapping observations that were made in the Holstein-Friesians. These two dairy breeds are distinct, but they have been suggested to have a common ancestry (Kantanen et al. 2000) and there-fore it is possible that the QTL have the same origin in different breeds. In ad-dition, there were such similarities in QTL position and effect and candidate gene variation that it was assumed that at least part of the QTL effect could be due to the same gene.
Results from studies III and IV were in good agreement that GHR F279Y might be a direct cause of the effects on milk yield and composition. This was sup-ported by a series of statistical tests and confirmed in several distinct popula-tions. If the effect of the putative QTN is maintained across diverse breeds it in-creases the likelihood that this is the causative QTN rather than a locus in tight LD with the QTN (Ron and Weller 2007). The effect of GHR F279Y was shown in Dutch and New Zealand Holstein-Friesian, Finnish Ayrshire and Jersey po-pulations. The polymorphism behaved in a very similar fashion in all analyzed populations so that the effect was strongest for protein content and clearly de-tectable for fat content and milk yield. Moreover, in both studies the effect on protein content was largely removed when F279Y was used as a fixed effect in the linkage analysis (Finnish Ayrshire) or in LD variance component analysis (Holstein Friesian). The other SNPs did not have similar influences. In Finnish

57
Ayrshire and in Holstein-Friesians the frequencies of the favorable F-allele have increased over time and in Holstein-Friesians there is some evidence that the FF genotype increases the likelihood for a sire to be selected for breeding. Ad-ditionally, in Finnish Ayrshire there was complete concordance between QTL and F279Y genotypes. In Holstein-Friesians two sires heterozygous for the QTL were also heterozygous for this polymorphism, but two other segregating sires were found to be homozygous for the polymorphism. Unfortunately the GHR F279Y genotypes were not reported for all Holstein-Friesian sires. Altogether the statistical evidence for GHR F279Y is quite convincing. Based on the statis-tical evidence it seems unlikely that PRLR S18N is the direct cause of the ob-served effect on yield traits. The S18N polymorphism was identified in both breeds but the association was detected only in Finnish Ayrshire. It is of course possible that in different breeds different combinations of QTNs cause similar QTL effects. There were, however, several other factors against the causality of S18N and therefore it was considered that it is more likely that S18N is in LD with the true mutation in Finnish Ayrshire.
The issue of functional proof is always problematic when species other than mo-del organisms are studied. As noted by Glazier et al. (2002) the most conclusive evidence that a QTN has been identified is a demonstration that the replacement of the variant nucleotide results in swapping one phenotypic variant to another. This kind of functional proof can be achieved only if knock-out and gene tar-geting technologies can be applied and this is not an option with livestock (Ron and Weller 2007). The functional role of a QTN can be studied in most species only under in vitro conditions or by using model organisms but these observa-tions cannot be directly related to the in vivo phenotype of the species of inte-rest and therefore do not provide comprehensive proof. The GHR F279Y poly-morphism meets the statistical criteria sufficiently well to justify functional stu-dies. However, many complicating factors make functional tests challenging. First of all, there is a great diversity in structural and functional properties of the mammary gland between species (Hurley 2007). Therefore, using mice as a model for functional tests of ruminant lactation might not be informative. Se-condly, GHR is a multifunctional receptor molecule that mediates hormonal signals via several intracellular pathways and acts in a variety of cell types and different developmental and functional stages in mammary gland as well as in other tissues. Because of this it is difficult to say how this mutation could affect milk production and whether the effect is specific for a certain stage of mam-mary gland physiology or whether it is cumulative. In this study functional tests were not performed and so the interpretation of the causality of GHR F279Y and PRLR S18N is based mainly on statistical evidence.

58
Practical applications of the trait associated 5.10 polymorphisms
One of the major motivations for QTN identification has been the potential use of molecular information in marker assisted selection (MAS). There is strong evidence that GHR F279Y could be the direct cause of the observed QTL effect on milk composition, however, the causality is difficult to prove and thus it is still possible that the substitution is just tightly associated with the true muta-tion. The best marker for MAS would be the causal mutation but markers that are in strong LD with the QTL at a population level are also practicable becau-se these markers allow selection across a population and associations remain from generation to generation (Dekkers 2004). However, the favorable F-allele, shown to be associated with lower milk yield and higher protein and fat content in several dairy cattle populations, is already at high frequency in the studied populations which might limit its usefulness in breeding. The favorable PRLR N-allele is less frequent, the frequency being ~ 0.30 in the current population. The frequency has increased over time which seems to reflect the breeding ob-jectives of the last two decades. S18N could be useful in MAS because the ef-fect is parallel in all yield traits. However, it seems more likely that in the Fin-nish Ayrshire population S18N is tightly linked with the true mutation than the direct cause of the observed QTL effect on yield, and the question is then how tight is the LD between S18N and the putative causal mutation.
The multifunctional nature of GH and PRL action (Kelly et al. 1991; Bole-Fe-ysot et al. 1998) gives reason to suspect that the observed variation could have pleiotropic effects, some of which might be unfavorable. The value of a QTN in selection programs depends on the effects of the QTN on all traits that are inclu-ded in the selection index (Ron and Weller 2007). Just recently it was reported that GHR F279Y is significantly associated with feed intake, feed conversion, and body energy traits in Holstein dairy cows in the UK (Banos et al. 2008). Whether it affects other known targets of GH and PRL action, such as those in-volved in growth, reproduction, behaviour and disease resistance, remains to be resolved. The usability of individual QTNs in selection programs depends also on epistatic interactions between genes (Carlborg and Haley 2004). In this study the interaction effect of GHR F279Y and PRLR S18N was studied becau-se biological interaction between the two genes is possible. Interaction was sug-gested, although the result was not very clear. Apparently, the power to detect interaction in our data was too low since the statistical power to detect epista-tic effect depends on the number of individuals in the genotype classes (Carl-borg and Haley 2004) and in our family data the less frequent alleles of F279Y and S18N were rare.
A new form of MAS, called genomic selection (Meuwissen et al. 2001), bypas-ses the need for QTL detection and QTN identification. The approach is based

59
on the assumption that potentially all genetic variance can be explained when high-density markers covering the whole genome are used because with suffi-cient marker density all QTL are expected to be in LD with at least one of the markers. Although the QTN does not need to be identified for selection purpo-ses, there is still a need to understand the inheritance of complex traits’. Consi-dering the current achievements, QTN identification seems to be a challenging task. So far the search for QTNs in dairy cattle has lasted more than 10 years and the achievements have been modest. Only two QTN, missense mutations in DGAT1 (Grisart et al. 2002; Winter et al. 2002; Grisart et al. 2004) and ABCG2 (Olsen et al. 2007), have been identified with strong supportive evidence in dai-ry cattle, but neither of these results are fully conclusive. However, the current development in key technologies and genomic resources, better understanding of the gene mapping process, and the continuous increase in biological infor-mation create a better foundation for gene discovery. The future will show how novel technology and information will improve our prospects of unravelling the genetic architecture of quantitative variation.

60
Conclusions6 The main motivations of QTL (quantitative trait loci) mapping in dairy cattle are the understanding of the genetic architecture of quantitative traits and the utilization of molecular genetic information in practical breeding schemes. The focus of this study was in economically important milk production traits. The aim was to map QTL affecting milk yield and composition in Finnish Ayrshire dairy cattle and to unravel the molecular nature of one selected QTL identified on bovine chromosome 20. Added to this, a method for trait associated gene diagnosis from bovine embryos was developed in order to respond to the needs of commercial embryo production.
The first objective was to map QTL for milk production traits in Finnish Ayr-shire dairy cattle by utilizing an existing half-sib pedigree and by applying two distinct approaches – QTL linkage analysis of individual chromosomes and ite-rative QTL linkage analysis of multiple chromosomes. In the single chromo-some analysis two QTL exceeding the 5% genome-wise significance level and 14 QTL exceeding the 5% chromosome-wise significance level were detected. The findings were supported by other studies. When the iterative approach was applied the number of QTL identified in the original linkage analysis was inc-reased to 31 genome-wise (Pgenome < 0.05) significant QTL. The use of informa-tion from multiple chromosomes seems to increase the detection power of the analysis, although it is possible that instead of enhancing the statistical power it increases the rate of false positives. However, the results were quite convincing because most of the additional QTL were either supported by other studies or detected in the same positions as QTL affecting correlated traits were obser-ved in the initial analysis. Because of the genetic correlations of the milk pro-duction traits it was not surprising that for some chromosomes QTL affecting different traits were detected at nearly the same positions. Apparently, only a few of the identified loci truly affect yield but several QTL seem to affect the liquid component of milk since the effect on milk yield and either or both con-tent traits were opposed to each other in many cases. This is only a hypothesis since other explanations exist. However, similar findings have been made in ot-her populations too.
The second objective was to unravel the molecular nature of one selected milk production QTL identified on bovine chromosome 20. Two interesting candi-date genes that were shown to have important roles in mammary gland physio-logy were mapped to the region of interest – the genes encoding receptor mole-cules of growth hormone (GHR) and prolactin (PRLR). In order to find sequen-ce polymorphism that could explain the QTL effects observed for BTA20 the coding sequences of GHR and PRLR were sequenced in two populations, in Dutch Holstein-Friesian and in Finnish Ayrshire. In GHR four mutations that lead to amino acid substitutions were detected, two of which were identified in

61
both breeds (F279Y, N528T) and two only in Finnish Ayrshire (A541S, S555G). In PRLR two mutations were detected in both breeds (S18N, L186P). In Hol-stein-Friesians the QTL region was narrowed down using a dense marker map and mapping approaches that exploit LD information. These results suggested that the QTL effect in Holstein-Friesians were due to a relatively narrow regi-on around GHR. In both breeds the GHR F279Y polymorphism was clearly as-sociated with milk yield and composition. The observation was supported by a series of statistical tests and confirmed in several distinct populations. Ho-wever, in Finnish Ayrshire the QTL effect was partly explained by another po-lymorphism, PRLR S18N. The results provide strong evidence that the effect of PRLR S18N is distinct from the GHR F279Y effect. In particular, F279Y has the highest influence on protein content while S18N markedly influences pro-tein yield. In addition, association analysis suggests interaction between these two substitutions. The results were in good agreement that GHR F279Y could be the direct cause of the effects on milk yield and composition in both breeds. The statistical evidence for this polymorphism was quite convincing, although it is still possible that the polymorphism is just in LD with the causal mutation. The effect of PRLR S18N was distinct from the effect of GHR F279Y in Finn-ish Ayrshire, however, there were several factors against the causality of S18N and therefore it was considered that it is more likely that S18N is in LD with the true mutation. In this study functional tests were not performed. Because of the multifaceted nature of these genes it might be challenging to collect functional evidence at any level.
One of the main motivations of QTL mapping in domestic animals has been the expectation that molecular genetic information could enhance genetic gain in phenotype-driven selection programs’. There was strong evidence that GHR F279Y could be the direct cause of the QTL effect on milk composition in se-veral dairy cattle populations or tightly associated with the true mutation and therefore it was first considered to have some potential in MAS. However, the frequency of the favorable F-allele associated with lower milk yield and higher content of milk solids was already high in the current population which might limit its usefulness. The frequency of the favorable N-allele of PRLR S18N has clearly increased over time but it is still the less frequent allele in the current population. The effect of the N-allele was highest on protein yield and also pa-rallel in other yield traits. Because protein yield has been the central target of dairy cattle breeding in Finland since the 1980’s, the marker has the potential to be useful in MAS. However, these genes might have epistatic interactions and also pleiotropic effects on other traits and therefore the value of these poly-morphisms in MAS cannot be estimated without understanding these interac-tions better. In this work these markers were used to test a method for trait as-sociated gene diagnosis for bovine embryos. It has been suggested that the be-nefits of marker assisted selection programs will be much greater when integra-ted with reproduction technologies that reduce generation intervals. GHR F279Y

62
and PRLR S18N together with a selection marker for sex were genotyped from in vitro and in vivo embryos by applying nested PCR and allelic discrimination. The method proved to be highly accurate. However, the limitation of the met-hod is that only a few markers can be analyzed from a single biopsy. In order to respond to the needs of modern breeding applications such as genomic selec-tion tens or hundreds of thousands of genotypes need to be analyzed. The no-vel genotyping technology with high-density SNP panels requires much higher DNA concentration than is achievable directly from embryo biopsies. Therefo-re, a reliable method for amplification of genomic DNA is needed to respond to the needs of practical applications. When this problem is solved it will be pos-sible to genotype large number of SNPs from a single embryo biopsy.

63
Acknowledgements7 First I want to express my warmest graditude to my supervisor Johanna Vilk-ki for the opportunity to work in the exciting world of genomics. Her cons-tant support and patience () and her endless optimism have helped me to go through this process!
I am deeply grateful to Professor Asko Mäki-Tanila, the head of Animal Pro-duction Research, for giving me the opportunity to do research in this field of science. I appreciate his contribution, especially for reviewing this thesis and all my manucripts. His comments have been most helpful.
I am also grateful for Professor Michel Georges from the Department of Gene-tics at the University of Liège for giving me the opportunity to work in collabo-ration with his brilliant team. Special thanks to all my friends in Belgium, es-pecially to Sarah Blott for smooth ”northern European style” collaboration and friendship, and to Paulette Berzi for helping me with many practical problems in lab and everyday life in Liège.
Warm thanks to Joanna Szyda from the Department of Animal Genetics at the Wroclaw Agricultural University, Poland, for her contribution to this work. It’s been very pleasent to work with her.
Professor Moshe Soller from the Hebrew University of Jerusalem and Professor Jeremy F. Taylor from the University of Missouri-Columbia are acknowledged for reviewing the thesis and Jodie Painter from the Queensland Institute of Me-dical Research for language revision.
Warmest thanks to the present and former members of our research team. Nina Schulman is thanked for collaboration in this work and for delightful discus-sions about the subject (and from the side of it ). Thanks also to the other members of the ”cattle team”, Terhi Iso-Touru, Jouni Virta, Tiina Jaakkola and Jonna Tabell, especially for covering for me when I was more or less ”absent”. Special thanks to Anu Sironen and Mervi Honkatukia for being the most cheer-ful travelling companions on many of our tirps around the world and also for being my friends. Warmest thanks to Maria Tuiskula-Haavisto for all the soul-searching discussions during the lunch hours. Thanks to Jaana Peippo for col-laboration in this work and for friendship. Thanks also to the other members of the ”embryo team”, Kati Korhonen, Mervi Räty and Tuula-Marjatta Hamama. I am grateful for Anneli Virta for skilful assistance in DNA fragment and se-quence analysis. Thanks also to our former post-doc Kari Elo for guiding me in the field of QTL mapping.
I would also like to thank the other members and friends from the deparment.

64
Martin Lidauer is acknowledged for calculating the daughter yield deviations for us. Elina Laihonen, Pirkko Kallenautio and Outi Kasari are thanked for as-sistance in practical matters. Warm thanks to Timo Serenius for many useful discussions and Juha Kantanen for all kinds of discussions. Thanks also to tho-se that remember (or have heard) attending the ”sushi party” and many other happenings before and after.
I also appreciate collaboration with the Department of Genetics at the Univer-sity of Turku. Special thanks for Professor Petter Portin and Professor Marja-Liisa Savontaus for the opportunity to work in their laboratory. Warm thanks to Saara Kares for all the help with ABI and for cheerful discussions (mostly about dogs).
I own my deepest graditude to my family. My daughter Aina and my husband Mika, thank you for your love and patience during this process. My parents Nea and Jouko, my little sisters, Hanna, Mimma and Mammu, my niece Elenia and my Auntie Tatti, thank you for being there for me always! Warm thanks also for my best friends, Carita and Marju, for helping me to put many things in my life to the right scale when needed.
The reseach documented in this thesis was carried out at the MTT Agrifood Research Finland, Animal Production Research, Animal Breeding (later Bio-technology and Food Research, Animal Genomics) in Jokioinen between 1999-2006. Part of the work was conducted at the Department of Genetics, Faculty of Veterinary Medicine, University of Liège, Belgium during 1999-2000. The work was funded by the Ministry of Agriculture and Forestry of Finland, the European Union, the Finnish Animal Breeding Association, the Academy of Finland, and the National Technology Agency of Finland.
Jokioinen, November 2008
Sirja Viitala

65
References8 Abasht, B., J. C. Dekkers and S. J. Lamont, 2006 Review of quantitative trait
loci identified in the chicken. Poult. Sci. 85: 2079-2096.
Amaral, M. E., S. R. Kata and J. E. Womack, 2002 A radiation hybrid map of bovine X chromosome (BTAX). Mamm. Genome 13: 268-271.
Andersson, L., 2001 Genetic dissection of phenotypic diversity in farm animals. Nat. Rev. Genet. 2: 130-138.
Andersson, L., C. S. Haley, H. Ellegren, S. A. Knott, M. Johansson et al, 1994 Genetic mapping of quantitative trait loci for growth and fatness in pigs. Sci-ence 263: 1771-1774.
Arranz, J. J., W. Coppieters, P. Berzi, N. Cambisano, B. Grisart et al, 1998 A QTL affecting milk yield and composition maps to bovine chromosome 20: A confirmation. Anim. Genet. 29: 107-115.
Band, M. R., J. H. Larson, M. Rebeiz, C. A. Green, D. W. Heyen et al, 2000 An ordered comparative map of the cattle and human genomes. Genome Res. 10: 1359-1368.
Banos, G., J. A. Woolliams, B. W. Woodward, A. B. Forbes and M. P. Coffey, 2008 Impact of single nucleotide polymorphisms in leptin, leptin receptor, growth hormone receptor, and diacylglycerol acyltransferase (DGAT1) gene loci on milk production, feed, and body energy traits of UK dairy cows. J. Dairy Sci. 91: 3190-3200.
Barendse, W., S. M. Armitage, L. M. Kossarek, A. Shalom, B. W. Kirkpatrick et al, 1994 A genetic linkage map of the bovine genome. Nat. Genet. 6: 227-235.
Barendse, W., D. Vaiman, S. J. Kemp, Y. Sugimoto, S. M. Armitage et al, 1997 A medium-density genetic linkage map of the bovine genome. Mamm. Ge-nome 8: 21-28.
Bauman, D. E., 1999 Bovine somatotropin and lactation: From basic science to commercial application. Domest. Anim. Endocrinol. 17: 101-116.
Bishop, M. D., S. M. Kappes, J. W. Keele, R. T. Stone, S. L. Sunden et al, 1994 A genetic linkage map for cattle. Genetics 136: 619-639.
Bole-Feysot, C., V. Goffin, M. Edery, N. Binart and P. A. Kelly, 1998 Prolactin (PRL) and its receptor: Actions, signal transduction pathways and phenotypes observed in PRL receptor knockout mice. Endocr. Rev. 19: 225-268.
Boston, W. S., G. T. Bleck, J. C. Conroy, M. B. Wheeler and D. J. Miller, 2001 Short communication: Effects of increased expression of alpha-lactalbumin in transgenic mice on milk yield and pup growth. J. Dairy Sci. 84: 620-622.
Botstein, D., R. L. White, M. Skolnick and R. W. Davis, 1980 Construction of a genetic linkage map in man using restriction fragment length polymorphisms. Am. J. Hum. Genet. 32: 314-331.

66
Brenneman, R. A., S. K. Davis, J. O. Sanders, B. M. Burns, T. C. Wheeler et al, 1996 The polled locus maps to BTA1 in a bos indicus x bos taurus cross. J. Hered. 87: 156-161.
Brisken, C., S. Kaur, T. E. Chavarria, N. Binart, R. L. Sutherland et al, 1999 Pro-lactin controls mammary gland development via direct and indirect mecha-nisms. Dev. Biol. 210: 96-106.
Brown, R. J., J. J. Adams, R. A. Pelekanos, Y. Wan, W. J. McKinstry et al, 2005 Model for growth hormone receptor activation based on subunit rotation within a receptor dimer. Nat. Struct. Mol. Biol. 12: 814-821.
Buitenhuis, A. J., M. S. Lund, J. R. Thomasen, B. Thomsen, V. H. Nielsen et al, 2007 Detection of quantitative trait loci affecting lameness and leg conforma-tion traits in danish holstein cattle. J. Dairy Sci. 90: 472-481.
Cai, L., J. F. Taylor, R. A. Wing, D. S. Gallagher, S. S. Woo et al, 1995 Construc-tion and characterization of a bovine bacterial artificial chromosome library. Genomics 29: 413-425.
Carlborg, O., and C. S. Haley, 2004 Epistasis: Too often neglected in complex trait studies? Nat. Rev. Genet. 5: 618-625.
Chowdhary, B. P., and T. Raudsepp, 2005 Mapping genomes at the chromosome level, pp. 23-65 in Mammalian Genomics, edited by A. Ruvinsky and J. A. Marshall Graves. CABI Publishing, Oxfordshire, UK.
Chowdhary, B. P., L. Fronicke, I. Gustavsson and H. Scherthan, 1996 Com-parative analysis of the cattle and human genomes: Detection of ZOO-FISH and gene mapping-based chromosomal homologies. Mamm. Genome 7: 297-302.
Churchill, G. A., and R. W. Doerge, 1994 Empirical threshold values for quantita-tive trait mapping. Genetics 138: 963-971.
Clop, A., F. Marcq, H. Takeda, D. Pirottin, X. Tordoir et al, 2006 A mutation creat-ing a potential illegitimate microRNA target site in the myostatin gene affects muscularity in sheep. Nat. Genet. 38: 813-818.
Cohen-Zinder, M., E. Seroussi, D. M. Larkin, J. J. Loor, A. Everts-van der Wind et al, 2005 Identification of a missense mutation in the bovine ABCG2 gene with a major effect on the QTL on chromosome 6 affecting milk yield and composition in holstein cattle. Genome Res. 15: 936-944.
Constantinescu, S. N., L. J. Huang, H. Nam and H. F. Lodish, 2001 The eryth-ropoietin receptor cytosolic juxtamembrane domain contains an essential, precisely oriented, hydrophobic motif. Mol. Cell 7: 377-385.
Curran, J. L., 1997 Human linkage mapping, pp. 1-25 in Genome Mapping : A Practical Approach, edited by P. H. Dear. Oxford University Press, New York.

67
Darvasi, A., 1998 Experimental strategies for the genetic dissection of complex traits in animal models. Nat. Genet. 18: 19-24.
Darvasi, A., and M. Soller, 1995 Advanced intercross lines, an experimental population for fine genetic mapping. Genetics 141: 1199-1207.
de Koning, D. J., N. F. Schulmant, K. Elo, S. Moisio, R. Kinos et al, 2001 Map-ping of multiple quantitative trait loci by simple regression in half-sib designs. J. Anim. Sci. 79: 616-622.
Dekkers, J. C., 2004 Commercial application of marker- and gene-assisted selection in livestock: Strategies and lessons. J. Anim. Sci. 82 E-Suppl: E313-328.
Dekkers, J. C., and F. Hospital, 2002 The use of molecular genetics in the im-provement of agricultural populations. Nat. Rev. Genet. 3: 22-32.
Doerge, R. W., 2002 Mapping and analysis of quantitative trait loci in experi-mental populations. Nat. Rev. Genet. 3: 43-52.
Eggen, A., M. Gautier, A. Billaut, E. Petit, H. Hayes et al, 2001 Construction and characterization of a bovine BAC library with four genome-equivalent cover-age. Genet. Sel. Evol. 33: 543-548.
Everts-van der Wind, A., D. M. Larkin, C. A. Green, J. S. Elliott, C. A. Olmstead et al, 2005 A high-resolution whole-genome cattle-human comparative map reveals details of mammalian chromosome evolution. Proc. Natl. Acad. Sci. U. S. A. 102: 18526-18531.
Everts-van der Wind, A., S. R. Kata, M. R. Band, M. Rebeiz, D. M. Larkin et al, 2004 A 1463 gene cattle-human comparative map with anchor points defined by human genome sequence coordinates. Genome Res. 14: 1424-1437.
Falconer, D. S., and T. F. C. Mackay, 1996 Introduction to Quantitative Genetics. Longman, Harlow.
Farnir, F., B. Grisart, W. Coppieters, J. Riquet, P. Berzi et al, 2002 Simultane-ous mining of linkage and linkage disequilibrium to fine map quantitative trait loci in outbred half-sib pedigrees: Revisiting the location of a quantitative trait locus with major effect on milk production on bovine chromosome 14. Genetics 161: 275-287.
Farnir, F., W. Coppieters, J. J. Arranz, P. Berzi, N. Cambisano et al, 2000 Ex-tensive genome-wide linkage disequilibrium in cattle. Genome Res. 10: 220-227.
Flint, J., and R. Mott, 2001 Finding the molecular basis of quantitative traits: Successes and pitfalls. Nat. Rev. Genet. 2: 437-445.
Frank, S. J., 2001 Growth hormone signalling and its regulation: Preventing too much of a good thing. Growth Horm. IGF Res. 11: 201-212.

68
Freking, B. A., S. K. Murphy, A. A. Wylie, S. J. Rhodes, J. W. Keele et al, 2002 Identification of the single base change causing the callipyge muscle hyper-trophy phenotype, the only known example of polar overdominance in mam-mals. Genome Res. 12: 1496-1506.
Fujiyama, A., H. Watanabe, A. Toyoda, T. D. Taylor, T. Itoh et al, 2002 Construc-tion and analysis of a human-chimpanzee comparative clone map. Science 295: 131-134.
Gallego, M. I., N. Binart, G. W. Robinson, R. Okagaki, K. T. Coschigano et al, 2001 Prolactin, growth hormone, and epidermal growth factor activate Stat5 in different compartments of mammary tissue and exert different and overlap-ping developmental effects. Dev. Biol. 229: 163-175.
Geldermann, H., 1975 Investigations on inheritance of quantitative characters in animals by gene markers I. Theor.Appl.Genet. 46: 319-330.
Georges, M., 2007 Mapping, fine mapping, and molecular dissection of quan-titative trait loci in domestic animals. Annu. Rev. Genomics Hum. Genet. 8: 131-162.
Georges, M., D. Nielsen, M. Mackinnon, A. Mishra, R. Okimoto et al, 1995 Mapping quantitative trait loci controlling milk production in dairy cattle by exploiting progeny testing. Genetics 139: 907-920.
Gertler, A., and J. Djiane, 2002 Mechanism of ruminant placental lactogen action: Molecular and in vivo studies. Mol. Genet. Metab. 75: 189-201.
Glazier, A. M., J. H. Nadeau and T. J. Aitman, 2002 Finding genes that underlie complex traits. Science 298: 2345-2349.
Goddard, M. E., and B. J. Hayes, 2007 Genomic selection. J. Anim. Breed. Genet. 124: 323-330.
Green, P., K. Falls and S. Crooks, 1990 CRI-MAP Documentation Version 2.4 (http://linkage.rockefeller.edu/soft/crimap/).
Gregory, S. G., M. Sekhon, J. Schein, S. Zhao, K. Osoegawa et al, 2002 A physi-cal map of the mouse genome. Nature 418: 743-750.
Grisart, B., F. Farnir, L. Karim, N. Cambisano, J. J. Kim et al, 2004 Genetic and functional confirmation of the causality of the DGAT1 K232A quantitative trait nucleotide in affecting milk yield and composition. Proc. Natl. Acad. Sci. U. S. A. 101: 2398-2403.
Grisart, B., W. Coppieters, F. Farnir, L. Karim, C. Ford et al, 2002 Positional can-didate cloning of a QTL in dairy cattle: Identification of a missense mutation in the bovine DGAT1 gene with major effect on milk yield and composition. Genome Res. 12: 222-231.
Haley, C. S., and L. Andersson, 1997 Linkage mapping of quantitative trait loci in plants and animals, pp. 49-71 in Genome Mapping : A Practical Approach, edited by P. H. Dear. Oxford University Press, New York.

69
Haley, C. S., S. A. Knott and J. M. Elsen, 1994 Mapping quantitative trait loci in crosses between outbred lines using least squares. Genetics 136: 1195-1207.
Hastbacka, J., A. de la Chapelle, I. Kaitila, P. Sistonen, A. Weaver et al, 1992 Linkage disequilibrium mapping in isolated founder populations: Diastrophic dysplasia in finland. Nat. Genet. 2: 204-211.
Hauser, S. D., M. F. McGrath, R. J. Collier and G. G. Krivi, 1990 Cloning and in vivo expression of bovine growth hormone receptor mRNA. Mol. Cell. Endocrinol. 72: 187-200.
Heap, D., R. J. Collier, C. K. Boyd and M. C. Lucy, 1996 Expression of alternate growth hormone receptor messenger RNA in ovary and uterus of cattle. Domest. Anim. Endocrinol. 13: 421-430.
Herman, A., C. Bignon, N. Daniel, J. Grosclaude, A. Gertler et al, 2000 Func-tional heterodimerization of prolactin and growth hormone receptors by ovine placental lactogen. J. Biol. Chem. 275: 6295-6301.
Herrington, J., L. S. Smit, J. Schwartz and C. Carter-Su, 2000 The role of STAT proteins in growth hormone signaling. Oncogene 19: 2585-2597.
Heyen, D. W., J. I. Weller, M. Ron, M. Band, J. E. Beever et al, 1999 A genome scan for QTL influencing milk production and health traits in dairy cattle. Physiol. Genomics 1: 165-175.
Higgs, D. R., W. G. Wood, A. P. Jarman, J. Sharpe, J. Lida et al, 1990 A major positive regulatory region located far upstream of the human alpha-globin gene locus. Genes Dev. 4: 1588-1601.
Holmberg, M., and L. Andersson-Eklund, 2006 Quantitative trait loci affecting fer-tility and calving traits in swedish dairy cattle. J. Dairy Sci. 89: 3664-3671.
Holmberg, M., and L. Andersson-Eklund, 2004 Quantitative trait loci affecting health traits in swedish dairy cattle. J. Dairy Sci. 87: 2653-2659.
Holmberg, M., G. Sahana and L. Andersson-Eklund, 2007 Fine mapping of a quantitative trait locus on chromosome 9 affecting non-return rate in swedish dairy cattle. J. Anim. Breed. Genet. 124: 257-263.
Horseman, N. D., W. Zhao, E. Montecino-Rodriguez, M. Tanaka, K. Nakashima et al, 1997 Defective mammopoiesis, but normal hematopoiesis, in mice with a targeted disruption of the prolactin gene. EMBO J. 16: 6926-6935.
Hurley, W. L., 2007 Lactation Biology Website (http://classes.ansci.uiuc.edu/ansc438/), University of Illinois, Urbana, IL, USA.
Ihara, N., A. Takasuga, K. Mizoshita, H. Takeda, M. Sugimoto et al, 2004 A com-prehensive genetic map of the cattle genome based on 3802 microsatellites. Genome Res. 14: 1987-1998.

70
Itoh, T., T. Watanabe, N. Ihara, P. Mariani, C. W. Beattie et al, 2005 A compre-hensive radiation hybrid map of the bovine genome comprising 5593 loci. Genomics 85: 413-424.
Jann, O. C., J. Aerts, M. Jones, N. Hastings, A. Law et al, 2006 A second gen-eration radiation hybrid map to aid the assembly of the bovine genome se-quence. BMC Genomics 7: 283.
Jiang, H., and M. C. Lucy, 2001 Variants of the 5’-untranslated region of the bovine growth hormone receptor mRNA: Isolation, expression and effects on translational efficiency. Gene 265: 45-53.
Jiang, H., C. S. Okamura and M. C. Lucy, 1999 Isolation and characterization of a novel promoter for the bovine growth hormone receptor gene. J. Biol. Chem. 274: 7893-7900.
Juga, J., 1992 Estimation of Variance Covariance Components in Livestock Populations Under Selection. University of Helsinki, Faculty of Agriculture and Forestry, Department of Animal Science, Helsinki, Finland.
Jungerius, B. J., A. S. van Laere, M. F. Te Pas, B. A. van Oost, L. Andersson et al, 2004 The IGF2-intron3-G3072A substitution explains a major imprinted QTL effect on backfat thickness in a meishan x european white pig intercross. Genet. Res. 84: 95-101.
Kantanen, J., I. Olsaker, L. E. Holm, S. Lien, J. Vilkki et al, 2000 Genetic diver-sity and population structure of 20 north european cattle breeds. J. Hered. 91: 446-457.
Kappes, S. M., J. W. Keele, R. T. Stone, R. A. McGraw, T. S. Sonstegard et al, 1997 A second-generation linkage map of the bovine genome. Genome Res. 7: 235-249.
Kelly, P. A., J. Djiane, M. C. Postel-Vinay and M. Edery, 1991 The prolactin/growth hormone receptor family. Endocr. Rev. 12: 235-251.
Kelly, P. A., A. Bachelot, C. Kedzia, L. Hennighausen, C. J. Ormandy et al, 2002 The role of prolactin and growth hormone in mammary gland development. Mol. Cell. Endocrinol. 197: 127-131.
Khatkar, M. S., P. C. Thomson, I. Tammen and H. W. Raadsma, 2004 Quantita-tive trait loci mapping in dairy cattle: Review and meta-analysis. Genet. Sel. Evol. 36: 163-190.
Khatkar, M. S., P. C. Thomson, I. Tammen, J. A. Cavanagh, F. W. Nicholas et al, 2006a Linkage disequilibrium on chromosome 6 in australian holstein-friesian cattle. Genet. Sel. Evol. 38: 463-477.
Khatkar, M. S., A. Collins, J. A. Cavanagh, R. J. Hawken, M. Hobbs et al, 2006b A first-generation metric linkage disequilibrium map of bovine chromosome 6. Genetics 174: 79-85.

71
Khatkar, M. S., K. R. Zenger, M. Hobbs, R. J. Hawken, J. A. Cavanagh et al, 2007 A primary assembly of a bovine haplotype block map based on a 15,036-sin-gle-nucleotide polymorphism panel genotyped in holstein-friesian cattle. Genetics 176: 763-772.
Klungland, H., A. Sabry, B. Heringstad, H. G. Olsen, L. Gomez-Raya et al, 2001 Quantitative trait loci affecting clinical mastitis and somatic cell count in dairy cattle. Mamm. Genome 12: 837-842.
Knott, S. A., J. M. Elsen and C. S. Haley, 1996 Methods for multiple-marker mapping of quantitative trait loci in half-sib populations. Theor. Appl. Genet. 93: 71-80.
Kollers, S., J. Buitkamp, B. Grisart, M. Georges and R. Fries, 2000 Physical Mapping of Markers and Candidate Genes in a QTL Region on Bovine Chro-mosome 20. Blackwell Publishing, UK, Oxford, UK.
Kuhn, C., J. Bennewitz, N. Reinsch, N. Xu, H. Thomsen et al, 2003 Quantitative trait loci mapping of functional traits in the german holstein cattle population. J. Dairy Sci. 86: 360-368.
Lander, E. S., and D. Botstein, 1989 Mapping mendelian factors underlying quantitative traits using RFLP linkage maps. Genetics 121: 185-199.
Lanning, N. J., and C. Carter-Su, 2006 Recent advances in growth hormone signaling. Rev. Endocr Metab. Disord. 7: 225-235.
Larkin, D. M., A. Everts-van der Wind, M. Rebeiz, P. A. Schweitzer, S. Bachman et al, 2003 A cattle-human comparative map built with cattle BAC-ends and human genome sequence. Genome Res. 13: 1966-1972.
Lipkin, E., M. O. Mosig, A. Darvasi, E. Ezra, A. Shalom et al, 1998 Quantitative trait locus mapping in dairy cattle by means of selective milk DNA pooling using dinucleotide microsatellite markers: Analysis of milk protein percentage. Genetics 149: 1557-1567.
Liu, B. H., 1998 Statistical Genomics: Linkage, Mapping and QTL Analysis. Crc, Boca Raton FL.
Lucy, M. C., C. K. Boyd, A. T. Koenigsfeld and C. S. Okamura, 1998 Expression of somatotropin receptor messenger ribonucleic acid in bovine tissues. J. Dairy Sci. 81: 1889-1895.
Lynch, M., and B. Walsh, 1998 Genetics and Analysis of Quantitative Traits. Sinauer Associates, Sunderland, MA.
Ma, R. Z., J. E. Beever, Y. Da, C. A. Green, I. Russ et al, 1996 A male linkage map of the cattle (bos taurus) genome. J. Hered. 87: 261-271.
Mackay, T. F., 2001a The genetic architecture of quantitative traits. Annu. Rev. Genet. 35: 303-339.

72
Mackay, T. F., 2001b Quantitative trait loci in drosophila. Nat. Rev. Genet. 2: 11-20.
Maj, A., A. Gajewska, M. Pierzchala, K. Kochman and L. Zwierzchowski, 2007 Single base substitution in growth hormone receptor gene influences the receptor density in bovine liver. Neuro Endocrinol. Lett. 28: 401-405.
Mäntysaari, E. A., M. Lidauer, J. Poso, I. Strandén, P. Madsen et al, 2006 Joint Nordic Test Day Model: Variance Components. International Bull Evaluation Service, Uppsala, Sweden.
May, P., C. Gerhartz, B. Heesel, T. Welte, W. Doppler et al, 1996 Comparative study on the phosphotyrosine motifs of different cytokine receptors involved in STAT5 activation. FEBS Lett. 394: 221-226.
McKay, S. D., R. D. Schnabel, B. M. Murdoch, J. Aerts, C. A. Gill et al, 2007 Construction of bovine whole-genome radiation hybrid and linkage maps using high-throughput genotyping. Anim. Genet. 38: 120-125.
Meuwissen, T. H., and M. E. Goddard, 2004 Mapping multiple QTL using linkage disequilibrium and linkage analysis information and multitrait data. Genet. Sel. Evol. 36: 261-279.
Meuwissen, T. H., and M. E. Goddard, 2001 Prediction of identity by descent probabilities from marker-haplotypes. Genet. Sel. Evol. 33: 605-634.
Meuwissen, T. H., and M. E. Goddard, 2000 Fine mapping of quantitative trait loci using linkage disequilibria with closely linked marker loci. Genetics 155: 421-430.
Meuwissen, T. H., B. J. Hayes and M. E. Goddard, 2001 Prediction of total genetic value using genome-wide dense marker maps. Genetics 157: 1819-1829.
Meuwissen, T. H., A. Karlsen, S. Lien, I. Olsaker and M. E. Goddard, 2002 Fine mapping of a quantitative trait locus for twinning rate using combined linkage and linkage disequilibrium mapping. Genetics 161: 373-379.
Moody, D. E., D. Pomp, W. Barendse and J. E. Womack, 1995 Assignment of the growth hormone receptor gene to bovine chromosome 20 using linkage analysis and somatic cell mapping. Anim. Genet. 26: 341-343.
Mosig, M. O., E. Lipkin, G. Khutoreskaya, E. Tchourzyna, M. Soller et al, 2001 A whole genome scan for quantitative trait loci affecting milk protein percent-age in israeli-holstein cattle, by means of selective milk DNA pooling in a daughter design, using an adjusted false discovery rate criterion. Genetics 157: 1683-1698.
Mrode, R. A., and G. J. T. Swanson, 2004 Calculating cow and daughter yield deviations and partitioning of genetic evaluations under a random regression model. Livest. Prod. Sci. 86: 253-260.

73
Neimann-Sorensen, A., and A. Robertson, 1961 The association between blood groups and several production characteristics in three danish cattle breeds. Acta Agric. Scand. 11: 163-196.
Niall, H. D., M. L. Hogan, R. Sauer, I. Y. Rosenblum and F. C. Greenwood, 1971 Sequences of pituitary and placental lactogenic and growth hormones: Evolu-tion from a primordial peptide by gene reduplication. Proc. Natl. Acad. Sci. U. S. A. 68: 866-870.
Noble, M. S., S. Rodriguez-Zas, J. B. Cook, G. T. Bleck, W. L. Hurley et al, 2002 Lactational performance of first-parity transgenic gilts expressing bovine alpha-lactalbumin in their milk. J. Anim. Sci. 80: 1090-1096.
Olsen, H. G., H. Nilsen, B. Hayes, P. R. Berg, M. Svendsen et al, 2007 Genetic support for a quantitative trait nucleotide in the ABCG2 gene affecting milk composition of dairy cattle. BMC Genet. 8: 32.
Olsen, H. G., S. Lien, M. Svendsen, H. Nilsen, A. Roseth et al, 2004 Fine map-ping of milk production QTL on BTA6 by combined linkage and linkage dis-equilibrium analysis. J. Dairy Sci. 87: 690-698.
Olsen, H. G., S. Lien, M. Gautier, H. Nilsen, A. Roseth et al, 2005 Mapping of a milk production quantitative trait locus to a 420-kb region on bovine chromo-some 6. Genetics 169: 275-283.
Olsen, H. G., L. Gomez-Raya, D. I. Vage, I. Olsaker, H. Klungland et al, 2002 A genome scan for quantitative trait loci affecting milk production in norwegian dairy cattle. J. Dairy Sci. 85: 3124-3130.
Ormandy, C. J., A. Camus, J. Barra, D. Damotte, B. Lucas et al, 1997 Null muta-tion of the prolactin receptor gene produces multiple reproductive defects in the mouse. Genes Dev. 11: 167-178.
Plaut, K., D. E. Bauman, N. Agergaard and R. M. Akers, 1987 Effect of exog-enous prolactin administration on lactational performance of dairy cows. Domest. Anim. Endocrinol. 4: 279-290.
Pritchard, J. K., and M. Przeworski, 2001 Linkage disequilibrium in humans: Models and data. Am. J. Hum. Genet. 69: 1-14.
Rexroad, C. E., J. S. Schlapfer, Y. Yang, B. Harlizius and J. E. Womack, 1999 A radiation hybrid map of bovine chromosome one. Anim. Genet. 30: 325-332.
Rexroad, C. E.,3rd, E. K. Owens, J. S. Johnson and J. E. Womack, 2000 A 12,000 rad whole genome radiation hybrid panel for high resolution mapping in cattle: Characterization of the centromeric end of chromosome 1. Anim. Genet. 31: 262-265.
Riquet, J., W. Coppieters, N. Cambisano, J. J. Arranz, P. Berzi et al, 1999 Fine-mapping of quantitative trait loci by identity by descent in outbred populations: Application to milk production in dairy cattle. Proc. Natl. Acad. Sci. U. S. A. 96: 9252-9257.

74
Rodriguez-Zas, S. L., B. R. Southey, D. W. Heyen and H. A. Lewin, 2002 Interval and composite interval mapping of somatic cell score, yield, and components of milk in dairy cattle. J. Dairy Sci. 85: 3081-3091.
Ron, M., and J. I. Weller, 2007 From QTL to QTN identification in livestock--win-ning by points rather than knock-out: A review. Anim. Genet. 38: 429-439.
Sahana, G., D. J. de Koning, B. Guldbrandtsen, P. Sorensen and M. S. Lund, 2006 The efficiency of mapping of quantitative trait loci using cofactor analy-sis in half-sib design. Genet. Sel. Evol. 38: 167-182.
Sahana, G., M. S. Lund, L. Andersson-Eklund, N. Hastings, A. Fernandez et al, 2008 Fine-mapping QTL for mastitis resistance on BTA9 in three nordic red cattle breeds. Anim. Genet.
Schnabel, R. D., J. J. Kim, M. S. Ashwell, T. S. Sonstegard, C. P. Van Tassell et al, 2005 Fine-mapping milk production quantitative trait loci on BTA6: Analysis of the bovine osteopontin gene. Proc. Natl. Acad. Sci. U. S. A. 102: 6896-6901.
Schrooten, C., H. Bovenhuis, W. Coppieters and J. A. Van Arendonk, 2000 Whole genome scan to detect quantitative trait loci for conformation and functional traits in dairy cattle. J. Dairy Sci. 83: 795-806.
Schulman, N. F., G. Sahana, M. S. Lund, S. M. Viitala and J. H. Vilkki, 2008 Quantitative trait loci for fertility traits in finnish ayrshire cattle. Genet. Sel. Evol. 40: 195-214.
Schulman, N. F., S. M. Viitala, D. J. de Koning, J. Virta, A. Maki-Tanila et al, 2004 Quantitative trait loci for health traits in finnish ayrshire cattle. J. Dairy Sci. 87: 443-449.
Seaton, G., C. S. Haley, S. A. Knott, M. Kearsey and P. M. Visscher, 2002 QTL express: Mapping quantitative trait loci in simple and complex pedigrees. Bioinformatics 18: 339-340.
Sejrsen, K., J. Foldager, M. T. Sorensen, R. M. Akers and D. E. Bauman, 1986 Effect of exogenous bovine somatotropin on pubertal mammary development in heifers. J. Dairy Sci. 69: 1528-1535.
Sinowatz, F., D. Schams, S. Kolle, A. Plath, D. Lincoln et al, 2000 Cellular locali-sation of GH receptor in the bovine mammary gland during mammogenesis, lactation and involution. J. Endocrinol. 166: 503-510.
Smit, L. S., D. J. Meyer, N. Billestrup, G. Norstedt, J. Schwartz et al, 1996 The role of the growth hormone (GH) receptor and JAK1 and JAK2 kinases in the activation of stats 1, 3, and 5 by GH. Mol. Endocrinol. 10: 519-533.
Smit, M., K. Segers, L. G. Carrascosa, T. Shay, F. Baraldi et al, 2003 Mosaicism of solid gold supports the causality of a noncoding A-to-G transition in the determinism of the callipyge phenotype. Genetics 163: 453-456.

75
Snelling, W. M., E. Casas, R. T. Stone, J. W. Keele, G. P. Harhay et al, 2005 Linkage mapping bovine EST-based SNP. BMC Genomics 6: 74.
Snelling, W. M., R. Chiu, J. E. Schein, M. Hobbs, C. A. Abbey et al, 2007 A physi-cal map of the bovine genome. Genome Biol. 8: R165.
Solinas-Toldo, S., C. Lengauer and R. Fries, 1995 Comparative genome map of human and cattle. Genomics 27: 489-496.
Spelman, R. J., W. Coppieters, L. Karim, J. A. van Arendonk and H. Boven-huis, 1996 Quantitative trait loci analysis for five milk production traits on chromosome six in the dutch holstein-friesian population. Genetics 144: 1799-1808.
Stinnakre, M. G., J. L. Vilotte, S. Soulier and J. C. Mercier, 1994 Creation and phenotypic analysis of alpha-lactalbumin-deficient mice. Proc. Natl. Acad. Sci. U. S. A. 91: 6544-6548.
Taberlet, P., A. Valentini, H. R. Rezaei, S. Naderi, F. Pompanon et al, 2008 Are cattle, sheep, and goats endangered species? Mol. Ecol. 17: 275-284.
Vaiman, D., 2005 DNA sequence of the human and other mammalian genomes in Mammalian Genomics, edited by A. Ruvinsky and J. A. Marshall Graves. CABI Publishing, Oxfordshire, UK.
Varvio, S. L., T. Iso-Touru, J. Kantanen, S. Viitala, I. Tapio et al, 2008 Molecular anatomy of the cytoplasmic domain of bovine growth hormone receptor, a quantitative trait locus. Proc. Biol. Sci. 275: 1525-1534.
Velmala, R., J. Vilkki, K. Elo and A. Maki-Tanila, 1995 Casein haplotypes and their association with milk production traits in the finnish ayrshire cattle. Anim. Genet. 26: 419-425.
Vilkki, H. J., D. J. de Koning, K. Elo, R. Velmala and A. Maki-Tanila, 1997 Multiple marker mapping of quantitative trait loci of finnish dairy cattle by regression. J. Dairy Sci. 80: 198-204.
Visscher, P. M., R. Thompson and C. S. Haley, 1996 Confidence intervals in QTL mapping by bootstrapping. Genetics 143: 1013-1020.
Wang, X., C. J. Darus, B. C. Xu and J. J. Kopchick, 1996 Identification of growth hormone receptor (GHR) tyrosine residues required for GHR phosphorylation and JAK2 and STAT5 activation. Mol. Endocrinol. 10: 1249-1260.
Warren, W., T. P. Smith, C. E. Rexroad 3rd, S. C. Fahrenkrug, T. Allison et al, 2000 Construction and characterization of a new bovine bacterial artificial chromosome library with 10 genome-equivalent coverage. Mamm. Genome 11: 662-663.
Weber, J. L., and P. E. May, 1989 Abundant class of human DNA polymorphisms which can be typed using the polymerase chain reaction. Am. J. Hum. Genet. 44: 388-396.

76
Weller, J. I., Y. Kashi and M. Soller, 1990 Power of daughter and granddaughter designs for determining linkage between marker loci and quantitative trait loci in dairy cattle. J. Dairy Sci. 73: 2525-2537.
Williams, J. L., A. Eggen, L. Ferretti, C. J. Farr, M. Gautier et al, 2002 A bovine whole-genome radiation hybrid panel and outline map. Mamm. Genome 13: 469-474.
Winter, A., W. Kramer, F. A. Werner, S. Kollers, S. Kata et al, 2002 Associa-tion of a lysine-232/alanine polymorphism in a bovine gene encoding acyl-CoA:Diacylglycerol acyltransferase (DGAT1) with variation at a quantita-tive trait locus for milk fat content. Proc. Natl. Acad. Sci. U. S. A. 99: 9300-9305.
Womack, J. E., and Y. D. Moll, 1986 Gene map of the cow: Conservation of linkage with mouse and man. J. Hered. 77: 2-7.
Womack, J. E., J. S. Johnson, E. K. Owens, C. E. Rexroad 3rd, J. Schlapfer et al, 1997 A whole-genome radiation hybrid panel for bovine gene mapping. Mamm. Genome 8: 854-856.
Yang, J., B. Zhao, V. E. Baracos and J. J. Kennelly, 2005 Effects of bovine somatotropin on beta-casein mRNA levels in mammary tissue of lactating cows. J. Dairy Sci. 88: 2806-2812.
Yang, N., X. Wang, J. Jiang and S. J. Frank, 2007 Role of the growth hormone (GH) receptor transmembrane domain in receptor predimerization and GH-induced activation. Mol. Endocrinol. 21: 1642-1655.
Yang, N., J. F. Langenheim, X. Wang, J. Jiang, W. Y. Chen et al, 2008 Activa-tion of growth hormone receptors by growth hormone and growth hormone antagonist dimers: Insights into receptor triggering. Mol. Endocrinol. 22: 978-988.
Zhang, Q., D. Boichard, I. Hoeschele, C. Ernst, A. Eggen et al, 1998 Mapping quantitative trait loci for milk production and health of dairy cattle in a large outbred pedigree. Genetics 149: 1959-1973.
Zhou, Y., and H. Jiang, 2006 Short communication: A milk trait-associated poly-morphism in the bovine growth hormone receptor gene does not affect recep-tor signaling. J. Dairy Sci. 89: 1761-1764.
Zhou, Y., R. M. Akers and H. Jiang, 2008 Growth hormone can induce expres-sion of four major milk protein genes in transfected MAC-T cells. J. Dairy Sci. 91: 100-108.

Agrifood Research Reports 133 Agrifood Research Reports 133
Sirja Viitala
133 Identification of genes controlling milk production in dairy cattle. Doctoral Dissertation
Animal Production
Identification of genes controlling milk production in dairy cattle
Doctoral Dissertation