Embed Size (px)
Citation preview

Identification and Characterization of
Regulators of 2-Cys-Peroxiredoxin A in
Arabidopsis thaliana
Inaugural-Dissertation
to obtain the academic degree
Doctor rerum naturalium (Dr. rer. nat.)
submitted to the Department of Biology, Chemistry and Pharmacy
of Freie Universität Berlin
by
Wei Guo
from Hohhot (China)
Berlin, 2013

The investigations described in the following thesis were started under supervision of
Prof. Dr. Margarete Baier at the Institute of Plant Sciences of the Heirich-Heine
University Düsseldorf (09.2008- 11.2010) and continued after moving of the group at
the Institute of Biology, department of Plant Physiology of the Freie Universität Berlin
(12.2010-08.2013).
1st Reviewer: Prof. Dr. Magarete Baier
2nd Reviewer: Prof. Dr. Wolfgang Schuster
Date of defence: __24.10.2013________

Table of contents
I
Table of contents
TABLE OF CONTENTS.................................................................................................................... I
SUMMARY ...................................................................................................................................... V
LIST OF ABBREVIATIONS .......................................................................................................... VII
1 INTRODUCTION ...................................................................................................................... 1
1.1 COMMUNICATION BETWEEN NUCLEUS AND ORGANELLES ....................................................... 1
1.1.1 From endosymbionts to organelles ..................................................................................... 1
1.1.2 Communication between plastids and nucleus ................................................................. 1
1.2 RETROGRADE SIGNALING FROM CHLOROPLAST TO NUCLEUS ................................................. 2
1.2.1 Reactive Oxygen Species (ROS) ........................................................................................ 4
1.2.2 Redox state of the components in the photosynthetic electron transport chain ........... 7
1.2.3 Tetrapyrrole biosythesis........................................................................................................ 9
1.2.4 Phosphoadenosine phosphate (PAP) .............................................................................. 11
1.2.5 Plastid gene expression...................................................................................................... 12
1.2.6 Proteins moving between plastids and nucleus .............................................................. 14
1.2.7 Methylerythritolcyclodiphosphate (MEcPP) ..................................................................... 14
1.3 ANTIOXIDANT SYSTEM IN CHLOROPLAST ............................................................................. 15
1.3.1 Non-enzymatic antioxidants ............................................................................................... 15
1.3.2 Enzymatic antioxidants in chloroplasts ............................................................................. 16
1.4 TRANSCRIPTIONAL REGULATION OF THE CHLOROPLAST ANTIOXIDANT ENZYMES ................... 19
1.4.1 Different responses of different chloroplast antioxidant enzymes to abiotic
stresses ..................................................................................................................... 20
1.4.2 Transcription factor of sAPx in Arabidopsis ..................................................................... 20
1.4.3 Regulation of GPx1 and GPx7 expression in Arabidopsis ............................................ 21
1.4.4 Regulation of 2-Cys-PrxA (2CPA) ..................................................................................... 21
1.5 AIM OF THIS STUDY ........................................................................................................... 24
2 MATERIAL AND METHODS ................................................................................................. 25
2.1 PLANT MATERIALS ............................................................................................................. 25
2.2 GROWTH CONDITIONS ....................................................................................................... 25
2.2.1 Sterilization and vernalization of Arabidopsis thaliana seeds ....................................... 25
2.2.2 Growth of Arabidopsis thaliana seedlings on sterile MS medium ................................ 26
2.2.3 Growth of Arabidopsis thaliana plants on soil ................................................................. 26
2.2.4 Short-day and Long-day growing condition ..................................................................... 27
2.3 CROSSING OF ARABIDOPSIS THALIANA PLANTS .................................................................. 27
2.4 CO-SEGREGATION ANALYSIS ............................................................................................. 27
2.5 PHENOTYPE ANALYSIS OF THE PLANTS ............................................................................... 28
2.6 DETERMINATION OF LUCIFERASE ACTIVITY IN VIVO .............................................................. 28

Table of contents
II
2.6.1 Measurement with Fluoskan Ascent FL luminometer .................................................... 28
2.6.2 Measurement with NightSHADE LB 985 in vivo plant imaging system ....................... 28
2.7 AGAROSE GEL ELECTROPHORESIS ..................................................................................... 29
2.7.1 DNA Gelelectrophoresis ..................................................................................................... 29
2.7.2 RNA Gelelectrophoresis ..................................................................................................... 29
2.8 DNA ISOLATION ................................................................................................................ 30
2.8.1 Isolation of genomic DNA ................................................................................................... 30
2.8.2 Isolation of nuclei DNA for Illumina sequencing .............................................................. 31
2.8.3 Testing the quality of isolated DNA ................................................................................... 32
2.9 RNA ISOLATION ................................................................................................................ 33
2.9.1 Isolation of RNA from the plant material .......................................................................... 33
2.9.2 Testing the quality of isolated RNA ................................................................................... 33
2.10 POLYMERASE CHAIN REACTION (PCR) ............................................................................... 33
2.10.1 Standard PCR ...................................................................................................................... 34
2.10.2 PCR with OptiTaq ................................................................................................................ 34
2.11 SEQUENCING OF PCR FRAGMENTS AND PLASMIDS ............................................................. 35
2.11.1 Sequencing of PCR fragments .......................................................................................... 35
2.11.2 Sequencing of Plasmids ..................................................................................................... 35
2.11.3 Sequence analysis .............................................................................................................. 36
2.12 SEQUENCING WITH ILLUMINA SYSTEM ................................................................................ 36
2.13 GENE EXPRESSION ANALYSIS ............................................................................................ 37
2.14 FIRST STRAND CDNA SYNTHESIS ...................................................................................... 37
2.14.1 Expression Analysis ............................................................................................................ 37
2.15 GENETIC MAPPING OF MUTANT LOCI WITH SINGLE SEQUENCE LENGTH POLYMORPHISMS
(SSLP) ............................................................................................................................ 40
2.15.1 Determination of individuals with mutant alleles from the segregating
F2 population ........................................................................................................................ 40
2.15.2 SSLPs markers design using Cereon database ............................................................. 40
2.15.3 Mapping analysis of the mutant loci with SSLPs markers ............................................. 41
2.16 GENETIC MAPPING OF MUTANT LOCI WITH NEXT GENERATION SEQUENCING .......................... 41
2.16.1 Analysis of the sequencing results of Illumina sequencing ShoreMap ........................ 42
2.16.2 Confirmation of the final candidate locus ......................................................................... 42
2.17 GENOTYPING AND ISOLATION OF HOMOZYGOUS T-DNA INSERTION LINES BY PCR ............... 42
2.18 ESCHERICHIA COLI MANIPULATIONS ................................................................................... 43
2.18.1 Generation of chemically competent E. coli .................................................................... 43
2.18.2 Plasmid transformation into E.coli ..................................................................................... 44
2.19 PLASMID MANIPULATION .................................................................................................... 44
2.19.1 Purification of PCR products from agarose gel ............................................................... 44
2.19.2 Cloning into entry vector (PCR8/GW/TOPO) .................................................................. 44
2.19.3 Confirmation of the insertion with colony PCR ................................................................ 45
2.19.4 Isolation of plasmids using miniprep kits .......................................................................... 46
2.19.5 LR reaction ........................................................................................................................... 46
2.20 AGROBACTERIUM TUMEFACIENS MANIPULATIONS ............................................................... 48

Table of contents
III
2.20.1 Production of competent A. tumefaciens cells ................................................................ 48
2.20.2 Transformation of A. tumefaciens ..................................................................................... 49
2.21 COMPARISON AND ANALYSIS OF PROMOTERS IN PLANTS ..................................................... 49
2.21.1 Analysis of the promoter sequences in Col-0 and Ler ................................................... 49
2.21.2 Transient gene expression ................................................................................................. 49
2.22 METAL-CONTENT ANALYSIS ............................................................................................... 51
2.23 COEXPRESSION ANALYSIS AND FUNCTION PREDICTION........................................................ 51
2.24 ANALYSIS OF AMINO ACID SEQUENCES AND PROTEIN STRUCTURES ...................................... 52
3 RESULTS ............................................................................................................................... 53
3.1 PHENOTYPIC CHARACTERIZATION OF RIMB3 AND RIMB6 MUTANTS ....................................... 53
3.1.1 Growth habits of the mutants ............................................................................................. 53
3.1.2 Analysis of reporter gene (luciferase) expression........................................................... 58
3.2 IDENTIFICATION AND CHARACTERIZATION OF MUTANT RIMB6 ............................................... 61
3.2.1 The contents of mineral elements in rimb6 and T19-2 ................................................... 61
3.2.2 Genetic mapping of rimb6 with next generation sequencing ........................................ 62
3.2.3 Confirmation of the final candidate locus of RIMB6 by transcription analysis using
T-DNA knock-out line .......................................................................................................... 67
3.2.4 At4g12560, the final candidate locus for RIMB6 ............................................................. 67
3.2.5 RIMB6 might be correlated with plasma metal transporters AtIRT1 and AtPDR8 ..... 68
3.3 AN EQTL OF 2CPA REGULATOR BETWEEN COL-0 AND LER WAS IDENTIFIED ON TOP ARM
OF CHROMOSOME III .......................................................................................................... 69
3.3.1 Genetic mapping of the rimb3 mutation with SSLP markers ........................................ 69
3.3.2 An eQTL of 2CPA was identified based on Ler genetic background ........................... 70
3.3.3 Confirmation of the eQTL ................................................................................................... 71
3.3.4 Genetic mapping of the eQTL with SSLP ........................................................................ 72
3.3.5 Transcription analysis of the candidate genes of the eQTL using T-DNA
knock-out line ....................................................................................................................... 75
3.3.6 Natural variation of At3g21660 between Col-0 and Ler ................................................. 76
3.3.7 Prediction of protein At3g21660 with Conserved Domain Database of NCBI ............ 78
3.3.8 At3g21660 positively regulates the 2CPA and 2CPB .................................................... 79
3.3.9 Test for the polymorphism in promoter of Col-0 and Ler ............................................... 80
3.3.10 Prediction of the function network of At3g21660 ............................................................ 81
3.3.11 Coexpression analysis of Ubox protein with CDC48, PUX2 and 2CPA ...................... 82
3.3.12 The eQTL and RIMB6 might be correlated via ASK9 and ASK16 ............................... 86
3.4 IDENTIFICATION AND CHARACTERIZATION OF MUTANT RIMB3 ............................................... 90
3.4.1 Co-segregation analysis of low luciferase and chlorosis phenotype ........................... 90
3.4.2 Genetic mapping of rimb3 with next generation sequencing ........................................ 91
3.4.3 One step sequencing with Illumina G2 Analyzer ............................................................ 92
3.4.4 Transcript abundance analysis of RIMB3 and 2CPA ..................................................... 96
3.4.5 Coexpression analysis of RIMB3 and RIMB1 (RCD1) ................................................... 97
3.4.6 Coexpression analysis of RIMB3 and ATCDC48 ......................................................... 101
4 DISCUSSION ....................................................................................................................... 102
4.1 GENETIC MAPPING OF LOCI RIMB3, RIMB6 AND THE EQTL OF 2CPA .............................. 102
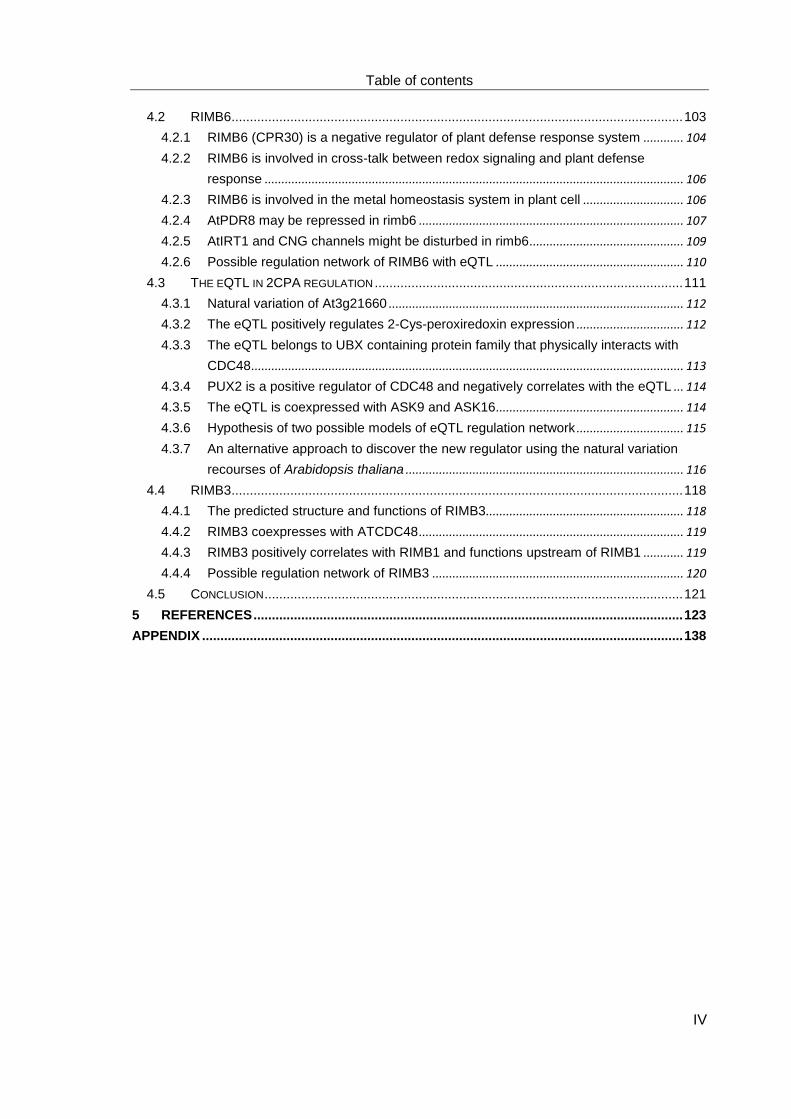
Table of contents
IV
4.2 RIMB6........................................................................................................................... 103
4.2.1 RIMB6 (CPR30) is a negative regulator of plant defense response system ............ 104
4.2.2 RIMB6 is involved in cross-talk between redox signaling and plant defense
response ............................................................................................................................. 106
4.2.3 RIMB6 is involved in the metal homeostasis system in plant cell .............................. 106
4.2.4 AtPDR8 may be repressed in rimb6 ............................................................................... 107
4.2.5 AtIRT1 and CNG channels might be disturbed in rimb6 .............................................. 109
4.2.6 Possible regulation network of RIMB6 with eQTL ........................................................ 110
4.3 THE EQTL IN 2CPA REGULATION .................................................................................... 111
4.3.1 Natural variation of At3g21660 ........................................................................................ 112
4.3.2 The eQTL positively regulates 2-Cys-peroxiredoxin expression ................................ 112
4.3.3 The eQTL belongs to UBX containing protein family that physically interacts with
CDC48 ................................................................................................................................. 113
4.3.4 PUX2 is a positive regulator of CDC48 and negatively correlates with the eQTL ... 114
4.3.5 The eQTL is coexpressed with ASK9 and ASK16 ........................................................ 114
4.3.6 Hypothesis of two possible models of eQTL regulation network ................................ 115
4.3.7 An alternative approach to discover the new regulator using the natural variation
recourses of Arabidopsis thaliana ................................................................................... 116
4.4 RIMB3........................................................................................................................... 118
4.4.1 The predicted structure and functions of RIMB3........................................................... 118
4.4.2 RIMB3 coexpresses with ATCDC48 ............................................................................... 119
4.4.3 RIMB3 positively correlates with RIMB1 and functions upstream of RIMB1 ............ 119
4.4.4 Possible regulation network of RIMB3 ........................................................................... 120
4.5 CONCLUSION .................................................................................................................. 121
5 REFERENCES ..................................................................................................................... 123
APPENDIX ................................................................................................................................... 138

Summary
V
Summary
In this project, retrograde redox signaling from chloroplasts to the nucleus was studied
by identifying and characterizing regulators of 2-Cys-Peroxiredoxin A transcription in
Arabidopsis thaliana. The redox imbalanced mutants (rimb) were used to identify 2CPA
regulators. The mutant loci rimb3 and rimb6 were mapped in the Arabidopsis genome by
next generation sequencing and characterized. In addition, a 2CPA expression’s QTL
(eQTL) was identified with SSLP markers based on the genetic variation of Arabidopsis
accessions Col-0 and Ler.
RIMB3 (At4g01290) is a PAT1 domain containing protein which coexpresses with
RIMB1 and CDC48. It may function in a pathway upstream of RIMB1. RIMB3 may acti-
vate 2CPA expression directly or via Rap2.4a or CDC48 in a development-dependent
manner.
RIMB6 is identified as an F-Box containing protein (At4g12560), which negatively regu-
lates the plant defense system by constitutive repression of PR and SCN1 genes.
RIMB6 may activate 2CPA expression by repression of an unknown negative regulator
of 2CPA. Furthermore RIMB6 is also involved in regulatory system of metal homeostasis,
in which metal channels and/or transporters are regulated.
The eQTL (At3g21660) was determined as an UBX containing protein, which may physi-
cally interact with CDC48. The eQTL positively regulates expression of 2CPA and 2CPB.
It is proposed that it acts via CDC48 and an unknown positive regulator of 2CPA down-
stream of CDC48. The eQTL coexpresses with ASK9 and ASK16, which physically in-
teract with RIMB6.
The three different 2CPA regulators play important roles in the network of redox retro-
grade signaling pathway from chloroplast to nucleus. Their regulatory mechanism could
further contribute to the understanding of cross-talk between retrograde signaling, ubiq-
uitination, plant defense responses and metal homeostasis in plant cells.

Summary
VI
Zusammenfassung
Im Rahmen dieses Projektes wurde die retrograde Signaltranduktion vom Chloroplasten
zum Zellkern untersucht, und zwar anhand der Identifizierung und Charakterisierung der
Regulatoren von 2-Cys-Peroxiredoxin A (2CPA) in Arabidopsis thaliana. Es wurden Mu-
tanten mit gestörten Redoxsystem Kontrollen (redox imbalanced, rimb) genutzt, um die
Regulatoren von 2CPA zu bestimmen. Die mutierten Gen loci rimb3 und rimb6 wurden
mittels Hochdurchsatzsequenzierung (Next Generation Sequencing) im Genom von
Arabidopsis kartiert. Anschließend wurden diese beiden Genloci charakterisiert. Darüber
hinaus wurde ein sogenannter expressional quantitative trait locus (eQTL) identifiziert,
womit ein Genlocus gemeint ist, welcher Veränderungen der Expression von Genen
bedingt, in diesem Fall die Expression von 2CPA. Die Identifizierung dieses eQTLs ge-
lang mit Hilfe von SSLP Markern basierend auf der genetischen Variation der Arabidop-
sis-Akzessionen Col-0 und Ler.
Bei RIMB3 (At4g01290) handelt es sich um ein Gen, das für ein Protein mit einer PAT1
Domäne kodiert. Es co-expremiert mit RIMB1 und CDC48. RIMB3 aktiviert die Expressi-
on von 2CPA, entweder direkt, über Rap2.4a oder über CDC48.
Das Gen RIMB6 (At4g12560) kodiert für ein Protein mit einer F-Box. Es reguliert auf
negative Weise das Abwehrsystem der Pflanze durch konstitutive Repression von PR
Genen und SCN1. Es wird postuliert, dass RIMB6 die Expression von 2CPA aktiviert
indem es einen bisher unbekannten negativen Regulator von 2CPA repremiert. Außer-
dem ist RIMB6 auch in das Regulationssystem der Metall-homöostase involviert.
Der eQTL At3g21660 kodiert hingegen für ein Protein, das eine UBX Domäne enthält.
Es könnte mit CDC48 interagieren. Der eQTL reguliert positiv die Expression von 2CPA
und 2CPB, wahrscheinlich über CDC48 und einem bisher unbekanntem positiven Regu-
lator von 2CPA, der unterhalb von CDC48 agiert. Außerdem co-expremiert der eQTL mit
ASK9 und ASK16, die wiederum mit RIMB6 interagieren.
Die drei unterschiedlichen 2CPA Regulatoren spielen eine wichtige Rolle im Netzwerk
des redoxbedingten retrograden Signalwegs vom Chloroplasten zum Zellkern. Die Un-
tersuchung ihres regulatorischen Mechanismus könnte das Verständnis über das Zu-
sammenspiel von retrograder Signalweiterleitung, Ubiquitinierung, Pflanzen-Abwehr-
Antworten und Metall-Homöostase in Pflanzenzellen erweitern.

List of abbreviations
VII
List of abbreviations
1O2 singlet oxygen
A.tumefaciens Agrobacterium tumefaciens
aa amino acids
ABC ATP-binding cassette
Apx ascorbate peroxidase
ARE antioxidant response ele-
ments
ASK binding Arabidopsis-S-phase
kinase-associated protein-like
proteins
At Arabidopsis thaliana
bp base pairs
CAB nuclear genes encoding
LHCP
CaLCuV cabbage leaf curl virus
CBF C-repeat/DRE binding factor
CDC cell division control protein
CDD Conserved Domains Data-
base
cDNA complementary DNA
CDS Cu/ZnSODs
CEO1 Clone Eighty One1 (= RCD1)
Chl chlorophyll
CNG channels cyclic nucleotide-gated ion
channels
Col-0 Arabidopsis thaliana ecotype
Columbia-0
cpCK2(PTK) a chloroplast-targeted protein
closely related to the α-
subunit of nucleocytosolic ca-
sein kinase 2
CPR30 constitutive expresser of PR
genes 30
cps counts per second
Csd copper/zinc superoxide dis-
mutase
Ct cycle threshold
Cul cullin
DBMIB 2,5,-dibromo-3-methyl-6-
isopropyl-p-benzoquinone
DCMU 3’-4’-dichlorphenyl-1,1-
dimethyl urea
DNA deoxyribonucleic acid
dNTPs deoxyribonucleotid triphos-
phates
DREB dehydration responsive ele-
ment binding factor
E. coli Escherichia coli
EDS1 Enhanced Disease Suscepti-
bility1
EDTA ethylene diamine-N tetra
acetid acid
ELIP2 early light-induced proteins
EMS ethyl methanesulfonate
eQTL expression quantitative locus
EX1 EXECUTER1
eyc Saccharomyces cerevisiae
Shp1, Drosophila melano-
gaster eyes closed gene
FLN fructokinase-like proteins
FSD FeSOD
GDA geldanamycin
GLK Golden 2-like1 and 2
GRx glutaredoxin
gun genome uncoupled
GUS β-glucuronidase
H2O2 hydrogen peroxide
HO· hydroxyl radicals
HPL hydroperoxide lyase
HSP geldanamycin
ICP-MS inductively coupled plasma
mass spectrometry
IRT1 Iron-Regulated Transporter -1
JA jasmonic acid
kb kilo base pairs
LB left borde

List of abbreviations
LB medium Lysogeny broth medium
Ler Arabidopsis thaliana acces-
sion Landsberg erecta
Luc luciferase
LHCB light-harvesting chlorophyll-
a/b proteins
m micro
M molar
MEcPP Methylerythritolcyclo-
diphosphate
MeJA methyl jasmonate
MEP methylerythritol phosphate
MES monohydrate 2-(Nmorpholino)
ethanesulfonic acid
Mg-ProtoIX Mg-protoporphyrin IX
MOS4 MODIFIER OF snc1-4
mRNA messenger RNA
MS Murashige & Skoog
MSD MnSOD
mTERF mitochondrial transcription
termination factor
n nano
na ribonucleic acid
NADPH Nicotinamide Adenine Dinu-
cleotide Phosphate
NDR1 non race-specific disease
resistance 1
NLRs nucleotide-binding domain
and leucine-rich repeats con-
taining proteins
NTC/MAS nineteen Complex
O2· superoxide anions
OD optical density
P. Syringae Pseudomonas syringae
p2CPA promoter of 2CPA
PAD4 phytoalexin deficient 4
PAP 3'-phosphoadenosine 5'-
phosphate
PAT1 topoisomerase II-associated
protein
Pchlide protochlorophyllide
PCR polymerase chain reaction
PEP plastid-encoded RNA poly-
merase
PETC photosynthetic electron
transport chain
PGE plastid gene expression
PhANGs photosynthesis-associated
nuclear genes
PHD plant homeodomain
PPR pentatricopeptide-repeat
PQ plastoquinone pool
PRIN2 PLASTID REDOX INSENSI-
TIVE 2
PRL1 PLEIOTROPIC RESPONSE
LOCUS 1
PS photosystem
psbA a gene encoding the D1 pro-
tein of PS II
psaAB a gene encoding reaction
centre apoproteins of PS I
PTK/cpCK2 plastid transcription kinase
PUX plant UBX-domain containing
proteins
R disease resistance
RB right border
RbohD respiratory burst oxidase
homolog D
Rbx1 RING-box protein 1
RNA ribonucleic acid
ROS reactive oxygen species
SA salicylic acid
SCF SKP1-CULLIN1-F-box
SDS sodium dodecyl sulfate
SEM standard error of mean
SIG Sigma factor
SKP1 S-phase kinase-associated
protein 1
SNP single nucleotide polymor-
phism
SOD superoxide dismutases
VIII

List of abbreviations
X
soldat Singlet oxygen-linked death
activators
SSLP simple sequence length pol-
ymorphism
TA annealing temperature
TAC transcriptionally active chro-
mosome
TAE tris acetic acid EDTA
Taq Thermus aquaticus
TE tris EDTA
Tm melting temperature
Tris tris(hydroxymethyl)-
aminomethane
TRx thioredoxin
TRXz plastidial thioredoxin z
U unit
UTR untranslated region
v/v volume per volume
w/v weight per volume
YEB yeast extract and beef
ZIP Zrt/Irt-like protein
Amino acids and nucleic acids were abbreviated according to recommendations given by the
IUPAC-IUB Joint Commission on Biochemical Nomenclature (JCBN).
IX

Introduction
1
1 Introduction
1.1 Communication between nucleus and organelles
Cells are the basic units of life. They are highly organized systems, in which communica-
tion and coordination of nucleus and organelles are crucial to maintain all the processes.
1.1.1 From endosymbionts to organelles
Present-day plants have evolved over a billion years ago through endosymbiosis of free-
living bacteria (Guttman and Vitetta, 1967). It is believed that, the early mitochondrial
and chloroplast ancestor arose from proteobacteria and cyanobacterias, respectively
(Dyall et al., 2004). Nowadays organelles contain several thousand proteins. However
over 90% of the organelle proteins, which are encoded in the nucleus, are subsequently
synthesized in the cytoplasm, and are further translocated into the organelles (Richly
and Leister, 2004).
1.1.2 Communication between plastids and nucleus
Due to the difference of encoding location and function locations of most of the orga-
nelles proteins and gene expression needs to be synchronized between the nucleus and
the organelles by intracellular communication processes (Adams et al., 1990;
Abuharbeid et al., 2004). Intracellular signaling can be classified to anterograde signal-
ing and retrograde signaling, which represent signaling from the nucleus to the organelle
and the organelle to the nucleus, respectively (Figure 1-1).

Introduction
2
Figure 1-1 Schematics of anterograde and retrograde signaling in plant cells. Signals per-
ceived / generated by the nucleus are communicated to the organelles and lead to changes in the
transcription pattern of the organelles in process known as anterograde signaling as indicated by
the blue line. Conversely, the signal generated in the organelles is transduced to the nucleus to
cause necessary changes in the transcription of nuclear genes in a processed called retrograde
signaling as shown by the blue line.
Since nucleus and organelles have their own independent genomes, they have to com-
municate closely. Signals perceived by the nucleus are communicated to the chloro-
plasts to adjust gene expression to the stimuli in a process designated anterograde sig-
naling (Pesaresi et al., 2007; Woodson and Chory, 2008). As a result of various biotic
and abiotic stresses, cues originated from chloroplast should be transmitted to the nu-
cleus to affect its expression pattern, in a process, which is called retrograde signaling
(Rodermel, 2001).
1.2 Retrograde signaling from chloroplast to nucleus
After the early chloroplast ancestors successfully established themselves as a perma-
nent endosymbiont, most of the genetic information was transferred to the nucleus, mak-
ing it the master regulator. The genome of present-day chloroplasts encode only around
hundred proteins (Green, 2011). However, the number of proteins found to be present in
the chloroplast by far exceeds the coding capacity of the chloroplast. Therefore, proteins
Introduction
3
encoded in the nucleus, have to be processed in the cytosol and subsequently imported
into the chloroplast. In this process, the retrograde signaling from chloroplast to nucleus
plays a crucial role. Up to now, various signaling pathways have been identified in the
chloroplast-to-nucleus retrograde signaling network (Figure 2-2).
Figure 2-2 Schematic depiction of the various retrograde signaling from chloroplast to
nucleus. (1) ROS signals such as hydrogen peroxide and singlet oxygen. Singlet oxygen is
communicated to nucleus to effect changes in the expression pattern via EX1, EX2 and
SOLDATs as mediators. (2) Redox signals generated in the chloroplast are also communicated to
the nucleus through RIMB and STN genes. (3) Tetrapyrrole biosynthesis regulated by GUN
genes is indicated to be involved in the chloroplast retrograde signaling. (4) Phosphoadenosine
phosphate (PAP) is shown to traverse the membrane to serve as a retrograde signal. (5) Several
plastid gene expression (PEG) changes are communicated to the nucleus. (6) Proteins such as
Whirly1 and PHD move across the membrane to transduce signals generated in the chloroplast.
(7) Methylerythritolcyclodiphosphate (MEcPP) was suggested to be involved in chloroplast retro-
grade signaling.
Introduction
4
1.2.1 Reactive Oxygen Species (ROS)
In plant cells, reactive oxygen species can be accumulated in high amounts, when the
plants are exposed to biotic (Doke, 1985) and abiotic stress (Karpinski et al., 1997) and
during developmental stages (Pena-Ahumada et al., 2006). If the production of ROS is
enhanced, it leads to global changes in gene expression (Vranova et al., 2002), which
finally may help cells to avoid irreversible damage to biomolecules (Apel and Hirt, 2004).
Although coping with ROS is a priority to avoid its oxidative damage to proteins, DNA,
and lipids (Halliwell B, 1989), ROS function as signaling molecules initiating acclimation
reactions (Desikan et al., 1998; Mittler et al., 2004)
1.2.1.1 Generation of the ROS
As organelles like chloroplasts, mitochondria and peroxisomes are involved in high en-
ergy metabolic flux, various environmental stresses perturb the process which leads to
the accumulation of ROS.
In plant cells four main forms of ROS can be found: singlet oxygen (1O2), superoxide
anions (O2·), hydrogen peroxide (H2O2), hydroxyl radicals (HO·) (Elstner, 1991). In chlo-
roplasts, 1O2 is generated by PSII. It consequently leads to formation of O2· and HO· in
presence of water (Elstner, 1991). Most O2· is formed at PSI in the Mehler reaction due
to excess light energy. It is spontaneously and enzymatically disproportionated into O2
and H2O2 (Mehler, 1951; Asada, 2000).
1.2.1.2 The roles of ROS in plants under biotic and abiotic stresses and
plant development
Being recognized initially as toxic products in the plant cells (Halliwell B, 1989), ROS in
high concentration are rapidly removed by various cellular enzymatic and nonenzymatic
mechanisms (Apel and Hirt, 2004). However, ROS also function as regulators of many
biological processes, such as growth, the cell cycle, programmed cell death, hormone

Introduction
5
signaling, responses to biotic and abiotic stress, and development (Galvez-Valdivieso
and Mullineaux, 2010; Nanda et al., 2010; Swanson and Gilroy, 2010; Suzuki and Mittler,
2012)
ROS generation has been identified in many plant-pathogen interactions involving viru-
lent bacteria, fungi, and viruses (Low and Merida, 1996). ROS have been determined to
play a key role in establishing plant defense responses (Levine et al., 1994; Doke et al.,
1996; Apel and Hirt, 2004). ROS accumulation precedes the hypersensitive response
(HR) cell death, which accompanies pathogen recognition and leads to the incompatible
interaction (Levine et al., 1994; Mehdy, 1994).
ROS also play an important role in the different symbiotic interactions: the regulation and
the involvement of ROS were reported in Legume – Rhizobia symbiotic relations (Santos
et al., 2001; Ramu et al., 2002) and during the establishment of both endo- and ectomy-
corrhiza (Fester and Hause, 2005; Baptista et al., 2007).
In response to different abiotic stress factors such as high light, low temperature, high
temperature, water deficiency, and mechanical stress the ROS production is induced in
chloroplast and mitochondria (Apel and Hirt, 2004). The ROS play an important role in to
maintaining normal energy and metabolic fluxes and in optimizing different cell functions
(Suzuki et al., 2012). Thereby it activates acclimation responses through retrograde sig-
naling, and further controls whole-plant systemic signaling pathways (Suzuki et al., 2012)
In addition, ROS, particularly O2• and H2O2, can act as second messengers in signal
transduction cascades during cellular growth and control stomata closing (Pei et al.,
2000) as well as programmed cell death (Gechev and Hille, 2005). Furthermore, ROS
may play a general role in root developmental regulation (Foreman et al., 2003). Differ-
ent from Ca2+ signaling, ROS signaling is not controlled by messenger storage and re-
lease, but by production and scavenging (Mittler et al., 2004).

Introduction
6
1.2.1.3 H2O2 as chloroplast retrograde signal
H2O2 produced in chloroplast plays a role in chloroplast retrograde signaling (Maruta et
al., 2012). By moving across biological membranes (Bienert et al., 2006), the low con-
centrated H2O2 still can directly influence the functions of cytosolic signaling components
and trigger retrograde signaling from chloroplasts to nucleus, especially in response to
stress (Mittler et al., 2011; Maruta et al., 2012). Recently, many studies focused on the
mechanism by which the plant cell can recognize the origin of a specific ROS signal and
trigger the appropriate responses (Moller and Sweetlove, 2010).
It is reported that the apoplastic ROS-producing enzyme NADPH oxidase RbohD re-
sponds to chloroplast redox signals and cell death (Torres et al., 2006). The Arabidopsis
Enhanced Disease Susceptibility1 (EDS1) is determined to process H2O2 signal to pro-
duce counter-balancing activities of salicylic acid (SA) (Wiermer et al., 2005; Straus et
al., 2010) .
In the response of plants exposed to excess light, H2O2 locally controls of the expression
of APX2 and thereby plays a role in intracellular signaling and as an initial signal for the
propagation of systemic responses to a wide range of stress conditions (Karpinski et al.,
1999; Mullineaux and Karpinski, 2002).
Furthermore, in the response of plants exposed to low temperature, H2O2 signaling is
identified to control the feedback regulation of cold acclimation by C-repeat/DRE binding
factor (CBF1)/DREB1B (Maruta et al., 2012).
1.2.1.4 1O2 as chloroplast retrograde signal and flu mutant
Since 1O2 is has a very short half-life (200 ns) (Gorman and Rodgers, 1992). It is sug-
gested that the singlet oxygen derived plastid signal must exit the chloroplast via second
messengers. The conditional fluorescent mutant, flu, of Arabidopsis was generated to
discover the messengers (Meskauskiene et al., 2001). The flu mutant displays an over-

Introduction
7
accumulation of protochlorophyllide (Pchlide) in the dark. The mutant produces an oxida-
tive bust of 1O2, if the mutant is transferred into light.
Through a screening for flu suppressor mutants, two plastid-localized proteins EXE-
CUTER1 (EX1) and EXECUTER2 (EX2) are identified (Wagner et al., 2004). EX1 and
EX2 are suggested to process the 1O2 derived plastid signal to the nucleus (Lee et al.,
2007).
Singlet oxygen-linked death activators (soldat) were also identified by screening for flu
suppressor mutants, where 1O2-dependent cell death was abolished without affecting
protochlorophyllide accumulation (Baruah et al., 2009; Coll et al., 2009; Meskauskiene et
al., 2009). The SOLDAT8 was identified as the sigma factor 6 (SIG6) subunit of the plas-
tid-encoded RNA polymerase (PEP) (Coll et al., 2009) while SOLDAT10 was determined
as a plastid-localized protein related to the human mitochondrial transcription termination
factor mTERF (Pei et al., 2000). However, the two SOLDAs look like general compo-
nents essential for chloroplast function but not signaling components specifically in-
volved in the 1O2-triggered signaling (Pei et al., 2000).
In addition, the PLEIOTROPIC RESPONSE LOCUS 1 (PRL1) was identified by screen-
ing for novel regulatory components of the 1O2-responsive AAA-ATPase promoter in the
flu background (Baruah et al., 2009). PRL1 plays a role in plant innate immunity re-
sponse against pathogens and was identified as a component of the conserved proteo-
lytic NTC/MAS complex together with CDC5 and MOS4 (Palma et al., 2007; Monaghan
et al., 2009).
1.2.2 Redox state of the components in the photosynthetic electron
transport chain
The redox state of the photosynthetic electron transport chain (PETC) is the link be-
tween photosynthetic light reactions and metabolism. It fluctuates under varying light

Introduction
8
intensity and quality and triggers signals to nucleus (Woodson and Chory, 2008). Two
sources of retrograde redox signals from chloroplast to nucleus have been proposed in
the past 20 years: the redox state of the plastoquinone pool (PQ) (Escoubas et al., 1995)
and the photosystem I (PSI) acceptor site (Baier et al., 2004). The redox state of the PQ
pool correlates with the expression of the plastid encoded genes psaAB and psbA,
which functions in anterograde signaling (Pfannschmidt et al., 2001; Pfannschmidt,
2003). Several studies demonstrated that the redox retrograde signal is complex signal-
ing network, which is more than the simple switch between oxidized and reduced PQ
pool (Brautigam et al., 2009).
1.2.2.1 STN7
STN7, a thylakoid protein kinase, has been identified to be involved the redox signaling
network and regulation of photosynthetic acclimation (Bellafiore et al., 2005). STN7 is an
important element in the regulation of state transition in PSII and PSI, in which STN7
phosphorylates the major photosynthetic light harvesting proteins. In the mutant stn7,
acclimation to changes in light quality is defective, suggesting that STN7 involves in me-
diating redox signal from chloroplast to nucleus (Bonardi et al., 2005). However, as
demonstrated by the expressional analysis, stn7 and wild type plant did not have any
significant disparity in the transcript abundance of photosynthetic genes. STN7 is there-
fore determined not to affect the transcripts of Arabidopsis photosynthesis-associated
nuclear genes (PhANGs) (Pesaresi et al., 2011). Recently, it was reported that the STN7
functions in chloroplast-to-nucleus retrograde signaling by regulating thylakoid mem-
brane redox balance, which mediates signals reprogramming the hormonal network that
operates at all levels of cellular metabolism in the plant cell, via jasmonic acid (JA) and
through direct interaction (Tikkanen et al., 2012) .

Introduction
9
1.2.2.2 Regulators of 2CPA
In term of the redox state of the PSI acceptor site, the antioxidant enzyme 2-Cys-
peroxiredoxin A (2CPA) has been studied widely to understand chloroplast redox signal-
ing (Baier et al., 2004). The transcription of the 2CPA is proven to be under control of the
PETC and it is also independent from the PQ state signals (Baier et al., 2004). A correla-
tion was confirmed between activity of 2CPA promoter and the electron pressure on the
acceptor site of photosystem I (Baier et al., 2004). Thus, the regulators of the 2CPA
could function as the redox signals from chloroplast to nucleus.
1.2.3 Tetrapyrrole biosythesis
Tetrapyrroles have been studied widely in the past 20 years and hypothesized as retro-
grade signals from chloroplast to nucleus (Susek et al., 1993; Woodson et al., 2011;
Kindgren et al., 2012a). In Arabidopsis thaliana chlorophyll, heme, siroheme and phyto-
chromobilin are the four tetrapyrrole molecule forms, which are synthesized via a com-
mon branched pathway in plastids. Their synthesis in the plant cell is tightly regulated. It
was shown that expression of photosynthesis-associated nuclear genes was affected by
perturbations in the tetrapyrrole pathway (Susek et al., 1993).
To study the communication between chloroplasts and the nucleus, the mutants genome
uncoupled (gun) were isolated by their elevated expression of CAB-GUS in the presence
of norflurazon, and they were widely applied to study chloroplast retrograde signaling in
background of the tetrapyrrole biosynthesis (Susek et al., 1993). Under photooxidation
caused by norflurazon treatment, the mutants express photosynthesis-associated nucle-
ar genes (PhANGs) while wild type plants showed strong suppression of photosynthetic
gene expression (Susek et al., 1993). GUN1 was identified as a chloroplast localized
pentatricopeptide-repeat (PPR) containing unknown function protein, which mediates the
impaired plastid gene expression (PGE) to the nucleus (Susek et al., 1993) and GUN2-
GUN6 encode components of tetrapyrrole biosynthesis (Vinti et al., 2000). The gun mu-
Introduction
10
tants provided strong evidence that the tetrapyrroles are involved in retrograde signaling
from the chloroplast to the nucleus in plants.
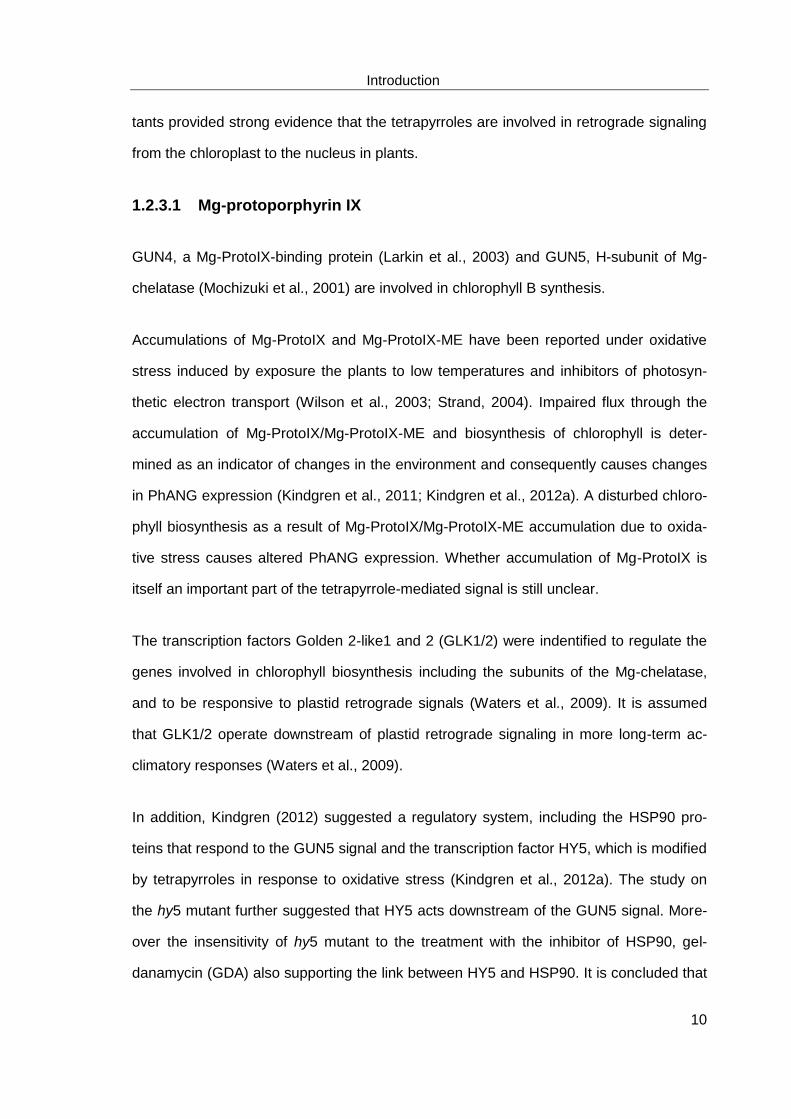
1.2.3.1 Mg-protoporphyrin IX
GUN4, a Mg-ProtoIX-binding protein (Larkin et al., 2003) and GUN5, H-subunit of Mg-
chelatase (Mochizuki et al., 2001) are involved in chlorophyll B synthesis.
Accumulations of Mg-ProtoIX and Mg-ProtoIX-ME have been reported under oxidative
stress induced by exposure the plants to low temperatures and inhibitors of photosyn-
thetic electron transport (Wilson et al., 2003; Strand, 2004). Impaired flux through the
accumulation of Mg-ProtoIX/Mg-ProtoIX-ME and biosynthesis of chlorophyll is deter-
mined as an indicator of changes in the environment and consequently causes changes
in PhANG expression (Kindgren et al., 2011; Kindgren et al., 2012a). A disturbed chloro-
phyll biosynthesis as a result of Mg-ProtoIX/Mg-ProtoIX-ME accumulation due to oxida-
tive stress causes altered PhANG expression. Whether accumulation of Mg-ProtoIX is
itself an important part of the tetrapyrrole-mediated signal is still unclear.
The transcription factors Golden 2-like1 and 2 (GLK1/2) were indentified to regulate the
genes involved in chlorophyll biosynthesis including the subunits of the Mg-chelatase,
and to be responsive to plastid retrograde signals (Waters et al., 2009). It is assumed
that GLK1/2 operate downstream of plastid retrograde signaling in more long-term ac-
climatory responses (Waters et al., 2009).
In addition, Kindgren (2012) suggested a regulatory system, including the HSP90 pro-
teins that respond to the GUN5 signal and the transcription factor HY5, which is modified
by tetrapyrroles in response to oxidative stress (Kindgren et al., 2012a). The study on
the hy5 mutant further suggested that HY5 acts downstream of the GUN5 signal. More-
over the insensitivity of hy5 mutant to the treatment with the inhibitor of HSP90, gel-
danamycin (GDA) also supporting the link between HY5 and HSP90. It is concluded that

Introduction
11
HSP90 and HY5 could be two additional components in the GUN5 pathway (Kindgren et
al., 2012a).
1.2.3.2 Heme
In animal and yeast cells, accumulation of the heme has been reported to regulate gene
expression (Forsburg and Guarente, 1989; Qi et al., 1999; Zhang and Hach, 1999;
Ogawa et al., 2001). In Chlamydomonas reinhardtii feeding with heme demonstrated
global changes in the gene expression and ca. 1000 genes significantly changed their
expression level. Heme is therefore suggested to act as retrograde signal from chloro-
plast to nucleus (Voss et al., 2011).
Recently, a new gun mutant, gun6-1D, has been identified. It displays a similar pheno-
type to the gun2–gun5 mutants with high PhANG expression compared to wild type
when grown on MS with norflurazon. The GUN6-1D encodes plastid ferrochelatase 1
(FC1, heme synthase). The analysis suggested that the protein contributes to a specific
pool of heme which may act as a retrograde signal and that is responsible for the regula-
tion of PhANG expression (Woodson et al., 2011).
In addition, Mg-ProtoIX and heme are cytotoxic. To play a role in signaling from chloro-
plast to nucleus, they must be emitted from chloroplast to the cytosol. An Arabidopsis
tryptophan-rich sensory protein (At-TSPO) was recently identified to bind and scavenge
porphyrin during plants stress. It is suggested that the membrane associated protein
may play a role in heme trafficking and signaling during plastid development (Vanhee et
al., 2011).
1.2.4 Phosphoadenosine phosphate (PAP)
Recently, a phosphonucleotide (3'-phosphoadenosine 5'-phosphate, PAP) was proposed
to be a novel chloroplast retrograde signal (Estavillo et al., 2011). Under drought or ex-

Introduction
12
posure to excess light PAP accumulates in chloroplasts and acts as a mobile signal al-
tering RNA metabolism by inhibiting a 5' to 3' exoribonucleases. PAP was shown to in-
duce stress-induced genes such as APX2 and ELIP2 (Estavillo et al., 2011). The level of
PAP is regulated by a phosphatase SAL1 dephosphorylating PAP to AMP (Quintero et
al., 1996). In a response to oxidative stress caused by high light and drought, PAP
transmits the signal from chloroplast to nucleus. It was proven that PAP is able to move
between cellular compartments as substrate of SAL1. A SAL1-PAP retrograde pathway
is conclusively proposed to alter nuclear gene expression during HL and drought stress
(Estavillo et al., 2011).
1.2.5 Plastid gene expression
Plastid gene expression (PGE) is essential for the initiation of PhANG expression
(Koussevitzky, 2007). Regulation of PGE could be involved in chloroplast retrograde
signaling. GUN1, for instance, can mediate the impaired plastid gene expression to the
nucleus (Susek et al., 1993). PEP-dependent plastid gene expression is strong effected
by photosynthetic activity. Redox signals from the thylakoid membrane are suggested to
link to plastid gene expression via complex networks of phosphorylation events (Steiner
et al., 2009).
1.2.5.1 SIGMA FACTOR (SIG)
Reversible phosphorylation of sigma factors is proven to influence PGE activity in vivo.
The activity of SIG1 is modulated by the redox signature of the chloroplast, which in turn
affects the expression of psaA gene (Shimizu et al., 2010). It is suggested that the sen-
sor kinase CSK links photosynthetic activity to SIG1 phosphorylation and expression of
photosynthesis genes in the chloroplasts. Furthermore, SIG6 was identified as a sub-
strate of the plastid transcription kinase cpCK2 (PTK/cpCK2) through a mutant screening
in background of flu mutant SIG5 was recently determined to controls circadian rhythms
of transcription of several chloroplast genes (Noordally et al., 2013). By SIG5 pathway,

Introduction
13
the nuclear-encoded circadian oscillator controls rhythms of chloroplast gene expres-
sion. It has been shown that SIG5 transduces light signals to the circadian regulation of
plastid genes (Shimizu et al., 2010).
1.2.5.2 Plastidial thioredoxin z and fructokinase-like proteins
A plastidial thioredoxin z (TRXz) was recently determined as one of the components of
the transcriptionally active chromosome (TAC) from chloroplasts (Arsova et al., 2010).
The TRXz was suggested to be involved in the redox regulation of PEP activity during
dark-to-light transition (Arsova et al., 2010; Schroter et al., 2010). Moreover, 2 fructoki-
nase-like proteins (FLN1 and FLN2) were identified as potential TRX z target proteins. It
is shown that the FLN2 redox state changes in vivo during light/dark transitions mediated
by TRXz. Kindgren (2012) reported that the activity of PEP is correlated with the redox
regulation of nuclear encoded photosynthesis genes (Kindgren et al., 2012b). Due to the
important role of TRXz in the regulation of PEP-dependent transcription in chloroplasts
(Arsova et al., 2010), the TRXz was suggested to be responsive to photosynthetic elec-
tron transport and further trigger a retrograde signaling, which regulates expression of
nuclear encoded photosynthesis genes (Arsova et al., 2010),.
1.2.5.3 PRIN2
The PLASTID REDOX INSENSITIVE 2 (PRIN2) was also identified as a chloroplast
component involved in redox-mediated retrograde signaling. In mutants prin2-1 and
prin2-2, regulation of PhANGs was disturbed in response to excess light, and photosyn-
thetic electron transport was inhibited. The prin2 mutant is characterized by having a
radiation sensitive phenotype. LHCB1.1 and LHCB2.4 are misregulated in the mutant,
indicating that fully functional PEP complex is required in the correct expression of
LHCB, in response to redox fluctuation in photosynthetic electron transportation
(Kindgren et al., 2012b). The high irradiance-sensitive phenotype with significant pho-
toinactivation of PSII in prin2 suggested that PRIN2 is a part of the PEP machinery. The

Introduction
14
PEP complex is assumed to respond to photosynthetic electron transport and generate a
retrograde signal from chloroplast to nucleus (Kindgren et al., 2012b).
1.2.6 Proteins moving between plastids and nucleus
Recently, a chloroplast outer membrane-bound plant homeodomain (PHD) transcription
factor named PTM was identified to mediate chloroplast signals, which regulates
PhANGs (Sun et al., 2011). The PTM contains transmembrane domains a DNA-binding
homeobox domain, a different transcription factors (DDT) domain (reviewed in Doerks et
al., 2001) and a plant homeodomain (PHD) in its N-terminal and four transmembrane
domains in the C-terminal (Sun et al., 2011). It is suggested that PTM functions as a
stress sensor in the chloroplast outer envelope membrane. After a proteolytic mecha-
nism is activated by a GUN1-mediated response, the N-terminal part of the protein N-
PTM is released and travels to nucleus as a retrograde signal, which induces ABI4 tran-
scription factor (Strand et al., 2012).
Furthermore, Whirly1, which is dually located in nucleus and chloroplast, was deter-
mined to be able to move from chloroplast to nucleus, proven by a HA-Whirly1 fusion
protein (Isemer et al., 2012). The Whirly1 was identified to modulate the expression of
PR1 gene. In chloroplast Whirly1 plays a role in RNA metabolism (Melonek et al., 2010),
while it regulates transcription of stress responsive genes the nucleus. It is assumed that
Whirly1 acts as a plastid retrograde signal. However, the factor, which triggers the retro-
grade movement, is up to now still unclear (Isemer et al., 2012).
1.2.7 Methylerythritolcyclodiphosphate (MEcPP)
Methylerythritolcyclodiphosphate (MEcPP) was suggested to be able to elicit the expres-
sion of selected genes which mediate stress response, and are encoded in nucleus but
targeted to chloroplast, for instance hydroperoxide lyase (HPL) (Xiao et al., 2012).
MEcPP is a precursor of isoprenoids produced by the plastidial methylerythritol phos-
Introduction
15
phate (MEP) pathway. Abiotic stresses elevate MEcPP levels, inducing the expression
of the stress responsive genes. It was suggested that MEP perceives stress cues and
orchestrate the expression of stress responsive genes by regulating the levels of MEcPP
(Xiao et al., 2012).
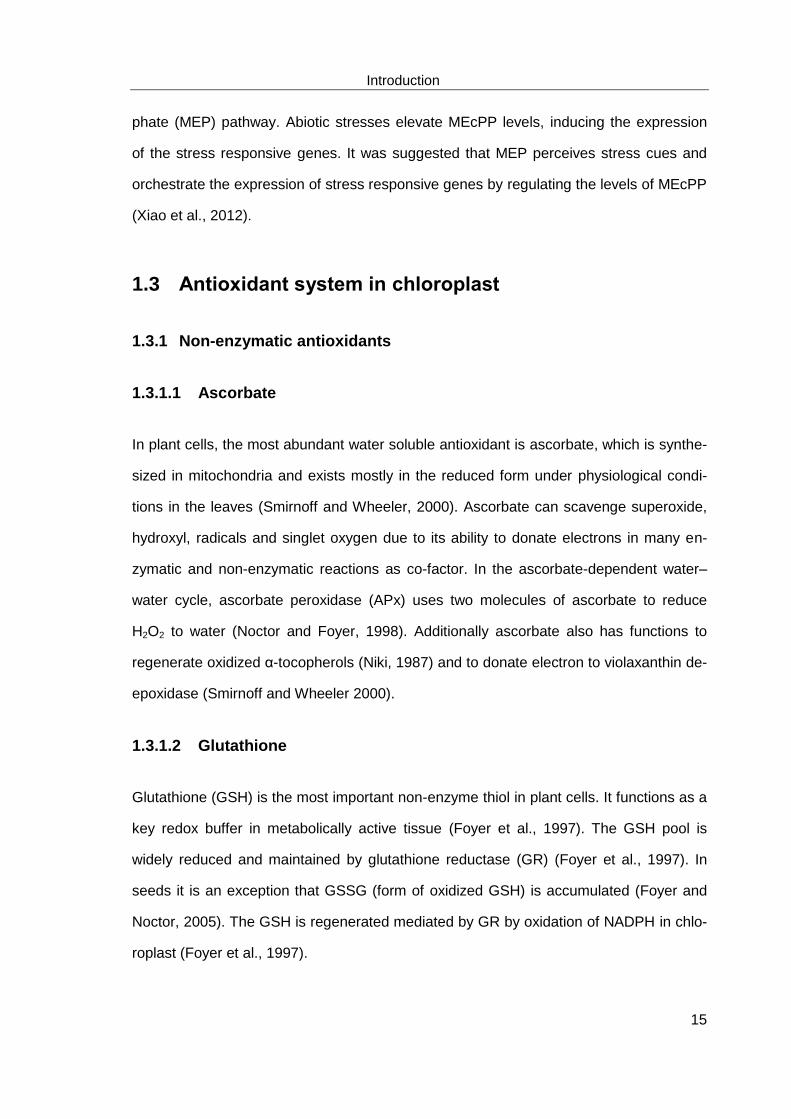
1.3 Antioxidant system in chloroplast
1.3.1 Non-enzymatic antioxidants
1.3.1.1 Ascorbate
In plant cells, the most abundant water soluble antioxidant is ascorbate, which is synthe-
sized in mitochondria and exists mostly in the reduced form under physiological condi-
tions in the leaves (Smirnoff and Wheeler, 2000). Ascorbate can scavenge superoxide,
hydroxyl, radicals and singlet oxygen due to its ability to donate electrons in many en-
zymatic and non-enzymatic reactions as co-factor. In the ascorbate-dependent water–
water cycle, ascorbate peroxidase (APx) uses two molecules of ascorbate to reduce
H2O2 to water (Noctor and Foyer, 1998). Additionally ascorbate also has functions to
regenerate oxidized α-tocopherols (Niki, 1987) and to donate electron to violaxanthin de-
epoxidase (Smirnoff and Wheeler 2000).
1.3.1.2 Glutathione
Glutathione (GSH) is the most important non-enzyme thiol in plant cells. It functions as a
key redox buffer in metabolically active tissue (Foyer et al., 1997). The GSH pool is
widely reduced and maintained by glutathione reductase (GR) (Foyer et al., 1997). In
seeds it is an exception that GSSG (form of oxidized GSH) is accumulated (Foyer and
Noctor, 2005). The GSH is regenerated mediated by GR by oxidation of NADPH in chlo-
roplast (Foyer et al., 1997).

Introduction
16
1.3.1.3 Carotenoids
Carotenoids are another type of low molecular weight antioxidants. They function as a
light harvesting pigment in photoautotrophic organisms (Bouvier et al., 2005). In chloro-
plasts most carotenoids are located in thylakoid membranes, together with chlorophylls
in functional pigment-binding proteins (Demmig-Adams et al., 1996). Carotenoid can
scavenge free radicals, for instance 1O2 and therefore plays important roles in photopro-
tection (Mittler et al., 2004, Bouvier et al., 2005).
1.3.1.4 α-Tocopherol
The antioxidant α-tocopherol is located in the chloroplast envelope, thylakoid mem-
branes and in plastoglobuli (Munne-Bosch, 2005). α-tocopherol scavenges ROS, espe-
cially 1O2 and OH• and thereby plays an important role to protect the membranes. α-
tocopherol is synthesized in higher plants, algae and some cyanobacterias (Munne-
Bosch et al., 2003; Kruk et al., 2005; Munne-Bosch, 2005). To detoxify ROS, α-
tocopherol is oxidized by reversible one-electron oxidation to an α-tocopheryl radical
anion (Foyer and Noctor, 2000, 2003) or by 1O2 (Stratton and Liebler, 1997). α-
tocopherol is subsequently regenerated via α-tocopheryl-hydroquinone by ascorbate
oxidation (Munne-Bosch, 2005).
1.3.2 Enzymatic antioxidants in chloroplasts
Apart from low molecular weight antioxidants, in plant cells the enzymatic antioxidants
also play an important role in detoxification of the ROS. The O2•− generated at photosys-
tem I is rapidly dismutated to H2O2 and O2 by superoxide dismutase (SOD) (Asada,
1999). The H2O2 is subsequently detoxified and reduced to water by ascorbate peroxi-
dase (APx), peroxiredoxins (Prx), or glutathione peroxidase (GPx). Detoxifying H2O2 to
water in plants can be achieved in the ascorbate-dependent (Halliwell-Foyer- Asada cy-

Introduction
17
cle) (Asada, 1999) or ascorbate-independent water–water cycles (Figure 1-2) (Mccord
and Fridovic.I, 1969).
1.3.2.1 Superoxide dismutases (SOD)
In the chloroplast antioxidant system, SOD is an important antioxidant enzyme to detoxi-
fy O2•− generated in the Mehler reaction at PSI. In Arabidopsis thaliana SOD can be
classified in to 3 isoenzymes, which contain different metal cofactors and are located in
different cell compartments (Bowler et al., 1992). The Cu/ZnSOD1 (CSD1) is located in
the cytosol, while the CSD2 can be found in the chloroplast, and (CSD3) in the peroxi-
some. MnSOD (MSD1) is located in the mitochondria and three FeSODs (FSD1, FSD2
and FSD3) are located in the chloroplast (Kliebenstein et al., 1998).
1.3.2.2 Ascorbate Peroxidases and enzymes of the Halliwell-Asada-Cycle
In Arabidopsis thaliana ascorbate peroxidases (APxs) are located in various cell com-
partments. While thylakoid-bound APx (tAPx) is located at thylakoid membrane in chlo-
roplasts (Shigeoka et al., 2002), stromal APx (sAPx) can be found both in mitochondria
and plastids (Chew et al., 2003).
In the ascorbate-dependent water-water cycle, also known as Halliwell-Asada-Cycle,
APx reduces H2O2 to H2O through an ascorbate regeneration system (Asada, 1999)
(Figure 1-3). Scavenging H2O2 to H2O by APx is achieved by oxidation of ascorbate to
monodehydroascorbate (MDHA), which can be regenerated by monodehydroascorbate
reductase (MDHAR) using NAD(P)H as a reducing agent. MDHA can also spontaneous-
ly disproportionate to ascorbate and dehydroascorbate (DHA), which is reduced again to
ascorbate mediated by dehydroascorbate reducatase (DHAR).

Introduction
18
Figure 1-3: A schematics of ascorbate-dependent water–water cycle and ascorbate-
independent water–water cycle in chloroplasts of Arabidopsis thaliana chloroplasts. O2•−
generated by excess excitation of electrons or various stress condition is dismutated to H2O2 by
SOD, and H2O2 is subsequently reduced to H2O by ascorbate-dependent (sAPx and tAPx) and
ascorbate-independent (via Prx and Gpx) water–water cycle.
1.3.2.3 Peroxiredoxins, glutathione peroxidases and ascorbate-
independent water–water cycles
In plant cells, peroxiredoxins (Prxs) belongs to the superfamily of peroxidases. Different
from APx, but similar to GPx, the H2O2 reducing catalytic activity of Prx is due to their
conserved cysteine residues (Chae et al., 1994). The first Prx in plant, 2-Cys Prxs (thio-
specific antioxidant), was firstly identified from Hordeum vulgare as a homologue of ani-
mal and fungal thioredoxin-dependent peroxide reductases and bacterial alkyl hydroper-
oxide reductases (Baier and Dietz, 1996). In Arabidopsis thaliana and most other organ-
isms, Prx can be found in four forms: 1-Cys-Prx (Stacy et al., 1999), 2-Cys-Prx (2-Cys-
PrxA, 2-Cys-PrxB) (Baier and Dietz, 1997; Horling et al., 2001), type II Prx (Hofmann et
al., 2002) and PrxQ (Jeong et al., 2000; Rouhier et al., 2004; Lamkemeyer et al., 2006).
1-Cys-Prx is located in the cytosol or the nucleus (Stacy et al., 1999), whereas 2-Cys-
Prx and PrxQ are chloroplastic and five different PrxIIs are located in cytosol, chloroplast

Introduction
19
and mitochondria (Horling et al., 2001). By forming an intra- or inter-molecular dithiol, Prx
detoxify H2O2 to water. By thiol-disulfide-reactions Prx is subsequently regenerated using
small thiols, such as thioredoxins (TRx), glutaredoxins, and glutathione as electron do-
nors (Baier and Dietz, 1997). In the APx knockdown Arabidopsis lines the expression of
Prx is induced, indicating a complementary mechanism of APx and Prx in the plant cells,
if the plant cell faces insufficient antioxidant protection in chloroplast (Kangasjarvi et al.,
2008).
Glutathione peroxidases (GPxs) are localized in the cytosol, chloroplasts, mitochondria
and the endoplasmatic reticulum (Mullineaux et al., 1998; Rodriguez Milla et al., 2003;
Yang et al., 2006). The GPx reduces H2O2 to water via thiols, which act as reducing
equivalents. In Arabidopsis thaliana chloroplast, GPx has two isoforms: GPx1 and GPx7,
while GPx2 and GPx4 are located in cytocol, GPx3 in mitochondria, GPx6 in both cyto-
sol and mitochondria and GPx5 can be found in the endoplasmic reticulum (Rodriguez
Milla et al., 2003).
In the ascorbate-independent water-water-cycle (Figure 1-3), the detoxification of H2O2 to
water is catalyzed by GPx or Prx. In this reaction cycle, small thiols are subsequently
used as electron donors to regenerate the GPx or Prx (Baier and Dietz, 1999).
1.4 Transcriptional regulation of the chloroplast
antioxidant enzymes
The transcriptional regulation of the chloroplast antioxidant system is a complex network,
in which tight coordination of different signaling and metabolic pathways is required be-
tween nucleus and chloroplast. In general, the genes encoding chloroplast antioxidant
enzymes are less sensitive and they respond slower than cytosolic antioxidant enzymes
in response to most stress treatments (Baier et al., 2010).

Introduction
20
1.4.1 Different responses of different chloroplast antioxidant enzymes to
abiotic stresses
The transcript levels of the chloroplast antioxidant enzymes are differently responsive to
most environmental stimuli, according to array experiments (Kilian et al., 2007; Baier et
al., 2010). Csd2, for example, was only induced by UV-B light, and DHAR2 expression
was up-regulated in response to oxidative stress, UV-B light and osmotic stress as well.
Transcript level of GPx7 was exceptionally responsive to cold treatment and UV-B stress
after 24 h. It increased transiently 6.22-fold and 10.59-fold, respectively after the treat-
ments. Furthermore, under 24 h treatments of osmotic and salt stresses, transcripts of
almost all genes encoding chloroplast antioxidant enzymes were decreased, indicating
continuous suppression of signaling under osmotic and salt stress during the long term
treatments. However, the transcript levels were kept balanced under treatments with
cold, heat, methyl viologen (oxidative stress) and wounding during the first 6h, but in-
creased afterwards up to 12 h of treatment and then decreased (Baier et al., 2010). In
addition, under cold stress GPx1 and GPx7 expression levels were strongly increased,
while expression of Fsd1 and sAPx were slightly induced. Fsd1 and sAPx showed a
slow response to stress, in which their expressions were induced after 12 h under all
four stresses (Baier et al., 2010).
Strong increase of the transcript levels of the chloroplast antioxidant enzymes is difficult
to induce (Baier et al., 2010). One example is 2CPA, whose expression was slightly in-
duced in response to oxidative stress (Baier and Dietz, 1997; Baier et al., 2004), where-
as it strongly decreased under antioxidants treatment (Horling et al., 2003; Nanda et al.,
2010).
1.4.2 Transcription factor of sAPx in Arabidopsis
Recently, a transcription factor of sAPx, designated ANAC089, was identified by yeast-
one-hybrid screening on the upstream sequence of sAPx start codon (Klein et al., 2012).

Introduction
21
The ANAC089 binds to the region of -1262 to -1646 bp upstream of the start codon of
sAPx, and suppresses expression of sAPx under a highly reducing condition. The tran-
scription factor, which is located to the trans-Golgi network and the ER, is released un-
der reducing treatment and targeted to the nucleus and further regulate the chloroplast
antioxidant system (Klein et al., 2012).
1.4.3 Regulation of GPx1 and GPx7 expression in Arabidopsis
The expression of GPx1 is enhanced specifically in response to the combined treatment
of cold and light, though the GPx1 transcript level is not significantly changed under cold
treatment in the dark (Soitamo et al., 2008). The Arabidopsis GPx1 is homologous to
Lotus GPx6 (Ramos et al., 2009), in which the promoter contains motifs similar to the
redox regulated antioxidant response elements (ARE) of maize catalase2 (Guan et al.,
1996; Scandalios, 2005; Ramos et al., 2009), potentially indicating similar regulatory
elements in Arabidopsis thaliana.
The GPx7 is the most responsive antioxidant enzyme to stresses in chloroplast accord-
ing to the array data published by Kilian et al., (2007). In the past 20 years, several light
regulated I- and T-boxes (Donald and Cashmore, 1990; Chan et al., 2001) and an ABA-
sensitive Myc-ATRD22 motif (Abe et al., 1997) were identified in the GPx7 promoter,
however the regulation mechanism of GPx7 is not yet clear.
1.4.4 Regulation of 2-Cys-PrxA (2CPA)
1.4.4.1 Transcriptional regulation of 2CPA
The first peroxiredoxins were cloned the from bacteria such as E. coli and Salmonella
typhimurium over 20 years ago (Storz et al., 1989). Since then the peroxiredoxin genes
have been widely studied and the first 2CPA was identified in plant 17 years ago (Baier
and Dietz, 1996). The 2CPA serves now as a model locus to study the mechanism of

Introduction
22
regulation of the chloroplast antioxidant system (Baier et al., 2004; Heiber et al., 2007;
Shaikhali et al., 2008).
2CPA promoter responds to the oxidative stresses mediated by H2O2, ethylene and
wounding (Baier et al., 2004), however the 2CPA expression is not induced by methyl
viologen and ozone (Baier and Dietz, 1997). In the tAPx and sAPx knock-out line, the
antioxidant protection is insufficient and the 2CPA expression is induced, indicating that
the APxs and Prxs in chloroplast act complementarily (Kangasjarvi et al., 2008).
Baier et al., (2004) identified a 314 bp core-promoter of 2CPA, which controls the 2CPA
expression according to the stages of leaf development (Baier et al., 2004). Further-
more, a 216 bp cis-regulatory domain on upstream of the 2CPA core-promoter was iden-
tified and designated ‘‘redox-box’’. Based on this redox-box, a yeast-one-hybrid screen
was performed on the Arabidopsis thaliana cDNA library. Consequently, a redox-
sensitive transcription factor Rap2.4a was identified, which binds to a CE3-like element
of the redox-box sequence (Shaikhali et al., 2008). Rap2.4a regulates 2CPA in a redox
state dependent manner. In the reduced state the Rap2.4a is in its monomer form. In
moderate redox state, it binds on 2CPA promoter in the dimer form and activates 2CPA
expression, and in the oxidized state the Rap2.4a is released from the 2CPA binding
domain through oligomerization (Shaikhali et al., 2008).
By modulating NO3- reduction rates and blocking photosynthetic electron transport in the
upstream and downstream of the PQ pool, it was concluded that, the 2CPA activity is
dependent on the electron acceptor availability at photosystem I (Baier et al., 2004). A
further study of the ABA responsive test revealed that ABA suppresses 2CPA promoter
activity. Furthermore, the application of MAPKK-inhibitor PD98059 on the 2CPA reporter
gene line revealed cross-talk of redox signaling and ABA signaling mediated by different
MAPKKs (Baier et al., 2004).

Introduction
23
1.4.4.2 Rimb mutants
To discover the regulators of 2CPA promoter under redox stresses, a reporter line ex-
pressing luciferase under control of 2CPA promoter was created with Arabidopsis wild
type Col-0 (Baier et al., 2004). By application of ethyl methanesulfonate (EMS) to the
plants of the reporter gene line, six redox imbalanced mutant lines (rimb) were generat-
ed, which demonstrated impaired regulation of 2CPA promoter in response to oxidative
stress (Heiber et al., 2007). Moreover, the expression of other chloroplast antioxidant
enzymes, for instance 2CPB and CDS2, were reduced under photooxidative stresses. It
was suggested that independent points of the redox signaling pathway are affected in
each rimb mutant (Heiber et al., 2007), whose independence from ROS signaling was
proven by using marker genes of ROS signaling, like Fer, Cat2, Lox2 and BAP1 (Kiddle
et al., 2003; op den Camp et al., 2003).
According the pre-characterization of the six rimb mutants, a regulatory network was
proposed, in which RIMB3 and RIMB6 play important roles in the central chloroplast-to-
nucleus signaling pathway, while RIMB1 and RIMB2 function as general modulators,
additionally RIMB5 and RIMB7 are gene-specifically regulators (Heiber et al., 2007).
However, the loci of all the RIMBs still needed to be identified in the Arabidopsis genome.
Recently, RIMB1 has been identified as CEO1 (Clone Eighty One; At1g32230)
(Hiltscher, 2011), also known as RADICAL-INDUCED CELL DEATH1 (RCD1), which
belongs to the (ADP-ribosyl) transferase domain-containing subfamily, that is classified
in the WWE protein-protein interaction domain protein family (Aravind, 2001; Ahlfors et
al., 2004). CEO1 is localized in the nucleus without stress treatment. However under
high salt or oxidative stress CEO1 is also found in the cytoplasm. CEO1 responses to
abotic stresses. Experiments of yeast-two-hybrid revealed that CEO1 interacts with
Rap2.4a (Sheikhali et al., 2006). It was proposed that CEO1 is induced by H2O2, and
interacts with Rap2.4a, and that this interaction subsequently increases the DNA-binding
activity of Rap2.4a to its binding motif on the target gene (Sheikhali et al., 2006).

Introduction
24
1.5 Aim of this study
The present work aims to identify regulators of the chloroplast antioxidant enzyme 2-
Cys-Peroxiredoxin A (2CPA), which serves as a model locus to study chloroplast-to-
nucleus redox signaling (Baier et al., 2004), and to further elucidate mechanisms of ret-
rograde redox signaling from chloroplast to nucleus, with a particular focus on transcrip-
tional regulation. In this study the redox imbalanced (rimb) mutants rimb3 and rimb6,
which were generated on a reporter gene controlled by the 2CPA promoter (Heiber et
al., 2007), were used to investigate the regulation of 2CPA. Identification via genetic
mapping and characterization of the loci of RIMBs may lead to a new insight on regula-
tion of chloroplast antioxidant system and the retrograde signal transduction from chlo-
roplast to nucleus.

Material and Methods
25
2 Material and Methods
2.1 Plant materials
The seeds of Arabidopsis thaliana natural accessions Columbia-0 (Col-0) and Lands-
berg erecta (Ler) were obtained from Nottingham Arabidopsis Stock Centre (NASC,
Loughborough, UK). The reporter gene line T19-2 expressing luciferase under control of
the 2CPA promoter was generated by Agrobacteria transformation of Arabidopsis ac-
cession Col-0 (Baier et al., 2004). Rimb mutants were generated by EMS mutagenesis
of T19-2 (Heiber et al., 2007).
The information of all the T-DNA insertion lines was selected on T-DNA Express Ara-
bidopsis Gene Mapping Tool (http://signal.salk.edu/cgi-bin/tdnaexpress). The seeds
were obtained from either the Nottingham Arabidopsis Stock Centre
(http://arabidopsis.info) or the Institute National de la Recherche Agronomique (INRA,
Paris, France).
2.2 Growth conditions
2.2.1 Sterilization and vernalization of Arabidopsis thaliana seeds
The seeds of Arabidopsis thaliana were sterilized in 70% ethanol (v/v) for 1 minute, and
in 30% household bleach (Glorix, Lever Farbergé, Netherlands) for 8 min, then washed
5 times in sterile water. Afterwards the seeds were stratified under 4°C in the dark for
two days.

Material and Methods
26
2.2.2 Growth of Arabidopsis thaliana seedlings on sterile MS medium
The Arabidopsis thaliana young seedlings were grown under short-day condition on MS
medium (Murashige and Skoog, Duchefa, Haarlem, Netherlands) containing 0.5% (w/v)
sucrose and 0.4% (v/v) phytagel.
MS medium
MES‐buffer 5 mM
Phytagel 0.4% (w/v)
MS without Vitamin [1 x] 0.43% (w/v)
Sucrose 0.5% (w/v)
Sterile water ad. 1000 ml
2.2.3 Growth of Arabidopsis thaliana plants on soil
2.2.3.1 Nutrient-rich substrate
The Arabidopsis nutrient-rich substrate is a mixture of 42.4% (v/v) P type-soil (Knauf
Perlite GmbH, Dortmund, Germany), 42.4% (v/v) T type-soil (Both types of soil were
produced by Knauf Perlite GmbH, Dortmund, Germany) and 15.2% (v/v) perlite (Knauf
Perlite GmbH, Dortmund, Germany).
2.2.3.2 Nutrient-poor substrate
The Arabidopsis nutrient-poor substrate is a mixture of 33.3% (v/v) P type-soil, 33.3%
(v/v) perlite and 33.3% (v/v) vermiculite (Deutsche Vermiculite Dämmstoff GmbH,
Sprockhövel, Germany).

Material and Methods
27
2.2.4 Short-day and Long-day growing condition
The plants were cultivated either in a growth chamber or in a controlled environment
chamber (Percival Scientific, Inc, Perry, USA) under short day conditions (10 h light,
22°C at 120 μmol photons m-2 s-1 with white light (OSRAM LUNILUX Cool White 36W) /
14 h dark, 18°C, 50% humidity). Under long-day conditions the plants were grown on soil
in the green house (16 h at 120 μmol photons m-2 s-1 light, 22°C/ 8 h dark, 18°C).
2.3 Crossing of Arabidopsis thaliana plants
All the open flowers, buds and mature siliques were removed from the inflorescences of
mother plants by a pair of fine forceps. One flower from the father plant was taken and
opened. The mature anthers on this flower were rubbed onto the stigma of the emascu-
lated inflorescence. This procedure was repeated on the next day on the same stigma
which was closed in a small paper bag to prevent from fertilization by other flowers. After
ripening, the siliques were harvested, and the seeds were kept at room temperature for
drying. Genotyping was performed from the F1 generation to confirm the crossing. The
F2 generation was used for genetic mapping.
2.4 Co-segregation analysis
To confirm the co-segregation of the low luciferase phenotype and the chlorosis pheno-
type, plants with chlorosis were selected from the F2 generation of the chlorotic mutant
with the parental line T19-2. The seeds of chlorotic and wild type like plants were har-
vested. In these two groups, LUC-screen was performed on the 10 days-old seedling to
calculate the ratio of the plants with low luciferase activities within the seedlings with
chlorotic and non-chlorotic parents.

Material and Methods
28
2.5 Phenotype analysis of the plants
The wild type plants Col-0, reporter gene line T19-2 and rimb mutants were grown in
growth chamber and greenhouse under short- and long-day conditions respectively. The
plants were photographed once a week. To quantify the rosette diameter of each line,
Java-based image processing program ImageJ (http://rsb.info.nih.gov/ij/) was applied.
The phenotype analysis was performed for 6 weeks.
2.6 Determination of luciferase activity in vivo
2.6.1 Measurement with Fluoskan Ascent FL luminometer
Luciferase reporter gene activities were determined in 10 days old seedlings separately
grown on 100 µl MS medium in each well of 96-well microtiter plates. Col-0 and T19-2
were commonly included as negative and positive control lines, respectively. The seed-
lings were incubated in 3 mM luciferin solution (3 mM Luciferin; 0.01% (v/v) Triton X‐
100) in the dark for 5 min by spraying luciferin solution onto the surface of the leaves.
The luciferase activities were measured for 20 mS integration time in the Fluoroscan
Ascent FL luminometer (Thermo Fisher Scientific, Dreieich, Germany). The photomulti-
plier tube was kept at the default setting of 828 V. The bioluminescence intensities with
emission wavelength 482 nm were measured on 5 points in each well. The luciferase
activity of each seedling was represented by the mean value of the luminescence-
intensities of the 5 points in each well.
2.6.2 Measurement with NightSHADE LB 985 in vivo plant imaging system
The luciferase activities of the plants were imaged using a NightSHADE LB 985
(BERTHOLD TECHNOLOGIES GmbH & Co. KG, Bad Wildbad, Germany). The plants
were incubated in luciferin for 10 min in the dark and exposed for 1 minute for imaging.
Colors from blue to red on the images indicate the levels of luminescence intensities

Material and Methods
29
from low to high. The activities of the reporter gene of each individual were quantified by
software IndiGO.
2.7 Agarose gel electrophoresis
2.7.1 DNA Gelelectrophoresis
DNA samples were analyzed by electrophoretically on 1.2 or 4% (W/V) agarose gels
depending on the fragment sizes. The agarose powder was melted in 1 x TAE buffer and
supplemented with 0.5 μg m/l ethidiumbromide. The DNA samples were loaded on the
gel after mixing them with 25% (v/v) DNA-loading-buffer. The electrophoresis was run at
120 V in 1 x TAE buffer for around 15 min. The DNA fragments were afterwards visual-
ized in a UV-light box with a CCD-camera at 312 nm (INTAS, Göttingen, Germany).
TAE buffer
Tris-acetate pH 7.5 0.8 mM
EDTA 0.02 mM
Loading buffer
Bromophenol blue 0.05% (w/v)
Xylenecyanol 0.05% (w/v)
Glycerol 6% (v/v)
2.7.2 RNA Gelelectrophoresis
For RNA MOPS-formaldehyde agarose gels, 1.2% agarose was melted in 3-(N-
morpholino) propanesulfonic acid (MOPS) buffer after cooling down to 60°C and adding
0.9% (v/v) formaldehyde. 3µl isolated RNA samples were mixed with 3 µl loading dye
and 4.8 µl loading buffer. The mixture was denatured for 15 min at 65°C, then trans-

Material and Methods
30
ferred on ice for ca. 2 min and finally loaded on the MOPS agarose gel. The RNA frag-
ments were separated for approximately 20 min at 90 V in 1x MOPS buffer.
1x MOPS buffer
MOPS pH 7.0 20 mM
Sodium acetate 5 mM
EDTA 1 mM
Loading buffer
MOPS pH 7.0 3 mM
Sodium acetate 0.75 mM
EDTA 0.15 mM
Formaldehyde 6.5% (v/v)
Formamide 57.5% (v/v)
Ethidium bromide 0.12 mg/ml
Loading dye
Bromophenolblue 0.03% (w/v)
Tris-HCl pH 7.6 10 mM
Glycerol 60% (v/v)
EDTA 60 mM
2.8 DNA isolation
2.8.1 Isolation of genomic DNA
Genomic DNA was isolated from single leaves (ca. 0.25 cm² leaf area), by homogenisa-
tion 200 µl REB buffer. The genomic DNA was extracted by mixing the homogenate with
200 µl phenol-chloroform-isoamyl alcohol (25:24:1). After centrifugation the upper water

Material and Methods
31
phase was transferred to 200 µl isopropanol to precipitate DNA at -20°C for 30 min. The
precipitate was collected by centrifuging at 20.000 x g for 15 min followed by washing
the DNA pellet in 70% (v/v) ethanol. Finally the DNA was re-suspended in 100 µl of nu-
clease-free water and stored at -20°C.
REB buffer
Tris/HCl pH 8.0 50 mM
EDTA 25 mM
Sodium chloride 250 mM
SDS 0.5% (v/v)
2.8.2 Isolation of nuclei DNA for Illumina sequencing
0.5 – 1 g of the plant tissue was ground to fine powder in liquid nitrogen and mixed with
10 ml of ice-cold Nuclei extraction buffer. The mixture was filtered through two layers of
Miracloth (CalBiochem) and mixed with 2 ml Lysis buffer (10% Triton X-100 in Nuclei
extraction buffer) for 2 min on ice. The nuclei DNA was pelleted by centrifugation at 4°C
and at 2000 x g, then re-suspended in 500 µl CTAB extraction buffer followed by incuba-
tion at 60°C for 30 min. The mixture was cooled down at room temperature for 5 min.
The nuclei DNA was separated from protein solution by mixing 350 µl chloroform/ iso-
amyl alcohol (24:1). After centrifugation at 4629 x g for 10 min the upper phase was col-
lected and mixed with 400 µl isopropanol to precipitate the DNA. By centrifugation at
13000 rpm for 3 min the DNA was pelleted and then washed with 75% (v/v) ethanol. The
nuclei DNA was dissolved in 50 µl of nuclease-free water and incubated at 65°C for 30
min to deactivate any DNases, and stored at -20°C.

Material and Methods
32
CTAB extraction buffer
1M Tris-Cl pH 7.5 100 mM
5M Sodium cholride 0.7 M
0.5 M EDTA 10 mM
BME (2-Mercaptoethanol ) 1% (v/v)
CTAB 1% (v/v)
d. Water
Nuclei extraction buffer
TRIS-HCl pH 9.5 10 mM
EDTA pH8.0 10 mM
Potasium chloride 100 mM
Sucrose 500 mM
Spermidine 4 mM
Spermine 1 mM
Beta-mercaptoethanol 0.1% (v/v)
2.8.3 Testing the quality of isolated DNA
The concentrations and qualities of DNA were spectrophotometrically evaluated by using
NanoPhotometer (Implen, Munich, Germany) in which the absorbances at 260, 280 and
230 nm were measured, indicating the contents of nucleic acids, proteins and other
contaminations respectively. The ratios of A260/A280 and A260/A230 were calculated
to evaluate the purity of the isolated DNA. The ratios should be over 1.8 and in the range
of 2.0 to 2.2, respectively. Furthermore DNA samples were also run in 1.2% agarose gel
to test the quality the DNA.
Material and Methods
33
2.9 RNA isolation
2.9.1 Isolation of RNA from the plant material
Around 10 10-day old seedlings of Arabidopsis thaliana, which were grown on MS
plates, were harvested and frozen immediately in liquid nitrogen. All the plant material
was pulverized by using a Retsch Ball Mill (Retsch GmbH, Haan, Germany) at a fre-
quency of 30/s for 60 seconds. The total RNA was isolated by using the GeneMATRIX
Universal RNA Purification KIT (EURx, Gdansk, Poland) according to the manufacturer’s
instructions. The principle of this total RNA isolation kit is based on specific binding of
RNA to a silica-gel-membrane under high salt conditions. The cell debris, proteins and
most of the DNA were removed by subsequent washing steps. The rest of DNA on the
membrane was digested by DNAse. The total RNA was finally eluted in the provided
elution buffer and stored at -20°C.
2.9.2 Testing the quality of isolated RNA
The concentration and quality of the isolated RNA were spectrophotometrically analyzed
using the NanoPhotometer (Implen, Munich, Germany). For RNA, the ratios of
A260/A280 and A260/A230 should be over 2.0 and in the range of 2.0 to 2.2, respective-
ly. To finally confirm the RNA quality, the samples were separated in 1.2% MOPS-
formaldehyde agarose gel and analyzed by INTAS gel documentation system. Only
samples, which showed sharp RNA bands, were used for further analysis.
2.10 Polymerase chain reaction (PCR)
The primers were designed with online primer designer Primer3 (http://frodo.wi.mit.edu)
and synthesized by Sigma-Aldrich Chemie GmbH (Munich, Germany). The primers were
dissolved at final concentration of 100 mM and stored at -20°C

Material and Methods
34
2.10.1 Standard PCR
Polymerase chain reaction (PCR) was performed on a Flexibler PCR Thermocycler (An-
alytika Jena, Germany) with standard protocol-0 of PCR reaction for 20 µl shown in Ta-
ble 2-1. The heat-stable Taq polymerase, which was hetrologously expressed in E.coli
and isolated, was applied to catalyze the reaction, and the annealing temperatures were
according to the melting temperature (Tm) of the gene specific primers.
10x PCR buffer
Tris/HCl pH 8.4 200 mM
KCl 500 mM
MgSO4 15 mM
MgCl2 1.5 mM
Table 2-1: general PCR reaction system and conditions
PCR reaction system PCR conditions
10x PCR buffer 2µl Pre-denaturartion 95°C 3 min
Primer Forward 0.2 mM
35 cycles
Denaturation 95°C 1 min
Primer Reward 0.2 mM Annealing 54°C to 60°C 1 min
dNTPs 2 mM Extension 72°C 1 min
DNA template 5 mM Extension 72°C 15 min
Taq polymerase 1U Incubation 4°C
2.10.2 PCR with OptiTaq
To amplify the PCR products over 2 kb the OptiTaq polymerase (EURx, Gdansk, Po-
land) was used. The protocol-0 of the PCR reaction with OptiTaq for 50µl is shown in
Table 2-2, in which annealing temperature was according to the Tm of primers and ex-
tension time is adjusted to the size of the products (one minute per kb length).
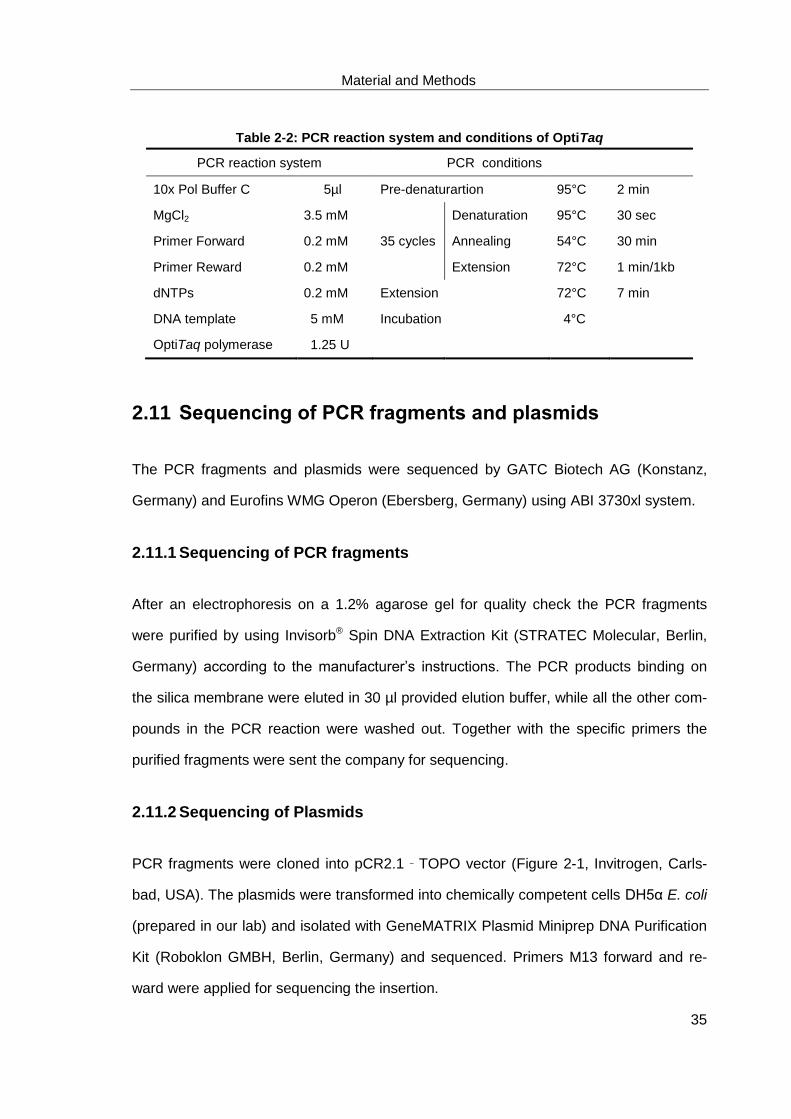
Material and Methods
35
Table 2-2: PCR reaction system and conditions of OptiTaq
PCR reaction system PCR conditions
10x Pol Buffer C 5µl Pre-denaturartion 95°C 2 min
MgCl2 3.5 mM
35 cycles
Denaturation 95°C 30 sec
Primer Forward 0.2 mM Annealing 54°C 30 min
Primer Reward 0.2 mM Extension 72°C 1 min/1kb
dNTPs 0.2 mM Extension 72°C 7 min
DNA template 5 mM Incubation 4°C
OptiTaq polymerase 1.25 U
2.11 Sequencing of PCR fragments and plasmids
The PCR fragments and plasmids were sequenced by GATC Biotech AG (Konstanz,
Germany) and Eurofins WMG Operon (Ebersberg, Germany) using ABI 3730xl system.
2.11.1 Sequencing of PCR fragments
After an electrophoresis on a 1.2% agarose gel for quality check the PCR fragments
were purified by using Invisorb® Spin DNA Extraction Kit (STRATEC Molecular, Berlin,
Germany) according to the manufacturer’s instructions. The PCR products binding on
the silica membrane were eluted in 30 µl provided elution buffer, while all the other com-
pounds in the PCR reaction were washed out. Together with the specific primers the
purified fragments were sent the company for sequencing.
2.11.2 Sequencing of Plasmids
PCR fragments were cloned into pCR2.1‐TOPO vector (Figure 2-1, Invitrogen, Carls-
bad, USA). The plasmids were transformed into chemically competent cells DH5α E. coli
(prepared in our lab) and isolated with GeneMATRIX Plasmid Miniprep DNA Purification
Kit (Roboklon GMBH, Berlin, Germany) and sequenced. Primers M13 forward and re-
ward were applied for sequencing the insertion.
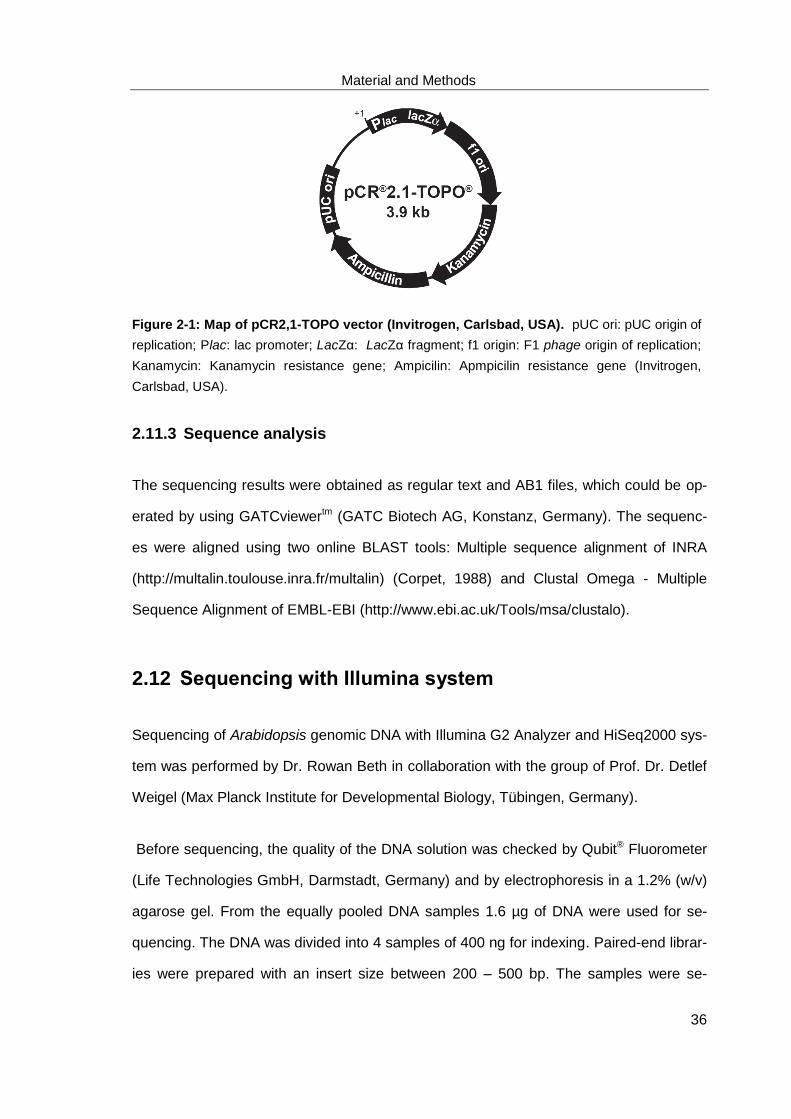
Material and Methods
36
Figure 2-1: Map of pCR2,1-TOPO vector (Invitrogen, Carlsbad, USA). pUC ori: pUC origin of
replication; Plac: lac promoter; LacZα: LacZα fragment; f1 origin: F1 phage origin of replication;
Kanamycin: Kanamycin resistance gene; Ampicilin: Apmpicilin resistance gene (Invitrogen,
Carlsbad, USA).
2.11.3 Sequence analysis
The sequencing results were obtained as regular text and AB1 files, which could be op-
erated by using GATCviewertm (GATC Biotech AG, Konstanz, Germany). The sequenc-
es were aligned using two online BLAST tools: Multiple sequence alignment of INRA
(http://multalin.toulouse.inra.fr/multalin) (Corpet, 1988) and Clustal Omega - Multiple
Sequence Alignment of EMBL-EBI (http://www.ebi.ac.uk/Tools/msa/clustalo).
2.12 Sequencing with Illumina system
Sequencing of Arabidopsis genomic DNA with Illumina G2 Analyzer and HiSeq2000 sys-
tem was performed by Dr. Rowan Beth in collaboration with the group of Prof. Dr. Detlef
Weigel (Max Planck Institute for Developmental Biology, Tübingen, Germany).
Before sequencing, the quality of the DNA solution was checked by Qubit® Fluorometer
(Life Technologies GmbH, Darmstadt, Germany) and by electrophoresis in a 1.2% (w/v)
agarose gel. From the equally pooled DNA samples 1.6 µg of DNA were used for se-
quencing. The DNA was divided into 4 samples of 400 ng for indexing. Paired-end librar-
ies were prepared with an insert size between 200 – 500 bp. The samples were se-

Material and Methods
37
quenced with 2 x 100 bp reads in the lane of illumina Analyzer. The sequencing pro-
cesses were culminated in one lane of an Illumina G2 Analyzer with over 30 million raw
reads, which covered the Arabidopsis thaliana genome 19 times. By using 1/4 of a lane
of Hi-Seq 2000 Analyzer the sequencing was ended up with 80 million raw reads cover-
ing the Arabidopsis thaliana genome 57 times
2.13 Gene expression analysis
2.14 First strand cDNA synthesis
The first strand cDNA was synthesized from total RNA by using High-Capacity cDNA
Reverse Transcription Kits (Applied Biosystems, Carlsbad, USA). The reaction was set
up with 2 µl 10x RT Buffer, 2 µl 10x random primers, 0.8 µl dNTP mix(100mM), 1 µl Mul-
tiScribetm Reverse Transcriptase and 4.2 µl nuclease-free water in 10 µl reaction system
without RNase according to the suppliers recommendations. The synthesized cDNA was
stored at -20°C. The reaction conditions are listed in Table 2-3.
Table 2-3: Thermal cycling conditions for reverse transcription
Reaction step Temperature [°C] Time [m]
Step 1 25 10
Step 2 37 120
Step 3 85 5
Step 4 4
2.14.1 Expression Analysis
Reverse transcription quantitative PCR (qRT PCR) was performed to analyze the tran-
script level of genes of interest.

Material and Methods
38
2.14.1.1 Primer design
The primer pairs for quantitative real-time PCR were designed with desired Amplicon
size (60 to 80 bp) on the ‘‘primer design tool for high-throughput qPCR’’ QuantPrime
(http://www.quantprime.de). The optimal annealing temperature for each primer pair was
determined to ensure the primers binding to their targets efficiently and to prevent both
non-specific annealing and primer-dimer formation. Furthermore the primers were de-
signed to span exon–intron borders, to amplify only cDNA from mRNA gene transcripts,
but not genomic copies.
The specificities of the primers pairs were verified by analyzing the melting curve of the
reaction products and additionally by running PCR products on an agarose gel. Only the
primer pairs which had a single peak in the melting curve, corresponding to the single
band on the agarose gel, were selected in qPCR reaction. (See primers in Appendix)
2.14.1.2 Reverse transcription quantitative PCR (qRT-PCR)
Analysis of qRT-PCR was performed on a CFX96 thermocycler (BioRad, Hercules, USA)
using SYBR Green QPCR Master Mix (Agilent Technology, Santa Clara, USA). The op-
timal annealing temperature was determined to 60°C, while the efficiency of amplification
was verified for each primer pair in a qRT-PCR reaction, which was performed for 10-
fold dilution series of respective cDNA sample. The reaction system and the condition
are shown in Table 2-4.

Material and Methods
39
Table 2-4: qRT-PCR reaction system and conditions:
qRT-PCR reaction system (10µl ) qRT PCR conditions
2X SYBR® Green
PCR Pre-denaturartion 95°C 10 min
Master Mix 5µl
40 cycles
Denaturation 95°C 30 sec
Primer Forward 0.2 mM Annealing 60°C 30 sec
Primer Reward 0.2 mM Extension 72°C 30 sec
DNA template 5 mM Post-denaturartion 95°C 10 sec
Melting Curve test 65°C to
95°C
Increment 0.5°C 5
Sec
The fluorescent dye SYBR Green preferentially binds to double-stranded DNA and emits
a characteristic fluorescence at 585 nm after excitation with 470 nm. The fluorescence
signals were read and collected at end of each annealing and extension steps to monitor
the melting kinetics of the PCR product. Melting curve tests were performed at the end
of the program with gradient temperature from 65°C to 95°C to test the purity of the used
buffers and solutions to assess for primer dimer formation with non-template control.
Afterwards the cDNA amounts were calculated by the software Bio-Rad CXF manager
2.1 with the equation . The expression ratio is
based on a statistical real-time PCR efficiency of 2 and with the differences () of
threshold value (Ct) of samples and reference gene.
The cDNA of wild type plants was included as positive control. All reactions were per-
formed for three technical replicates and three biological replicates representing an in-
dependent RNA isolation. Transcript levels of the target genes were normalized to the
respective transcript level of Act7 gene (At5g09810) as reference gene.

Material and Methods
40
2.15 Genetic mapping of mutant loci with Single Sequence
Length Polymorphisms (SSLP)
The mutant lines, which were generated by EMS mutagenesis on Arabidopsis thaliana
accession Col-0, were crossing to another accession Ler (Heiber and Baier 2007). The
plants of the segregating F2 population were screened for low luciferase activity and the
SSLP genetic mapping was performed on the selected individuals with mutant alleles.
2.15.1 Determination of individuals with mutant alleles from the segregating
F2 population
Seedlings growing on MS medium with 0.5% (w/v) sucrose on 96-well microtiter plates
were screened for luciferase activity (See chapter 2.6.1). T19-2 was included as positive
control line and the luciferase activities of each seedling relative to T19-2 were calculat-
ed. About 25% of the individuals were considered as individuals with mutant alleles,
which cause the luciferase activities of the plants between positive control (T19-2) and
negative control (Col-0), and they were selected for further mapping. All that individuals
for mapping were transferred onto soil and grown further in green house.
2.15.2 SSLPs markers design using Cereon database
SSLPs markers were applied in genetic mapping, with which the genetic backgrounds
were distinguished between Arabidopsis thaliana accession Col-0 and Ler based on the
In/Del polymorphisms (Jander et al., 2002). All the SSLPs markers were designed
based on the database of the Cereon/Monsanto Arabidopsis Polymorphism Collections
(http://www.arabidopsis.org/browse/Cereon/). The primers were designed to target both
sides of the flanking sequence of the SSLPs, which represent Indel polymorphisms be-
tween Col-0 and Ler around 20 bp. The desired PCR product lengths were about 200
bp.

Material and Methods
41
2.15.3 Mapping analysis of the mutant loci with SSLPs markers
To cover the Arabidopsis thaliana genome 25 SSLPs markers were applied, 30 F2
plants with low luciferase activity were selected for the first round of genetic mapping.
For each marker PCR was performed with the genomic DNA of the 30 plants as tem-
plates, and genetic DNA of Col-0, Ler and 1:1 mixture of Col-0 and Ler DNA were also
included as references templates. PCR products were electrophoretically separated on
4% (w/v) agarose gels to determine size differences between Col-0 and Ler DNA tem-
plates.
The linkage of each marker was calculated with the equation for the recombination fre-
quency shown below:
According to the linkage values across the genome, the region of interest with highest
allele frequency of Col-0 alleles was determined. More SSLPs markers on this region
were applied to search the marker with highest Col-0 allele frequency that represents the
position of mutant locus. To confirm the functions the final loci, the transcript analysis
was performed then with T-DNA insertion knock-out lines.
2.16 Genetic mapping of mutant loci with next generation
sequencing
The segregating F2 population were imaged by NightSHADE LB 985 and screened for
low luciferase activity followed by screening for mutant phenotype. Individuals with mu-
tant alleles were selected and pooled to isolate nuclei DNA for Illumina sequencing. The
nuclei DNA was sequenced on either Illumina GII analyzer or Hi-Seq 200 Analyzer.

Material and Methods
42
2.16.1 Analyses of the Illumina sequencing results with ShoreMap
Software package ‘‘SHOREmap’’ (Schneeberger et al., 2009) was applied to analyze the
deep sequencing data. The reads for the mapping population were separated by using
‘‘SHORE import’’ with the demultiplexing option and aligned to the sequence of acces-
sion Col-0 by using ‘‘SHORE mapflowcell’’. The paired-end information was corrected by
‘‘SHORE correct4pe’’ and the files from the first and second read were merged by using
‘‘SHORE merge’’. After consensus lists of polymorphisms (SNPs and small Indels) were
obtained with ‘‘SHORE consensus’’ option, consensus subsets of marker positions be-
tween the mapping population and Ler marker list of Weigel’s lab were finished. The
‘‘SHOREmap_interval.pl’’ was applied to plot the allele frequency of Col-0 alleles across
the Arabidopsis thaliana genome with different windows sizes. All known Ler markers
were excluded from the SNP list for the mapping population. The remaining SNPs
should represent EMS-induced mutations in the Col-0 background. The new SNPs were
annotated to identify the candidate mutations.
2.16.2 Confirmation of the final candidate locus
After identification of the final candidates, the new SNPs of the mutant lines and the se-
quence of the same locus in T19-2 were re-sequenced with Sanger sequencing method
to confirm the results of Illumina sequencing. To confirm the functions of the final loci,
the transcript analysis was performed with T-DNA insertion knock-out lines.
2.17 Genotyping and isolation of homozygous T-DNA
insertion lines by PCR
Primers for genotyping of the T-DNA insertion lines were designed by the ‘‘iSect
Toolbox’’ (http://signal.salk.edu/tdnaprimers.2.html) in the way to span insertion border.
Information about the common border-primers of insertion sequence was obtained from

Material and Methods
43
the providers of the T-DNA lines providers.
For genotyping of the T-DNA insertion lines, two PCR reactions were performed: the
primers of flanking sequence were applied for the first PCR, while a primer targeted to
the insertion and one of the primers of flanking sequence were used in the second PCR.
Only products of insertion sequence could be amplified from the homozygous T-DNA
insertion lines, while from wild type and heterozygous lines products of genomic DNA
were amplified. In this way the homozygous T-DNA insertion lines were selected, and
their progeny were used in further analysis as knock-out/down lines.
2.18 Escherichia coli manipulations
2.18.1 Generation of chemically competent E. coli
Escherichia coli strain DH5α was grown in 5 ml LB medium overnight at 37°C with agita-
tion at 200 rpm. Afterwards the culture was enlarged to 100 ml LB with the 5 ml pre-
pared pre-culture till OD600 had reached 0.4 to 0.6. After the culture was chilled on ice
for 10 min, the cells were harvested by centrifugation at 1600 x g for 7 min at room tem-
perature. The pellet was resuspended in 5 ml ice-cold CaCl2 medium, composed of 60
mM CaCl2, 10 mM Pipes, 15% (v/v) glycerol and adjusted with KOH to pH 7.0. The cells
were harvested then by centrifugation at 1600 x g for 7 min at room temperature. The
pellet was again resuspended in 2 ml ice-cold CaCl2 medium and distributed into 1.5 ml
tubes with 100 µl in each. The competent E. coli cells were immediately frozen in liquid
nitrogen and stored at -80°C.
Lysogeny Broth (LB) medium
Tryptone 1% (w/v)
Yeast extract 0.5% (w/v)
NaCl 1% (w/v)

Material and Methods
44
2.18.2 Plasmid transformation into E.coli
The plasmids were transformed into chemically competent DH5α E. coli strain by heat
shock. The plasmid was mixed with the DH5α cells that were thawed on ice. After incu-
bation on ice for 30 min, the cells were heated to 42°C for 40 seconds and immediately
transferred onto the ice and cooled down for 2 min. Afterwards the cells were recovered
in 200 μl LB liquid medium at 37°C for 1 h. Positive transformants harboring recombinant
plasmids were selected on LB medium plate containing the appropriate antibiotics over-
night at 37°C and grown in liquid LB medium for further analyses.
2.19 Plasmid manipulation
2.19.1 Purification of PCR products from agarose gel
Gel slices containing the PCR fragments of interest were cut out of the agarose gel un-
der UV light. Afterwards the DNA fragments were extracted from the gel using the In-
visorb® Spin DNA Extraction Kit (STRATEC Molecular, Berlin, Germany) according to
the manufacturer’s instructions. The DNA was harvested by melting the agarose gel
slices in salt buffer and bound to a silica membrane. After wash steps the DNA was elut-
ed in the provided elution buffer.
2.19.2 Cloning into entry vector (PCR8/GW/TOPO)
The purified PCR products were cloned into vector pCR®8/GW/TOPO® (Figure 2-2, Invi-
trogen, Carlsbad, USA) according to the manufacturer’s instructions. The orientation of
the inserted sequences in pCR®8/GW/TOPO® was determined by restriction digestion, in
which one of the enzymes was cutting the insert and another was cutting the
pCR®8/GW/TOPO® backbone. Fast-digestion enzymes were applied to digest 1 µg
plasmid DNA in 20 µl reaction system at 37°C for 30 min. The digested fragments were

Material and Methods
45
run on agarose gel electrophoresis and visualized under UV light. The insertion se-
quence and its orientation were additionally verified by single read sequencing.
Figure 2-2 Map of pCR8/GW/TOPO vector (Invitrogen, Carlsbad, USA). Spectinomycin: Spec-
tinomycin resistance gene (SpnR); pUC ori: pUC origin of replication; T2/T1: rrnB T2 and T1 tran-
scription termination sequences to prevent basal transcription of the PCR product of interest in E.
coli; attL1 / attL2: sites for recombination-based transfer of the gene of interest into a Gateway®
destination vector (Invitrogen, Carlsbad, USA).
2.19.3 Confirmation of the insertion with colony PCR
At least 10 colonies were selected for colony PCR with a pair of insertion specific pri-
mers. The PCR conditions for 20 µL reaction system are listed below (Table 2-5). After
an electrophoresis in agarose gel, only the reactions with the colonies containing the
right insert could show a product with appropriate size.

Material and Methods
46
Table 2-5: Colony PCR
PCR reaction system PCR conditions
10x PCR buffer 2µl Pre-denaturartion 95°C 10 min
Primer Forward 0.2 mM
35 cycles
Denaturation 95°C 1 min
Primer Reward 0.2 mM Annealing 54°C 1 min
dNTPs 2 mM Extension 72°C 1 min
DNA template colonies Extension 72°C 15 min
Taq polymerase 1U Incubation 4°C
2.19.4 Isolation of plasmids using miniprep kits
The colonies containing the recombinant vectors were grown in 5 ml Lysogeny Broth
(LB) medium containing the appropriate antibiotics and incubated at 37°C overnight by
shaking. The plasmids were isolated with GeneMATRIX Plasmid Miniprep DNA Purifica-
tion Kit (Roboklon GMBH, Berlin, Germany). The plasmid DNA was bound to silica
membrane, while the RNA, proteins and other substrate of the cells were washed out by
set of washing buffers. The plasmid DNA was eluted in provided elution buffer and
stored at -20°C. Finally the insertion of the isolated plasmids was verified by sequencing
with primer M13 forward (see Appendix).
2.19.5 LR reaction
The binary vector pHGWL7.0 was used for Gateway® recombination cloning reaction
(Karimi et al., 2002). The insertion, flanked by two attL sites in the entry clone
pCR®8/GW/TOPO®, was transferred by LR clonase mix into a destination vector
pHGWL7.0 carrying two attR sites (Karimi et al., 2002). As a result, luciferase is under
the control of the inserted promoter sequence. The sequence containing a ccd B lethal
gene was exchanged into entry vector and as consequence the growth of clones bearing
entry vector was hindered. Moreover, since entry vector pCR®8/GW/TOPO® and destina-

Material and Methods
47
tion vectors pHGWL7.0 (Figure 2-3) have resistance to the same antibiotic, the
pCR8®/GW/TOPO® vector was double digested with Psp1406I and EcoRV leading to a
fragment containing the inserted promoter sequence flanked by the attL1 and attL2 re-
combination sites. This approach was to prevent survival of the colonies containing the
entry vector pCR8®/GW/TOPO® after the LR recombination reaction.
Figure 2-3: map of pHGWFS vector. Sm/SpR: gene which mediates streptomycin-
spectinomycin resistance to E. coli and Agrobacteria; LB: left border of T-DNA; Hyg: plant se-
lectable marker gene which mediates hygromycin B resistance under transcriptional regulation of
the nopaline synthase (nos) promoter and nos terminator; attR1/ attR2: sites for recombination-
based transfer of the gene of interest from any Gateway® entry vector containing attL1/attL2 sites
generating attB1/attB2 sites; ccdB: F plasmid-encoded gene that inhibits growth of E. coli without
insert; Egfp: enhancer green fluorescent protein reporter gene; gus: β-glucuronidase reporter
gene, frame fusion with Egfp coding region; T35S: 35S terminator; RB: T-DNA right border
(Karimi et al., 2002).
The LR reaction was performed using LR Clonase II enzyme mix kit (Invitrogen, Carls-
bad, USA) in a 5 µl reaction system with 75 ng linearized entry vector, 75 ng pHGWL7.0
plasmid and 0.5 µl LR Clonase II enzyme mix filled up with TE buffer (pH 8.0). The mix-

Material and Methods
48
ture was incubated at 25°C overnight, followed by termination step with 1 µl proteinase K
solution at 37°C for 10 min.
After the LR reaction, the plasmids were transformed into DH5α E. coli strain. Positive
transformants were selected on LB plates containing 100 μg/ml spectinomycin. The clon-
ing success was verified by testing isolated freshly grown colonies by colony PCR and
restriction digestions. The positive ones were grown overnight in 5 ml LB medium at
37°C with agitation at 200 rpm overnight. Afterwards the plasmids were sequenced with
a border primer binding at the flanking sequence of the insertion for final confirmation
(GATC Biotech, Konstanz, Germany).
2.20 Agrobacterium tumefaciens manipulations
2.20.1 Production of competent A. tumefaciens cells
Agrobacterium tumefaciens strain GV3101(pMP90) was cultivated in 10 ml YEB medium
containing rifampicin (100 μg/ml) and gentamycin (25 μg/ml) and incubated overnight at
28°C and with agitation 180 rpm. From this culture 2 ml were transferred into 50 ml YEB
medium containing the appropriate antibiotics and incubated with agitation at 28°C and
180 rpm until OD600 reached at least 0.5.
YEB medium
Bacto Peptone 5 g /l
Yeast extract 1 g/l
Beef extract 5 g/l
Sucrose 5 g/l
MgSO4 x 7 H2O 0.5 g/l
After the culture was cooled down to 4°C, the cells were harvested by centrifugation at
5.000 x g and 4°C for 5 min. The pellet was resuspended in 1 ml 20 mM CaCl2 and di-
vided into 0.2 ml Eppi tubes and stored at -20°C.

Material and Methods
49
2.20.2 Transformation of A. tumefaciens
The freeze-thaw method (Weigel D, 2002) was applied to transform Agrobacterium tu-
mefaciens strain GV3101(pMP90). 0.2 ml competent cells and 1 μg plasmid DNA were
mixed and incubated for 15 min on ice. Afterwards the cells were frozen in liquid nitrogen
for 5 min followed by incubation at 37°C for 5 min. After adding 1 ml YEB medium the
cells were incubated for 2 to 4 hours at 28°C. The cells were plated on YEB plates con-
taining 1.5% (w/v) agar, rifampicin (150 μg/ml), gentamycin (25 μg/ml) and spectinomy-
cin (50 μg m/l), and incubated at 28°C for 2 days. Colonies were plated on a fresh YEB
plate and incubated at 28°C for 24 hours before transformed Agrobacteria were used for
plant transformation.
2.21 Comparison and analysis of promoters in plants
Promoter analysis was performed to check the effects of the natural variation in promot-
ers of different accessions on expression of gene of interest.
2.21.1 Analysis of the promoter sequences in Col-0 and Ler
Sequences of 2 kb upstream start codon were analyzed to study the promoters. The
promoter sequence of gene of interest was obtained with sequence viewer in TAIR
(http://www.arabidopsis.org/servlets/sv?action=closeup) (Swarbreck et al., 2008). The
polymorphism between Col-0 and Ler was thoroughly checked by using Cereon data-
base (http://www.arabidopsis.org/browse/Cereon/), and the polymorphism was con-
firmed again by checking Arabidopsis SNP viewer (http://signal.salk.edu/perlegen.html).
2.21.2 Transient gene expression
The promoter sequences of gene of interest were cloned into vector pHGWL7.0 for tran-
sient gene expression.

Material and Methods
50
2.21.2.1 Preparing Agrobacterium suspension for infiltration
In this study the p19 coexpression system (Voinnet et al., 2003) was applied to prevent
subsequent gene silencing in plant cell. Agrobacterium tumefaciens strain
GV3101(pMP90) carrying the constructs p2CPACol-0:LUC, p2CPALer:LUC and strain
GV3101(pMP90) carrying the 35S CaMV driven p19 protein of tomato bushy stunt virus
were inoculated in 10 ml YEB medium containing the appropriate antibiotics
(GV3101(pMP90):rifampicin 100 µg m/l, gentamycin 25 µg m/l; p19 protein: kanamycin
100 µg m/l; pHGWFL7.0: spectinomycin 100 µg m/l) and incubated with agitation at 28°C
until OD600 reached at least 0.5. For co-infiltrations, both Agrobacteria cultures were
mixed with each other according to the ratios shown below:
Vconstruct=Vfinal*0.5/OD600 and VP19=Vfinal*0.3/OD600
(Vfinal was 30ml per petri dish)
Cells were harvested by centrifugation at 3000 x g at room temperature for 8 min and
resuspended in activation buffer (100 mM MES pH 5.6, 10 mM CaCl2 and 150µM ace-
tongsyringon). The agrobacterial suspension was incubated in the activation medium for
at least 2 hours at room temperature and then infiltrated into the leaves of 10 days seed-
ling of Arabidopsis thaliana.
2.21.2.2 Infiltration of Arabidopsis leaves and LUC screening
10 days-old seedlings of Arabidopsis thaliana grown on 96 well microtiter plates were
used for infiltration. 150 µl of the agrobacterial suspension were added to each well. A
desiccator was applied to infiltrate the agrobacterial suspension into the plant leaves for
90 seconds and it was repeated 6 times. The infiltrated plants were transferred onto the
MS medium containing 500 mg/l cefotaxim and incubated for 2 days followed by LUC
screen with NightSHADE LB 985. T19-2 was used as positive control, while the plants
infiltrated with only activation buffer were used as negative control in this experiment.

Material and Methods
51
2.22 Metal content analysis
Plants were grown on nutrient-rich and nutrient-poor soil in growth chamber under short-
day condition for 5 weeks. The rosettes were harvested and frozen in liquid nitrogen af-
ter determination of the fresh biomass. All plant materials were thoroughly ground to fine
powder. Contents of metal elements in the plant materials were measured with induc-
tively coupled plasma mass spectrometry (ICP-MS) in collaboration with the group of
Prof. Ute Krämer (Ruhr University Bochum).
2.23 Coexpression analysis and function prediction
In this study, Arabidopsis eFP Browser (http://bar.utoronto.ca/efp/cgi-bin/efpWeb.cgi)
(Winter et al., 2007; Patel et al., 2012) was applied to check the specific gene expres-
sion pattern in different parts of Arabidopsis thaliana at different developmental stages,
accessions, and under different treatments and stresses. Based on results of microarray
as well as experiments under wide range of conditions, the database gives an graphical
expression map with different colors indicating different levels of expression of a specific
gene.
In terms of coexpression’s data, the relationships of expression of all the genes of inter-
est were studied by using database Genevestigator for plant biology
(https://www.genevestigator.com/gv/plant.jsp), which is a database and web-browser
data mining interface for Affymetrix Gene Chip data that was generated based on tran-
scripts studies of plant science (Zimmermann et al., 2004; Zimmermann et al., 2005;
Laule et al., 2006).
Predictions of protein–protein interactions and functions of genes of interest were per-
formed with database Genemania (http://www.genemania.org), which provides possible
information of coexpression, predicted functions, physical interactions shared protein

Material and Methods
52
domains, co-localization and genetic interaction of the investigated genes based on the
published literature (Mostafavi et al., 2008; Warde-Farley et al., 2010).
2.24 Analysis of amino acid sequences and protein
structures
The DNA sequences were translated into amino acid sequences by using EMBOSS
Transeq (http://www.ebi.ac.uk/Tools/st/EMBOss_transeq/), an online nucleic acid se-
quences translating tool of EMBL-EBI (Rice et al., 2000; Goujon et al., 2010). Amino acid
sequences were submitted to the online alignment-based modeling tool SWISS-MODEL
(http://swissmodel.expasy.org) (Guex and Peitsch, 1997; Arnold et al., 2006; Kiefer et al.,
2009) to predict the 3 D structures that were displayed by using the Swiss-pdbViewer
DeepView 4.1 (http://swissmodel.expasy.org/spdbv). The alignments of the sequences for
conserved domains were performed by using Conserved Domain Database (CDD) on
NCBI (http://www.ncbi.nlm.nih.gov/cdd) (Marchler-Bauer et al., 2011; Marchler-Bauer et al.,
2013).

Results
53
3 Results
To study the regulation of 2CPA expression in Arabidopsis thaliana, a homozygous
p2CPA:Luc reporter gene line (T19-2) was generated in the background of Arabidopsis
accession Col-0 (Baier et al., 2004). By screening the EMS mutagenized reporter gene
line for low luciferase activity, seven mutant lines (redox imbalanced-rimb) were isolated,
of which five lines showed limitations in redox-box regulation of the 2CPA promoter
(Heiber et al., 2007). In the present project rimb3 and rimb6 were chosen to investigate
the gene regulation in the central chloroplast-to-nucleus signaling pathway (Heiber et al.,
2007).
3.1 Phenotypic characterization of rimb3 and rimb6
mutants
In order to study the function of the loci RIMB3 and RIMB6, the loss-of-function mutant
rimb3 and rimb6 were first phenotypically characterized. The plants of rimb3 and rimb6
were smaller in rosette diameter, leaves shape, et cetera. Phenotype of rimb6 was de-
pendent on supplemented mineral nutrients availability (Hiltscher, 2011). Here, the mu-
tant lines rimb3 and rimb6 were re-characterized to check low induction of 2CPA ex-
pression and secondary phenotypes under the growth condition at Freie Universität
Berlin.
3.1.1 Growth habits of the mutants
Under both short-day (10h at 120 μmol photons m-2 s-1 light/14h dark) and long-day (14h
light/8h dark) conditions the rimb3 and rimb6 mutants were severely impaired in growth

Results
54
(Figure 3-1). They exhibited smaller rosettes in comparison to the parental line T19-2
under short- and long-day conditions.
Figure 3-1: The phenotype of T19-2, rimb3 and rimb6 under short-day condition. The
disturbed growths of rimb3 and rimb6 were disturbed likely due photooxidative damage to the
chloroplasts.
From two weeks onwards the two mutants grew slower than the parental line T19-2
(Figure 3-1). Moreover the mutant plants displayed smaller rosette diameters than of
T19-2 plants. Under short-day condition the rosette diameters of the plants of rimb3
reached only approximately 60% of the rosette diameters of T19-2 at all the develop-
mental stages (Figure 3-2). The plants of rimb6 grew in a similar way to rimb3 in the first
four weeks, but afterwards the growth of rimb6 was slowed down: the rosette diameters
of five weeks-old plants of rimb6 were only 33% relative to the rosette diameters of T19-
2 and the rosettes of rimb6 at the sixth week were 27% of rosettes of T19-2.
2 weeks 3 weeks 4 weeks 5 weeks 6 weeks

Results
55
Figure 3-2: Rosette diameters of rimb3 and rimb6 of five weeks: rosette diameters of rimb3
and rimb6 were clear smaller than the control line T19-2. The data are means of 8-10 parallels.
In rimb3 plants older than four weeks, chlorosis developed frequently on old leaves un-
der long-day condition (Figure 3-3), potentially indicating that the disturbed growth of
rimb3 plants correlates with photooxidative damage to the chloroplasts (Heiber et al.,
2007).
Figure 3-3: Phenotype of rimb3. Rimb3 showed chlorosis phenotype randomly under long-
day condition (shown with white arrows) and the shapes of the mature leaves were abnormal.
It indicated that the mutant plants were under photooxidative stresses.
The growth of rimb6 was also severely defective in rosettes diameters. From four weeks
onwards under short day conditions, the plants of rimb6 demonstrated a dwarf stature.
0
20
40
60
80
100
120
2 weeks 3 weeks 4 weeks 5 weeks 6 weeks
Rosette d
iam
ete
rs (
mm
)
T19-2
rimb-3
rimb-6
T19-2 rimb3

Results
56
The leaves were narrow and curled due to oxidative stress. Meanwhile the shooting time
of the mutant plants were delayed (data not shown). Moreover, it was observed, that in
rimb6 starch and anthocyanins were accumulated (Heiber et al., 2007). Taken together,
the mutant phenotype indicated that the antioxidant protection in the plants of rimb6 was
severely disturbed.
Figure 3-4: Phenotype of rimb6. The plants of rimb6 demonstrated a dwarf phenotype and
narrow and curled leaves under both short- and long-day conditions.
In the previous observation (Hiltscher 2011) the phenotype of rimb6 was shown to be
dependent on the nutrients availability in the soil. In the soil supplemented with high
amounts of mineral nutrients, the rimb6 habitus phenotype was almost lost (Hiltscher,
2011).
A different result was however observed under the growth condition in Berlin: rimb6
maintained widely the mutant phenotype on nutrient-rich soil, such as clearly stunted
growth, narrow and curled leaves et cetera, but grew generally faster (Figure 3-5 C).
T19-2 grown on nutrient-poor soil did not clearly differ from the T19-2 plants grown nutri-
ent–rich soil in pant growth (Figure 3-5 B and D). However the fresh weights of rimb6
grown in rich soil were not significantly changed compared to the rimb6 grown on poor
soil, while T19-2 also did not show significant difference in fresh weights of the plants
T19-2 rimb3

Results
57
grown on rich and poor soil but it had generally a clearly higher fresh weight than rimb6
either on rich or poor soil.
Figure 3-5: Habitus of five week-old rimb6 on nutrient-poor and -rich soils. The plants were
grown for five weeks in a controlled environment. The plants of rimb6 demonstrated significant
variation in rosette diameter on nutrient-poor and -rich soil, whereas the control line T19-2 were
not affected by the nutrient content of the soil.
Figure 3-6: Fresh weights of the rosettes of four week-old plants of rimb6 and T19-2 on
nutrient poor soil and rich soils. The T19-2 had generally higher fresh weight than rimb-6,
while the plants grown on rich- and poor-soil did not show clear difference between in fresh
weight. The data are means of 10-12 parallels. ** indicates a significant differences from the
value of Col-0 (Student test t-test, P<0.01)
Presumably, it is supposed that the mutant phenotype of rimb6 correlates to homeosta-
sis of the mineral elements in the plant cell and RIMB6 may be involved in the controlling
regulatory network of the transporters and/or channels of the mineral elements on plas-
ma membrane.
0,00
0,10
0,20
0,30
0,40
0,50
0,60
rimb6 poor soil T19-2 poor soil rimb6 rich soil T19-2 rich soil
Fre
sh w
eig
hts
of th
e r
ossets
of
four
week-o
ld p
lants
rimb6 on pool soil T 19-2 on poor soil rimb6 on rich soil T19-2 on rich soil
** **

Results
58
3.1.2 Analysis of reporter gene (luciferase) expression
In order to study the activities of 2CPA promoter, the activity of the reporter gene was
analyzed in vivo by plant imaging system. The analysis of average bio-luminescence of
the leaf surface was performed on the plants growing for six weeks under short-day
conditions and for four weeks under long day condition (Figure 3-7). In this experiment,
wildtype Col-0 and the reporter gene line T19-2 were grown in parallel to the mutant
lines rimb3 and rimb6 as negative and positive control respectively. The activities of the
reporter gene luciferase under control of 2CPA promoter in rimb3 and rimb6 were lower
than they were in T19-2, indicating the suppression of 2CPA expression in those two
mutants. The young leaves displayed higher luciferase-driven fluorescence values than
the old leaves, revealing the higher expression of 2CPA in young leave tissues.
To quantify the luciferase-expression level, the plant image system NightSHADE LB 985
(BERTHOLD TECHNOLOGIES GmbH & Co. KG, Bad Wildbad, Germany) was applied.
Under long-day conditions, rimb3 and rimb6 demonstrated lower luciferase activities
(60% and 13% relative to T19-2) in the first two weeks under greenhouse condition (Fig-
ure 3-8). From the third week on, the rimb3 exhibited higher luciferase activity than T19-
2, while the rimb6 always had lower luciferase than T19-2. However, the difference be-
tween rimb6 and T19-2 got smaller after the first two weeks. In the third week for exam-
ple rimb6 demonstrated 67% of T19-2 in luciferase activity and in the fourth week it was
62%. Based on this observation it was concluded that RIMB3 acts as a positive regulator
of 2CPA expression probably at young developmental stage of Arabidopsis (first two
weeks), while RIMB6 probably regulates 2CPA expression positively on all developmen-
tal stages. However, in the first two weeks RIMB6 may have a more important function in
inducing 2CPA expression than it did later on.
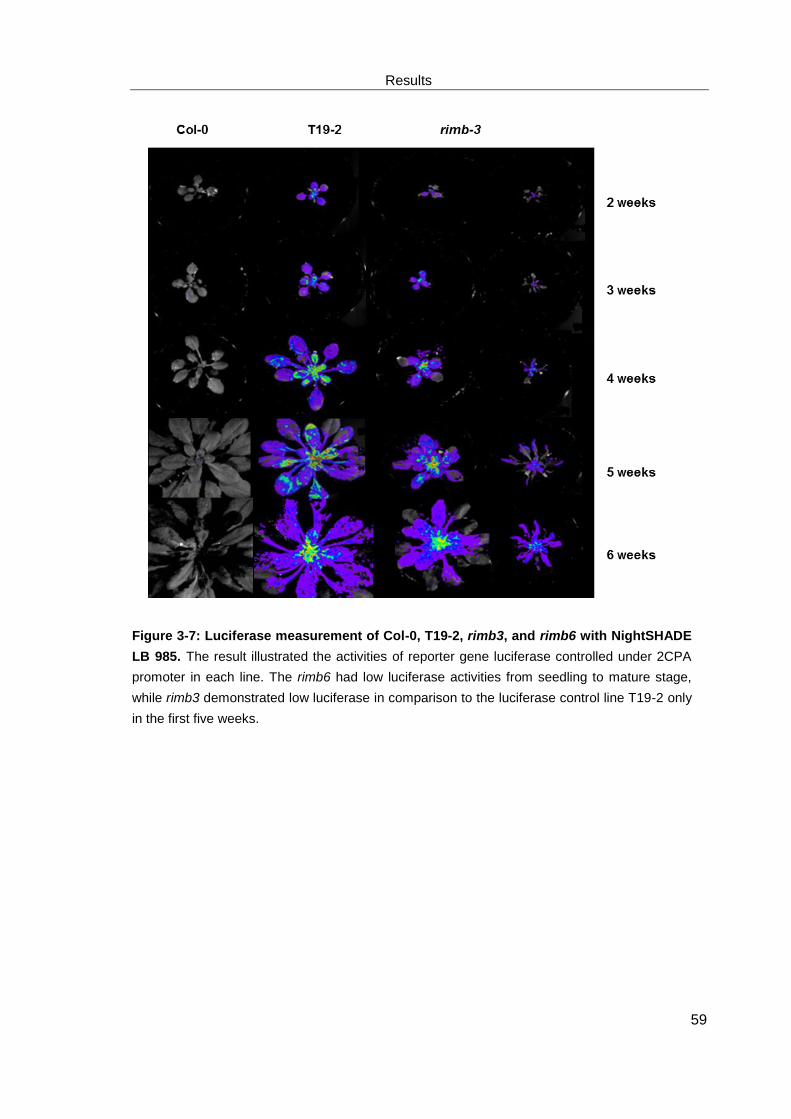
Results
59
Figure 3-7: Luciferase measurement of Col-0, T19-2, rimb3, and rimb6 with NightSHADE
LB 985. The result illustrated the activities of reporter gene luciferase controlled under 2CPA
promoter in each line. The rimb6 had low luciferase activities from seedling to mature stage,
while rimb3 demonstrated low luciferase in comparison to the luciferase control line T19-2 only
in the first five weeks.

Results
60
Figure 3-8: Luciferase activities of the plants of rimb3, rimb6 and reporter gene line T19-
2 under long-day condition: The luciferase activities were measured with average energy per
second on leaves by NightSHADE LB 985. The data are means of 8-10 parallels.
Under short-day conditions, the plants demonstrated the same pattern in terms of plant
development. In the first five weeks both of the rimb mutants showed lower luciferase
activities than T19-2. At six weeks, rimb3 exhibited even a higher luciferase activity than
T19-2. At this stage the inflorescence started to grow. Luciferase activity in rimb6 was
95% relative to T19-2 (Figure 3-9). Assumedly RIMB3 functions as a positive regulator of
2CPA expression in seedlings, young rosettes, and developed rosettes of Arabidopsis.
From the bolting stage (six weeks) onwards, based on the higher luciferase activity in
rimb3 than the activity in the reporter gene line T19-2, it was suggested that RIMB3
could slightly repress 2CPA expression in Arabidopsis wildtype at this developmental
stage. Luciferase activity was decreased in rimb6 plants throughout the entire develop-
ment process. RIMB6 is therefore assumed to regulate 2CPA expression positively at all
the developmental stages of Arabidopsis.
0
0,1
0,2
0,3
0,4
0,5
0,6
2 weeks 3 weeks 4 weeks 5 weeks 6 weeks
Avera
ge e
nerg
y p
er
second
on leaves(c
ps)
T19-2rimb3rimb6

Results
61
Figure 3-9: Luciferase activities of the plants of rimb3, rimb6 and reporter gene line T19-
2 under short-day condition. Average energy per second on leaves indicates the luciferase
activities for each line. The reporter gene line T19-2 demonstrated higher luciferase activity
than rimb3 and rimb6 in the first five weeks. From the sixth week rimb3 showed higher lucifer-
ase activity than T19-2 and rimb6 did. The data are means of 8-10 parallels.
3.2 Identification and characterization of mutant rimb6
3.2.1 The contents of mineral elements in rimb6 and T19-2
Due to the conditional phenotype of rimb6 on soil supplemented with different amounts
of mineral nutrients (Hiltscher 2011), it was presumed that the contents of the mineral
elements of the plants could be also conditional according to the soil types. To study the
functions of RIMB6 in homeostasis of the mineral elements in the plant cell, the contents
of fifteen elements in rimb6 and T19-2 were analyzed using ICP-MS.
Significant differences were detected in the contents of the elements Cd, Cr, Cu, Fe, Mn,
Mo, Se, Ni and Zn between rimb6 and T19-2 (Figure 3-10).
0
0,5
1
1,5
2
2,5
2 weeks 3 weeks 4 weeks
Avera
ge e
nerg
y p
er
second
on leaves(c
ps)
T19-2
rimb3
rimb6

Results
62
Figure 3-10: The contents of fifteen mineral elements in the five week-old plants of rimb6
relative to the contents in reporter gene line T19-2. The analysis was performed with ICP-
MS. The blue bars showed the mineral element content in the plants grown on nutrient-poor
soil and red bars were for the plant grown on nutrient-rich soil. The numbers on x axis stand for
the positions of peaks showed in the results of ICP-MS.
On nutrient-poor soil, the contents of Cd, Se and Zn in rimb6 were clearly decreased,
while the contents of Cu, Mn, and especially Cr and Ni were increased in rimb6 in com-
parison to T19-2. The contents of Cr and Ni in rimb6 were 3-fold and 5.8-fold in compari-
son to T19-2 respectively.
On nutrient-rich soil, the contents of Mo and Se were significantly diminished in rimb6
plants and contents of Cd, Cr, Cu, Fe, Mn and Ni were increased, compared to their con-
tents in T19-2. The Cd content in rimb6 was 1- fold higher than its content in T19-2.
3.2.2 Genetic mapping of rimb6 with next generation sequencing
In a previous part of the project (Hiltscher, 2011), rimb6 was mapped with SSLP markers
to a 201 kb region on the top arm of chromosome IV, in which 57 genes are predicted.
Here genetic mapping was continued.
0
1
2
3
4
5
6
Rela
tive c
onte
nts
of
the m
eta
ls in
rim
b6
com
pare
d to in r
eport
er
gene lin
e T
19
-2
on nutrient poor soil
on nutrient rich soil

Results
63
3.2.2.1 Crossing of homozygous rimb6 to wild type Landsberg erecta (Ler)
accession
The mutant line rimb6 (based on genetic background Col-0) was crossed to the acces-
sion Landsberg erecta (Ler) The F1 progeny demonstrated high luciferase activities in
comparison to wildtype Col-0 (Figure 3-11), indicating the heterozygosity of the reces-
sive mutant and dominant wildtype suppressor of 2CPA in F1 generation.
Figure 3-11: F1 of the mapping population: F1 population of rimb6 X Ler (left) demonstrated
high luciferase activity (imaged by a plant imaging system NightSHADE LB 985 ) and the
wildtype Col-0 (right) did not show any luciferase activity.
3.2.2.2 Selection of the individuals bearing rimb6 allele in F2 population
and isolation of nuclei DNA
More than 1200 plants of the F2 generation of the crossing line rimb6 x Ler were grown
on nutrient-poor soil under short-day condition. Two weeks after germination, luciferase
activities of all the individuals were imaged by a plant imaging system NightSHADE LB
985. All the individuals showing high luciferase activities were excluded from the popula-
tion, while the others were used for further analysis.
The remaining population with low luciferase activity was further cultivated for another
three weeks. 208 individuals with clear rimb6 mutant phenotype were harvested and
pooled into two groups. To avoid the background of plastid DNA in the sequencing step,
F1 population of rimb6 X Ler Col-0
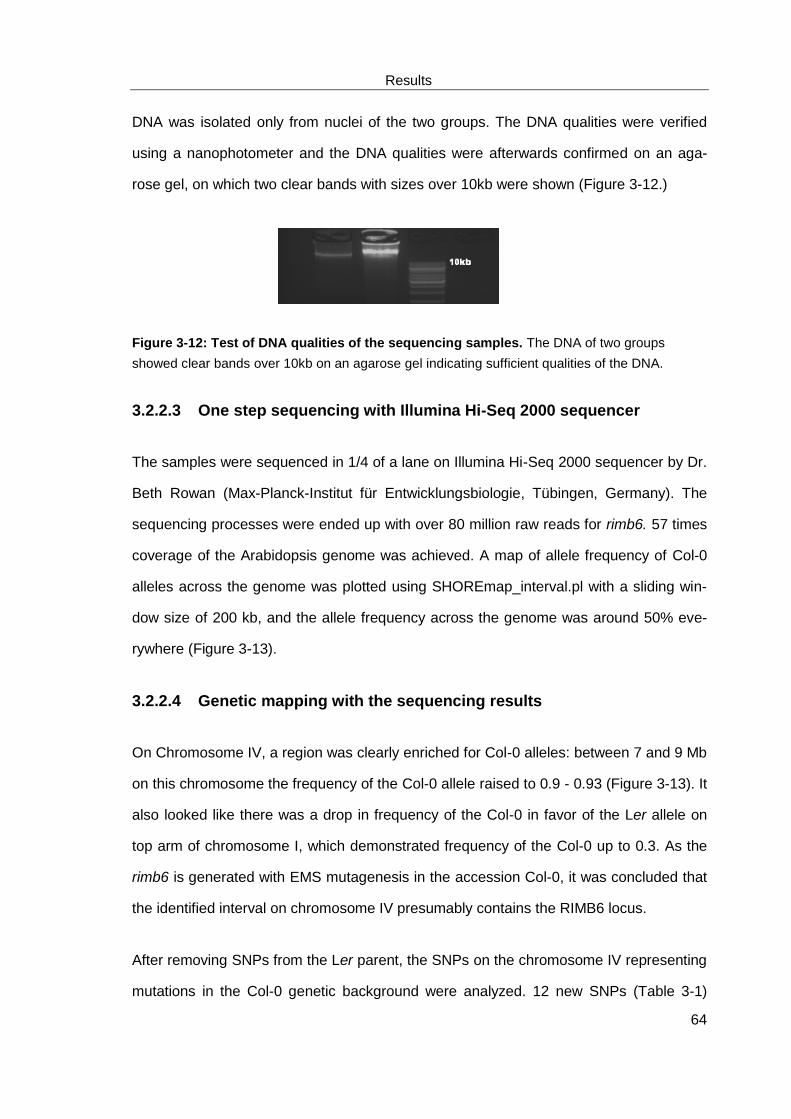
Results
64
DNA was isolated only from nuclei of the two groups. The DNA qualities were verified
using a nanophotometer and the DNA qualities were afterwards confirmed on an aga-
rose gel, on which two clear bands with sizes over 10kb were shown (Figure 3-12.)
Figure 3-12: Test of DNA qualities of the sequencing samples. The DNA of two groups
showed clear bands over 10kb on an agarose gel indicating sufficient qualities of the DNA.
3.2.2.3 One step sequencing with Illumina Hi-Seq 2000 sequencer
The samples were sequenced in 1/4 of a lane on Illumina Hi-Seq 2000 sequencer by Dr.
Beth Rowan (Max-Planck-Institut für Entwicklungsbiologie, Tübingen, Germany). The
sequencing processes were ended up with over 80 million raw reads for rimb6. 57 times
coverage of the Arabidopsis genome was achieved. A map of allele frequency of Col-0
alleles across the genome was plotted using SHOREmap_interval.pl with a sliding win-
dow size of 200 kb, and the allele frequency across the genome was around 50% eve-
rywhere (Figure 3-13).
3.2.2.4 Genetic mapping with the sequencing results
On Chromosome IV, a region was clearly enriched for Col-0 alleles: between 7 and 9 Mb
on this chromosome the frequency of the Col-0 allele raised to 0.9 - 0.93 (Figure 3-13). It
also looked like there was a drop in frequency of the Col-0 in favor of the Ler allele on
top arm of chromosome I, which demonstrated frequency of the Col-0 up to 0.3. As the
rimb6 is generated with EMS mutagenesis in the accession Col-0, it was concluded that
the identified interval on chromosome IV presumably contains the RIMB6 locus.
After removing SNPs from the Ler parent, the SNPs on the chromosome IV representing
mutations in the Col-0 genetic background were analyzed. 12 new SNPs (Table 3-1)

Results
65
were detected in the coding sequences, in which 11 were synonymous SNPs that gave
a rise to amino acid substitutions.
Table 3-1: The 12 SNPs on top arm of chromosome IV. 11 SNPs were nonsynonymous and 1
was synonymous. Apart from the new SNP on 7442672 (introduced a stop codon), all the other
nonsynonymous new SNPs caused substitutions of amino acid.
Position Reference
base
Alternate
base Gene
Codon
position in
gene
Type Reference
aa
New
aa
7078331 G A AT4G11750 220 Nonsyn R C
7442672 G A AT4G12560 858 Nonsyn W *
8219957 A - AT4G14272 214 Nonsyn K X
8699123 T A AT4G15236 1621 Nonsyn L M
8974535 C - AT4G15760 14 Nonsyn G X
8975844 C - AT4G15765 755 Nonsyn G X
8976974 A - AT4G15765 136 Nonsyn W X
8980212 G - AT4G15780 540 Nonsyn T X
8980214 T - AT4G15780 538 Nonsyn T X
8989799 C - AT4G15810 2060 Nonsyn G X
8993849 T - AT4G15820 794 Nonsyn V X
8126091 G A AT4G14096 1296 Syn R R
At position 7442672 bp on top arm of chromosome VI in AT4G12560 (Constitutive ex-
presser of PR genes CPR1) a G to A mutation introducing a stop codon in the gene was
identified as final candidate mutant locus, as the frequency of the Col-0 allele at this po-
sition raised to ca. 0.93. The point mutation at position 7442672 bp on top arm of chro-
mosome VI in rimb6 was verified by PCR and re-sequencing (data not shown). As a con-
trol, the parental line T19-2 was also analyzed and the result showed that T19-2 did not
contain the point mutation at position 7442672 bp. Additionally, a SSLP marker
cer461279, which locates on position 11016373 bp on chromosome 4 near AT4G12560,
was applied in a genotyping test of F2 plants rimb6 x Ler. The population with mutant
phenotype gave a high ration of Col-0 alleles (data not shown).

Results
66
Fig
ure
3-1
3:
Map
of
Co
l-0 a
llele
fre
qu
en
cy c
ros
s t
he A
rab
ido
psis
gen
om
e w
ith
win
do
ws s
ize o
f 200
kb
. A
part
fro
m c
hro
mo-
som
e I
V th
e C
ol-
0 a
llele
fre
quency a
cro
ss the
ge
nom
e w
as a
rou
nd 5
0%
every
wh
ere
. O
n t
he c
hro
mosom
e I
V it
was e
nriche
d for
Col-0 a
llele
s, esp
ecia
lly o
n t
he r
eg
ion b
etw
een 7
an
d 9
Mb o
n th
is c
hro
mosom
e fre
que
ncy o
f th
e C
ol-
0 a
llele
rais
ed u
p to
0.9
3.
A
dro
p in fre
que
ncy o
f th
e C
ol-
0 in favor
of th
e L
er
alle
le w
as a
lso d
em
onstr
ate
d o
n t
op a
rm o
f chro
moso
me I,
where
th
e a
llele
fre
-
quency o
f th
e C
ol-
0 w
as f
ound t
o b
e d
ecre
ased t
o 0
.3.

Results
67
3.2.3 Confirmation of the final candidate locus of RIMB6 by transcription
analysis using T-DNA knock-out line
The identified candidate locus At4g12560 is being confirmed using transcript analysis of
2CPA in wildtype Col-0 and a homozygous T-DNA insertion line SALK_111420 (Figure
3-14), in which the T-DNA was inserted in the sequence of an F-box associated domain
predicted by using CDD database.
Figure 3-14: The T-DNA insertion line SALK_111420. The T-DNA insertion line SALK_111420 was obtained from the Nottingham Arabidopsis Stock Centre (NASC) (http://arabidopsis.info/). The T-DNA of pROK2 was inserted on the position 7742361 bp on chromosome IV (Figure 3-12), in the region of the first exon of locus At4g12560.
3.2.4 At4g12560, the final candidate locus for RIMB6
On the position 858 bp in the coding sequence of the final candidate locus At4g12560
there was a G to A substitution introducing a stop codon (Figure 3-15). At4g12560 en-
codes CPR1 (Constitutive Expresser of PR Genes 1, also known as CPR30) which is an
F-Box containing protein that acts as a negative regulator of defense response and tar-
gets resistance proteins (Guo et al., 2009).
Figure 3-15: The conserved domain of the At4g12560. It has 412 amino acids and might contain an F-box-like domain and an F_box_assoc_1 domain. The stop codon was identified on the F_box_assoc_1 domain.
According to conserve domain database (CDD) on NCBI
(http://www.ncbi.nlm.nih.gov/Structure/cdd/cdd.shtml), At4g12560 might contain two
SALK_111420

Results
68
conserved domains: an F-box (a member of F-box-like superfamily, cl02535), which is a
receptor for ubiquitination targets; and an F-box associated domain type 1
(F_box_assoc_1, TIGR01640) which is an F-box protein interaction domain on C-
terminal region. It contains a motif with 60 amino acids and is involved in ubiquitination
as target proteins to mark them for degradation. Yeast-two-hybrid experiments support
the idea that most members of F-box protein interaction domain are interchangeable F-
box subunits of SCF E3 complexes (Guo et al., 2009).
The stop codon identified in rimb6 was located on the sequencing region of the F-box
protein interaction domain, and that could cause a deactivation of the F-Box protein
CPR1.
3.2.5 RIMB6 might be correlated with plasma metal transporters AtIRT1
and AtPDR8
Using Genemaina database (http://www.genemania.org/) based on microarray data, a
prediction was performed to check the relationships between RIMB6 and two plasma
metal transporters AtIRT1 (AT4G19690) and AtPDR8 (AT1G59870) (Figure 3-16). It is
concluded that the RIMB6 (CPR30) may correlate with AtIRT1 via an Arabidopsis- S-
phase kinase-associated protein MEO (AT2G20160). The MEO strongly interacts with
RIMB6 in vitro, proven by yeast-two-hybrid (Guo et al., 2009), while AtIRT1 was shown
to coexpress with MEO, according to the microarray data according the microarray data
(GEO accession: GSE21611, Moreno-Risueno et al., 2010). The RIMB6 and AtPDR8
expression activities are also not directly correlated. However AtPDR8 contained an
ATP-binding cassette (ABC) domain, which is also contained by an ABC transporter G
family member PDR11 (AT1G66950). According the microarray data (GEO accession:
GSE30223), the PDR11 is predicted to coexpress with ASK16 (AT2G03190, an Ara-
bidopsis S-phase kinase-associated protein 1), which was proven to interact with RIMB6
in vitro (Guo et al., 2009). In conclusion, the RIMB6 could correlate with AtPDR8 via
ASK16 and AtPDR11.

Results
69
Figure 3-16 Prediction of the relationship between RIMB6 (CPR30) and AtIRT1 and AtPDR8 according to the Genemania database. The RIMB6 (CPR30) is correlated with AtIRT1 via MEO, an Arabidopsis- S-phase kinase-associated protein. The metal transporter AtPDR8 on plasma membrane of Arabidopsis may be correlated with RIMB6 via ASK16 (an Arabidopsis S-phase kinase-associated protein 1) and AtPDR11 (a plasma membrane-localized ABC transporte in Arabidopsis)
3.3 An eQTL of 2CPA regulator between Col-0 and Ler was
identified on top arm of chromosome III
3.3.1 Genetic mapping of the rimb3 mutation with SSLP markers
The mutant line rimb3 (based on genetic background Col-0) was crossed to accession
Landsberg erecta (Heiber et al., 2007). To select the individuals bearing homozygote
recessive repressors of 2CPA expression, the plants in the segregating F2 population
were screened for low luciferase activity which was 15 - 35% relative to the parental line
T19-2. In this way a mapping population was generated and the SSLP mapping was
performed to identify the locus of recessive mutation in Arabidopsis genome.

Results
70
3.3.2 An eQTL of 2CPA was identified based on Ler genetic background
To cover the five chromosomes of Arabidopsis, 29 SSLP markers (Figure 3-17) were
selected to design primers for the mapping PCRs. From the mapping population (F2
population of rimb3 X Ler), 43 lines with low luciferase were chosen to isolate genomic
DNA as templates in the mapping PCR. In addition, PCR with a pair of specific primers
binding to luciferase sequence was performed to confirm the presence of the luciferase
construct in the selected lines.
Figure 3-17: Overview of the applied SSLP markers on the Arabidopsis genome. The Map was designed by Heiber (2007) and the information of the markers was from the database of the Cereon/ Monsanto Arabidopsis Polymorphism Collections (http://www.arabidopsis.org /browse/Cereon/).
The genetic mapping was aimed to genotype the mapping population for homozygous
Col-0 allele at a marker on the candidate locus of RIMB3. Interestingly, at marker M1,
which is located on the position 4208576 bp on the top arm of chromosome III, the geno-
typing analysis demonstrated a relative high frequency of Ler alleles. The value of re-
combination frequency R was up to 72% (Figure 3-18) indicating a Ler-specific recessive
repressor or Col-0 specific inducer of 2CPA on chromosome III near the position of
marker M1.

Results
71
Figure 3-18: An electrophoresis displayed high frequency of PCR products of Ler genetic background on the position of marker M1 (on Chr III). The value of recombination frequency R was 71.97%. The picture demonstrated the bands of the PCR products on a 4% agarose gel, on which the upper bands stand for the Col-0 genetic background (1), lower bands represented Ler background (3) and the double bans indicted heterozygote on the position of M1 (2).
It is assumed that a locus near the marker M1 could be an expression quantitative trait
locus (eQTL) regulating expression of 2CPA in Arabidopsis. Additionally, a rescreening
of seedlings of the F3 progeny showed low luciferase activities of all seedlings tested.
3.3.3 Confirmation of the eQTL
The eQTL was confirmed with F3 progeny of the mapping F2 population. While 19 F3
plants, whose genetic background were confirmed as Ler on top arm of chromosome III,
were selected and cultivated on MS medium, another 20 lines showing Col-0 genetic
background on top arm of Chromosome III were chosen for the further analysis. Quanti-
fication of 2CPA-promoter driven luciferase activity was performed at the 10 day-old F3
seedlings, in which 89% of the seedlings with Ler background on chromosome III top
arm had lower than 10% luciferase activity relative to T19-2, whereas most of the seed-
lings (85%) with Col-0 background on chromosome III showed relative high luciferase
activity (over 30% relative to T19-2, Figure 3-19).The previous hypothesis was therefore
confirmed: the eQTL and low luciferase activities correlate in the mapping population.

Results
72
Figure 3-19: F3 progenies of the mapping population were screened for luciferase activi-
ties. The samples with Ler genetic background on chromosome III top arm were labeled as red
and the samples with Col-0 as blue. The result confirmed the eQTL on the top arm of chromo-
some III.
3.3.4 Genetic mapping of the eQTL with SSLP
About 10000 plants of the F2 population of rimb3 X Ler were screened at an age of 10
days for low luciferase activity. 2000 lines showing 10-50% (relative to the parental line
T19-2) luciferase activity controlled under 2CPA promoter were determined as individu-
als bearing the homozygous eQTL alleles and they were selected for further genetic
mapping with SSLP markers. Fine mapping was performed according to Jander et al.,
(2002), in which 420 lines of low luciferase activity were included and 15 SSLP markers
(Figure 3-20) targeting to the region near M1 on top arm of chromosome III were ap-
plied. The candidate locus was finally determined on a 77 kb region on chromosome III
between the markers cer455911 on BAC MIL23 and cer457003 on BAC MSD21 (Fig-
ures 3-20 and 3-21). The candidate region encodes 23 genes, which were screened for
the SNPs and Indels variation in their promoter- and coding sequence according to the
Monsanto Arabidopsis Polymorphism and Ler Sequence Collections
(http://www.arabidopsis.org/browse/Cereon/index.jsp). Finally, four from the 23 candi-
date genes were determined as candidates containing natural variations of amino acid
between accessions Col-0 and Ler (Figure 3-20, Table 3-1).

Results
73
Fig
ure
3-2
0:
Deta
iled
PC
R r
esu
lts o
f S
SL
P m
ap
pin
g o
f th
e e
QT
L o
n t
he t
op
arm
of
ch
rom
oso
me I
II.
The a
pp
lied m
ark
ers
are
dis
-
pla
ye
d o
n t
he t
op o
f th
e t
ab
le,
tog
eth
er
with t
heir p
ositio
ns a
nd B
AC
s.
Each
lin
e f
rom
left
to r
ight
describ
es t
he m
app
ing
re
sults o
f one in
di-
vid
ua
l fr
om
the m
ap
pin
g p
opu
lation.
The n
um
ber
‘‘1’’
repre
sents
the P
CR
resu
lt o
f C
ol-
0 g
en
etic b
ackgro
un
d o
f a m
app
ing s
am
ple
with a
specific
mark
er;
‘‘2
’’ re
pre
sents
a h
ete
rozygote
of
Co
l-0 a
nd
Ler,
and ‘
‘3’’
repre
se
nts
Ler
ge
netic b
ackgro
und
. T
he s
hort
re
d l
ines d
em
on-
str
ate
recom
bin
ant
to L
er
alle
les.
The g
reen
colo
red P
CR
resu
lts d
em
onstr
ate
a t
rend
: th
e c
loser
the p
ositio
n i
s t
o t
he r
eg
ion b
etw
een
cer4
559
23 a
nd c
er4
570
03,
the m
ore
alle
les w
ith
Ler
genetic b
ackgro
und a
re s
ho
wn a
ccord
ing t
o t
he
SS
LP
mapp
ing.
Th
is t
rend in
dic
ate
s
that
on t
his
reg
ion a
locus f
rom
Ler
ca
used a
sim
ilar
muta
nt
ph
enoty
pe (
low
lucifera
se a
ctivity)
of a
ll th
e m
ap
pin
g in
div
idua
ls.

Results
74
Figure 3-21: Overview of the eQTL mapping. The mapping of eQTL was finished on a region between marker cer455911 and cer457003, where 23 loci were located on, among which only 4 loci had polymorphism between Col-0 and Ler in their coding sequence. The four loci were marked with a red line.
Table 3-2: Four candidate loci for the eQTL. Between markers cer455911 and cer457003 on chromosome III, four loci could be identified to show polymorphisms in amino acids between accession Col-0 and Ler. AT3G21570, AT3G21660 and AT3G21670 have substitutions in ami-no acid sequences. AT3G21660 contains a 25 bp insertion in Ler.
Gene Locus Variation beteewn Col-0 and Ler
Position DNA Amino Acid
AT3G21570 unknown protein Substitute 7600366 A->T V->D
AT3G21620 ERD (early-responsive to dehydration stress) family protein
Substitute 7612481 A->G Y->H
AT3G21660 UBX domain-containing protein
insertion 7626624 25bp in Ler
AT3G21670 Major facilitator super-family protein
Substitute 7628822 T->A Y->F

Results
75
3.3.5 Transcription analysis of the candidate genes of the eQTL using T-
DNA knock-out line
For the transcription analysis of 2CPA, T-DNA insertion lines were obtained for all four
candidate genes of interest, in which the T-DNA were inserted in coding sequence (Fig-
ure 3-22). After genotyping, the homozygote T-DNA insertion lines and wild types were
distinguished and selected for the further analysis. In order to establish the same genetic
background of the plants, only the wildtypes obtained from the seeds of T-DNA Insertion
lines were applied as control lines of wildtype.
Figure 3-22: T-DNA insertion lines were applied to check the effects of knock-out of the 4 candidates of the eQTL. All T-DNA lines contained an insertion over 10 kb in the coding se-quences, which could knock down the locus in the plants. The plants with loss of function of each candidate locus for the eQTL were further analyzed with transcript analysis of 2CPA.
The T-DNA insertion lines were grown in parallel to wildtype Col-0 on MS medium under
short-day condition in controlled environment and the 10 day-old seedling were harvest-
ed for analysis of 2CPA transcript level of 2CPA. The transcript levels of 2CPA in the T-
DNA insertion lines were evaluated relative to the housekeeping gene Actin7. The tran-
script levels were compared to the 2CPA expression in wildtypes. The result of the tran-
script analysis of the four candidate loci is shown below (Figure 3-23). Among the four
final candidates, only the T-DNA insertion line for locus At3g21660 showed a significant

Results
76
reduction of 2CPA expression (67% relative to 2CPA expression level in Col-0). The
knock-out line of the locus At3g21570 demonstrated slight up-regulation (103% relative
to 2CPA expression level in Col-0), while the 2CPA expression in the knock-out lines of
At3g21620 and At3g21670 were insignificantly down-regulated (94%).
As conclusion, At3g21660 was considered as the final candidate of the eQTL, which
may function as a Col-0-specific positive regulator or Ler-specific repressor of 2CPA
expression in Arabidopsis. The eQTL could also be one of the reasons of natural varia-
tion in expression of 2CPA in accessions of Arabidopsis thaliana (Juszczak et al., 2012).
In the comparison of 2CPA expression in seven Arabidopsis thaliana accessions, the
2CPA transcript level in accession Col-0 is higher than it is in accession Ler).
Figure 3-23: Relative transcript level of 2CPA in homozygous knock-out line of the final 4 candidate loci of the eQTL. The transcript level of 2CPA in wildtype Col-0 was set as 100%. The data are means of 7-10 samples (± SD) grown in three independent experiments. ** indi-cates a significant differences from the value of Col-0 (Student test t-test, P<0.01)
3.3.6 Natural variation of At3g21660 between Col-0 and Ler
In the first exon at the position 33 of the gene At3g21660, a sequence of 25 bp (ATT-
GATCAGCTCCTTTATTGAGGTC) is inserted in the genome of Ler (Figure 3-24).
0
0,2
0,4
0,6
0,8
1
1,2
1,4
Col-0 At3g21570 At3G21620 At3g21660 At3g21670
Rela
tive t
ranscript
levels
of
2C
PA
**

Results
77
Figure 3-24: In the first exon of At3g21660, an insertion with 25 bp as natural variation between Arabidopsis accession Col-0 and Ler was identified. The data of the inserted se-quence was obtained from database of 1001 Genomes Project and verified by Sanger sequenc-ing.
In addition to 8 extra codons it introduced a frame shift in Ler genome and caused a
complete loss-of-function of this locus. The insertion was verified by PCR together with
other four accessions with marker cer455923 (Figure 3-25). The results of PCR were
according to the Arabidopsis SNP Sequence Viewer (http://natural.salk.edu/cgi-
bin/snp.cgi), in which Bay-0, Van-0, Cvi-0 and Ler contained an insertion on the position
of marker cer455923, while C24 and Col-0 did not.
Figure 3-25: Confirmations of the insertion of the eQTL in different Arabidopsis acces-sions. Genomic DNA of different Arabidopsis accessions were used as DNA templates in a PCR with SSLP marker cer455923, which locates on the flaking sequence of the eQTL inser-tion, the lower bands indicated the PCR without the insertion. A: The PCR with six different Ara-bidopsis accessions showed, that C24 and Col-0 do not contain the eQTL insertion, whereas Bay-0, Van-0, Cvi-0 and Ler contain an insertion in the position of marker cer455923. B: Using marker cer455923, three PCRs were performed with the genomic DNA of Ler, the mixture of Ler and Col-0, and Col-0 as DNA templates. The upper bands, which were the PCR products of Ler, Indicated that Ler contain a insertion on the position of marker cer45923 while Col-0 did not.
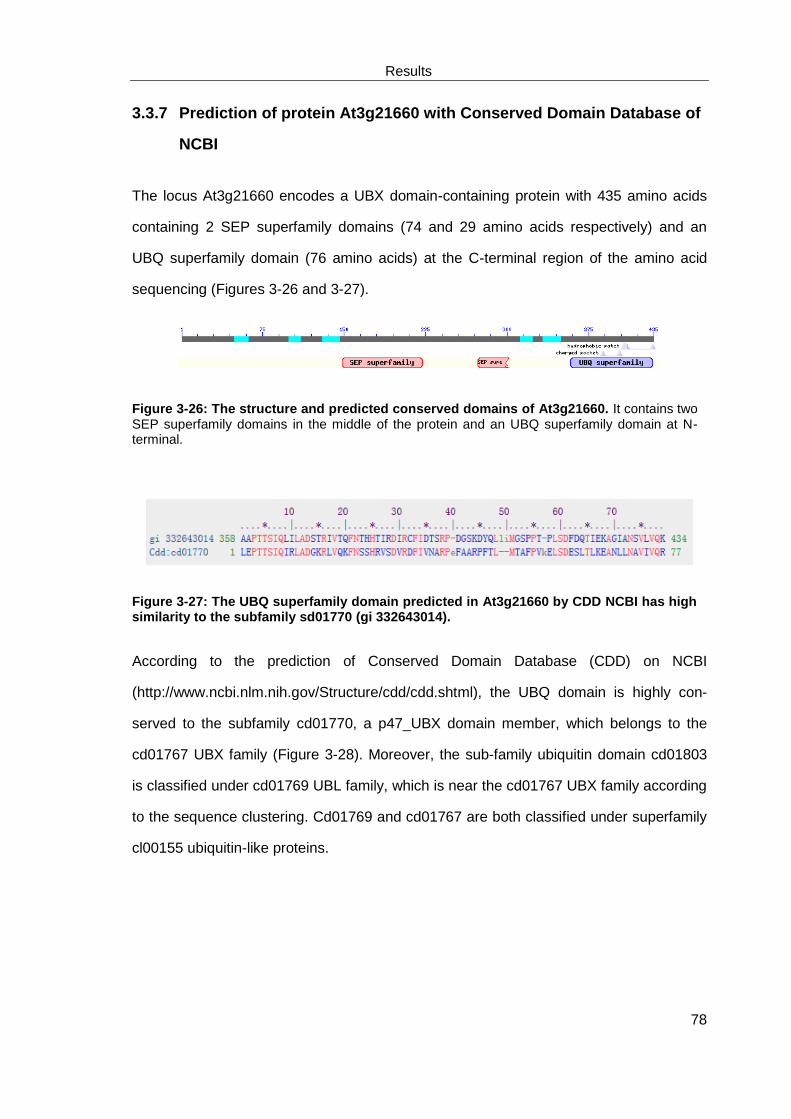
Results
78
3.3.7 Prediction of protein At3g21660 with Conserved Domain Database of
NCBI
The locus At3g21660 encodes a UBX domain-containing protein with 435 amino acids
containing 2 SEP superfamily domains (74 and 29 amino acids respectively) and an
UBQ superfamily domain (76 amino acids) at the C-terminal region of the amino acid
sequencing (Figures 3-26 and 3-27).
Figure 3-26: The structure and predicted conserved domains of At3g21660. It contains two SEP superfamily domains in the middle of the protein and an UBQ superfamily domain at N-terminal.
Figure 3-27: The UBQ superfamily domain predicted in At3g21660 by CDD NCBI has high similarity to the subfamily sd01770 (gi 332643014).
According to the prediction of Conserved Domain Database (CDD) on NCBI
(http://www.ncbi.nlm.nih.gov/Structure/cdd/cdd.shtml), the UBQ domain is highly con-
served to the subfamily cd01770, a p47_UBX domain member, which belongs to the
cd01767 UBX family (Figure 3-28). Moreover, the sub-family ubiquitin domain cd01803
is classified under cd01769 UBL family, which is near the cd01767 UBX family according
to the sequence clustering. Cd01769 and cd01767 are both classified under superfamily
cl00155 ubiquitin-like proteins.

Results
79
Figure 3-28: 3D structure of the UBQ superfamily domain in At3g21660. The modeling result demonstrated that the conserved domain UBQ contains one α-helix and seven β-sheets. The amino acid sequences were submitted to the online alignment-based modeling tool SWISS-MODEL (http://swissmodel.expasy.org) and the structure was displayed by using the Swiss-pdbViewer DeepView 4.1 (http://swissmodel.expasy.org/spdbv)
3.3.8 At3g21660 positively regulates the 2CPA and 2CPB
A transcription analysis was performed with the T-DNA insertion line GABI_400B11 to
check the function of the eQTL At3g21660 in antioxidant defense system of plant cells.
2-Cys peroxiredoxin A (2CPA, At3g11630), 2-Cys peroxiredoxin B (2CPB, At5g06290),
stromal ascorbate peroxidase (sAPx, At4g08390) and thylakoid ascorbate peroxidase
(tAPx, At1g77490) were studied in this analysis (Figure 3-29). Expression levels of
2CPA, 2CPB, sAPx and tAPx relative to the housekeeping gene Actin7 in the eQTL
knock-out line and wildtype Col-0 were analyzed in 10 day-old seedlings.
In the eQTL knock-out line the expression levels of 2CPA and 2CPB were significantly
decreased: in comparison to wildtype Col-0, the relative expression levels of 2CPA and
2CPB were 68% and 76% in the knock-out line. No significant change in the expression
of sAPx and tAPx was observed: their relative expression levels to the levels in wildtype
were 99% and 93% respectively. It is presumed that the eQTL regulates the expression
of 2-cys-peroxiredoxin specifically

Results
80
Figure 3-29: Transcript levels of 2CPA, 2CPB, sAPx and tAPx in homozygous T-DNA knock-out lines of At3g21660 relative to their levels in wildtype Col-0. The data are means of 7-10 samples (± SD) grown in three independent experiments. ** indicate significant differ-ences from the transcript value in Col-0 (t-test, P<0.01)
3.3.9 Test for the polymorphism in promoter of Col-0 and Ler
According to the Cereon database (http://www.arabidopsis.org/browse/Cereon/), on po-
sition 3672064 bp of chromosome III, one substitution G to A between Arabidopsis ac-
cession Col-0 and Ler was found, that is indicated by marker cer464400. To test effect of
this substitution on 2CPA expression, a transient gene expression was performed with
plasmids expressing luciferase under control of Col-0 promoter and Ler promoter. Two
groups of 10 day-old Arabidopsis seedlings (Col-0) were infiltrated respectively with the
Agrobacterium expressing luciferase under control of 2CPA promoter of Col-0 (p2CPA-
Col:Luc) and the Agrobacterium expressing luciferase under control of 2CPA promoter
of Ler (p2CPA-Ler:Luc). The luciferase reporter line T19-2 was used as positive control.
After an infiltration in luciferin, the 2CPA promoter activities were checked by measure-
ment of the luciferase activities. The activities of the promoters of Col-0 and Ler did not
show significant difference (Figure 3-30), indicating that the polymorphism of 2CPA ex-
pression between Col-0 and Ler is not caused by the G to A substitution in the promoter
region of 2CPA of Col-0 and Ler.
0
0,2
0,4
0,6
0,8
1
1,2
2CPA 2CPB sAPx tAPx
Tra
nscript le
vels
in
At3
g21660 k
nockout lin
e
rela
tive
to in w
ildty
pe
** **

Results
81
Figure 3-30: Transient gene expression of 2CPA promoters of Col-0 and Ler. A: Col-0 infiltrated with Agrobacteria expressing luciferase under control of the 2CPA promoter of Col-0 (p2CPA-Col:Luc). B: luciferase gene reporter line T19-2. C: Col-0 infiltrated with Agrobacterium expressing luciferase under control of plasmid with 2CPA promoter of Ler (p2CPA-Ler::Luc). The picture was taken from same plate.
3.3.10 Prediction of the function network of At3g21660
Based on the microarray data of transcriptome analysis of Arabidopsis thaliana, the
online software of gene function predictions Genemaina predicted a possible network of
all the eQTL’s partners of interactions, coexpression, co-localization and protein with
similar domains (Figure 3-31).
The analysis predicted a functional correlation between the eQTL (AT3G21660) and
three CDC48 proteins and furthermore it demonstrated 12 proteins sharing an UBX do-
main with the eQTL. Among the 12 UBX domain-containing proteins, five PUX proteins
(PUX1 to PUX5) have strong physical interaction with ATCDC48, which functions as an
important motor and regulator for the turnover of ubiquitylated proteins (Buchberger,
2010).

Results
82
Figure 3-31: Prediction of function’s network of At3g21660 with Genemania database. The results demonstrated strong prediction between the eQTL At3g21660 and 3 CDC48 pro-teins. According to the database 11 UBX proteins have physical interaction with CDC48, espe-cially the ATCDC48. Furthermore, the eQTL shared the UBX domain with all the UBX protein.
3.3.11 Coexpression analysis of Ubox protein with CDC48, PUX2 and 2CPA
Since the eQTL contains a UBX domain, it is assumed that the eQTL might have a simi-
lar function to other UBX-containing proteins and interact with CDC48, the interacting
partners of PUX proteins. Coexpression analysis was performed to confirm the hypothe-
sis using bioinformatical database Genevestigator (https://www.genevestigator.com). In
all the analysis the P value was set to 0.05.
3.3.11.1 The eQTL (AT3G21660) and PUX2 might have a negative
correlation
According to the data of expression pattern under different conditions, the eQTL and the
most well studied UBX containing proteins PUX2 (AT2G01650), which is concerned as a
positive regulator of CDC48, are negatively correlated (Figure 3-32).

Results
83
The PUX2 was down-regulated under cold, heat, circadian change and germina-
tion/stratification and iron deficiency condition as well, whereas the expression of the
eQTL was not much changed or even increased. Under hypoxia, high/low nitrogen
treatment conditions and in mock treated roots as well as desiccated seed samples, the
PUX2 was up-regulated, while the eQTL was down in most of the cases.
Figure 3-32: The result of coexpression analysis of the eQTL and PUX2 with Genevesti-gator. The blue dots stand for the PUX2 and the green dots stand for the eQTL. The eQTL and PUX2 protein were negatively correlated under different nutrients condition, germination and pH conditions, photoperiod conditions and several different stresses. The direction to the left stands for down-regulation, and to the right represents up-regulation.
3.3.11.2 2CPA negatively correlated with ATCDC48
Under biotic, chemical, drought stress and UV treatment, the 2CPA was down-regulated
but the CDC48 was up-regulated (Figure 3-33). The CDC48 was down-regulated under
iron deficiency and methyl jasmonate (MeJa) treatment, while 2CPA was up-regulated.

Results
84
Figure 3-33: The result of coexpression analysis of the 2CPA and ATCDC48 with Genevestiga-tor. The brown color represents 2CPA and light red color is for ATCDC48. The 2CPA and ATCDC48 were negatively correlated under different biotic and abiotic stresses syringlolin, MeJa and ABA treatments. The direction to the left stands for down-regulation, and to the right represents up-regulation.
3.3.11.3 PUX2 is positively correlated with ATCDC48
The expression of PUX2 and CDC48 showed the same trend (Figure 3-34). During bio-
tic, chemical and UV treatment both were highly expressed whereas under KCL, ABA,
MeJa and iron deficiency treatment, the two genes were both down-regulated. The most
changes were over 1-fold.

Results
85
Figure 3-34: The result of coexpression’s analysis of the PUX2 and ATCDC48 according to the Genevestigator. Green color stands for PUX2, red color represents ATCDC48. The PUX2 protein positively correlated with ATCDC48 under different biotic stresses (CalCuV and P.Syringae treatments), abiotic stresses (UV, drought, and light), in syringolin and KCl study, ABA, MeJa and iron deficiency studies. The direction to the left stands for down-regulation, and to the right represents up-regulation.
3.3.11.4 PUX2 is negatively correlated with 2CPA
The microarray data of the expression of PUX2 and 2CPA demonstrated opposite trend
(Figure 3-35) under many conditions except cold and heat treatment. In the red/blue light
study and sucrose study, under germination with different stratification time as well as
circadian changes as well, the expression of PUX2 was repressed while 2CPA was high-
ly expressed. Under nitrogen treatment, night extension, hypoxia and light/drought as
well as osmotic stress, the PUX2 was up-regulated while 2CPA level was decreasing.

Results
86
Figure 3-35: The result of coexpression’s analysis of the 2CPA (brown) and PUX2 (Green) according to the Genevestigator. The 2CPA and PUX2 were negatively correlated under different abiotic stresses (cold, heat, hypoxia, drought and osmotic), different nutrient treat-ments, in different light qualities, photoperiod and germination studies. The direction to the left stands for down-regulation, and to the right represents up-regulation.
3.3.12 The eQTL and RIMB6 might be correlated via ASK9 and ASK16
Because the eQTL and the RIMBs have similar functions in regulating 2CPA expression,
they might be involved in a same regulating network in the plant cell. A prediction of the
relationships of the eQTL and all the RIMBs was given by using Genemaina database.
Interestingly, the eQTL and RIMB6 was correlated via ASK9 (ARABIDOPSIS SKP1-LIKE
9) and ASK16 (ARABIDOPSIS SKP1-LIKE 9) (Figure 3-36).

Results
87
Figure 3-36: Prediction of the relationship of the eQTL (At3g21660) and RIMB6 (CPR30) according to the Genemania database (GEO accession: GSE15617). The CPR30 physically interacted with 6 S-phase kinase-associated proteins (SKP), among which ASK9 and ASK16 were coexpressed with the eQTL (At3g21660).
RIMB6 (CPR30) was already known to interact with ASK9 and ASK16 physically, which
was proved by yeast-two-hybrid (Guo et al., 2009). In addition, according to the result of
the microarray data the expression of germinating Arabidopsis seeds (GEO accession:
GSE30223) the eQTL is coexpressed with ASK9 (Narsai et al., 2009). Furthermore ac-
cording to the microarray data GSE15617 on GEO, the eQTL is also coexpressed with
ASK16 (Kram et al., 2009).
The coexpression of the eQTL, ASK9 and ASK16 was further confirmed by using re-
sponse viewer of genevestigator database. At all the developmental stages the eQTL,
ASK9 and ASK16 were expressed on a low level, all levels of expression (signal intensi-
ty on 22k array) were below 9.0 (Figure 3-37). All the three genes have highest expres-
sion at the mature siliques stage (8.0, 8.1 and 8.7 respectively).

Results
88
Figure 3-37: The eQTL (red, At3g21660), ASK9 (blue, At3g21850) and ASK16 (green, At2g03190) are coexpressed at all stages of development according to the analysis of genevestigator. The 3 genes are expressed on a low level at the stages of germinated seed, seedling, young rosette, developed rosette stage, bolting stage, young flow stage, developed flower stage, flower and siliques, mature siliques stage, and senescence stage. At mature si-liques stage, the eQTL, ASK9 and ASK16 express at highest level.
The microarray data of the expression of the eQTL, ASK9 and ASK16 on Genevestiga-
tor was displayed across different samples and experiments, and exhibited coexpression
of the three genes (Figure 3-38). In most experiments the eQTL, ASK9 and ASK16 were
expressed on low levels, which was set as lower than 10 of the signal intensity on 22k
array. However the ASK16 had much higher expression levels than the eQTL and ASK9
in the embryo and endosperm studies. For instance, in suspensor of embryo and chala-
zal endosperm the expression level of ASK16 were up to 13 and 14 respectively (the
medium level was set up to 12.3), while the levels of the eQTL and ASK9 were lower
than 9.

Results
89
Figure 3-38: The expression levels of the eQTL (red, At3g21660), ASK9 (blue, At3g21850) and ASK16 (green, At2g03190) across selected samples and experiments on Genevesti-gator. The signal intensity was set according on a 22k array. In most samples the 3 genes were expressed on similar levels and they showed a same trend across different parts and develop-mental stages of plant.

Results
90
3.4 Identification and characterization of mutant rimb3
3.4.1 Co-segregation analysis of low luciferase and chlorosis phenotype
The rimb3 mutant line (Col-0 background) was crossed to the accession Ler. A co-
segregation analysis was subsequently performed with a population of 700 F2 plant of
rimb3 x Ler. In this population 563 plants were wildtype like, whilst 137 displayed defec-
tive growth, which according to the Mendelian ratio in 3:1. It was therefore verified that
the mutation inherited as a single recessive locus.
20 plants demonstrating chlorosis phenotype and 40 wildtype like plants were selected
and their seeds were cultivated on MS medium in 96 wells microtiter plats. Quantification
of luciferase activity was performed in 10 day-old seedlings. From the 20 lines of chloro-
sis plants (Figure 3-39), all the offspring demonstrated low luciferase activity (30 - 50%
relative to T19-2), while about 20% offspring of the 40 wildtype like plants showed low
luciferase activity. The co-segregation of low luciferase and chlorosis phenotype was
confirmed.
Figure 3-39: An example of co-segregated F2 plant of rimb3 X T19-2. The plants in the mid-dle were from the F2 generation of rimb3 X T19-2. It demonstrated a typical phenotype of rimb3 : abnormal leaves and chlorosis. About 20% of the F2 plants were phenotypically like rimb3.
Rimb3 F2 rimb3 X T19-2 T19-2

Results
91
3.4.2 Genetic mapping of rimb3 with next generation
sequencing
3.4.2.1 Selection of the individuals bearing rimb3 allele
Since the phenotype of the mutant line rimb3 was not sufficient to distinguish the mutant-
phenotypical plants in the F2 Population and the eQTL also disturbed the mapping of
rimb3, a rescreening of F3 population for low luciferace activity was performed to ensure
that all plants in the mapping population were bearing the mutant allele and therefore the
plants of F3 generation was used for the one step genomic sequencing. 200 lines with
low luciferase activity in F2 population were selected. Each line was checked with a
SSLP marker (cer455923) representing the eQTL on top arm of chromosome III, and
only the lines with pure Col-0 genetic background on the eQTL position were selected.
In addition, PCR with a pair of specific primers binding to luciferase sequence was per-
formed to confirm that all the samples contain the luciferase reporter gene. Their low
luciferase activities were decided by the homozygous recessive mutant locus.
3.4.2.2 Isolation of nuclei DNA
From each line approximately 30 F3 plants were grown in poor-soil. At an age of four
weeks the plants were harvested and pooled into 5 groups according to the capacity of
nuclei DNA isolation method. DNA isolation was performed via nuclei isolation to avoid
the noise of plastid DNA. The quality was verified using nanophotometer and electropho-
resis on an agarose gel, on which eight clear bands with sizes over 10 kb were shown
(Figure 3-40).
Figure 3-40: Test of DNA qualities of the sequencing samples. The DNA of 5 samples showed clear bands over 10 kb on agarose 1.2% gel indicating sufficient qualities of the DNA.

Results
92
3.4.3 One step sequencing with Illumina G2 Analyzer
All the samples from 5 groups were pooled equally for sequencing, from which 1.6 ug of
DNA were taken for sequencing with an Illumina G2 Analyzer by Dr. Rowan Beth (Max-
Planck-Institut für Entwicklungsbiologie, Tübingen, Germany). After aligning the reads to
the Col-0 reference sequence with SHORE map flowcell, the sequencing processes
were accomplished with over 30 million raw reads, which were averagely 100 bp long.
Consequently the data of the sequencing results covered 19x of the Arabidopsis ge-
nome.
3.4.3.1 Genetic mapping with the sequencing results
The polymorphisms (SNPs and Indels) were analyzed, through that a consensus list was
finished. (See appendix) With the consensus subset of marker positions between the
mapping population and Ler marker list, the allele frequency of Col-0 alleles was plotted
across the genome by SHOREmap_interval.pl. The Col-0 allele frequency was plotted
on a map with windows size of 200kb, in which the allele frequency across the genome
was around 50% everywhere (Figure 3-41).
On chromosome I, the centromere region between 14 and 15 Mb was enriched for Col-0
alleles. Similarly, the frequencies of Col-0 alleles were also slightly higher than Ler al-
leles on the centromere regions 14 Mb and 3 Mb of on chromosome III and IV. All the
data on centromere regions were excluded from the further analysis.
On chromosome IV, 5 regions (around 0.1 Mb, 0.5Mb, 1Mb, 4.5Mb and 6Mb) seemed to
be enriched for Col-0 alleles (Figure 3-41). It was assumed that these 5 regions on
chromosome IV could be the candidate regions of RIMB3.
SNPs from the Ler parent were removed, and the new SNPs and Indel polymorphism on
the chromosome IV were analyzed (Table 3-3). 62 new non-synonymous SNPs were

Results
93
discovered in coding sequences, among which five SNPs were located near the five
candidate regions (Table 3-4).
Table 3-3: New SNPs on chromosome IV. The detected nonsynonymous new SNPs for map-ping RIMB3 were displayed till 7Mb on chromosome IV. 62 new nonsynonymous SNPs were discovered in the mapping population, among which 12 new SNPs were within the candidate region of RIMB3.
Position Reference
base
Alternate
base Gene
Reference
aa
New
aa
539608 G A AT4G01290 P L
561780 T G AT4G01350 C G
875169 C A AT4G02000 L I
1399785 C T AT4G03165 E K
1662039 T G AT4G03740 N H
2580327 T C AT4G05040 F S
3318702 C T AT4G06526 R Q
5388336 T C AT4G08480 T A
5389422 T C AT4G08480 I V
5389437 T G AT4G08480 I L
6025041 T C AT4G09520 R G
7395435 A C AT4G12460 I L
Table 3-4: Five candidate SNPs on chromosome IV. Five SNPs were detected near the five candidate regions enriched for Col-0 alleles. They were considered as candidate loci of RIMB3. Besides AT4G08480, which showed 3 amino acid substations in the sequencing result, all 3 can-didates contained only one amino acid substitution.
Gene Position na mutant aa mutant code
AT4G01290 539608 G A P L AAC
AT4G01350 561780 T G C G GGC
AT4G03165 1399785 C T E K AGG
AT4G08480
5388336 T C T A ACA
5389422 T C I V CAA
5389437 T G I L AAC
AT4G09520 6025041 T C R G GAA

Results
94
Fig
ure
3-4
1:
Map
of
Co
l-0 a
llele
fre
qu
en
cy c
ros
s t
he A
rab
ido
psis
gen
om
e w
ith
win
do
ws s
ize o
f 200kb
. B
esid
es t
he
to
p a
rm o
f
chro
mosom
e I
V t
he C
ol-
0 a
llele
fre
quency a
cro
ss t
he g
enom
e w
as a
round
50%
every
where
. O
n t
he c
hro
mosom
e I
V t
here
were
5 r
eg
ion
s
ind
icate
d b
y p
eaks (
at th
e p
ositio
n a
roun
d 0
.1 M
b, 0.5
Mb, 1
Mb,
4.5
Mb a
nd 6
Mb),
where
it e
nriche
d for
Col-
0 a
llele
s.

Results
95
3.4.3.1 Identification of final candidate locus with resequencing of all the
candidate loci
In order to check, whether the SNPs exist also in T19-2, all the candidates genes were
re-sequenced with genomic DNA of the mutant line rimb3 and the parental line T19-2.
The re-sequencing results showed that in rimb3, only the locus AT4G01290 contains a
new SNP, which introduced a G to A substitution leading a P to L amino acid substitution
(Figures 3-42 and 3-43). It was assumed that the G to A substitution is the point muta-
tion generated by EMS mutagenesis (Heiber et al., 2007) and that this substitution is
reason of photooxidative damage and the chlorosis phenotype of rimb3 mutants.
Figure 3-42: The G to A substitution in AT4G01290 in rimb3 was verified with re-sequencing. A: Result of forward sequencing of AT4G01290 in T19-2 showed the sequence according to wildtype Col-0. B: Result of reverse sequencing of AT4G01290 in rimb3 demonstrat-ed a T on the position of 539608 on top arm of chromosome IV. This substitution was considered as the point mutation introduced by EMS mutagenesis in rimb3.
Figure 3-43: A G to A substitution was introduced in rimb3 at the position 539608 on top arm of chromosome VI. The substitution introduced a amino acid exchange from proline to leu-cine.
The gene At4g01290 encodes an unknown protein in Arabidopsis thaliana. According to
the prediction with Conserved Domain Database of NCBI, this protein may contain a

Results
96
domain: topoisomorase II-associated protein domain (PAT1), which is necessary for ac-
curate chromosome transmission during cell division. The position of the possible PAT1
domain is about 1350 bp after the G to A substitution to C-terminal (Figure 3-44).
Figure 3-44: The predicted structure and conserved domain of AT4G01290. There might be a PAT1 domain at end of the sequence. The P to L substitution was occurred at the position 580.
3.4.4 Transcript abundance analysis of RIMB3 and 2CPA
The T-DNA insertion line SALK_038452 was obtained from the Nottinghan Arabidopsis
Stock Centre NASC (http://arabidopsis.info/). In this line the T-DNA of pROK2 was in-
serted on the position 539670 bp on chromosome IV, which is in the longest exon of
locus At4g01290 (Figure 3-45). This insertion was supposed to stop the expression be-
fore the PAT1 domain.
Figure 3-45: The T-DNA line SALK_038452. in the T-DNA line SALK_038452 the T-DNA was inserted in the largest exon before the PAT1 domain. The function of the locus AT4G01290 was disturbed in this line.
After genotyping, the homozygote T-DNA insertion lines and wildtype were distinguished
and separated. The selected wildtype was used as positive control in further analyses. A
transcript analysis of 2CPA was performed in wildtype and in the At4g01290 knock-out
line SALK_038452. Actin7 was used as housekeeping gene (Figure 3-46). The transcript
level of 2CPA was detected to be clearly decreased (75%) in the knock-out line com-
pared to its level in the wildtype. The result indicated that the candidate locus At4g01290
could act as positive regulator of 2CPA expression in Arabidopsis. Together with the re-

Results
97
sults of genetic mapping by sequencing, it is concluded that in rimb3 the locus
At4g01290 was mutagenized by EMS and contains a G to A substitution.
Figure 3-46: Relative transcript analysis of 2CPA and At4g01290 in wildtype Col-0 and the At4g01290 knock-out line SALK_038452. In the knock-out line 2CPA expression was down-regulate on 75% relative to its expression in wildtype. The data are means of 7-10 sam-ples (± SD) grown in three independent experiments. **and *** indicate significant differences from the value of wildtype Col-0 (t-test), ** represents the significant difference P<0.01 and ***represents the significant difference P<0.001.
3.4.5 Coexpression analysis of RIMB3 and RIMB1 (RCD1)
The expression pattern of RIMB3 (At4g01290) and the previously identified RIMB1
(RCD1, At1g32230, Hiltscher, 2011) was analyzed using response viewer of Genevesti-
gator database. At the stages of germinated seed, seedling, young rosette, developed
rosette stage, bolting stage, young flow stage, developed flower stage, flower and si-
liques, mature siliques stage, and senescence stage both of REMB3 and RIMB1 were
highly expressed, and the all levels of expression (signal intensity on 22k array) were
over 12.5 (Figure 3-47). Both of RIMB3 and RIMB1 have highest expression at the se-
nescence stage (13.2 and 14.1 respectively).
Under various stress treatments the RIMB1 and RIMB3 seemed to be coexpressed (Fig-
ure 3-48). Under cold, drought and light/drought stresses, the expressions of RIMB3 and
RIMB1 were induced, while heat stress represses the expression of the both genes.
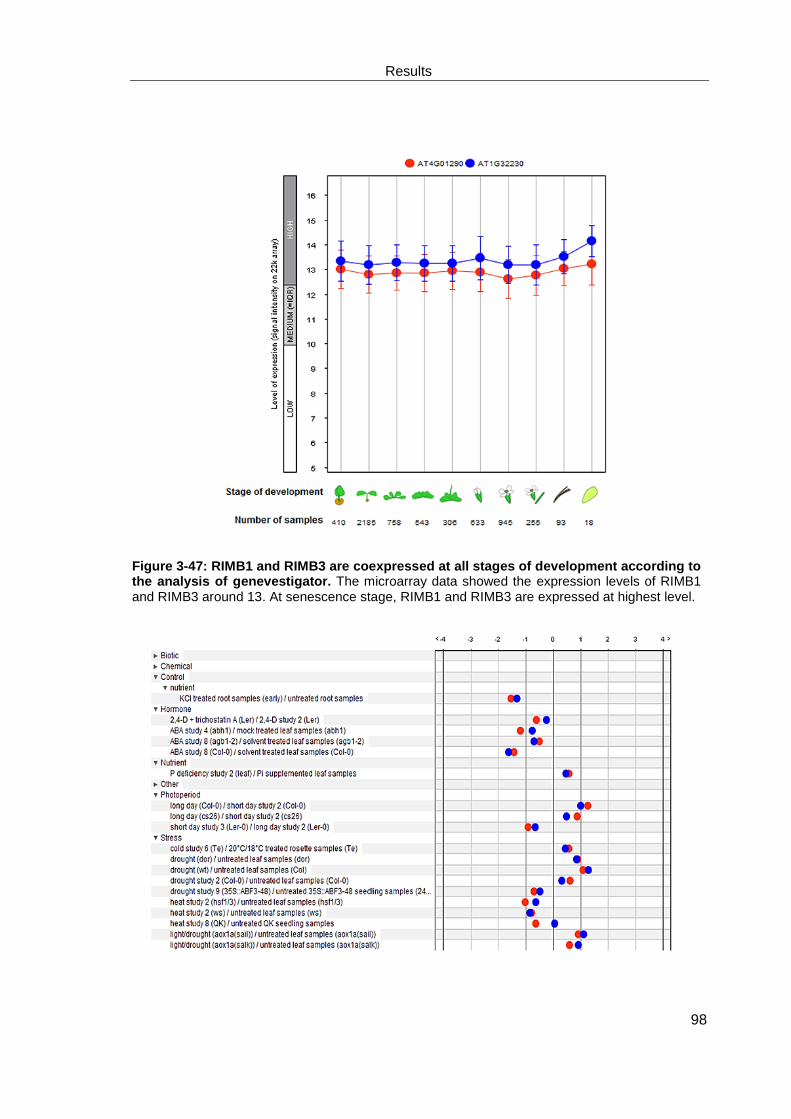
Results
98
Figure 3-47: RIMB1 and RIMB3 are coexpressed at all stages of development according to the analysis of genevestigator. The microarray data showed the expression levels of RIMB1 and RIMB3 around 13. At senescence stage, RIMB1 and RIMB3 are expressed at highest level.

Results
99
Figure 3-48: RIMB1 and RIMB3 are clearly coexpressed: at KCl treatment, ABA treatment, different photoperiod treatments, cold stress, drought, heat and light stresses. The analysis was performed with the database Genevestigator. The direction to the left stands for down-regulation, and to the right represents up-regulation.
By using the online database Genemania, the relationship of RIMB1 (RCD1, At1g32230)
and RIMB3 (At4g01290) was predicted. As a result, the RIMB1 and RIMB3 are coex-
pressed with a weight of 1.2 (Figure 3-49). The data was collected from GEO accession
GSE19520.
Figure 3-49: According to the analysis of Genemania (http://www.genemania.org/), RIMB1 (RCD1) and RIMB3 (At4g01290) are directly coexpressed. The data was collected from GEO accession GSE19520.
To check the relative expression level of RIMB3 in rimb1 and rcd1, a transcript analysis
was performed (Figure 3-50), while the relative expression level of RIMB1 was checked
in rimb3 (Figure 3-51). The expression of RIMB3 in rcd1 was increased clearly: the rela-
tive transcript level of RIMB3 was up to 122% compared to wildtype Col-0, while the
transcript level of RIMB3 in rimb1 did not clearly differ from the transcript level of RIMB3
in Col-0 (Figure 3-51). In transcript analysis of RIMB1, the relative transcript level of
RIMB1 in rimb3 was significantly decreased (79%) in comparison to its level in Col-0
(Figure 3-52), suggesting that RIMB3 is an upstream regulator of RIMB1.

Results
100
Figure 3-50: Relative transcript level of At4g01290 in wildtype, rimb1 and rcd1. The relative transcript level of At4g01290 in wildtype Col-0 was set as 100%. In the RCD knock-out line rcd1 the relative expression level of At4g01290 was clearly increased (122% relative to Col-0), while in the RIMB1 knock-out line rimb1 the At4g01290 expression did not show significant increase in comparison to in Col-0. The data are means of 7-10 samples (± SD) grown in three independent experiments. ** indicates significant differences from the transcript value in Col-0. (t-test, P<0.01)
Figure 3-51: Relative transcript level of RIMB1 in wildtype and rimb3. The relative transcript level of RIMB1 in wildtype Col-0 was set as 100%. The relative transcript level of RIMB1 in rimb3 was dropped on 79% compared to its level in Col-0. The data are means of 7-10 samples (± SD) grown in three independent experiments. * represents significant differences from the transcript value in Col-0 (t-test, P<0.05)
0,0
0,2
0,4
0,6
0,8
1,0
1,2
1,4
Col-0 rcd1 rimb1
Rela
tive t
ranscript
level of
RIM
B3
0,0
0,2
0,4
0,6
0,8
1,0
1,2
Col-0 rimb3
Rela
tive t
ranscript
level
of
RIM
B1 *
**

Results
101
3.4.6 Coexpression analysis of RIMB3 and ATCDC48
An coexpression analysis was performed with Genemania (http://www.genemania.org/) ,
to test the level of coexpression of RIMB3 and ATCDC48 (Figure 3-52). The microarray
data of GEO accession GSE30223 was used in this analysis. The prediction demon-
strated that RIMB3 (At4g01290) is coexpressed with ATCDC48, which physically inter-
acts with PUX proteins.
Figure 3-52: RIMB3 (At4g01290) is coexpressed with ATCDC48 (At3g09840) according to the analysis of the Genemania (http://www.genemania.org/). The analysis was based on the microarray data of GEO accession GSE277.

Discussion
102
4 Discussion
4.1 Genetic mapping of loci RIMB3, RIMB6 and the eQTL of
2CPA
In this project, the loci of RIMB3, RIMB6 and an eQTL between the Arabidopsis acces-
sions Col-0 and Ler were mapped based on their effect on 2CPA promoter regulation.
The eQTL was the first locus mapped in this project. It followed the previous RIMB3 pro-
ject, and was mapped with SSLP markers according to Jander et al., (2002). The initial
mapping process was achieved with 29 SSLP markers (Figure 3-17). The final candidate
region was determined on a 77 kb region on chromosome IV. Since there was no suita-
ble SSLP marker to apply, the candidate loci were tested for amino acid polymorphisms
between the Arabidopsis accessions Col-0 and Ler using the genomic sequence infor-
mation provided by the Cereon/Monsanto Arabidopsis Polymorphism Collections
(http://www.arabidopsis.org/browse/Cereon/). Four final candidate loci were identified. T-
DNA knock-down line for the loci was obtained by transcript analysis of 2CPA. The locus
AT3G21660 correlated with decreased 2CPA expression and, therefore, eQTL locus
was identified to regulate 2CPA expression. It encodes a PUX-like protein (Figure 3-26).
Additionally, the mutation of rimb6 was mapped by next generation sequencing. The
plants of rimb6 showed a very clear and unique mutant phenotype (Figure 3-1), which
made it possible to select the individuals from F2 generation bearing homozygote mutant
locus in the genome and to apply the selected F2 plants directly to genetic mapping of
one step sequencing with Illumina HiSeq 2000 analyzer. The coverage of 57x of the Ar-
abidopsis genome ensured that a single final candidate of the mutant locus can be di-

Discussion
103
rectly identified with the sequencing result. As a result the AT4G12560 was identified as
final candidate of RIMB6. It encodes a constitutive expresser of PR genes CPR30.
By next generation sequencing RIMB3 was identified (Figure 3-41). As the mutant phe-
notype of rimb3 was not sufficient to surely pick up the individuals from F2 generation
(Figure 3-1), the next generation of the selected individuals, which was F3 generation of
rimb3 X Ler, was rescreened with luciferase assay. About 30 F3 plants of each line,
which were confirmed to have low luciferase activity, were harvested and sequenced to
map the mutant locus. Coverage of 19 x of the Arabidopsis genome was achieved,
which demonstrated five candidate regions on chromosome IV. The loci, which were
near the candidate regions and had new SNP in Col-0 genetic background, were re-
sequenced in rimb3 and its parental line T19-2 to confirm the new SNP. As final result,
At4g01290 was identified to contain a new SNP that was introduced in T19-2 using EMS
mutagenesis. In conclusion the AT4G01290 was considered as final candidate of
RIMB3.
4.2 RIMB6
In the mutant rimb6 the gene regulation is severely defected in the central chloroplast-to-
nucleus signaling pathway (Heiber et al., 2007). RIMB6 activates 2CPA at the highest
level on young developmental stages (Figures 3-8 and 3-9). However the mutant plant
rimb6 demonstrated more severely defected growth at mature stage (Figures 3-1 and 3-
2). It is assumed that RIMB6 may negatively regulate an unknown factor, which defects
the plant growth of Arabidopsis. The increasing defective effect on rimb6 may be caused
by the accumulation of this unknown factor. In this project the locus AT4G12560
(CPR30) was identified as final candidate of RIMB6, according to the mapping by one
step genomic sequencing with the one step Illumina HiSeq 2000 (Figure 3-13).

Discussion
104
In the previous study (Heiber et al., 2007), the abnormal shape of the leaves and in-
creased ascorbate level, as well as accumulation of starch and anthocyanins in rimb6
were observed. It was concluded that RIMB6 is a general regulator of nuclear encoded
chloroplast proteins.
In a previous part of the project, the leaf shape of rimb6 was determined as a conditional
phenotype depending on the soil supplemented with different amounts of mineral nutri-
ents. On nutrient-rich soil, rimb6 looked almost like wildtype, whereas on nutrient-poor
soil it developed severe phenotype in the rosette stage (Hiltscher, 2011).
The conditional phenotype of rimb6 under the growth condition in Berlin was confirmed.
However on the nutrient-rich soil the rimb6 also demonstrated a slight mutant phenotype
of the leaves on rosette stage. This might indicate that the RIMB6 is a constitutive acti-
vator of 2CPA expression.
4.2.1 RIMB6 (CPR30) is a negative regulator of plant defense response
system
The constitutive expresser of PR genes 30 (CPR30) was studied and designated by Guo
et al., (2009). It was concluded that CPR30 negatively regulates both SA-dependent and
SA-independent defense signaling in the plant cell.
Guo et al., (2009) concluded that enhanced disease susceptibility 1 (EDS1), phytoalexin
deficient 4 (PAD4) and non-race-specific disease resistance 1 (NDR1), which are the
key regulators of plant defense response in Arabidopsis, are directly or indirectly re-
pressed by CPR30 (Gou et al., 2009). In cpr30 mutant plants EDS1, PAD4 and NDR1
are activated. They consequently lead to the activation of both the basal and R-gene-
mediated resistances. In addition, CPR30 regulates plant growth and disease re-
sistance, via a PAD4-, EDS1- and NDR1-dependent, but SA-independent pathway (Guo
et al., 2009). Furthermore, part of the SID2-mediated SA synthesis is also involved in the
cpr30-activated disease resistance (Guo et al., 2009). Pathogen resistance response
Discussion
105
consumes large amounts of energy in plant cells. It is repressed during normal growth
and development conditions and in the absence of pathogens. In contrast, the pathogen
resistance response is constitutively activated in the mutant line cpr30. This autoimmuni-
ty could be part of the reason of the typical rimb6 phenotype like narrow leaves, stunted
growth et cetera (Figure 3-1).
RIMB6 (also known as CPR1/CPR30) is an F-box protein containing two different F-box
motifs which are needed for binding Arabidopsis-S-phase kinase-associated protein 1
(SKP1)-like proteins (ASK). It has be proven in vivo that CPR30 interacts with 11 ASK
proteins (Guo et al., 2009).
In the SKP1-CULLIN1-F-box complex, F-box protein functions for the specificity of the
complex, which is a multi-protein E3 ubiquitin ligase complex and catalyzes the ubiquiti-
nation of proteins destined for proteasomal degradation. F-box protein aggregates to
target proteins independently of the SCF complex and binds to the SKP1 component,
which is the bridging the proteins Cullin1 (Cul1) and RING-box protein 1 (Rbx1) (Willems
et al., 2004). A horseshoe-shaped complex (Morgan, 2007), which is a multi-protein E3
ubiquitin ligase complex, is formed by F-box protein, SKP1, Cul1 and Rbx1. It allows the
protein to be brought into proximity with the functional E2 protein. In addition, the F-box
is also essential in regulating SCF activity during the process of the cell-cycle. Therefore,
SCF levels are thought to remain constant throughout the cell-cycle.
As component of SCF complex, the CPR30 was also reported to control the stability of
the nucleotide-binding domain and leucine-rich repeats containing proteins (NLRs) func-
tioning as immune receptors in animals and plants. It is suggested that SCF complex-
mediated stability control of plant NLR proteins is an important mechanism of regulating
their protein levels and preventing autoimmunity (Cheng et al., 2011).
The further study on CPR30 concluded that with the form of SCF complex CPR30 nega-
tively regulates accumulation of disease resistance (R) protein SNC1 (suppressor of
Discussion
106
npr1-1 constitutive 1) by protein degradation in the absence of pathogen. The regulation
of SNC1 by CPR30 is dependent on the 26S proteasome. This is proven with a protease
inhibitor MG132 which stabilizes SNC1 and counteracts the implication of CPR1 on
SNC1 (Gou et al., 2012).
It is concluded that RIMB6 (CPR30) positively regulates the expression of 2CPA, which
plays an important role to scavenge the ROS in plant cell (Baier et al., 1997). As ROS
are known to be involved in plant defense response system as second messenger, it is
suggested that the RIMB6 (CPR30) may repress the plant defense response system
also via decreased ROS level in plant cell. It is further assumed that RIMB6 controls the
stability of an unknown repressor of 2CPA mediated by SCF complex.
4.2.2 RIMB6 is involved in cross-talk between redox signaling and plant
defense response
Here, it can be concluded that the RIMB6 serves as sensor of fluctuating redox state of
the electron acceptors of PSI and triggers a retrograde signal from chloroplast to nucleus
in order to coordinate the nucleus and chloroplast. At the same time, RIMB6 is also a
constitutive negative regulator of plant defense response, which requires a complex
network of signaling, including calcium signaling. Calcium signaling is already reported
to be involved in cross-talk with protein phosphorylation at the thylakoid (Stael et al.,
2012), which may be connected to the chloroplast redox retrograde signaling. Since
RIMB6 plays important roles both in redox signaling and plant defense response, it could
be therefore a central factor of the cross-talk between these two systems.
4.2.3 RIMB6 is involved in the metal homeostasis system in plant cell
The rimb6 displayed mutant phenotype was more severe on nutrient-poor soil than it did
on nutrient–rich soil (Hiltscher, 2011). This indicated that mineral content in rimb6 could
affect its phenotype. Therefore, ICP-MS was applied to check the contents of mineral
elements in the rosettes of rimb6 plants, grown on both soil types. The results illustrated

Discussion
107
clear variation of the contents of Cd, Cr, Cu, Fe, Mn, Mo, Se, Ni and Zn in the plant tis-
sue.
Fe, Cu, Zn, and Ni are known as essential micronutrients at certain concentrations. They
are involved in the functional activities of many proteins involved in keeping growth and
development of living organisms. However, at excess concentrations, these metal ions
can be detrimental to plants (ChoudhuryI, 2005).
Among the heavy metals tested in this project, Cr, Cu and Fe are redox active, while Cd,
Zn and Ni are redox inactive heavy metals (Hossain M. A., 2012). The redox active
heavy metals Cu, Fe and Cr are directly involved in the redox reaction in cells and result
in the formation of O2•−, and subsequently in H2O2
and •OH production, via the Haber-
Weiss and Fenton reactions (Schutzendubel and Polle, 2002). In rimb6 plants growing
on nutrient-poor soil the Cr content was 2-fold higher than it was in the control line T19-
2, suggesting that Cr caused high level of ROS in rimb6. On contrary, high contents of
redox inactive heavy metals, such as Cd and Ni in this study, also result in oxidative
stress through indirect mechanisms such as interaction with the antioxidant defense sys-
tem, disturbing effect on the electron transport chain, and initiation of lipid peroxidation
(Hall, 2002; Dal Corso et al., 2005). The Ni content in rimb6 was six times as it was in
T19-2, which could introduce severe disruption to the electron transport chain and fur-
ther may cause a redox imbalance in the plant cell. The significant mutant phenotype of
rimb6 could be partially due to the heavy metal stresses in the plant cell.
It is suggested that metal homeostasis is changed by the disruption in regulation of met-
al transporters, antiporters or channels on plasma membrane, for instance AtPDR8
(AT1G59870), AtIRT1 (AT4G19690) and CNG channels.
4.2.4 AtPDR8 may be repressed in rimb6
The ATP-binding cassette (ABC) transporter AtPDR8, a Cd transporter on plasma mem-
brane, was determined as a Cd extrusion pump conferring heavy metal resistance in

Discussion
108
Arabidopsis (Kim et al., 2007). Interestingly, if AtPDR8 was knocked out, the plants
showed hypersensitive cell death upon pathogen infection. This may be connected to
the plant defense system, and the AtPDR8 could be also correlated with RIMB6, as
RIMB6 is a constitutive repressor of plant defense system. The contents of Cd in the
plants of rimb6 grown on nutrient-poor and nutrient-rich soil illustrated diverse directions:
on the poor soil the rimb6 plant contained less Cd in comparison to T19-2 plant, whereas
on soil supplemented with normal amount of mineral nutrients rimb6 had much higher
Cd content than T19-2. The data suggested that AtPDR8 was up-regulated on nutrient-
poor condition and repressed in nutrient-rich condition in rimb6. High expression of the
defense response genes, PR-1, PR-2 for instance, was observed in the atpdr8 mutants
within 10 h after infection with the virulent bacterial pathogen, Pseudomonas syringae
(Kim et al., 2007). AtPDR8 is considered then as a key factor triggering cell death in the
defense response and suggested that AtPDR8 transports some substance which is
closely related to the response of plants to pathogens (Kobae et al., 2006).
It is concluded that RIMB6 responds to different nutrient conditions and it may be nega-
tively correlated with AtPDR8. RIMB6 may indirectly repress AtPDR8 expression or
AtPDR8 activity under nutrient-poor condition and activate the AtPDR8 expression or
protein activity under normal (nutrient-rich) condition. Furthermore AtPDR8 represses
PR genes which are constitutively repressed by RIMB6 and activates the plant defense
system (Figure 4-1). Summarized, RIMB6 might be a negative regulator of plant defense
system mediated by AtPDR8.
Figure 4-1: Under nutrient-rich condition, RIMB6 represses the plant defense system. RIMB6 could positively correlate with AtPDR8 which constitutively suppresses PR1 and PR2, the activa-tors of plant defense system.

Discussion
109
4.2.5 AtIRT1 and CNG channels might be disturbed in rimb6
Apart from Cd, some other metals, for instance Cr, Cu, Fe, Mn, Mo, Se, Ni and Zn, also
showed significant variations between rimb6 and T19-2 (Figure 3-10). This indicated, not
only AtPDR8 was disturbed, the function of other metal transporters in rimb6 were also
changed.
In addition to AtPDR8, Iron-Regulated Transporter 1 (AtIRT1), a member of the Zrt/Irt-
like protein (ZIP) family of transporters (Vert et al., 2002), was reported as a primary iron
uptaking transporter in the root, and to mediate Ni accumulation in Arabidopsis (Nishida
et al., 2011). The specificity of AtIRTs are broad for divalent heavy metals, which medi-
ate the accumulation of Zn, Mn, Cd and Co under Fe-deficient conditions (Vert et al.,
2009). Competition between Fe2+ and Ni2+ occurs often within membrane transport sys-
tems (Gendre et al., 2007). According to results of the ICP-MS, the plants of rimb6
grown on poor soil contained Ni about 5-fold higher than the plants of T19-2. It is sug-
gested that a Ni transporter AtIRT1 on plasma membrane was probably repressed in
rimb6. Therefore, RIMB6 is suggested to repressed indirectly the AtIRT1. Loss of RIMB6
may activate Fe and Ni transporter AtIRT1 and may have caused high accumulation of
Ni in rimb6.
Additionally to metal transporter on the plasma membrane of plants, some cyclic nucleo-
tide-gated ion channels (CNG channels) have been identified to keep metal homeostasis
in plant cells (Schuurink et al., 1998; Arazi et al., 1999; Kohler et al., 1999). These chan-
nels appear to be plasma membrane-located and non-selective, and they are permeable
to both monovalent and divalent cations (Schuurink et al., 1998, Arazi et al., 1999). They
may also be affected by the loss of RIMB6, and it may consequently cause changes of
metal contents nonspecifically.

Discussion
110
Up to now, no direct connection could be found between 2CPA, AtIRT1 and CNG chan-
nels. It is assumed that RIMB6 might trigger a regulating network, in which 2CPA,
AtIRT1 and proteins of CNG channels are all involved.
To confirm this hypothesis, analyses of coexpression and in vivo interaction between
RIMB6 and AtPDR8, AtIRT1 and the proteins of CNG channels need to be performed.
4.2.6 Possible regulation network of RIMB6 with eQTL
It is summarized that RIMB6 triggers a retrograde signal to nucleus in a development-
dependent way, to regulate the 2CPA expression in responses to the changes of redox
state of the electron acceptors of PSI caused by environmental stimulus. In parallel,
RIMB6 also regulates the plant defense system and the metal homeostasis in plant cell
(Figure 4-2). RIMB6 may up-regulate the expression of the Cr transporter AtPDR8 which
constitutively represses the PR genes. Furthermore, RIMB6 interacts with SKP1 and
forms a SCF complex together with SKP1 and Cullin1. By protein degradation, RIMB6
negatively regulates accumulation of R protein SNC1 with the form of SCF complex in
the absence of pathogen. The expression of 2CPA is positively regulated by RIMB6 via
unknown 2CPA repressor which is negatively regulated by RIMB6. Therefore, RIMB6
activates the 2CPA expression in plant cells to detoxify the ROS which is a second mes-
senger to activate the plant defense system. Together with negative regulation to the R
protein SNC1 and PR genes, RIMB6 is a constitutive repressor of plant autoimmunity. In
addition, RIMB6 is involved in metal homeostasis in plant cell, in which RIMB6 may re-
press the AtIRT1 and CNG channels besides AtPDR8. The presented data proposed a
cross-talk between chloroplast retrograde signaling, regulation of plant defense re-
sponse and metal homeostasis in plant cells is established mediated by RIMB6.

Discussion
111
Figure 4-2: The hypothesis of regulation network of RIMB6. Together with Cullin and SKP1, RIMB6 forms a SCF complex. The SCF complex activates 2CPA expression via an unknown repressor of 2CPA, and 2CPA detoxifies the ROS that acts as second messenger to activate plant defense response. The SCF complex might activate the expression of the Cd transporter AtPDR8, which represses PR genes via a PAD4-, EDS1- and NDR1-dependent pathway. The SCF complex also represses an R protein SNC1. Through repression to SNC1 and PR genes, RIMB6 constitutively represses plant defense response. In addition, RIMB6 might negatively regulate AtIRT1 and maybe interact with CNG channels. Together with up-regulation to AtPDR8, RIMB6 is involved in regulation of metal homeostasis in plant cell.
4.3 The eQTL in 2CPA regulation
Using the F2 of the cross rimb3 x Ler, an expression quantitative locus (eQTL)
At3g21660 was identified based on natural variation between the Arabidopsis acces-
sions Col-0 and Ler. The homozygote eQTL on Ler background caused low expression
of the reporter gene luciferase in the mapping population with F2 plant of the rimb3 x
Ler. However, the plants bearing homozygote Ler background on the position of the
eQTL did not exhibit any visible phenotype, thus rescreening of the luciferase activities
in the population of next generation was often performed during the SSLP mapping. The
transcript analysis of 2CPA in the T-DNA knock-out line of the eQTL confirmed the posi-
tive regulation of the eQTL to 2CPA in Col-0.

Discussion
112
4.3.1 Natural variation of At3g21660
Compared to the sequence of At3g21660 in Col-0, a short sequence of 25 bp is inserted
at position 33 of the gene At3g21660 in Ler. In the sequence of At3g21660, natural vari-
ation occurs often between different accessions according to Arabidopsis SNP Se-
quence Viewer (http://natural.salk.edu/cgi-bin/snp.cgi). Juszczak et al. studied recently
the natural variation in chloroplasts antioxidant protection system, and observed varia-
tion of 2CPA expression in different Arabidopsis accessions (Juszczak et al., 2012). The
2CPA expression in Ler was 45% relative to Col-0 in the study. The 25 bp short insertion
was inserted at the position 33 of the sequence of the eQTL in Ler (Figure 3-24). This
insertion introduced a frameshift at beginning of the gene, therefore a Col-0 specific
2CPA inducer could be deactivated in Ler or a Ler specific 2CPA repressor might be
deactivated in Col-0.
4.3.2 The eQTL positively regulates 2-Cys-peroxiredoxin expression
The transcript analysis in the eQTL knock-down line showed a significantly lower level of
2CPA and 2CPB expression compared with the wildtype Col-0, while the transcript lev-
els of sAPx and tAPx were similar to the transcript level in wild type Col-0. This could
prove that the eQTL is a Col-0 specific positive regulator of 2-Cys-peroxiredoxins but it
has no regulating effect on ascorbate peroxidase expression (Figure 4-3). Furthermore,
the effect of the eQTL on expressions of other antioxidant enzymes need to be checked
to determine the role of the eQTL in the antioxidant system of plant cells, for example
copper/zinc superoxide dismutase (Csd2), peroxiredoxin Q, type II peroxiredoxin E and
glutathione peroxidase 1.

Discussion
113
Figure 4-3: The eQTL specifically activates expression of peroxiredoxins. There was no effect of the eQTL to transcript levels of ascorbate peroxidases sAPx and tAPx.
4.3.3 The eQTL belongs to UBX containing protein family that physically
interacts with CDC48
The protein structure was analyzed and predicted with Conserved Domain Database on
NCBI (http://www.ncbi.nlm.nih.gov/Structure/cdd/cdd.shtml). The prediction illustrated
three possible domains of At3g21660: two SEP super family domains and a UBQ super
family domain.
The SEP domain is named after Saccharomyces cerevisiae Shp1, Drosophila melano-
gaster eyes closed gene (eyc) and vertebrate p47 (Yuan et al., 2004). In p47, the SEP
domain has been shown to bind to and then inhibit the cysteine protease cathepsin L
(Soukenik et al., 2004). Most SEP domains are succeeded closely by a UBX domain
(Yuan et al., 2004). The UBQ super family domain in At3g21660 is an ubiquitin homolog.
The UBQ super family domain includes ubiquitin and ubiquitin-like proteins. Ubiquitin-
mediated proteolysis is involved in the regulated turnover of proteins required to control
cell cycle progression. Other family members are protein modifiers with numerous func-
tions.
Furthermore, according to the prediction about the interaction network of At3g21660 with
genemania database (http://www.genemania.org/), the eQTL is predicted to interact with
CDC48 (also known as p97/VCP) protein, which physically interacts with five PUX (plant
UBX-domain containing) proteins. The analysis also showed that the eQTL At3g21660

Discussion
114
shared a UBX-domain with the five PUX proteins, among which the PUX3, PUX4 and
PUX5 also contain a SEP superfamily domain.
CDC48 is a conserved and essential hexameric AAA-ATPase that plays a role as a mo-
lecular chaperone in many different cellular activities (Rancour et al., 2002). CDC48 ac-
tivity is needed for specific functions through its interaction with adapter proteins.
There are over ten members of the PUX protein family in Arabidopsis (Rancour et al.,
2004). Some data in non-plant systems suggested a role for the UBX-domain, an ubiqui-
tin-like protein fold, as a specific interaction domain for CDC48. Physical interactions of
five PUX proteins (1-4 and 11) with AtCDC48 in Arabidopsis were proven in vivo, sug-
gesting that the PUX protein family is a class of AtCDC48 regulators (Rancour et al.,
2004).
4.3.4 PUX2 is a positive regulator of CDC48 and negatively correlates with
the eQTL
The coexpression analysis of PUXs and the eQTL with Genevestigator demonstrated
that the transcript levels of PUX2 and eQTL are negatively correlated. It is reported that
PUX2 is a peripheral membrane protein which interacts with AtCDC48 in vitro and co-
fractionates with membrane-associated but not soluble AtCDC48 in vivo (Rancour et al.,
2005). It is further concluded that PUG domain in PUX2, which is a protein domain found
in protein kinases, N-glycanases and other proteins with nuclear localization, is required
for interaction with AtCDC48. Biochemical reconstitution and immunolocalization data
suggest that PUX2 facilitates the interaction of AtCDC48, thereby regulating an
AtCDC48 membrane-associated function (Park et al., 2008).
4.3.5 The eQTL is coexpressed with ASK9 and ASK16
The coexpression analysis with Genemania database (http://www.genemania.org/) (Fig-
ure 3-36) demonstrated that eQTL coexpresses with ASK9 and ASK16 (Arabidopsis

Discussion
115
Skp1 protein), which functions as bridging protein and together with cullin forms part of
the horseshoe-shaped SCF complex which plays an important role in protein degrada-
tion. The ASKs are essential in the recognition and binding of the F-box.
As previously discussed, RIMB6, an F-Box containing protein, is proven to interact phys-
ically with ASK9 and ASK16. It constitutively represses the plant defense system medi-
ated by repressing the accumulation of R protein and PR protein (Gou et al., 2009;
Cheng et al., 2011; Gou et al., 2012), and activating 2CPA expression as well.
The analysis supports a hypothesis that the eQTL and RIMB-6 are involved in same re-
dox retrograde signaling network and they regulate 2CPA expression by protein degra-
dation.
4.3.6 Hypothesis of two possible models of eQTL regulation network
With the data presented in this study it can be suggested that the eQTL and RIMB6
sense the fluctuation of redox state of the electron acceptors of PSI under environmental
stimulus and function as chloroplast retrograde signals in a complex network. By protein
degradation the network activates 2CPA expression to detoxify the excess ROS and
keep the redox status balanced. The UBX domain contained in the eQTL indicates that
the regulation of ubiquitination may be involved in the chloroplast redox retrograde sig-
naling. The analysis further allows the shaping of two possible models of the regulation
network of the eQTL to 2CPA (Figure 4-4). The eQTL functions as repressor PUX2 or it
directly competes with PUX2 binding to CDC48, which negatively regulates an unknown
positive regulator of peroxiredoxins mediated by protein degradation. The eQTL is func-
tionally related to RIMB6 via ASK9 and ASK16. Further tests for the physical interactions
between the eQTL, PUX2 and CDC48 still need to be finished. To confirm the upstream
regulating function of the eQTL to CDC48s, transcript analysis should be performed with
lines of loss of function mutants of the eQTL and CDC48 in the future.

Discussion
116
Figure 4-4: Two possible models of the regulatory network of the eQTL. The eQTL respons-es to the fluctuation of redox state of the electron acceptors of PSI and activates the 2CPA ex-pression via CDC48 and unknown regulator of 2CPA. A: The eQTL may repress PUX2 and fur-ther positively control CDC48. B: The may repress CDC48 directly and compete with PUX2.
4.3.7 An alternative approach to discover the new regulator using the
natural variation recourses of Arabidopsis thaliana
Though the eQTL was mapped by a crossing a mutant line (mutagenized on T19-2) and
another accession (rimb3 x Ler), mapping of the eQTL is actually based on natural varia-
tion. It is assumed, directly with a crossing line of a reporter gene line T19-2 (Col-0
background) and another accession Ler (T19-2 x Ler), the eQTL could be still mapped
on the same position with the same mapping strategy. The mapping process could be
accelerated by this method, as the mutant locus, a potential disturber of the analysis, is
missing when using this method. The process of mapping the eQTL may be applied as
new approach to discover new regulators in Arabidopsis with the recourses of natural
genetic variation.
Instead of using mutant lines, different accessions can be applied to map an unknown
regulator in the new approach. A reporter gene line needs to be at first generated with
one accession, in which the reporter gene is controlled under the promoter of interest.

Discussion
117
Second accession will be selected to cross with the reporter gene line. In the F2 genera-
tion, in which alleles segregate, some individuals may have higher or lower reporter
gene activities in comparison to the reporter gene line. In those lines with higher reporter
gene activities, there might be a positive regulator of the promoter of interest, which is
based on the second accession. Such positive regulator is specifically active in the sec-
ond accession, but is deactivated in the first accession (with reporter gene) due to a kind
of natural mutation. On the other hand, reporter gene tests need to be done in the line of
low reporter gene activities to ensure that phenotype of low reporter gene activities is not
due to the absence of the reporter gene. In the line with reporter gene but showing low
reporter gene activity, a repressor of the promoter of interest must exist in the second
accession. But in the first accession the positive regulator is deactivated. Such F2-
individuals with high or low reporter gene activities can be selected followed by a genetic
mapping either with SSLP or next generation sequencing. Those loci, which are deter-
mined with genetic mapping, could be unknown regulators of the promoter of interest. In
this way regulators can be identified without additional step of mutagenesis.
Since genomes of the most ecotypes of Arabidopsis are already sequenced (Cao et al.,
2011), large amount of the polymorphisms between different ecotypes were discovered.
For instance, Lu et al. detected 349,171 Single Nucleotide Polymorphisms (SNPs),
58,085 small and 2315 large insertions/deletions (Indels) in sequences of Col-0 and Ler
(Lu et al., 2012). The genetic variation of Arabidopsis already became the most im-
portant basic resource for plant biology to study the plant genome (Alonso-Blanco and
Koornneef, 2000). Furthermore, among Arabidopsis accessions from different geograph-
ical regions, a great number of genetic variations have been discovered (Alonso-Blanco
and Koornneef, 2000). Various adaptive traits were reported in different Arabidopsis eco-
types, such as tolerance to freezing (Hannah et al., 2006), disease resistance (Kunkel,
1996), circadian rhythms (Swarup et al., 1999) and the chloroplast antioxidant system
(Juszczak et al., 2012). As result of whole genome sequencing of many Arabidopsis ac-
cessions, the natural genetic variation in the Arabidopsis chloroplast antioxidant system

Discussion
118
can nowadays be used as an alternative resource to discover novel regulators in this
system, based on the available data of a great number of the polymorphisms between
genomes of different ecotypes. In this project, the eQTL is an example, which was identi-
fied using the genetic variation of Arabidopsis.
4.4 RIMB3
The mutant rimb3 is affected in the central chloroplast-to-nucleus signaling. RIMB3 inte-
grates light intensity dependent signals in the regulation of nuclear encoded antioxidant
enzymes (Heiber et al., 2007). At the young stages of the mutant plant rimb3, plant im-
age system NightSHADE LB 985 displayed low reporter gene activity which is under
control of 2CPA promoter and confirmed that RIMB3 is an activator of 2CPA expression
at young stages (Figures 3-7, 3-8 and 3-9). However at the mature stages of Arabidopsis
RIMB3 regulatory network seems to slightly repress 2CPA expression. This indicates
that the regulatory network of RIMB3 is developmentally regulated. The growth of rimb3
plants was defective of all the developmental stages (Figure 3-2). This indicates a sys-
tematic effect of loss of RIMB3 function on plant development.
With next generation sequencing the locus At4g01290, an unknown protein, was deter-
mined as RIMB3. The result was confirmed with transcript analysis of 2CPA in T-DNA
insertion line (Figure 3-46).
4.4.1 The predicted structure and functions of RIMB3
After an analysis with CDD database on NCBI a conserved domain topoisomerase II-
associated protein (PAT1) was predicted at the C-terminal region of the protein. The
PAT1 domain was studied in yeast and animals, but up to now there is no report about
the function of PAT1 domain protein published in plant.

Discussion
119
The PAT1 proteins are conserved across eukaryotes (yeast, Drosophila, Caenorhabditis
elegans and human) (Marnef and Standart, 2010) and during cell division, it is necessary
for accurate chromosome transmission (Wang et al., 1996). Involvement of PAT1 was
observed protein in mRNA degradation in yeast (Bouveret et al., 2000). In Drosophila
and human cells, PAT1 proteins also play conserved roles in the 5'→3' mRNA decay
pathway. Based on the studies in the past 15 years it is suggested that PAT1 proteins
serve as scaffold proteins, with which the repression and decay factors and sequentially
bind on mRNPs, and eventually lead to degradation of mRNPs (Marnef and Standart
2010).
4.4.2 RIMB3 coexpresses with ATCDC48
Interestingly, bioinformatical analysis with Genevestigator demonstrated coexpression of
RIMB3 and ATCDC48, according to the microarray data Series GSE277 on GEO of
NCBI (Figure 3-52). Both of the genes are involved in controlling mechanism during cell
division: ATCDC48, cell division protein 48 (CDC48), is involved pathways that operate
at the division plane to mediate plant cytokinesis (Rancour et al., 2002). In addition, due
to its UBX domain the 2CPA eQTL was also predicted to physically interact with
ATCDC48 (Figure 3-30). Taken together, the data supported the following hypothesis:
RIMB3 and the 2CPA eQTL may be involved in the same network, and together they
activate 2CPA expression.
4.4.3 RIMB3 positively correlates with RIMB1 and functions upstream of
RIMB1
With help of Genevestigator, the coexpression analysis also demonstrated a positive
correlation between RIMB3 and RIMB1 (CEO1). A transcript analysis was performed to
check expression level of RIMB3 in rimb1 and expression level of RIMB1 in rimb3. The
result showed that RIMB3 functions in upstream of RIMB1 (Figures 3-50 and 3-51). It is
suggested that RIMB1 and RIMB3 can both response to the fluctuation of redox state of

Discussion
120
the electron acceptors of PSI and triggers a network of signaling to nucleus. RIMB1 can
also sense the upstream signal from RIMB3 and further regulate Rap2.4a, which regu-
lates 2CPA expression in a redox dependent manner (Shaikhali et al., 2008).
4.4.4 Possible regulation network of RIMB3
The presented data suggested a regulating network of RIMB3 (Figure 4-5), which also
involves RIMB1 and the eQTL. The RIMB3 plays a role in plant cells as sensor in re-
sponse to biotic or abiotic stresses and activates the expression of 2CPA in a develop-
ment-dependent manner. In parallel, RIMB3 coexpresses with RIMB1 that binds to
Rap2.4a and acts as upstream factor of RIMB1 in one of the possible signaling path-
ways of RIMB1. It is not yet proven, whether RIMB3 also interacts with Rap2.4a. In addi-
tion, RIMB3 coexpresses with CDC48, which may interact with the 2CPA eQTL and
positively regulates the expression of 2CPA and 2CPB via an unknown regulator. In this
network, the 2CPA regulators, RIMB1, RIMB3 and the eQTL, may directly response to
stresses or indirectly sense the stimulus via an unknown common upstream factor.
Figure 4-5: Possible regulatory network of RIMB3. In parallel to RIMB1, RIMB6 and the eQTL, RIMB3 senses the redox stimulus and activates the 2CPA expression. RIMB3 also functions in a pathway in upstream of RIMB1 and positively regulates RIMB1. In addition, RIMB3 is coex-pressed with CDC48, which may physically interact with the 2CPA eQTL and affect the expres-sion of 2CPA and 2CPB via an unknown factor.
Discussion
121
4.5 Conclusion
This project was focused on discriminating retrograde redox signaling from chloroplasts
to the nucleus by identifying and characterizing RIMBs, which act as regulators of 2-Cys-
Peroxiredoxin A transcription in Arabidopsis thaliana.
RIMB3 (At4g01290) may function in a pathway upstream of RIMB1 and activate 2CPA
expression directly or via Rap2.4a or CDC48 in a development-dependent manner
(Shaikhali et al., 2008). RIMB6 (At4g12560) negatively regulates the plant defense sys-
tem by constitutive repression of PR and SCN1 genes. RIMB6 may activate 2CPA ex-
pression by repression of an unknown negative regulator of 2CPA. Furthermore RIMB6
is also involved in regulatory system of metal homeostasis, in which metal channels
and/or transporters are regulated. The eQTL (At3g21660) may physically interact with
CDC48. The eQTL positively regulates expression of 2CPA and 2CPB. It is proposed to
acts via CDC48 and an unknown positive regulator of 2CPA downstream of CDC48. The
eQTL coexpresses with ASK9 and ASK16, which physically interact with RIMB6 (Figure
4-6).
RIMB3, RIMB6 and eQTL may play important roles in the network of redox retrograde
signaling pathway from chloroplast to nucleus. The network of the 2CPA regulators may
contribute to the understanding of cross-talk between retrograde signaling, ubiquitina-
tion, plant defense responses and metal homeostasis in plant cells.

Discussion
122
Figure 4-6: The regulatory network of RIMBs and the eQTL. Responding to the environmental stimuli, the RIMB1, RIMB3, eQTL and RIMB6 mediate the chloroplast retrograde signaling to nucleus, and positively regulate the 2CPA expression. The RIMB1 positively regulates Rap2.4a (Hiltscher, 2011), which actives the 2CPA expression in a redox dependent manner (Shaikhali et al., 2008). RIMB3 positively regulates the 2CPA expression either directly, or via RIMB1 pathway or CDC48 pathway. The eQTL may act as a negative regulator of CDC48 via repression of PUX2, which interacts with CDC48 as a positive regulator. CDC48 suppresses expression of 2CPA and 2CPB via an unknown positive regulator of 2CPA and 2CPB. The RIMB6 activates 2CPA expres-sion via an unknown repressor of 2CPA. The RIMB6 correlates with the eQTL through ASK9 and ASK16. On the other hand, RIMB6 is involved in regulation of plant defense reaction in form of SCF, which plays an important role in regulation of metal homeostasis of plant cell.

References
123
5 References
Abe, H., Yamaguchi-Shinozaki, K., Urao, T., Iwasaki, T., Hosokawa, D., and Shinozaki, K.
(1997). Role of arabidopsis MYC and MYB homologs in drought- and abscisic acid-
regulated gene expression. The plant cell 9, 1859-1868.
Abuharbeid, S., Apel, J., Sander, M., Fiedler, B., Langer, M., Zuzarte, M.L., Czubayko, F.,
and Aigner, A. (2004). Cytotoxicity of the novel anti-cancer drug rViscumin depends on
HER-2 levels in SKOV-3 cells. Biochemical and Biophysical Research Communications
321, 403-412.
Adams, M.R., Aid, S., Anthony, P.L., Baker, M.D., Bartlett, J.F., et al. (1990). A Spectrometer
for Muon Scattering at the Tevatron-E665 Collaboration. Nuclear Instruments and
Methods in Physics Research A 291, 533-551.
Ahlfors, R., Lang, S., Overmyer, K., Jaspers, P., Brosche, M., Taurianinen, A., Kollist, H.,
Tuominen, H., Belles-Boix, E., Piippo, M., Inze, D., Palva, E.T., and Kangasjarvi, J.
(2004). Arabidopsis radical-induced cell death1 belongs to the WWE protein-protein
interaction domain protein family and modulates abscisic acid, ethylene, and methyl
jasmonate responses. The plant cell 16, 1925-1937.
Alonso-Blanco, C., and Koornneef, M. (2000). Naturally occurring variation in Arabidopsis: an
underexploited resource for plant genetics. Trends in Plant Science 5, 22-29.
Apel, K., and Hirt, H. (2004). Reactive oxygen species: metabolism, oxidative stress, and signal
transduction. Annual Review of Plant Biology 55, 373-399.
Aravind, L. (2001). The WWE domain: a common interaction module in protein ubiquitination and
ADP ribosylation. Trends in Biochemical Sciences 26, 273-275.
Arazi, T., Sunkar, R., Kaplan, B., and Fromm, H. (1999). A tobacco plasma membrane
calmodulin-binding transporter confers Ni2+
tolerance and Pb2+
hypersensitivity in
transgenic plants. The Plant Journal 20, 171-182.
Arnold, K., Bordoli, L., Kopp, J., and Schwede, T. (2006). The SWISS-MODEL workspace: a
web-based environment for protein structure homology modelling. Bioinformatics 22, 195-
201.
Arsova, B., Hoja, U., Wimmelbacher, M., Greiner, E., Ustun, S., Melzer, M., Petersen, K.,
Lein, W., and Bornke, F. (2010). Plastidial Thioredoxin z Interacts with Two
Fructokinase-Like Proteins in a Thiol-Dependent Manner: Evidence for an Essential Role
in Chloroplast Development in Arabidopsis and Nicotiana benthamiana. The plant cell 22,
1498-1515.

References
124
Asada, K. (1999). The water-water cycle in chloroplasts: Scavenging of active oxygens and
dissipation of excess photons. Annual Review of Plant Physiologyogy and Plant
Molecular Biology 50, 601-639.
Asada, K. (2000). The water-water cycle as alternative photon and electron sinks. Philosophical
transactions of the Royal Society of London. Series B, Biological Sciences 355, 1419-
1431.
Baier, M., and Dietz, K.J. (1996). Primary structure and expression of plant homologues of
animal and fungal thioredoxin-dependent peroxide reductases and bacterial alkyl
hydroperoxide reductases. Plant Molecular Biology 31, 553-564.
Baier, M., and Dietz, K.J. (1997). The plant 2-Cys peroxiredoxin BAS1 is a nuclear-encoded
chloroplast protein: its expressional regulation, phylogenetic origin, and implications for
its specific physiological function in plants. The Plant Journal 12, 179-190.
Baier, M., and Dietz, K.J. (1999). Protective function of chloroplast 2-cysteine peroxiredoxin in
photosynthesis. Evidence from transgenic Arabidopsis. The Plant Physiologyogy 119,
1407-1414.
Baier, M., Stroher, E., and Dietz, K.J. (2004). The acceptor availability at photosystem I and
ABA control nuclear expression of 2-cys peroxiredoxin-alpha in Arabidopsis thaliana.
Plant and Cell Physiology 45, 997-1006.
Baier, M., Pitsch, N.T., Mellenthin, M., and Guo, W. (2010). Regulation of Genes Encoding
Chloroplast Antioxidant Enzymes in Comparison to Regulation of the Extra-plastidic
Antioxidant Defense System. Ascorbate-Glutathione Pathway and Stress Tolerance in
Plants, 337-386.
Baptista, P., Martins, A., Pais, M.S., Tavares, R.M., and Lino-Neto, T. (2007). Involvement of
reactive oxygen species during early stages of ectomycorrhiza establishment between
Castanea sativa and Pisolithus tinctorius. Mycorrhiza 17, 185-193.
Baruah, A., Simkova, K., Apel, K., and Laloi, C. (2009). Arabidopsis mutants reveal multiple
singlet oxygen signaling pathways involved in stress response and development. Plant
Molecular Biology 70, 547-563.
Bellafiore, S., Barneche, F., Peltier, G., and Rochaix, J.D. (2005). State transitions and light
adaptation require chloroplast thylakoid protein kinase STN7. Nature 433, 892-895.
Bienert, G.P., Schjoerring, J.K., and Jahn, T.P. (2006). Membrane transport of hydrogen
peroxide. BBA-Biomembranes 1758, 994-1003.
Bonardi, V., Pesaresi, P., Becker, T., Schleiff, E., Wagner, R., Pfannschmidt, T., Jahns, P.,
and Leister, D. (2005). Photosystem II core phosphorylation and photosynthetic
acclimation require two different protein kinases. Nature 437, 1179-1182.
Bouveret, E., Rigaut, G., Shevchenko, A., Wilm, M., and Seraphin, B. (2000). A Sm-like
protein complex that participates in mRNA degradation. EMBO Journal 19, 1661-1671.
Bouvier, F., Isner, J.C., Dogbo, O., and Camara, B. (2005). Oxidative tailoring of carotenoids: a
prospect towards novel functions in plants. Trends in Plant Science 10, 187-194.
Bowler, C., Vanmontagu, M., and Inze, D. (1992). Superoxide-dismutase and stress solerance.
Annual review of Plant Physiologyogy and Plant Molecular Biology 43, 83-116.

References
125
Brautigam, K., Dietzel, L., Kleine, T., Stroher, E., Wormuth, D., Dietz, K.J., Radke, D., Wirtz,
M., Hell, R., Dormann, P., Nunes-Nesi, A., Schauer, N., Fernie, A.R., Oliver, S.N.,
Geigenberger, P., Leister, D., and Pfannschmidt, T. (2009). Dynamic plastid redox
Ssgnals integrate gene expression and metabolism to induce distinct metabolic states in
photosynthetic acclimation in arabidopsis. The plant cell 21, 2715-2732.
Buchberger, A. (2010). Control of ubiquitin conjugation by cdc48 and its cofactors. Subcellular
Biochemistry 54, 17-30.
Cao, J., Schneeberger, K., Ossowski, S., Gunther, T., Bender, S., Fitz, J., Koenig, D., Lanz,
C., Stegle, O., Lippert, C., Wang, X., Ott, F., Muller, J., Alonso-Blanco, C., Borgwardt,
K., Schmid, K.J., and Weigel, D. (2011). Whole-genome sequencing of multiple
Arabidopsis thaliana populations. Nature Genetics 43, 956-U960.
Chae, H.Z., Chung, S.J., and Rhee, S.G. (1994). Thioredoxin-dependent peroxide reductase
from yeast. The Journal of Biological Chemistry 269, 27670-27678.
Chan, C.S., Guo, L., and Shih, M.C. (2001). Promoter analysis of the nuclear gene encoding the
chloroplast glyceraldehyde-3-phosphate dehydrogenase B subunit of Arabidopsis
thaliana. Plant Molecular Biology 46, 131-141.
Cheng, Y.T., Li, Y.Z., Huang, S.A., Huang, Y., Dong, X.N., Zhang, Y.L., and Li, X. (2011).
Stability of plant immune-receptor resistance proteins is controlled by SKP1-CULLIN1-F-
box (SCF)-mediated protein degradation. Proceedings of the National Academy of
Sciences USA 108, 14694-14699.
Chew, O., Whelan, J., and Millar, A.H. (2003). Molecular definition of the ascorbate-glutathione
cycle in Arabidopsis mitochondria reveals dual targeting of antioxidant defenses in plants.
Journal of Biological Chemistry 278, 46869-46877.
ChoudhuryI, S.K.P.S. (2005). Chromium stress in plants. Brazilian Journal of Plant
Physiologyogy 17.
Coll, N.S., Danon, A., Meurer, J., Cho, W.K., and Apel, K. (2009). Characterization of soldat8,
a suppressor of singlet oxygen-induced cell death in Arabidopsis seedlings. Plant and
Cell Physiology 50, 707-718.
Corpet, F. (1988). Multiple sequence alignment with hierarchical-clustering. Nucleic Acids
Research 16, 10881-10890.
Dal Corso, G., Borgato, L., and Furini, A. (2005). In vitro plant regeneration of the heavy metal
tolerant and hyperaccumulator Arabidopsis halleri (Brassicaceae). Plant Cell Tissue and
Organ Culture 82, 267-270.
Demmig-Adams, B., Gilmore, A.M., and Adams, W.W., 3rd. (1996). Carotenoids 3: in vivo
function of carotenoids in higher plants. The FASEB Journal 10, 403-412.
Desikan, R., Reynolds, A., Hancock, J.T., and Neill, S.J. (1998). Harpin and hydrogen
peroxide both initiate programmed cell death but have differential effects on defence
gene expression in Arabidopsis suspension cultures. The Biochemical Journal 330 (Pt 1),
115-120.
Doke, N. (1985). NADPH-dependent O2- generation in membrane-fractions isolated from
wounded potato-tubers inoculated with phytophthora-infestans. Physiological Plant
Pathology 27, 311-322.

References
126
Doke, N., Miura, Y., Sanchez, L.M., Park, H.J., Noritake, T., Yoshioka, H., and Kawakita, K.
(1996). The oxidative burst protects plants against pathogen attack: mechanism and role
as an emergency signal for plant bio-defence--a review. Gene 179, 45-51.
Donald, R.G.K., and Cashmore, A.R. (1990). Mutation of either G-Box or I-Box sequences
profoundly affects expression from the Arabidopsis Rbcs-1a promoter. EMBO Journal 9,
1717-1726.
Dyall, S.D., Brown, M.T., and Johnson, P.J. (2004). Ancient invasions: from endosymbionts to
organelles. Science 304, 253-257.
Elstner, E.F. (1991). Oxygen radicals - biochemical basis for their efficacy. Wiener klinische
Wochenschrift 69, 949-956.
Escoubas, J.M., Lomas, M., Laroche, J., and Falkowski, P.G. (1995). Light-Intensity regulation
of CAB gene-transcription is signaled by the redox state of the plastoquinone pool.
Proceedings of the National Academy of Sciences USA 92, 10237-10241.
Estavillo, G.M., Crisp, P.A., Pornsiriwong, W., Wirtz, M., Collinge, D., Carrie, C., Giraud, E.,
Whelan, J., David, P., Javot, H., Brearley, C., Hell, R., Marin, E., and Pogson, B.J.
(2011). Evidence for a SAL1-PAP chloroplast retrograde pathway that functions in
drought and high light signaling in Arabidopsis. The plant cell 23, 3992-4012.
Fester, T., and Hause, G. (2005). Accumulation of reactive oxygen species in arbuscular
mycorrhizal roots. Mycorrhiza 15, 373-379.
Foreman, J., Demidchik, V., Bothwell, J.H.F., Mylona, P., Miedema, H., Torres, M.A.,
Linstead, P., Costa, S., Brownlee, C., Jones, J.D.G., Davies, J.M., and Dolan, L.
(2003). Reactive oxygen species produced by NADPH oxidase regulate plant cell growth.
Nature 422, 442-446.
Forsburg, S.L., and Guarente, L. (1989). Communication between mitochondria and the
nucleus in regulation of cytochrome genes in the yeast Saccharomyces cerevisiae.
Annual Review of Cell Biology 5, 153-180.
Foyer, C.H., and Noctor, G. (2000). Oxygen processing in photosynthesis: regulation and
signalling. New Phytologist 146, 359-388.
Foyer, C.H., and Noctor, G. (2003). Redox sensing and signalling associated with reactive
oxygen in chloroplasts, peroxisomes and mitochondria. Physiologia Plantarum 119, 355-
364.
Foyer, C.H., and Noctor, G. (2005). Redox homeostasis and antioxidant signaling: A metabolic
interface between stress perception and physiological responses. The plant cell 17,
1866-1875.
Foyer, C.H., LopezDelgado, H., Dat, J.F., and Scott, I.M. (1997). Hydrogen peroxide- and
glutathione-associated mechanisms of acclimatory stress tolerance and signalling.
Physiologia Plantarum 100, 241-254.
Galvez-Valdivieso, G., and Mullineaux, P.M. (2010). The role of reactive oxygen species in
signalling from chloroplasts to the nucleus. Physiologia Plantarum 138, 430-439.
Gechev, T.S., and Hille, J. (2005). Hydrogen peroxide as a signal controlling plant programmed
cell death. The Journal of Cell Biology 168, 17-20.

References
127
Gendre, D., Czernic, P., Conejero, G., Pianelli, K., Briat, J.F., Lebrun, M., and Mari, S. (2007).
TcYSL3, a member of the YSL gene family from the hyper-accumulator Thlaspi
caerulescens, encodes a nicotianamine-Ni/Fe transporter. The Plant Journal 49, 1-15.
Gorman, A.A., and Rodgers, M.A.J. (1992). Current perspectives of singlet oxygen detection in
biological environments. Journal of Photochemistry and Photobiology B 14, 159-176.
Gou, M., Su, N., Zheng, J., Huai, J., Wu, G., Zhao, J., He, J., Tang, D., Yang, S., and Wang, G.
(2009). An F-box gene, CPR30, functions as a negative regulator of the defense
response in Arabidopsis. The Plant Journal: for cell and molecular biology 60, 757-770.
Gou, M.Y., Shi, Z.Y., Zhu, Y., Bao, Z.L., Wang, G.Y., and Hua, J. (2012). The F-box protein
CPR1/CPR30 negatively regulates R protein SNC1 accumulation. The Plant Journal 69,
411-420.
Goujon, M., McWilliam, H., Li, W.Z., Valentin, F., Squizzato, S., Paern, J., and Lopez, R.
(2010). A new bioinformatics analysis tools framework at EMBL-EBI. Nucleic Acids
Research 38, W695-W699.
Green, B.R. (2011). Chloroplast genomes of photosynthetic eukaryotes. The Plant Journal 66,
34-44.
Guan, L., Polidoros, A.N., and Scandalios, J.G. (1996). Isolation, characterization and
expression of the maize Cat2 catalase gene. Plant Molecular Biology 30, 913-924.
Guex, N., and Peitsch, M.C. (1997). SWISS-MODEL and the Swiss-PdbViewer: an environment
for comparative protein modeling. Electrophoresis 18, 2714-2723.
Guttman, H.N., and Vitetta, E.S. (1967). Endosymbiosis: infection and cure. The Yale Journal of
Biology and Medicine 40, 183-191.
Hall, J.L. (2002). Cellular mechanisms for heavy metal detoxification and tolerance. Journal of
Experimental Botany 53, 1-11.
Halliwell B, G.J. (1989). Free Radicals in Biology and Medicine. (Oxford University Press).
Hannah, M.A., Wiese, D., Freund, S., Fiehn, O., Heyer, A.G., and Hincha, D.K. (2006). Natural
genetic variation of freezing tolerance in arabidopsis. Plant Physiologyogy 142, 98-112.
Heiber, I., Stroher, E., Raatz, B., Busse, I., Kahmann, U., Bevan, M.W., Dietz, K.J., and Baier,
M. (2007). The redox imbalanced mutants of Arabidopsis differentiate signaling pathways
for redox regulation of chloroplast antioxidant enzymes. Plant Physiologyogy 143, 1774-
1788.
Hiltscher, H. (2011). Identifizierung und Charakterisierung von Signaltransduktionselementen der
2‐Cys‐Peroxiredoxin A Regulation in Arabidopsis thaliana (Heinrich-Heine-Universität
Düsseldorf).
Hofmann, B., Hecht, H.J., and Flohe, L. (2002). Peroxiredoxins. Biological Chemistry 383, 347-
364.
Horling, F., Baier, M., and Dietz, K.J. (2001). Redox-regulation of the expression of the
peroxide-detoxifying chloroplast 2-cys peroxiredoxin in the liverwort Riccia fluitans. Planta
214, 304-313.
Horling, F., Lamkemeyer, P., Konig, J., Finkemeier, I., Kandlbinder, A., Baier, M., and Dietz,
K.J. (2003). Divergent light-, ascorbate-, and oxidative stress-dependent regulation of

References
128
expression of the peroxiredoxin gene family in Arabidopsis. Plant Physiology 131, 317-
325.
Hossain M. A., P.P., Jaime A. Teixeira da Silva, and Masayuki Fujita. (2012). Molecular
mechanism of heavy metal toxicity and tolerance in plants: central role of glutathione in
detoxification of reactive oxygen species and methylglyoxal and in heavy metal chelation.
Journal of Botany 2012, 37.
Isemer, R., Mulisch, M., Schafer, A., Kirchner, S., Koop, H.U., and Krupinska, K. (2012).
Recombinant Whirly1 translocates from transplastomic chloroplasts to the nucleus. FEBS
Letters 586, 85-88.
Jander, G., Norris, S.R., Rounsley, S.D., Bush, D.F., Levin, I.M., and Last, R.L. (2002).
Arabidopsis map-based cloning in the post-genome era. Plant Physiology 129, 440-450.
Jeong, W., Cha, M.K., and Kim, I.H. (2000). Thioredoxin-dependent hydroperoxide peroxidase
activity of bacterioferritin comigratory protein (BCP) as a new member of the thiol-specific
antioxidant protein (TSA)/Alkyl hydroperoxide peroxidase C (AhpC) family. The Journal of
Biological Chemistry 275, 2924-2930.
Juszczak, I., Rudnik, R., Pietzenuk, B., and Baier, M. (2012). Natural genetic variation in the
expression regulation of the chloroplast antioxidant system among Arabidopsis thaliana
accessions. Physiologia Plantarum 146, 53-70.
Kangasjarvi, S., Lepisto, A., Hannikainen, K., Piippo, M., Luomala, E.M., Aro, E.M., and
Rintamaki, E. (2008). Diverse roles for chloroplast stromal and thylakoid-bound
ascorbate peroxidases in plant stress responses. Biochemical Journal 412, 275-285.
Karimi, M., Inze, D., and Depicker, A. (2002). GATEWAYTM
vectors for Agrobacterium-mediated
plant transformation. Trends in Plant Science 7, 193-195.
Karpinski, S., Escobar, C., Karpinska, B., Creissen, G., and Mullineaux, P.M. (1997).
Photosynthetic electron transport regulates the expression of cytosolic ascorbate
peroxidase genes in Arabidopsis during excess light stress. The plant cell 9, 627-640.
Karpinski, S., Reynolds, H., Karpinska, B., Wingsle, G., Creissen, G., and Mullineaux, P.
(1999). Systemic signaling and acclimation in response to excess excitation energy in
Arabidopsis. Science 284, 654-657.
Kiddle, G., Pastori, G.M., Bernard, S., Pignocchi, C., Antoniw, J., Verrier, P.J., and Foyer,
C.H. (2003). Effects of leaf ascorbate content on defense and photosynthesis gene
expression in Arabidopsis thaliana. Antioxidants & Redox Signaling 5, 23-32.
Kiefer, F., Arnold, K., Kunzli, M., Bordoli, L., and Schwede, T. (2009). The SWISS-MODEL
Repository and associated resources. Nucleic Acids Research 37, D387-D392.
Kilian, J., Whitehead, D., Horak, J., Wanke, D., Weinl, S., Batistic, O., D'Angelo, C.,
Bornberg-Bauer, E., Kudla, J., and Harter, K. (2007). The AtGenExpress global stress
expression data set: protocols, evaluation and model data analysis of UV-B light, drought
and cold stress responses. The Plant Journal 50, 347-363.
Kim, D.Y., Bovet, L., Maeshima, M., Martinoia, E., and Lee, Y. (2007). The ABC transporter
AtPDR8 is a cadmium extrusion pump conferring heavy metal resistance. The Plant
Journal 50, 207-218.

References
129
Kindgren, P., Noren, L., Lopez Jde, D., Shaikhali, J., and Strand, A. (2012a). Interplay
between Heat Shock Protein 90 and HY5 controls PhANG expression in response to the
GUN5 plastid signal. Molecular Plant 5, 901-913.
Kindgren, P., Eriksson, M.J., Benedict, C., Mohapatra, A., Gough, S.P., Hansson, M.,
Kieselbach, T., and Strand, A. (2011). A novel proteomic approach reveals a role for
Mg-protoporphyrin IX in response to oxidative stress. Physiologia Plantarum 141, 310-
320.
Kindgren, P., Kremnev, D., Blanco, N.E., de Dios Barajas Lopez, J., Fernandez, A.P.,
Tellgren-Roth, C., Kleine, T., Small, I., and Strand, A. (2012b). The plastid redox
insensitive 2 mutant of Arabidopsis is impaired in PEP activity and high light-dependent
plastid redox signalling to the nucleus. The Plant Journal: for cell and molecular biology
70, 279-291.
Klein, P., Seidel, T., Stocker, B., and Dietz, K.J. (2012). The membrane-tethered transcription
factor ANAC089 serves as redox-dependent suppressor of stromal ascorbate peroxidase
gene expression. Frontiers in Plant Science 3, 247.
Kliebenstein, D.J., Monde, R.A., and Last, R.L. (1998). Superoxide dismutase in Arabidopsis:
An eclectic enzyme family with disparate regulation and protein localization. Plant
Physiology 118, 637-650.
Kobae, Y., Sekino, T., Yoshioka, H., Nakagawa, T., Martinoia, E., and Maeshima, M. (2006).
Loss of AtPDR8, a plasma membrane ABC transporter of Arabidopsis thaliana, causes
hypersensitive cell death upon pathogen infection. Plant and Cell Physiology 47, 309-318.
Kohler, C., Merkle, T., and Neuhaus, G. (1999). Characterisation of a novel gene family of
putative cyclic nucleotide- and calmodulin-regulated ion channels in Arabidopsis thaliana.
The Plant Journal 18, 97-104.
Koussevitzky, S. (2007). Signals from chloroplasts converge to regulate nuclear gene
expression (vol 316, pg 715, 2007). Science 316, 1698-1698.
Kram, B.W., Xu, W.W., and Carter, C.J. (2009). Uncovering the Arabidopsis thaliana nectary
transcriptome: investigation of differential gene expression in floral nectariferous tissues.
BMC Plant Biology 9.
Kruk, J., Hollander-Czytko, H., Oettmeier, W., and Trebst, A. (2005). Tocopherol as singlet
oxygen scavenger in photosystem II. Journal of Plant Physiology 162, 749-757.
Kunkel, B.N. (1996). A useful weed put to work: Genetic analysis of disease resistance in
Arabidopsis thaliana. Trends in Genetics 12, 63-69.
Lamkemeyer, P., Laxa, M., Collin, V., Li, W., Finkemeier, I., Schottler, M.A., Holtkamp, V.,
Tognetti, V.B., Issakidis-Bourguet, E., Kandlbinder, A., Weis, E., Miginiac-Maslow,
M., and Dietz, K.J. (2006). Peroxiredoxin Q of Arabidopsis thaliana is attached to the
thylakoids and functions in context of photosynthesis. The Plant Journal 45, 968-981.
Larkin, R.M., Alonso, J.M., Ecker, J.R., and Chory, J. (2003). GUN4, a regulator of chlorophyll
synthesis and intracellular signaling. Science 299, 902-906.
Laule, O., Hirsch-Hoffmann, M., Hruz, T., Gruissem, W., and Zimmermann, P. (2006). Web-
based analysis of the mouse transcriptome using Genevestigator. BMC Bioinformatics 7.

References
130
Lee, K.P., Kim, C., Landgraf, F., and Apel, K. (2007). EXECUTER1- and EXECUTER2-
dependent transfer of stress-related signals from the plastid to the nucleus of Arabidopsis
thaliana. Proceedings of the National Academy of Sciences USA 104, 10270-10275.
Levine, A., Tenhaken, R., Dixon, R., and Lamb, C. (1994). H2O2 from the oxidative burst
orchestrates the plant hypersensitive disease resistance response. Cell 79, 583-593.
Low, P.S., and Merida, J.R. (1996). The oxidative burst in plant defense: Function and signal
transduction. Physiologia Plantarum 96, 533-542.
Lu, P.L., Han, X.W., Qi, J., Yang, J.G., Wijeratne, A.J., Li, T., and Ma, H. (2012). Analysis of
Arabidopsis genome-wide variations before and after meiosis and meiotic recombination
by resequencing Landsberg erecta and all four products of a single meiosis. Genome
Res 22, 508-518.
Marchler-Bauer, A., Zheng, C.J., Chitsaz, F., Derbyshire, M.K., Geer, L.Y., Geer, R.C.,
Gonzales, N.R., Gwadz, M., Hurwitz, D.I., Lanczycki, C.J., Lu, F., Lu, S.N., Marchler,
G.H., Song, J.S., Thanki, N., Yamashita, R.A., Zhang, D.C., and Bryant, S.H. (2013).
CDD: conserved domains and protein three-dimensional structure. Nucleic Acids
Research 41, D348-D352.
Marchler-Bauer, A., Lu, S., Anderson, J.B., Chitsaz, F., Derbyshire, M.K., et al. (2011). CDD:
a Conserved Domain Database for the functional annotation of proteins. Nucleic Acids
Research 39, D225-229.
Marnef, A., and Standart, N. (2010). Pat1 proteins: a life in translation, translation repression
and mRNA decay. Biochemical Society Transactions 38, 1602-1607.
Maruta, T., Noshi, M., Tanouchi, A., Tamoi, M., Yabuta, Y., Yoshimura, K., Ishikawa, T., and
Shigeoka, S. (2012). H2O2-triggered retrograde signaling from chloroplasts to nucleus
plays specific role in response to stress. Journal of Biological Chemistry 287, 11717-
11729.
Mccord, J.M., and Fridovic.I. (1969). Superoxide dismutase-an enzymic function for
erythrocuprein. Federation proceedings 28, 346-&.
Mehdy, M.C. (1994). Active oxygen species in plant defense against pathogens. Plant Physiology
105, 467-472.
Mehler, A.H. (1951). Studies on reactions of illuminated chloroplasts. I. Mechanism of the
reduction of oxygen and other Hill reagents. Archives of Biochemistry and Biophysics 33,
65-77.
Melonek, J., Mulisch, M., Schmitz-Linneweber, C., Grabowski, E., Hensel, G., and
Krupinska, K. (2010). Whirly1 in chloroplasts associates with intron containing RNAs
and rarely co-localizes with nucleoids. Planta 232, 471-481.
Meskauskiene, R., Nater, M., Goslings, D., Kessler, F., den Camp, R.O., and Apel, K. (2001).
FLU: A negative regulator of chlorophyll biosynthesis in Arabidopsis thaliana.
Proceedings of the National Academy of Sciences USA 98, 12826-12831.
Meskauskiene, R., Wursch, M., Laloi, C., Vidi, P.A., Coll, N.S., Kessler, F., Baruah, A., Kim,
C., and Apel, K. (2009). A mutation in the Arabidopsis mTERF-related plastid protein
SOLDAT10 activates retrograde signaling and suppresses 1O(2)-induced cell death. The
Plant Journal 60, 399-410.

References
131
Mittler, R., Vanderauwera, S., Gollery, M., and Van Breusegem, F. (2004). Reactive oxygen
gene network of plants. Trends in Plant Science 9, 490-498.
Mittler, R., Vanderauwera, S., Suzuki, N., Miller, G., Tognetti, V.B., Vandepoele, K., Gollery,
M., Shulaev, V., and Van Breusegem, F. (2011). ROS signaling: the new wave? Trends
in Plant Science 16, 300-309.
Mochizuki, N., Brusslan, J.A., Larkin, R., Nagatani, A., and Chory, J. (2001). Arabidopsis
genomes uncoupled 5 (GUN5) mutant reveals the involvement of Mg-chelatase H subunit
in plastid-to-nucleus signal transduction. Proceedings of the National Academy of
Sciences USA 98, 2053-2058.
Moller, I.M., and Sweetlove, L.J. (2010). ROS signalling - specificity is required. Trends in Plant
Science 15, 370-374.
Monaghan, J., Xu, F., Gao, M.H., Zhao, Q.G., Palma, K., Long, C.Z., Chen, S., Zhang, Y.L.,
and Li, X. (2009). Two Prp19-Like U-Box Proteins in the MOS4-Associated Complex
Play Redundant Roles in Plant Innate Immunity. Plos Pathog 5.
Morgan, D. (2007). The Cell Cycle: Principles of Control. (London: New Science Press).
Mostafavi, S., Ray, D., Warde-Farley, D., Grouios, C., and Morris, Q. (2008). GeneMANIA: a
real-time multiple association network integration algorithm for predicting gene function.
Genome Biology 9 Suppl 1, S4.
Mullineaux, P., and Karpinski, S. (2002). Signal transduction in response to excess light: getting
out of the chloroplast. Current Opinion in Plant Biology 5, 43-48.
Mullineaux, P.M., Karpinski, S., Jimenez, A., Cleary, S.P., Robinson, C., and Creissen, G.P.
(1998). Identification of cDNAS encoding plastid-targeted glutathione peroxidase. The
Plant Journal: for cell and molecular biology 13, 375-379.
Munne-Bosch, S. (2005). The role of alpha-tocopherol in plant stress tolerance. Journal of Plant
Physiology 162, 743-748.
Munne-Bosch, S., JOURNAL OFubany-Mari, T., and Alegre, L. (2003). Enhanced photo- and
antioxidative protection, and hydrogen peroxide accumulation in drought-stressed Cistus
clusii and Cistus albidus plants. Tree Physiology 23, 1-12.
Nanda, A.K., Andrio, E., Marino, D., Pauly, N., and Dunand, C. (2010). Reactive oxygen
species during plant-microorganism early interactions. Journal of Integrative Plant
Biology 52, 195-204.
Niki, E. (1987). Interaction of ascorbate and alpha-tocopherol. Annals of the New York Academy
of Sciences 498, 186-199.
Nishida, S., Tsuzuki, C., Kato, A., Aisu, A., Yoshida, JOURNAL OF., and Mizuno, T. (2011).
AtIRT1, the primary iron uptake transporter in the root, mediates excess nickel
accumulation in Arabidopsis thaliana. Plant & Cell Physiology 52, 1433-1442.
Noctor, G., and Foyer, C.H. (1998). Ascorbate and Glutathione: keeping active oxygen under
control. Annual review of Plant Physiologyogy and Plant Molecular Biology 49, 249-279.
Noordally, Z.B., Ishii, K., Atkins, K.A., Wetherill, S.JOURNAL OF., Kusakina, JOURNAL OF.,
Walton, E.JOURNAL OF., Kato, M., Azuma, M., Tanaka, K., Hanaoka, M., and Dodd,

References
132
A.N. (2013). Circadian control of chloroplast transcription by a nuclear-encoded timing
signal. Science 339, 1316-1319.
Ogawa, K., Sun, JOURNAL OF., Taketani, S., NakaJournal ofima, O., Nishitani, C., Sassa, S.,
Hayashi, N., Yamamoto, M., Shibahara, S., FuJournal ofita, H., and Igarashi, K.
(2001). Heme mediates derepression of Maf recognition element through direct binding to
transcription repressor Bach1. The EMBO Journal 20, 2835-2843.
op den Camp, R.G., Przybyla, D., Ochsenbein, C., Laloi, C., Kim, C., Danon, A., Wagner, D.,
Hideg, E., Gobel, C., Feussner, I., Nater, M., and Apel, K. (2003). Rapid induction of
distinct stress responses after the release of singlet oxygen in Arabidopsis. The plant cell
15, 2320-2332.
Palma, K., Zhao, Q.G., Cheng, Y.T., Bi, D.L., Monaghan, JOURNAL OF., Cheng, W., Zhang,
Y.L., and Li, X. (2007). Regulation of plant innate immunity by three proteins in a
complex conserved across the plant and animal kingdoms. Genes & Development 21,
1484-1493.
Park, S., Rancour, D.M., and Bednarek, S.Y. (2008). In planta analysis of the cell cycle-
dependent localization of AtCDC48A and its critical roles in cell division, expansion, and
differentiation. Plant Physiology 148, 246-258.
Patel, R.V., Nahal, H.K., Breit, R., and Provart, N.JOURNAL OF. (2012). BAR expressolog
identification: expression profile similarity ranking of homologous genes in plant species.
The Plant Journal 71, 1038-1050.
Pei, Z.M., Murata, Y., Benning, G., Thomine, S., Klusener, B., Allen, G.JOURNAL OF., Grill,
E., and Schroeder, JOURNAL OF.I. (2000). Calcium channels activated by hydrogen
peroxide mediate abscisic acid signalling in guard cells. Nature 406, 731-734.
Pena-Ahumada, A., Kahmann, U., Dietz, K.JOURNAL OF., and Baier, M. (2006). Regulation of
peroxiredoxin expression versus expression of Halliwell-Asada-Cycle enzymes during
early seedling development of Arabidopsis thaliana. Photosynthesis Research 89, 99-112.
Pesaresi, P., Schneider, A., Kleine, T., and Leister, D. (2007). Interorganellar communication.
Current Opinion in Plant Biology 10, 600-606.
Pesaresi, P., Pribil, M., Wunder, T., and Leister, D. (2011). Dynamics of reversible protein
phosphorylation in thylakoids of flowering plants: The roles of STN7, STN8 and TAP38.
BBA-Bioenergetics 1807, 887-896.
Pfannschmidt, T. (2003). Chloroplast redox signals: how photosynthesis controls its own genes.
Trends in Plant Science 8, 33-41.
Pfannschmidt, T., Schutze, K., Brost, M., and Oelmuller, R. (2001). A novel mechanism of
nuclear photosynthesis gene regulation by redox signals from the chloroplast during
photosystem stoichiometry adJournal ofustment. Journal of Biological Chemistry 276,
36125-36130.
Qi, Z., Hamza, I., and O'Brian, M.R. (1999). Heme is an effector molecule for iron-dependent
degradation of the bacterial iron response regulator (Irr) protein. Proceedings of the
National Academy of Sciences USA 96, 13056-13061.
Quintero, F.JOURNAL OF., Garciadeblas, B., and Rodriguez-Navarro, A. (1996). The SAL1
gene of Arabidopsis, encoding an enzyme with 3'(2'),5'-bisphosphate nucleotidase and

References
133
inositol polyphosphate 1-phosphatase activities, increases salt tolerance in yeast. The
plant cell 8, 529-537.
Ramos, JOURNAL OF., Matamoros, M.A., Naya, L., JOURNAL OFames, E.K., Rouhier, N.,
Sato, S., Tabata, S., and Becana, M. (2009). The glutathione peroxidase gene family of
Lotus Journal ofaponicus: characterization of genomic clones, expression analyses and
immunolocalization in legumes. The New Phytologist 181, 103-114.
Ramu, S.K., Peng, H.M., and Cook, D.R. (2002). Nod factor induction of reactive oxygen
species production is correlated with expression of the early nodulin gene rip1 in
Medicago truncatula. Molecular Plant-Microbe Interactions 15, 522-528.
Rancour, D.M., Dickey, C.E., Park, S., and Bednarek, S.Y. (2002). Characterization of
AtCDC48. Evidence for multiple membrane fusion mechanisms at the plane of cell
division in plants. Plant Physiology 130, 1241-1253.
Rancour, D.M., Park, S., Knight, S.D., and Bednarek, S.Y. (2004). Plant UBX domain-
containing protein 1, PUX1, regulates the oligomeric structure and activity of Arabidopsis
CDC48. Journal of Biological Chemistry 279, 54264-54274.
Rice, P., Longden, I., and Bleasby, A. (2000). EMBOSS: The European molecular biology open
software suite. Trends in Genetics 16, 276-277.
Richly, E., and Leister, D. (2004). An improved prediction of chloroplast proteins reveals
diversities and commonalities in the chloroplast proteomes of Arabidopsis and rice. Gene
329, 11-16.
Rodermel, S. (2001). Pathways of plastid-to-nucleus signaling. Trends in Plant Science 6, 471-
478.
Rodriguez Milla, M.A., Maurer, A., Rodriguez Huete, A., and Gustafson, JOURNAL OF.P.
(2003). Glutathione peroxidase genes in Arabidopsis are ubiquitous and regulated by
abiotic stresses through diverse signaling pathways. The Plant Journal 36, 602-615.
Rouhier, N., Gelhaye, E., Gualberto, JOURNAL OF.M., JOURNAL OFordy, M.N., De Fay, E.,
Hirasawa, M., Duplessis, S., Lemaire, S.D., Frey, P., Martin, F., Manieri, W., Knaff,
D.B., and JOURNAL OFacquot, JOURNAL OF.P. (2004). Poplar peroxiredoxin Q. A
thioredoxin-linked chloroplast antioxidant functional in pathogen defense. Plant
Physiology 134, 1027-1038.
Santos, R., Herouart, D., Sigaud, S., Touati, D., and Puppo, A. (2001). Oxidative burst in
alfalfa-Sinorhizobium meliloti symbiotic interaction. Molecular plant-microbe interactions :
MPMI 14, 86-89.
Scandalios, JOURNAL OF.G. (2005). Oxidative stress: molecular perception and transduction of
signals triggering antioxidant gene defenses. Brazilian Journal of medical and biological
research 38, 995-1014.
Schneeberger, K., Ossowski, S., Lanz, C., JOURNAL OFuul, T., Petersen, A.H., Nielsen,
K.L., JOURNAL OForgensen, JOURNAL OF.E., Weigel, D., and Andersen, S.U.
(2009). SHOREmap: simultaneous mapping and mutation identification by deep
sequencing. Nature Methods 6, 550-551.
Schroter, Y., Steiner, S., Matthai, K., and Pfannschmidt, T. (2010). Analysis of oligomeric
protein complexes in the chloroplast sub-proteome of nucleic acid-binding proteins from

References
134
mustard reveals potential redox regulators of plastid gene expression. Proteomics 10,
2191-2204.
Schutzendubel, A., and Polle, A. (2002). Plant responses to abiotic stresses: heavy metal-
induced oxidative stress and protection by mycorrhization. Journal of Experimental
Botany 53, 1351-1365.
Schuurink, R.C., Shartzer, S.F., Fath, A., and JOURNAL OFones, R.L. (1998).
Characterization of a calmodulin-binding transporter from the plasma membrane of barley
aleurone. Proceedings of the National Academy of Sciences USA 95, 1944-1949.
Shaikhali, JOURNAL OF., Heiber, I., Seidel, T., Stroher, E., Hiltscher, H., Birkmann, S., Dietz,
K.JOURNAL OF., and Baier, M. (2008). The redox-sensitive transcription factor Rap2.4a
controls nuclear expression of 2-Cys peroxiredoxin A and other chloroplast antioxidant
enzymes. BMC Plant Biology 8.
Shigeoka, S., Ishikawa, T., Tamoi, M., Miyagawa, Y., Takeda, T., Yabuta, Y., and Yoshimura,
K. (2002). Regulation and function of ascorbate peroxidase isoenzymes. Journal of
Experimental Botany 53, 1305-1319.
Shimizu, M., Kato, H., Ogawa, T., Kurachi, A., Nakagawa, Y., and Kobayashi, H. (2010).
Sigma factor phosphorylation in the photosynthetic control of photosystem stoichiometry.
Proceedings of the National Academy of Sciences USA 107, 10760-10764.
Smirnoff, N., and Wheeler, G.L. (2000). Ascorbic acid in plants: biosynthesis and function.
Critical Reviews in Biochemistry and Molecular Biology 35, 291-314.
Soitamo, A.JOURNAL OF., Piippo, M., Allahverdiyeva, Y., Battchikova, N., and Aro, E.M.
(2008). Light has a specific role in modulating Arabidopsis gene expression at low
temperature. BMC Plant Biology 8, 13.
Soukenik, M., Diehl, A., Leidert, M., Sievert, V., Bussow, K., Leitner, D., Labudde, D., Ball,
L.JOURNAL OF., Lechner, A., Nagler, D.K., and Oschkinat, H. (2004). The SEP
domain of p47 acts as a reversible competitive inhibitor of cathepsin L. FEBS letters 576,
358-362.
Stacy, R.A., Nordeng, T.W., Culianez-Macia, F.A., and Aalen, R.B. (1999). The dormancy-
related peroxiredoxin anti-oxidant, PER1, is localized to the nucleus of barley embryo and
aleurone cells. The Plant Journal 19, 1-8.
Stael, S., Rocha, A.G., Wimberger, T., Anrather, D., Vothknecht, U.C., and Teige, M. (2012).
Cross-talk between calcium signalling and protein phosphorylation at the thylakoid.
Journal of Experimental Botany 63, 1725-1733.
Steiner, S., Dietzel, L., Schroter, Y., Fey, V., Wagner, R., and Pfannschmidt, T. (2009). The
Role of phosphorylation in redox regulation of photosynthesis genes psaA and psbA
during photosynthetic acclimation of mustard. Molecular plant 2, 416-429.
Storz, G., JOURNAL OFacobson, F.S., Tartaglia, L.A., Morgan, R.W., Silveira, L.A., and
Ames, B.N. (1989). An alkyl hydroperoxide reductase induced by oxidative stress in
Salmonella-typhimurium and Escherichia-coli genetic characterization and cloning of
Ahp. Journal of Bacteriologyl 171, 2049-2055.
Strand, A. (2004). Plastid-to-nucleus signalling. Current Opinion in Plant Biology 7, 621-625.

References
135
Stratton, S.P., and Liebler, D.C. (1997). Determination of singlet oxygen-specific versus radical-
mediated lipid peroxidation in photosensitized oxidation of lipid bilayers: Effect of beta-
carotene and alpha-tocopherol. Biochemistry 36, 12911-12920.
Straus, M.R., Rietz, S., van Themaat, E.V.L., Bartsch, M., and Parker, JOURNAL OF.E.
(2010). Salicylic acid antagonism of EDS1-driven cell death is important for immune and
oxidative stress responses in Arabidopsis. The Plant Journal 62, 628-640.
Sun, X., Feng, P., Xu, X., Guo, H., Ma, JOURNAL OF., Chi, W., Lin, R., Lu, C., and Zhang, L.
(2011). A chloroplast envelope-bound PHD transcription factor mediates chloroplast
signals to the nucleus. Nature Communications 2, 477.
Susek, R.E., Ausubel, F.M., and Chory, JOURNAL OF. (1993). Signal transduction mutants of
Arabidopsis uncouple nuclear CAB and RBCS gene expression from chloroplast
development. Cell 74, 787-799.
Suzuki, N., and Mittler, R. (2012). Reactive oxygen species-dependent wound responses in
animals and plants. Free Radical Biology & Medicine 53, 2269-2276.
Suzuki, N., Koussevitzky, S., Mittler, R., and Miller, G. (2012). ROS and redox signalling in the
response of plants to abiotic stress. Plant, Cell & Environment 35, 259-270.
Swanson, S., and Gilroy, S. (2010). ROS in plant development. Physiologia Plantarum 138,
384-392.
Swarbreck, D., Wilks, C., Lamesch, P., Berardini, T.Z., Garcia-Hernandez, M., Foerster, H.,
Li, D., Meyer, T., Muller, R., Ploetz, L., Radenbaugh, A., Singh, S., Swing, V., Tissier,
C., Zhang, P., and Huala, E. (2008). The Arabidopsis Information Resource (TAIR):
gene structure and function annotation. Nucleic Acids Research 36, D1009-D1014.
Swarup, K., Alonso-Blanco, C., Lynn, JOURNAL OF.R., Michaels, S.D., Amasino, R.M.,
Koornneef, M., and Millar, A.JOURNAL OF. (1999). Natural allelic variation identifies
new genes in the Arabidopsis circadian system. The Plant Journal 20, 67-77.
Tikkanen, M., Gollan, P.JOURNAL OF., Suorsa, M., KangasJournal ofarvi, S., and Aro, E.M.
(2012). STN7 operates in retrograde signaling through controlling redox balance in the
electron transfer chain. Frontiers in Plant Science 3, 277.
Torres, M.A., JOURNAL OFones, JOURNAL OF.D.G., and Dangl, JOURNAL OF.L. (2006).
Reactive oxygen species signaling in response to pathogens. Plant Physiology 141, 373-
378.
Vanhee, C., Zapotoczny, G., Masquelier, D., Ghislain, M., and Batoko, H. (2011). The
Arabidopsis multistress regulator TSPO is a heme binding membrane protein and a
potential scavenger of porphyrins via an autophagy-dependent degradation mechanism.
The plant cell 23, 785-805.
Vert, G., Barberon, M., Zelazny, E., Seguela, M., Briat, JOURNAL OF.F., and Curie, C. (2009).
Arabidopsis IRT2 cooperates with the high-affinity iron uptake system to maintain iron
homeostasis in root epidermal cells. Planta 229, 1171-1179.
Vert, G., Grotz, N., Dedaldechamp, F., Gaymard, F., Guerinot, M.L., Briat, JOURNAL OF.F.,
and Curie, C. (2002). IRT1, an Arabidopsis transporter essential for iron uptake from the
soil and for plant growth. The plant cell 14, 1223-1233.

References
136
Vinti, G., Hills, A., Campbell, S., Bowyer, JOURNAL OF.R., Mochizuki, N., Chory, JOURNAL
OF., and Lopez-JOURNAL OFuez, E. (2000). Interactions between hy1 and gun
mutants of Arabidopsis, and their implications for plastid/nuclear signalling. The Plant
Journal 24, 883-894.
Voinnet, O., Rivas, S., Mestre, P., and Baulcombe, D. (2003). An enhanced transient
expression system in plants based on suppression of gene silencing by the p19 protein of
tomato bushy stunt virus. The Plant Journal 33, 949-956.
Voss, B., Meinecke, L., Kurz, T., Al-Babili, S., Beck, C.F., and Hess, W.R. (2011). Hemin and
magnesium-protoporphyrin IX induce global changes in gene expression in
Chlamydomonas reinhardtii. Plant Physiology 155, 892-905.
Vranova, E., Inze, D., and Van Breusegem, F. (2002). Signal transduction during oxidative
stress. Journal of Experimental Botany 53, 1227-1236.
Wagner, D., Przybyla, D., Camp, R.O.D., Kim, C., Landgraf, F., Lee, K.P., Wursch, M., Laloi,
C., Nater, M., Hideg, E., and Apel, K. (2004). The genetic basis of singlet oxygen-
induced stress responses of Arabidopsis thaliana. Science 306, 1183-1185.
Wang, X.Q., Watt, P.M., Louis, E.JOURNAL OF., Borts, R.H., and Hickson, I.D. (1996). Pat1:
A topoisomerase II-associated protein required for faithful chromosome transmission in
Saccharomyces cerevisiae. Nucleic Acids Research 24, 4791-4797.
Warde-Farley, D., Donaldson, S.L., Comes, O., Zuberi, K., Badrawi, R., Chao, P., Franz, M.,
Grouios, C., Kazi, F., Lopes, C.T., Maitland, A., Mostafavi, S., MontoJournal ofo,
JOURNAL OF., Shao, Q., Wright, G., Bader, G.D., and Morris, Q. (2010). The
GeneMANIA prediction server: biological network integration for gene prioritization and
predicting gene function. Nucleic Acids Research 38, W214-220.
Waters, M.T., Wang, P., Korkaric, M., Capper, R.G., Saunders, N.JOURNAL OF., and
Langdale, JOURNAL OF.A. (2009). GLK transcription factors coordinate expression of
the photosynthetic apparatus in Arabidopsis. The plant cell 21, 1109-1128.
Weigel D, G.JOURNAL OF. (2002). Arabidopsis: A Laboratory Manual. (Cold Spring Harbor
Laboratory Press).
Wiermer, M., Feys, B.JOURNAL OF., and Parker, JOURNAL OF.E. (2005). Plant immunity: the
EDS1 regulatory node. Current Opinion in Plant Biology 8, 383-389.
Willems, A.R., Schwab, M., and Tyers, M. (2004). A hitchhiker's guide to the cullin ubiquitin
ligases: SCF and its kin. BBA - Biochimica et Biophysica Acta 1695, 133-170.
Wilson, K.E., Sieger, S.M., and Huner, N.P.A. (2003). The temperature-dependent
accumulation of Mg-protoporphyrin IX and reactive oxygen species in Chlorella vulgaris.
Physiologia Plantarum 119, 126-136.
Winter, D., Vinegar, B., Nahal, H., Ammar, R., Wilson, G.V., and Provart, N.JOURNAL OF.
(2007). An "Electronic Fluorescent Pictograph" browser for exploring and analyzing large-
scale biological data sets. PloS ONE 2, e718.
Woodson, JOURNAL OF.D., and Chory, JOURNAL OF. (2008). Coordination of gene
expression between organellar and nuclear genomes. Nature Reviews Genetics 9, 383-
395.

References
137
Woodson, JOURNAL OF.D., Perez-Ruiz, JOURNAL OF.M., and Chory, JOURNAL OF. (2011).
Heme synthesis by plastid ferrochelatase I regulates nuclear gene expression in plants.
Current Biology : CB 21, 897-903.
Xiao, Y., Savchenko, T., Baidoo, E.E., Chehab, W.E., Hayden, D.M., Tolstikov, V., Corwin,
JOURNAL OF.A., Kliebenstein, D.JOURNAL OF., Keasling, JOURNAL OF.D., and
Dehesh, K. (2012). Retrograde signaling by the plastidial metabolite MEcPP regulates
expression of nuclear stress-response genes. Cell 149, 1525-1535.
Yang, M.S., Chan, H.W., and Yu, L.C. (2006). Glutathione peroxidase and glutathione reductase
activities are partially responsible for determining the susceptibility of cells to oxidative
stress. Toxicology 226, 126-130.
Yuan, X.M., Simpson, P., Mckeown, C., Kondo, H., Uchiyama, K., Wallis, R., Dreveny, I.,
Keetch, C., Zhang, X.D., Robinson, C., Freemont, P., and Matthews, S. (2004).
Structure, dynamics and interactions of p47, a maJournal ofor adaptor of the AAA
ATPase, p97. EMBO Journal 23, 1463-1473.
Zhang, L., and Hach, A. (1999). Molecular mechanism of heme signaling in yeast: the
transcriptional activator Hap1 serves as the key mediator. Cellular and Molecular Life
Sciences 56, 415-426.
Zimmermann, P., Hennig, L., and Gruissem, W. (2005). Gene-expression analysis and network
discovery using Genevestigator. Trends in Plant Science 10, 407-409.
Zimmermann, P., Hirsch-Hoffmann, M., Hennig, L., and Gruissem, W. (2004).
GENEVESTIGATOR. Arabidopsis microarray database and analysis toolbox. Plant
Physiology 136, 2621-2632.

Appendix
138
Appendix
A.1 Primers used for mapping PCR
Gene Forward primer Tm [°C]
Reverse primer Tm [°C]
AtSO392 GTTGATCGCAGCTTGATAAGC 62 TTTGGAGTTAGACACGGATCTG 62
nga280 GGCTCCATAAAAAGTGCACC 62 CTGATCTCACGGACAATAGTGC 63
nga111 CTCCAGTTGGAAGCTAAAGGG 63 TGTTTTTTAGGACAAATGGCG 59
cer 461704 TGGGCAGAAGATCTGTACTC 61 TTGGACAGAGATCTTGCCTG 62
cer458709 AGCAGAGTCTTGTTGGTG 60 CGGTTACGTAGAGTAAGC 57
cer449005 CTTTCATGCGGAAGTGAGTG 62 TCCTCGTGCTTGGTTTGAC 63
cer451562 GCAAGAACCAATAAGCTCCC 62 AAGGGCATCATGAAAAGGGC 67
cer459016 CTATTAAGTGCACACGGCAG 61 ATTTGCACCCATTTCCTTAC 60
cer460565 TACTTGGATTCAGGACATTC 57 CTCCTCGGTTATTTCCACGC 66
cer451817 CCTAGCCTTCTTTTGACC 57 AAGCTTCTGACTCAACTCTC 59
cer452410 TTCTCAACACCACCTCTG 59 AAGACAAAATCTGAGGCG 57
cer464712 TTGAGGATGCAAGAGAGTC 59 GAGGTACGTGAATGAACAC 58
M1 CAAGAAAAACCGAATTCACG 57 AGAACTAGAATTTCCATGTC 54
cer455387 AAACCCTACTAGAGTGTGAC 52 TCTCTGTCACTCTTTTCCTC 56
cer455755 ACTGTTTTGTGGTAGTCCTG 57 GTATAACCCTTTTCATAGAC 55
cer455911 GCTTCAGACATAAACTACAG 51 GATACATTGAATTCGACATCC 58
cer455003 TAACCACAGCTATGAGGTCG 60 CTGAACCTTTCTAGTTACCC 55
cer459593 TATCATGACAGCCAGCCAC 63 GTGAGGGACACAATTCGTC 61
M2 AAATAGACCCCACGAAGTCG 62 GAGAGAAAGAGAGATGACG 57
cer470812 TCACCCATAAACCCAAACAC 62 TAGAAGTGTGGTTTTGGTCC 59
F5N16 AACCGTTACATTTCGACTAC 56 TGAACATTCAATCTAATACTATGAG 56
nga8 TGGCTTTCGTTTATAAACATCC 59 GAGGGCAAATCTTTATTTCGG 59
cer452834 AGGAGGAGGTGCAGGAAGA 59 AGCGTATACGACATGTATAAG 56
cer458607 GGAAACAACTTATTTTTCGAACC 58 GCAAGTCTCAACCTTTAATCACTT 58
cer458584 GTTTTGTCATTCGCCAAGATTC 60 TCTCAATGTTCGTGGGGTTT 60
cer449366 AAAGTTTACTCGAGTGGTCC 57 CTGTAAATTTTTGTAACGGC 56
nga249 GGATCCCTACTGTAAAATCCC 60 TACCGTCAATTTCATCGCC 60
nga139 GGTTTCGTTTCACTATCCAGG 61 AGAGCTACCAGATCCGATGG 64
MCO15 TAACCGAGCGAGGGCTACAG 67 ACGAGGTAAAAGGTCGGTCC 65

Appendix
139
A.2 Primers used for genotyping
Primer Sequence Tm [°C]
SAIL-LB3 TAGCATCTGAATTTCATAACCAATCTCGATACAC 70
GABI-o8409 ATATTGACCATCATACTCATTGC 59
FLAG-RB4 TCACGGGTTGGGGTTTCTACAGGAC 73
FLAG-LB4 CGTGTGCCAGGTGCCCACGGAATAGT 78
SAIL-RB3 CATGGCATATGCTAGCATGC 64
SAIL-LB3 TTCATAACCAATCTCGATACAC 58
INRA-LB GCCAGGTGCCCACGGAATAG 70
INRA-RB CGGGTTGGGGTTTCTACAGGAC 69
AT3G21570-SALK_130153-F GGCGGTTTCCGGTGAAAATG 65
AT3G21570-SALK_130153-R GCGAAAAGCCAGGTTGTTG 63
AT3G21610-SALK_086303-F GTCATCACCTCGTCCATAGG 62
AT3G21610-SALK_086303-R CACAATAATTGATCCTTCCC 56
AT3G21620-Flag619b12-F CCGAAAACATGGAACATCCT 61
AT3G21620-Flag619b12-R CCTGAGCAGATTGGTTTCCT 63
AT3G21630-SALK_007193-F GAAGCTTCCTTAGATTCCCC 60
AT3G21630-SALK_007193-R AGAAATGGCGGTCTTCATAG 60
AT3G21630-GK-096F09.02-F CTGGTGCCATGTAACCAAATG 62
AT3G21630-GK-096F09.02-R GGCATGTATGTGGATCACTT 60
AT3G21650-SALK_059659-F CCACGCGTGTTTCTCTCAAG 64
AT3G21650-SALK_059659-R GTGTCCTCAGTCAATCTTAC 57
AT3G21660-GABI_400B11-F CCTGTAATACACAAGATCC 54
AT3G21660-GABI_400B11-R GGCTCTTCCGGTTACTCTCC 65
AT3G21660-SAIL_743_A08-F CTAATGTGCTTAGAAAAGAG 53
AT3G21660-SAIL_743_A08-R TCCAGCTTATATTAGCAGAC 56
AT3G21670-SALK_001553-F CGCTTGTTCGACCGTGAAAG 65
AT3G21670-SALK_001553-R GGCTGTAGCCGCGGTTATAG 66
AT4G01290-SALK_038452-F LP GTATTGTTGGGGATGTTGGTG 59
AT4G01290-SALK_038452-R RP GAAATACGAAGCCCTCAGACC 60

Appendix
140
A.3 Primers used for qRT-PCR
Gene Gene code
Forward primer Reverse primer Tm [°C]
actin-7 At5g09810 GTTGCCATTCAGGCCGTTCTTTC CAGAATCGAGCACAATAC-CGGTTG
60
sAPX At4g08390 AGAATGG-GATTAGATGACAAGGAC
TCCTTCTTTCGTGTACTTCGT 60
tAPX At1g77490 GCTAGTGCCACAGCAATAGAG-GAG
TGATCAGCTGGTGAAGGAGGTC
60
RMB1 At1g32230 TTCCTCCTCAATTGGAG-TCAAACC
AACCAACACTGTTTGCAC-TTCCTG
68
RIMB3 At4g01290 CGTCACAAGGCTTTCCCTTTGC CTCCTCTGTTGACTTGAGAAC-CTG
68
2CPA At3g11630 CCCAACAGAGATTACTGCCT ATAGTTCAGATCACCAAGCCC 60
2CPB At5g06290 TCATACCCTCTTCCTCGGCAT ACCGACCAGTGG-TAAATCATCAGC
60
A.4 Other primers
Primer Sequence Tm [°C]
Luc-RT1 ATTGACAAGGATGGATGGCTAC 58
Luc-RT3 AGACCTTTCGGTACTTCGTC 57
M13-F(-20) GTAAAACGACGGCCAG 57
M13-R CAGGAAACAGCTATGAC 50
2CPAProm-entry-F CACCATCCAACTAATGGAC 57
2CPAProm-entry-R TGCTACACACACTTTGTGAC 57
pHGWFS7-2016bp-F CTCAGTGGCTCCTTCAACG 64
pHGWFS7-4089bp-R GTGGTGCAGATGAACTTCAGG 64

List of publication and Meeting abstracts
141
List of publication
Baier M,. Pitsch N.T., Mellenthin M, and Guo W. (2010) Regulation of Genes Encoding
Chloroplast Antioxidant Enzymes in Comparison to Regulation of the Extra-plastidic An-
tioxidant Defense System. Naser A. Anjum N. A., Umarm S., Chan MT. (Eds.) Ascor-
bate-Glutathione Pathway and Stress Tolerance in Plants (pp. 337 -386) New York, NY:
Springer.
Meeting abstracts
Wei G, Baier M, (2009) Identification of transcriptional regulators of 2CPA using EMS-
mutagenesis and reporter gene based QTL-mapping. Deutsche Botanikertagung 2009,
Leipzig, Germany (poster presentation)
Wei G, Hiltscher H, Heiber I, Baier M (2010) A mutant screen for identification of regu-
lators involved in chloroplast-to-nucleus redox signaling. 21th International Conference
on Arabidopsis Research, Yokohama, Japan (poster presentation)
Wei G, Hiltscher H, Heiber I, Baier M (2010) A mutant screen for identification of regu-
lators involved in chloroplast-to-nucleus redox signaling.19th Photosynthesis workshop,
Frankfurt, Germany (poster presentation)
Wei Guo, Frenkel M, Hilscher H and Baier M (2010) Identification of regulators in-
volved in chloroplast-to-nucleus redox signaling and their effects on growth and fitness
signals. 4th SFB 429 International Symposium: ‘‘Sensing and plant primary metabolism.’’
Potsdam, Germany (poster presentation)
Wei G, Hiltscher H, Heiber I, Baier M (2011), Identification of regulators involved in
chloroplast to nucleus redox signaling. Plant Biology 2011 Meeting, Minneapolis, United
States (poster presentation)
Wei G, Hiltscher H, Heiber I, Baier M (2011), Identification of regulators rnvolved in
chloroplast to nucleus redox signaling Molecular interactions workshop 2011, Berlin,
Germany (poster presentation)
Wei G, Hiltscher H, Heiber I, Baier M (2011) Identification of transcriptional regulators
of 2CPA using EMS-mutagenesis and reporter gene based QTL-mapping. Deutsche
Botanikertagung 2011, Berlin, Germany (poster presentation)
Wei G, Hiltscher H, Heiber I, Baier M (2012) Identification and characterization of regu-
lators of 2-Cys-Peroxiredoxin A in Arabidopsis thaliana. Havel-Spree-Colloquium,
Potsdam, Germany (oral presentation)

Acknowledgement
142
Acknowledgement
Foremost, I would like to express my sincere gratitude to my supervisor Prof. Dr.
Magarete Baier for the support of my Ph.D study and research, with her patience, moti-
vation, enthusiasm, and immense knowledge. Especially, I would like to thank her for her
tolerance to my disorderness in the laboratory. Her guidance helped me throughout my
research and writing of this thesis. I could not have imagined having a better advisor and
mentor for my Ph.D study. I am also thankful to the financial support of the DFG.
I would like to thank our collaboration partner Prof. Dr Ute Krämer for ICP-MS measure-
ment and Dr. Beth Rowan for the NGS projects.
I extend my thanks to present and former members of the research group of Prof. Dr.
Baier, who helped me during my stay in the laboratory. The group has been a source of
friendship as well as good advice and collaboration. I am grateful to Dr. Jote Bulcha for
his help during my research and thesis writing. He is not only my labmate but also my
friend for life. My warm appreciation also goes to Dr. Marina Mellenthin, Ms. Sabine
Matuszak and Ms. Ulrike Ellersiek for their friendly help in and out of laboratory.
I would like to express my thanks to Ms. Anting Zhu, who helped me to check my thesis.
I also would like to thank my thesis examination committee member and second super-
visor, Prof. Dr. Wolfgang Schuster, who encouraged me during my Ph.D study and took
time to review my thesis.
Very special thanks go to Mr. Yunpeng Bai. He suggested me of an alternative career
path besides scientific research after my Ph.D study.
Finally, I would like to thank my family, my father Genkui Guo and my mother Meiying
Pan and my sister Ting Guo, who support me spiritually throughout my life.

Declaration
143
I hereby declare that I have prepared and written the presented doctoral thesis myself
using only the presented methods and sources. All sources from literature are marked
as such and are properly cited
Berlin, August 2013
Wei Guo