Embed Size (px)
DESCRIPTION
ICC 2009 International Cartography Conference. APPLYING SATELLITE IMAGES CLASSIFICATION ALGORITHMS FOR SOIL COVER AND GEORESOURCES IDENTIFICATION IN NOVA LIMA, MINAS GERAIS - BRAZIL. Vladimir Diniz Vieira Ramos Universidade Federal de Minas Gerais Departamento de Cartografia. Pedro Pina - PowerPoint PPT Presentation
Citation preview

ICC 2009
International Cartography Conference
APPLYING SATELLITE IMAGES CLASSIFICATION ALGORITHMS FOR SOIL COVER AND GEORESOURCES
IDENTIFICATION IN NOVA LIMA, MINAS GERAIS - BRAZIL
Vladimir Diniz Vieira RamosUniversidade Federal de Minas Gerais
Departamento de Cartografia
Pedro PinaInstituto Superior Técnico – Portugal
Departamento de Engenharia de Minas e Georecursos

•Geoprocessing has been a tool of great importance to resources management and administration at different scales.
•Understanding the behavior and distribution of surface resources and surface phenomena enables planning actions that lead to the full development of a region.
•Geoprocessing is an important tool in the management and development of environmental and anthropic activities.
•In the case of intensive spatial changes, Belo Horizonte Metropolitan Region (RMBH) is, in Minas Gerais Estate, the best example.
•In different periods of time the RMBH was affected in different areas of expansion.
•The focus of this work is the most current axis of expansion: the south route toward the city of Nova Lima.
INTRODUCTION
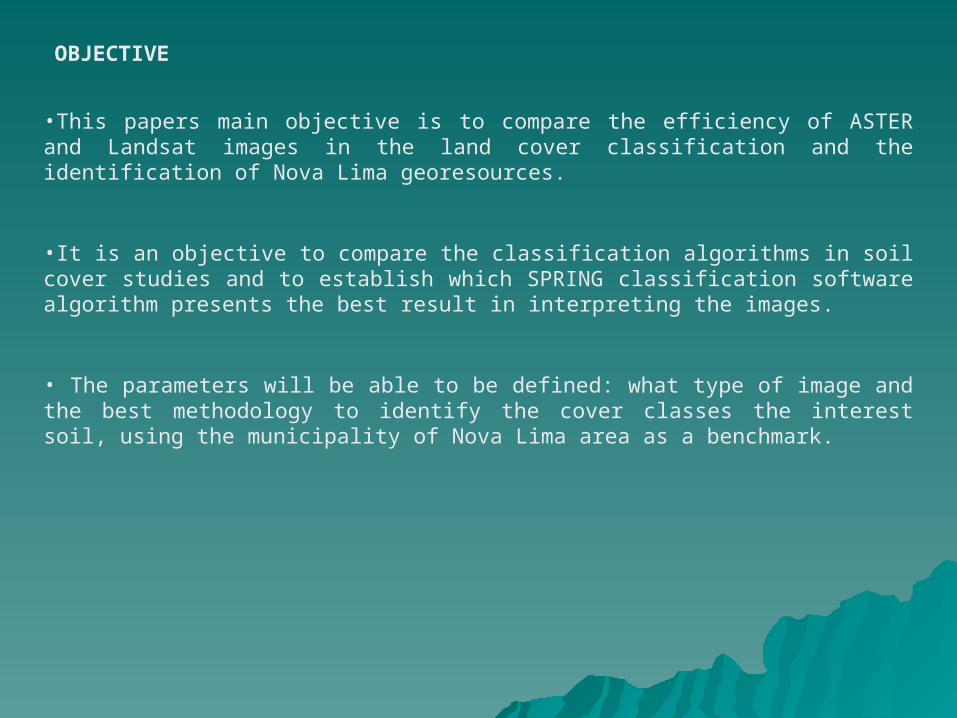
OBJECTIVE
•This papers main objective is to compare the efficiency of ASTER and Landsat images in the land cover classification and the identification of Nova Lima georesources.
•It is an objective to compare the classification algorithms in soil cover studies and to establish which SPRING classification software algorithm presents the best result in interpreting the images.
• The parameters will be able to be defined: what type of image and the best methodology to identify the cover classes the interest soil, using the municipality of Nova Lima area as a benchmark.

•Nova Lima county borders Belo Horizonte county, its headquarters is 22 km from the Belo Horizonte (Minas Gerais Estate capital).
•Its area is about 429 km2 and the population density is 149.6 habitants/km2
•The city has a tradition of mining and was founded in 1891.
•Costa and Pacheco (2004) explain that the core city of Nova Lima was consolidated during the setting of the mining activity, where the principal activity was the gold extraction. This situation has creating a larger social segmentation with the occurrence of several social classes.
•According to its location like a metropolitan county area, it is under an increasing influence of the principal city Belo Horizonte. A process of conurbation is starting due to the expansion of the south neighborhoods south condominiums, which are following the axis of the road BR040, output to Ouro Preto city.
DESCRIPTION OF AREA
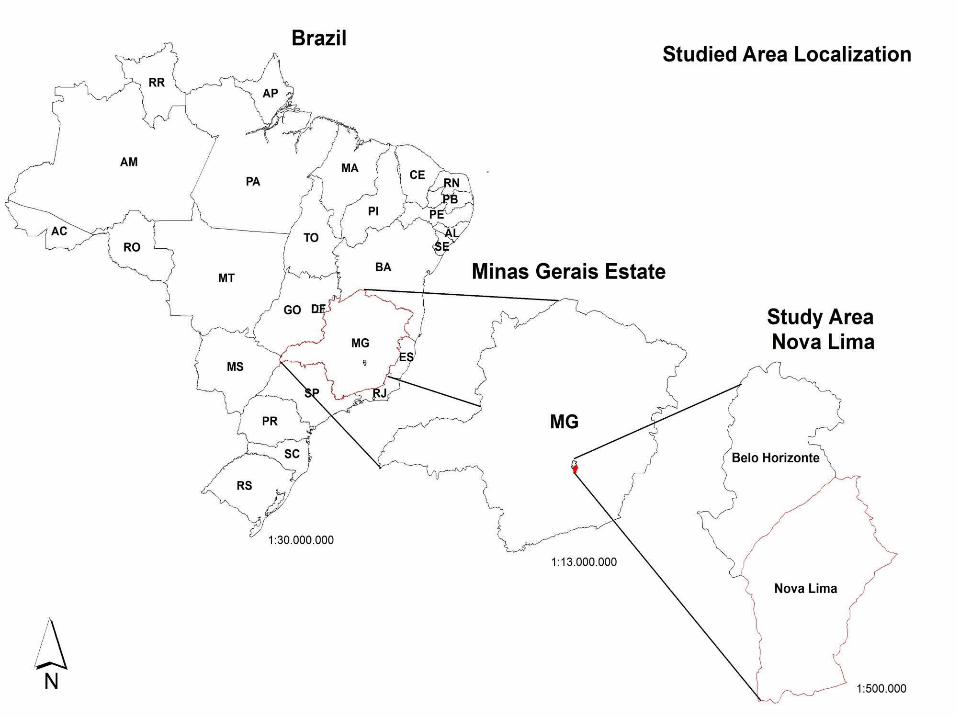

•The remote sensing database is formed by two scenes, an ASTER 2002 orbit/point 131/602 covering Nova Lima county area, and a Landsat ETM 2007 orbit/point 218/74, the area of study corresponding to the coordinates -44° 01’, -20° 13’ / -43° 47’, -19° 55’.
•The software used is the SPRING that, according to INPE (2004), has the following characteristics: runs as a database without geographical borders and supports large data volumes (without limitations of scale, projection and zone).
•Through bands with spatial resolution of 15 and 30 meters of Aster and 3 bands of Landsat ETM of 30 meters, the SPRING classifiers efficiency was tested from a simple composition and from the main component.
•The classes were defined from previous experience with classification, area knowledge and high-resolution images available for classification validation. It was used a Quickbird image taken in 2007 of the Nova Lima County.
•It was also applied a band equalization. To achieve the equalization it was used the SPRING arithmetic tool.
MATERIALS AND METHODS

Classes defined for classification:
•Urban area or amended - urban areas, mining areas, urban roads, outcrops, areas degraded by human action.•Dense vegetation - area with large number of trees, forest remnants, spring areas, riparian forest, parks, reforestation areas.•Underwood - area with a predominance of shrubs and herbaceous vegetation, pasture areas, cultivation areas, typical areas of Cerrado.•Water and Shadow – Water mirror areas or shadow predominance. •Exposed soil - areas where the soil structure is exposed due to natural processes or human action.
•To test the images in soil cover classification and region georesources identification it was defined two types of SPRING classifiers. These classifiers were tested in the two images.
• The classification was made from bands collected from the Principal Components results and from the RGB 543 LandSat composition, both by supervised methods, with the former using a segmentation procedure preceding the classification process and a pixel-to-pixel classification.
MATERIALS AND METHODS (Cont.)

•The segmentation process is a combination of smaller regions that have a certain similarity in their spectral behavior. It was followed by the choice of targeted images classification method and Battacharya.
• Another method also used in two images was the Maxver, or Maximum Likelihood, which is a process of pixel-to-pixel.
MATERIALS AND METHODS (Cont.)

•From the Principal Components method were defined 3 PCs (Principal Components) where most of the information from the 9 bands of Aster were concentrated. From these 3 PCs it was created one of the images RGB composition.
RESULTS AND DISCUSSION
PC Self-values Percentage
P1 14148.45 84.82
P2 1552.52 9.31
P3 665.00 3.99
P4 158.16 0.95
P5 53.89 0.32
P6 42.46 0.25
P7 26.14 0.16
P8 18.74 0.11
P9 14.85 0.09
Principal Component self-values generated
•The SPRING produces reports about the classes obtained in the classification process. From these reports and from the visual analysis final results generated by the classification process it is possible to answer which method produces the best result within the classes defined in the methodology.

•While comparing the results of each composition for the two methods defined by methodology, the classifier that used the segmentation process and the Principal Component generated bands brings the best results according to the report generated by SPRING classification samples.
• Through a visual analysis of the classification result, this composition was the best in identifying the occupation diversity of the land area.
RESULTS AND DISCUSSION
Image General Performance Average Confusion
RGB Principal Components Aster - Battachara 99.8% 0.11%
RGB Principal Components Aster - Maxver 97.08% 2.92%
RGB Landsat - Battachara 97.47% 2.53%
RGB Landsat - Maxver 93.91% 0.32%
•In the classification process we are able to see that the exposed soil classes, water and shade and dense vegetation are those with less confusion or even none if compared to the other ones .
Performance Comparison

•However, the vegetation classes have high levels of confusion with the urban area and the degraded areas.
•The Principal Components RGB image showed the ability to identify subclasses of all classes defined in the methodology, which hindered the samples gathering for classification.
•Otherwise, it has shown the good performance of Aster pictures to identify a more detailed level of soil occupation.
•Confirmed the ASTER images potential to map and monitor the usage and occupation of various regions, while associated with the Principal Components Process, not only in monitoring the usage and occupation but in the detection of georesources.
RESULTS AND DISCUSSION (Cont.)


•Used as tools for acquiring databases, satellite images have shown to be, every day, a great source of information as they progress their spectral and temporal spatial resolution.
•Aster images have demonstrated their ability using the SPRING classification methods. Within an area of great complexity and achieving an acceptable accuracy, it was possible to identify the land occupation of two counties on its main elements.
•The combination of classification methods with the Principals Components has been offering greater capacity to distinguish among classes, which makes possible to identify subclasses in all classes defined by the methodology.
• Once we have verified the method benefits for the identification of land occupation in a certain area, it may be possible to replicate it in other areas where there are images of the same pattern.
•The growing need for a more detailed classification plan has assigned the classifying tools a huge responsibility in databases construction, thus we must be aware to this method capacity and limitations.
CONCLUSION

ABRAMS, Michael HOOK, Simon, ASTER User Handbook Version 2, Jet Propulsion Laboratory 4800 Oak Grove Dr. Pasadena, CA 91109 Bhaskar Ramachandran EROS Data Center Sioux Falls, SD 57198
COSTA, Geraldo. M.; PACHECO, P. D. Planejamento urbano no ambiente metropolitano: o caso do município de Nova lima na Região Metropolitana de Belo Horizonte. In: VII SEMINÁRIO DA HISTORIA DA CIDADE E DO URBANISMO, 7, 2004, Niterói. Anais do VII Seminário da História da Cidade e do Urbanismo, Niterói: Escola de Arquitetura e Urbanismo da UFF, 2004. p. 1-12.
CORRÊA, Roberto Lobato. O Espaço urbano. São Paulo: Ática, 2002. 94p.
CRÓSTA, Álvaro Penteado. Processamento Digital de Imagens de Sensoriamento Remoto. Campinas, SP: IG/UNICAMP, 1992. 170p
IBGE, Pesquisa de Informações Básicas Municipais – 2001.
INPE, INSTITUTO NACIONAL DE PESQUISAS ESPACIAIS. SPRING: manual do usuário. São José dos Campos: INPE. 2004
XAVIER-DA-SILVA, Jorge. Acesso a dados e transformações preparatórias à análise ambiental. Rio de Janeiro: Lageop, 1999. 12 p. Apostila do Curso de Especialização em Geoprocessamento - Midia CD-rom).
REFERENCES


![New E-Books February 2015 - European University Institute · # 12 Advances in Cartography and GIScience. Volume 2 [electronic resource] : Selection from ICC 2011, Paris Ruas, Anne](https://img.pdfslide.us/doc/110x75/5ec84694d0cd7c3a730fb3fc/new-e-books-february-2015-european-university-institute-12-advances-in-cartography.jpg)