Embed Size (px)
Citation preview

I I I I I I I I I I I I I I I I I I I
r:'P'r.'l ~
US Army Corps of EngineerS. Buffalo District
FINAL
SAMPLING AND ANALYSIS PLAN
VOLUME 2 - QUALITY ASSURANCE PROJECT PLAN
TONAWANDA LANDFILL FUSRAP SITE
TONAWANDA, NEW YORK
JUNE 5, 2001
I I I I I I I I I I I I I I I I I I I
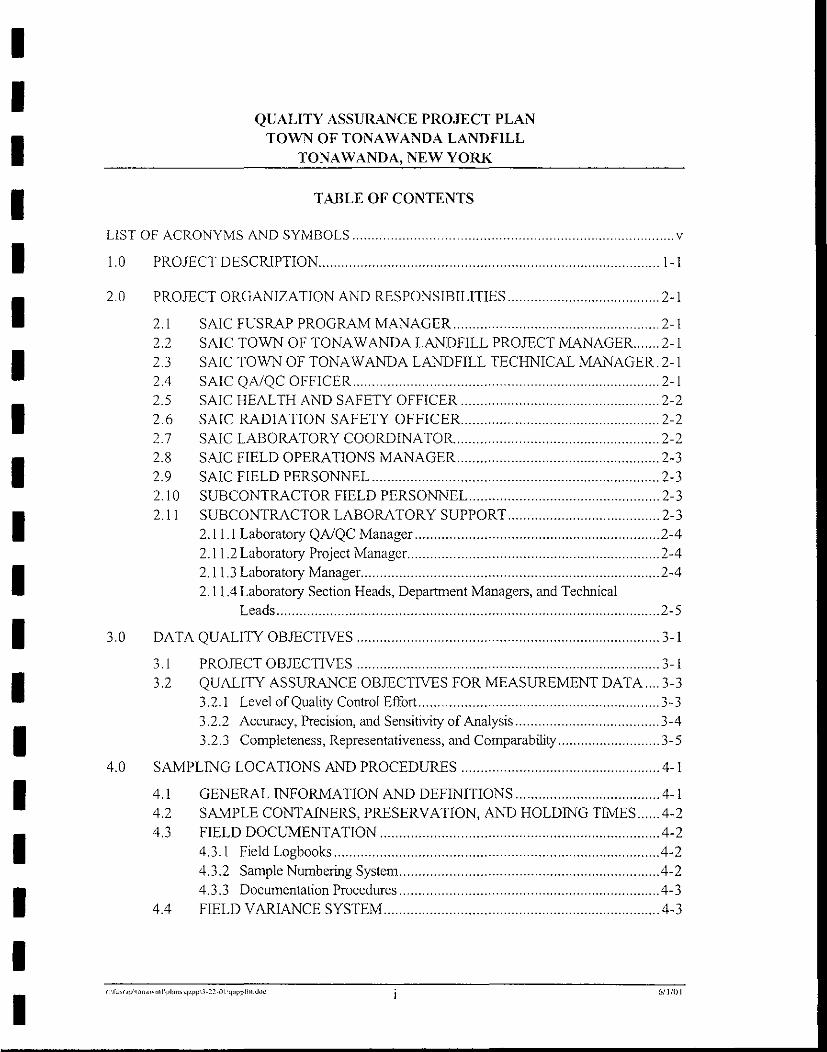
QUALITY ASSURAt'ICE PROJECT PLAJ.'I TOWN OF TONAWANDA LAJ.'IDFILL
TONAWANDA, NEW YORK
TABLE OF CONTENTS
LIST OF ACRONYMS AND SYMBOLS ................................................................................ v
1.0 PROJECT DESCRIPTION ...................................................................................... 1-1
2.0 PROJECT ORGAJ.'IIZATION AND RESPONSIBILITIES ........................................ 2-1
2.1 SAIC FUSRAP PROGRAM MANAGER .................................................... 2-1 2.2 SAIC TOWN OF TONAWANDA LA.t'IDFILL PROJECT MANAGER ....... 2-1 2.3 SAIC TOWN OF TONAWANDA LANDFILL TECHNICAL MANAGER. 2-1 2.4 SAIC QA/QC OFFICER ................................................................................ 2-1 2.5 SAIC HEALTH AND SAFETY OFFICER .................................................... 2-2 2.6 SAIC RADIATION SAFETY OFFICER. ................................................... 2-2 2. 7 SAIC LABORATORY COORD INA TOR. ..................................................... 2-2 2.8 SAIC FIELD OPERATIONS MANAGER ..................................................... 2-3 2. 9 SAIC FIELD PERSONNEL ........................................................................... 2-3 2.10 SUBCONTRACTOR FIELD PERSONNEL.. ................................................ 2-3 2.11 SUBCONTRACTOR LABORATORY SUPPORT ........................................ 2-3
2.11.1 Laboratory QA/QC Manager ................................................................ 2-4 2.11.2 Laboratory Project Manager.. ................................................................ 2-4 2.11.3 Laboratory Manager. ............................................................................. 2-4 2.11.4 Laboratory Section Heads, Department Managers, and Technical
Leads .................................................................................................... 2-5
3.0 DATA QUALITY OBJECTIVES ............................................................................... 3-1
3.1 PROJECT OBJECTIVES ............................................................................... 3-1 3.2 QUALITY ASSURANCE OBJECTIVES FOR MEASUREMENT DATA .... 3-3
3.2.1 Level ofQnality Control Effort .............................................................. 3-3 3.2.2 Accuracy, Precision, and Sensitivity of Analysis ...................................... 3-4 3 .2 .3 Completeness, Representativeness, and Comparability ........................... 3-5
4.0 SAJ.'v!PLING LOCATIONS AND PROCEDURES .................................................... 4-1
4.1 GENERAL INFOR.t'v!ATION AND DEFINITIONS ...................................... 4-1 4.2 SAMPLE CONTAINERS, PRESERVATION, AND HOLDING TIMES ...... 4-2 4.3 FIELD DOCUMENTATION ......................................................................... 4-2
4.3.1 Field Logbooks ..................................................................................... 4-2 4.3.2 Sample Numbering System .................................................................... 4-2 4.3.3 Documentation Procedures .................................................................... 4-3
4.4 FIELD VARIAl'ICE SYSTEM ........................................................................ 4-3
61110 I

I I I I I I I I I I I I I I I I I I I
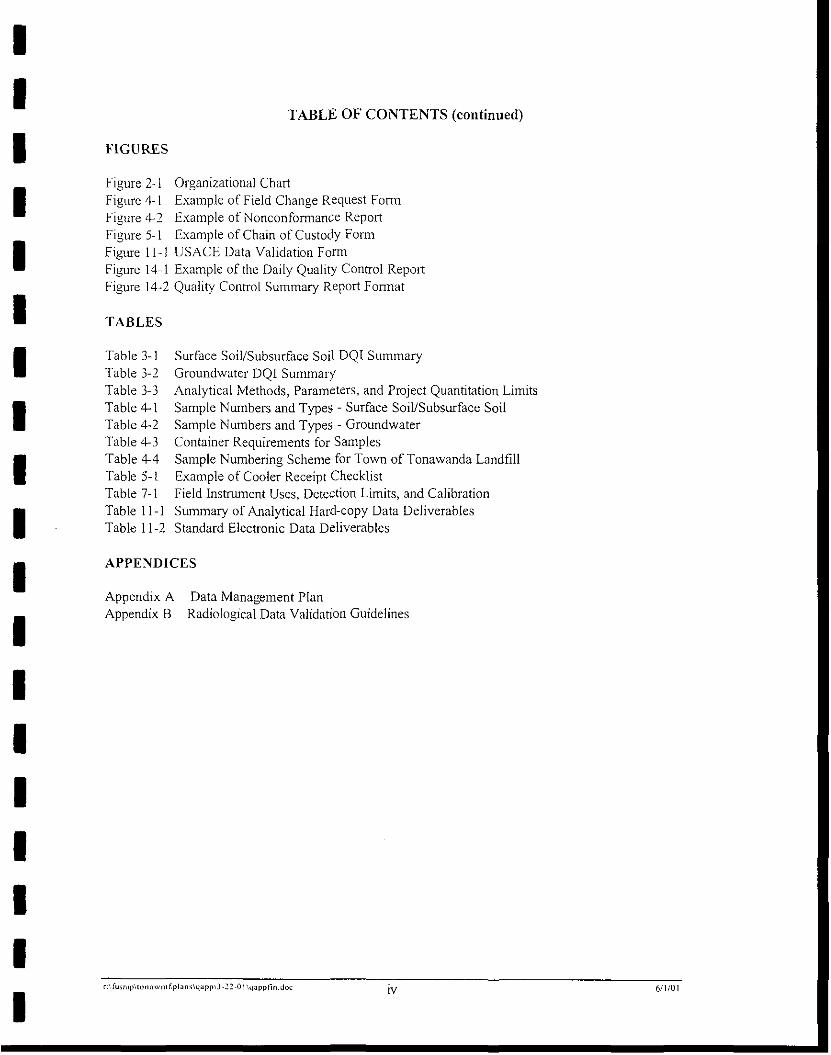
TABLE OF CONTENTS (continued)
5.0 SAMPLE CUSTODY AND HOLDING Tl!\I!ES ................................................. 5-l
5.1 SAtVIPLE DOCUMENTATION .................................................................... 5-1 5.1.1 Field Procedures ................................................................................. 5-1 5.1.2 Field Logbooks/Documentation ............................................................. 5-l 5.1.3 Transfer of Custody and Shipment Procedures ....................................... S-2
5.2 LABORATORY COC PROCEDURES .......................................................... 5-2 5.2.1 Cooler Receipt Checklist ...................................................................... 5-2 5.2.2 Letter ofReccipt. ................................................................................... S-2
5.3 FINAL EVIDENCE FILES CUSTODY PROCEDURES ............................... 5-3
6.0 ANALYTICAL PROCEDURES ................................................................................. 6-1
6.1 LABORATORY ANALYSIS ..................................................................... 6-1 6.2 FIELD SCREENING ANALYTICAL PROTOCOLS .................................... 6-1
7.0 CALIBRATION PROCEDURES AND FREQUENCY ............................................. 7 -I
7.1 FIELD INSTRUlv!ENTS/EQUIPMENL .................................................... 7-1 7 .1. I Organic Vapor Detection ....................................................................... 7-2 7.1.2 Radiation Monitoring ............................................................................. 7-2
7.2 LABOR.A. TORY INSTRUlv!ENTS ................................................................. 7-2
8.0 INTERNAL QUALITY CONTROL CHECKS .......................................................... 8-1
8.1 FIELD SAMPLE COLLECTION ................................................................... 8-1 8.2 FIELD MEASUREMENT. .............................................................................. 8-1 8.3 LABORATORY At"\!ALYSIS ......................................................................... 8-l
8.3.1 QA Program ......................................................................................... 8-1 8.3.2 QC Checks ........................................................................................... 8-2
8.3.2.1 Analytical Process QC ............................................................. 8-2 8.3.2.1.1 Method Blanks ......................................................... 8-2 8.3.2.1.2 Laboratory Control Samples ..................................... 8-3
8.3.2.2 Matrix and Sample-Specific QC ............................................... 8-3 8.3.2.2.1 Laboratory Duplicates ............................................... 8-3 8.3.2.2.2 Surrogate Spikes ....................................................... 8-3 8.3.2.2.3 Isotopic Tracers ........................................................ 8-3 8.3.2.2.4 Matrix Spikes and Matrix Spike Duplicates ............... 8-4 8.3.2.2.5 Method-Specific QC ................................................ 8-4
9.0 CALCULATION OF DATA QUALITY INDICATORS ........................................... 9-1
9.1 FIELD MEASUREMENTS DATA ................................................................. 9-1 9.2 LABORATORY DATA ................................................................................. 9-1
9 .2.1 Precision ............................................................................................... 9-1 9.2.2 Accuracy ............................................................................................... 9-2
r;\ fusr:>pltonctw m ~plans\q~pp\3 -22-0 I \qappfin.doc ll 611101

I I I I I I I I I I I I I I I I I I I
TABLE OF CONTENTS (continued)
9.2.3 Completeness ....................................................................................... 9-2 9.2.4 Sensitivity .............................................................................................. 9-2
9.3 PROJECT COMPLETENESS ...................................................................... 9-3 9 A REPRESENTATIVENESS/COMPARABILITY............. .. .................... 9-3
10.0 CORRECTIVE ACTIONS ....................................................................................... 10-I
10.1 SAMPLE COLLECTION/FIELD MEASUREMENTS ............................... I 0-1 10.2 LABORATORY ANALYSES ................................................................... 10-2
11.0 DATA REDUCTION, VALIDATION, AND REPORTING .................................... 11-1
11.1 DATA REDUCTION .................................................................................... ll-1 11.1.1 Field Measurements and Sample Collection ......................................... ll-1 11.1.2 Laboratory Services ............................................................................ 11-1
11.2 DATA VALIDATION .................................................................................. 11-2 11.2.1 Data Validation Approach ................................................................... 11-2 11.2.2 Primary Analytical Data Validation Categories ...................................... ll-4
11.2.2.1 Holding Times ....................................................................... 11-4 11.2.2.2 Blanks ................................................................................... ll-4 11.2.2.3 Laboratory Control Samples .................................................. 11-4 11.2.2.4 Surrogate Recovery ............................................................... 11-4 11.2.2.5 Internal Standards .................................................................. 11-4 11.2.2.6 Isotopic Tracers .................................................................... 11-5 11.2.2.7 Calibration ............................................................................ ll-5 11.2.2.8 Sample Reanalysis ................................................................. 11-5 11.2.2.9 Secondary Dilutions ............................................................... 11-5 11.2.2.1 0 Laboratory Case Narratives ................................................ 11-6
11.3 PROJECT Al'IAL YTICAL DATA SET ..................................................... 11-6 11.4 DATA REPORTING .................................................................................... 11-6
12.0 PREVENTIVE MAINTENANCE PROCEDURES .................................................. 12-1
12.1 FIELD INSTRUMENTS AND EQUJPMENT... ........................................... 12-1 12.2 LAB ORA TORY INSTRUMENTS ............................................................... 12-1
13.0 PERFORMANCE AND SYSTEM AUDITS ............................................................ 13-1
13.1 FIELD AUDITS ............................................................................................ IJ-1 13.2 LABORATORY AUDITS ............................................................................ 13-1
14.0 QA REPORTS TO MANAGEMENT. ...................................................................... l4-l
14.1 DAILY QUALITY CONTROL REPORTS .................................................. 14-1 14.2 QUALITY ASSURANCE REPORTS .......................................................... 14-1 14.3 QUALITY CONTROL SUtv!MARY REPORTS ......................................... 14-2
15.0 REFERENCES ......................................................................................................... 15-1
ll1 6/1101
I I I I I I I I I I I I I I I I I I I
TABLE OF CONTENTS (continued)
FIGURES
Figure 2-l Organizational Chart Figure 4-l Example of Field Change Request Form Figure 4-2 Example of Nonconformance Report Figure 5-l Example of Chain of Custody Form Figure Il-l USACE Data Validation Fom1 Figure 14-1 Example of the Daily Quality Control Report Figure 14-2 Quality Control Summary Report Fonnat
TABLES
Table 3-1 Table 3-2 Table 3-3 Table 4-l Table 4-2 Table 4-3 Table 4-4 Table 5-l Table 7-l Table Il-l Tablell-2
Surface Soil/Subsurface Soil DQI Summary Groundwater DQI Summary Analytical Methods, Parameters, and Project Quantitation Limits Sample Numbers and Types - Surface Soil/Subsurface Soil Sample Numbers and Types- Groundwater Container Requirements for Samples Sample Numbering Scheme for Town of Tonawanda Landfill Example of Cooler Receipt Checklist Field Instrument Uses, Detection Limits, and Calibration Summary of Analytical Hard-copy Data Deliverables Standard Electronic Data Deliverables
APPENDICES
Appendix A Appendix B
Data Management Plan Radiological Data Validation Guidelines
IV 6/1!01

I I I I I I I I I I I I I I I I I I I
%R Am-241 ARAR ASTM CAS CCQC CERCLA CFR coc cpm CQC CQCR Cs-137 ex DCQCR DMP DOE DOT DQCR DQO ECWA EPA FCO FCR FEIMS FlO FOM FS FSP FUSRAP GC GFAA GIS GPS GWS HTRW lATA lCP !OW LCS LIMS LOR M&TE MARSSIM MDC
LIST OF ACRONYMS AND SYMBOLS
percent recovery Americiwn-241 Applicable or Relevant and Appropriate Requirement American Society for Testing and Materials Chemical Abstract Services Contractor Chemical/Radiological Quality Control Comprehensive Environmental Response, Compensation, and Liability Act Code of Federal Regulations chain of custody coLU1ts per minute Chemical Quality Control Chemical Quality Control Representative Cesiwn-137 Center of Expertise Daily Chemical Quality Control Report Data Management Plan U.S. Department of Energy United States Department of Transportation Daily Quality Control Report data quality objective Erie County Water Authority United States Environmental Protection Agency Field Change Order Field Change Request FUSRAP Environmental Information Management System flame ionization detector Field Operations Manager feasibility study Field Sampling Plan Formerly Utilized Sites Remedial Action Program gas chromatography graphite furnace atomic absorption Geographical Information System Global Positioning System Gamma Walkover Survey Hazardous, Toxic, and Radioactive Waste International Air Transportation Association inductively coupled plasma investigation-derived waste laboratory control sample Laboratory Information Management System letter-of-receipt Measuring and Testing Equipment Multi-Agency Radiation Survey and Site Investigation Manual minimum detectable concentration
v 6/1!01

I I I I I I I I I I I I I I I I I I I
MDCR MDL MED MS MSD NA NCR N!OSH N!ST NMPC NORJ\!l NYSDEC ou PARCC PCOC P!D PPE QA QA/QC QAPP QC QCSR Ra Ra-226 RPD SAIC SAP SOP SOW SSHO SSHP TAL TCL Th Th-230 TTL u U-238 US ACE VOC
LIST OF ACRONYMS Al'liD SYMBOLS (continued)
minimum detectable count rate
method detection limit Manhattan Engineer District matrix spike matrix spike duplicate
not applicable Nonconformance Report National Institute for Occupational Safety and Health National Institute of Standards and Technology Niagara Mohawk Power Company Naturally Occurring Radioactive Material New York State Department of Environmental Conservation Operable Unit precision, accuracy, representativeness, completeness, and comparability potential contaminants of concern photoionization detector Personal Protective Equipment quality assurance quality assurance/quality control Quality Assurance Project Plan quality control Quality Control Summary Report Radium Radium-226 relative percent difference Science Applications International Corporation Sampling and Analysis Plan Standard Operating Procedure Statement of Work Site Safety and Health Officer Site Safety and Health Plan Target Analyte List Target Contaminant List Thorium Thorium-230 Town of Tonawanda Landfill Uranium Uranium-238 United States Army Corps of Engineers volatile organic compound
r;\ fusr~p\tona wm f.plans\yapp\3 -22-0 l \qappfir1.doe Vl 6/l/Ol
I I I I I I I I I I I I I I I I I I I
1.0 PROJECT DESCRIPTION
This Sampling and Analysis Plan (SAP) has been developed in accordance with the USACE guidance document Requirements jar the Preparation ofSampling and Analysis Plans, EM 200-1-3,
September 1994 (USACE I 994a). This SAP has been prepared for site characterization activities at the FUSRAP vicinity property known as Town of Tonawanda Landfill Site located in Tonawanda, New York. The SAP consists of the Field Sampling Plan (FSP), contained in Volume 1, the Quality Assurance Project Plan (QAPP), contained in this volume, and Volume 3, which consists of Field Standard Operating Procedureso.
This document presents the overall QAPP for activities to be performed during investigations and environmental monitoring at the Formerly Utilized Sites Remedial Action Program (FUSRAP) Town of Tonawanda Landfill in Tonawanda, New York. The United States Army Corps of Engineers (USACE) and the United States Environmental Protection Agency (EPA) require that all environmental monitoring and measurement efforts mandated or supported by these organizations participate in a centrally managed quality assurance (QA) program. Any party generating data for this project has the responsibility to implement minimum procedures to ensure that the precision, accuracy, representativeness, completeness, and comparability (P ARC C) of its data are known and documented. To ensure that these responsibilities are met uniformly, each party must adhere to the QAPP. References for this QAPP are included in Section 15. In addition, a Data Management Plan (DMP) is
provided in Appendix A.
This QAPP presents the overall organization, objectives, functional activities, and QA and quality control (QC) activities associated with the Town of Tonawanda Landfill investigations. It describes the specific protocols that will be followed for sampling, sample handling and storage, chain of custody, and laboratory analysis. This plan also presents information regarding data quality objectives (DQOs) for projects, sampling and preservation procedures for samples collected in the field, field and sample documentation, sample packaging and shipping, and laboratory analytical procedures for all media
sampled.
All QNQC procedures will be in accordance with applicable professional technical standards, EPA requirements, government regulations and guidelines, and specific project goals and requirements. This QAPP is prepared by Science Applications International Corporation (SAl C) in accordance with EPA
and USACE QAPP guidance documents, Interim Guidelines and Specifications for Preparing Quality Assurance Project Plans (EPA 1991), EPA Requirements jar Quality Assurance Project Plans for Environmental Data Operations (EPA 1994a), and Requirements for the Preparation of Sampling and Analysis Plans (USACE 1994a).
This document is intended to be utilized in conjunction with the project Field Sampling Plan (FSP) and Site Safety and Health Plan (SSHP).
r: '}wmp ·ton"'' m{l'lmr.< '1"1'1' ,_/-!!-I! I ''/<rJJp}in.doc 1-1 61\iO l

I I I I I I I I I I I I I I I I I I I
2.0 PROJECT ORGANIZATION AND RESPONSIBILITIES
The overall organizational chart shown in Figure 2-1 outlines the management structure that will be used
to implement the limited subsurface characterization efforts at the Town of Tonawanda Landfill. The
functional responsibilities of key personnel arc described in the !allowing parts of this section. The
assignment of personnel to each position will be based on a combination of(1) experience in the type of
work to be pcrfom1cd, (2) experience working with USACE personnel and procedures, (3) a
demonstrated commitment to high quality and timely job performance, and (4) staff availability.
2.1 SAIC FUSRAP PROGR<\M MANAGER
The SAIC FUSRAP Program Manager, Mike Giordano, P.E., ensures the overall management and
quality of all SAIC FUSRAP projects performed tmder USACE contracts. This individual will ensure
that all project goals and objectives arc met in a high-quality and timely manner. Any QA and
nonconformance issues will be addressed by this individual, in coordination with the SAIC Town of
Tonawanda Landfill Program Manager, for corrective action.
2.2 SAIC TOWN OF TONAWANDA LAi'IDFILL PROJECT ~IAi'IAGER
The SAIC Project Manager, Frank Stevenson, P.E., has direct responsibility for implementing the FSP,
QAPP, and activity-specific QA plan including all phases of work plan development, field activities,
data management, and report preparation. This individual will also provide overall management of the
project, and serve as the technical lead and point of contact with the USACE Task/Technical Lead.
These activities will involve coordinating all personnel working on the project, interfacing with USACE personnel, and tracking project budgets and schedules.
2.3 SAIC TOWN OF TONA W Ai'IDA LAi'IDFILL TECHNICAL MANAGER
The SAIC Task Manager, Steve Mclnall, has direct responsibility for implementing the FSP, QAPP,
and activity-specific QA plan including all phases of work plan development, field activities, data
management, and report preparation. These activities will involve coordinating all personnel working on
the project, interfacing with USACE personnel, and tracking project budgets and schedules. The SAIC
Task Manager will also develop, monitor, and till project staffing needs, delegate specific responsibilities
to project team members, and coordinate with administrative staff to maintain a coordinated and timely
flow of all project activities.
2.4 SAIC QA/QC OFFICER
The SAIC QA/QC Officer, Glen Cowart, is responsible for project QA/QC in accordance with the requirements of the QAPP, other work plan documentation, and appropriate management guidance.
This individual, in coordination with the SAIC Chemical Quality Control (CQC) Representative, will be
r. :twr"p ''"""'"'-(plan; 'I"J!P•J-2:!-1!/''1"1'1'/in doc 2-1 6/!/0 l
I I I I I I I I I I I I I I I I I I I
responsible for participating in the project field activity readiness review; approving variances during
field activities before work continues; approving, evaluating, and documenting the disposition of Nonconformance Reports (NCRs); overseeing and approving any required project training; and
designing audit/surveillance plans followed by supervision of these activities. The SAIC QA/QC Officer reports directly to the SAIC FUSRAP Contract Officer in Charge and indirectly to the SAIC FUSRAP Program Manager.
SAIC HEALTH Al'ID SAFETY OFFICER
The SAIC Health and Safety Officer, Steve Davis, CIH, is responsible for ensuring that health and safety procedures designed to protect personnel arc maintained throughout the field activities. This will be accomplished by strict adherence to the applicable Site Safety and Health Plan (SSHP), which is prepared as a separate document for each project. This individual, in conjunction with the SAIC Site Safety and Health Officer (SSHO), will have the authority to halt field work if health or safety issues arise that are not immediately resolvable in accordance with the applicable SSHP. The SAIC Health and Safety Ot1icer reports directly to the SAIC FUSRAP Contract Officer in Charge and indirectly to the SAIC FUSRAP Program Manager.
2.6 SAIC RADIATION SAFETY OFFICER
The SAIC Radiation Safety Officer, Doug Haas, RRPT, is responsible for confmning that radiation safety procedures designed to protect personnel are maintained throughout the field activities conducted for the project. This will be accomplished by strict adherence to the project SSHP, which will be presented in the project sampling and analysis plan (SAP). This individual, in coordination with the SAIC HSO, will have the authority to halt field work if health and/or safety issues, as they apply to radiological issues, arise that are not immediately resolvable in accordance with the project SSHP. The SAIC Radiation Safety Officer reports directly to the SAIC Project Manager, but will inform the SAIC Field Manager of all information and decisions reported.
2.7 SAIC LABORATORY COORDINATOR
The SAIC Laboratory Coordinator, Nile Luedtke, is responsible for coordination of sample shipment to the analytical laboratory( s ), and subsequent chemical and radiochemical analysis and reporting
performed by the subcontract laboratory( s ), in accordance with the requirements defined in the activityspecific QAPP. This individual will also coordinate the shipment of samples to the USACE QA Laboratory, which has been designated as the government QA laboratory for the project. This individual will be responsible for obtaining required sample containers from the laboratory(s) for use during field sample collection, resolving questions the laboratory may have regarding QAPP requirements and deliverables, and coordinating data reduction, validation, and documentation activities related to sample data package dcliverables received from the laboratories. The SAIC Laboratory Coordinator reports directly to the SAIC Town of Tonawanda Landfill Task Manager.
r -''"'"!' "'""'""il'/om'</"1'1''_1-_'_'-0/ '1"1'!'/in "'" 2-2 6ii/O!

I I I I I I I I I I I I I I I I I I I
2.8 SAIC FIELD OPERATIONS MANAGER
The SAIC Field Operations Manager (FOM) is responsible for implementing all field activities in accordance with the applicable SAP, this QAPP, and the activity-specific QAPP. This individual is responsible for ensuring proper technical perfom1ance of drilling operations and field sampling activities, adherence to required sample custody and other related QAIQC field procedures, coordination of field personnel activities, management of investigative-derived wastes, checks of all field documentation, maintenance ofthc field logbook, and preparation of field Change Orders (FCOs), if required. The
SAIC FOM reports directly to the SAIC Town of Tonawanda Landfill Task Manager except in regard to QAIQC matters that are reported directly to the SAIC QAIQC Officer.
2.9 SAIC FIELD PERSONNEL
In addition to the SAIC FOM, other SAIC field personnel participating in the implementation of field activities are anticipated to be site geologists, sampling technicians, and the sample manager. These individuals, in coordination with field subcontractor personnel, will be respcnsible for performance of Geoprobe® operations, collection of soil samples, collection of groundwater samples from existing wells, and preparation of field logbooks and other required documentation. These individuals will be responsible for performing all field activities in accordance with the applicable SAP, SSHP, and this QAPP. Field personnel report directly to the SAIC FOM.
2.10 SUBCONTRACTOR FIELD PERSONNEL
Subcontractor field personnel, under the supervision of the SAIC FOM, will be responsible for performing their specific scopes of work that have been derived from the applicable SAP. These individuals will be required to review applicable sections of the SAP, QAPP, and the SSHP, prior to field mobilization. All subcontractor field personnel report directly to the SAIC FOM who will be
respcnsible for ensuring that all subcontractor activities comply with project requirements.
2.11 SUBCONTRACTOR LABORATORY SUPPORT
Analytical laboratory support specific to these investigations will be obtained from TBD. Chemical and radiochemical laboratory support for these investigations will be designated to this subcontractor based on their capacity, capability and competitive pricing. This selected subcontract laboratory is validated by the US ACE HTR W CX, Omaha, Nebraska. Relevant QA Manual, laboratory qualification statements, certifications, and license documentation will be submitted to the Buffalo District for review and
approval.
Organization charts outlining the key laboratory personnel and organization will be identified in their QA
Plans. The responsibilities of key personnel arc described in the following paragraphs. The assignment
2-3 61!/Ul
I I I I I I I I I I I I I I I I I I I
of personnel to each position will be based on a combination of(!) experience in the type of work being performed, (2) experience working with USACE personnel and procedures, and (3) a demonstrated
commitment to high quality and timely job performance.
Prior to commencement of field activities for each project, SAIC will send a complete copy of the work plan (e.g., SAP) including this QAPP to the subcontracted laboratory.
2.11.1 Laboratory QA/QC Manager
The subcontractor Laboratory QNQC Manager is responsible for the laboratory QNQC in accordance with the requirements of this QAPP in conjunction with the established laboratory QA Program. In coordination with the SAIC Laboratory Coordinator, this individual will be responsible for documenting that samples received by the laboratory arc analyzed in accordance with required methodologies, that instrument calibration is performed properly and documented, that field and internal laboratory QC samples are analyzed and documented, and that all analytical results tor both field and QC samples arc reported to SAIC in the format required in the laboratory scope of work and this QAPP. This individual is also responsible for processing laboratory NCRs in a timely manner and for implementing Corrective Action Report recommendations and requirements. The Subcontractor Laboratory QNQC Manager reports directly to the SAIC Laboratory Coordinator for issues related to this project.
2.11.2 Laboratory Project Manager
The responsibilities of each laboratory's Project Manager include the following: initiation and maintenance of contact with SAIC on individual job tasks; preparation of all laboratory-associated work plans, schedules, and manpower allocations; initiation of all laboratory-associated procurement for the project; provision of day-to-day direction of the laboratory project team including analytical department managers, supervisors, QA personnel, and data management personnel; coordination of all
laboratory related fmancial and contractual aspects of the project; provision of formatting and technical review for all laboratory reports; provision of day-to-day communication with SAIC; provision of final review and approval on all laboratory analytical reports to SAIC; and response to all post project mqurres.
2.11.3 Laboratory Manager
The responsibilities of the Laboratory Manager for each laboratory include the following: coordination of all analytical production activities conducted within the analytical departments; working with the Laboratory Project Manager to ensure all project objectives are met; provision of guidance to analytical
department managers; and facilitation of transfer of data produced by the analytical departments to the report preparation and review staff for fmal delivery to the client.
2-4 611/01

I I I I I I I I I I I I I I I I I I I
2.11.4 Laboratory Section Heads, Department Managers, and Technical Leads
The responsibilities of each laboratory section or department include the following: coordination of all
analytical functions related to specific analytical areas; provision of technical information to and oversight
of all analysis being performed; review and approval of all analytical results produced by their specific
analytical area of expertise; and maintenance of all analytical records and information pertaining to the
analysis being performed.
r: jmmp """~'"'~'t'l""' 'I"I'P'.l·.!:-11/ ·qoppjin dm 2-5 6/1/01

I I I I I I I I I I I I I I I I I I I
3.0 DATA QUALITY OBJECTIVES
The overall objective is to develop and implement procedures for field sampling, chain of custody (COC), laboratory analysis, and reporting, which will provide information for site evaluation and
assessment leading to and including remediation. Data must be technically sound and legally defensible. Procedures for sampling, COC, laboratory instrument calibration, laboratory analysis, reporting of data, internal QC, audits, preventive maintenance of field equipment, and corrective action are described in other sections of this QAPP. The purpose of this section is to address the objectives for data precision, accuracy, representativeness, completeness, and comparability (PARCC). The FSP identifies specific
task objectives as they relate to site action levels and remediation. This QAPP provides the details, in tabular form, of the analytical parameters, methods, and quantitation levels.
DQOs are the basic statements from which the project sampling and analysis requirements are developed. Data Quality Indicators (DQJs) are analytical DQOs that define the level of analytical effort employed in a project.
3.1 PROJECT OBJECTIVES
Project goals/DQOs for field sampling activities were established based on available site investigation information and applicable or relevant and appropriate requirements (ARARs) pertaining to the Site. The intent of the project goals/DQOs is to ensure compliance with applicable Federal, State, and local regulations in addressing the handling and assessment radiological contaminants present at the Site, evaluate potential remedial activities associated with the removal or handling of radiological impacted material, and determine potential responsible party/parties for the implementation of the selected remedial actions. The Project Goals/DQOs for the Site are as follows:
1. VerifY !viED-related material is present at the site; 2. Delineate the extent and concentration of the MED-relatcd material, identifY areas that would
exceed removal criteria, and determine volume of !viED-related material; 3. Evaluate the impact of !viED-related material and related compounds (if present) to Site soil and
groundwater; 4. Assess long term risks posed by leaving !viED-related material in place including an assessment of
the mobility and migration capabilities of the material to surrounding receptors. 5. Determine if chemical or non-!viED wastes are commingled with the !viED-related materials. 6. If radiological contamination is present, determine if it is due to !viED-related material, naturally
occurring radioactive material (NORM), Arn-241 contamination, or other sourcc(s). 7. Evaluate characteristics of disturbed material (soil and groundwater) for waste disposal.
A further elaboration on the DQO's are presented in the Data Needs Determination (DND) summary included as Table l-1 of the FSP.
3-1 611/0!

I I I I I I I I I I I I I I I I I I I
The DND for the Site indicated the existing Site characterization information presented in previous
reports is sufficient to conlirm the presence ofMED-rclatcd material at the Site (ORt'IL 1992, BNI
1995) thus satisfying DQO No. 1. The reports conclude that MED-related material is suspected of
being present in three areas (Areas A, B, and C) located in the Land !ill and Mudflats portions of the
Site. However, the information does not adequately defme the areal and vertical extent of the MED
rclatcd contamination or its impact on the soil and groundwater at the Site.
Activities presented below arc intended to provide the additional characterization intormation required
to attain the DQOs Nos. 2-4. TI1e lleld activities summarized below (a gamma walkover survey and
soil sampling) will focus on the evaluation of surlicial and subsmface soils within the three known areas
where MED-like gamma activity was detected during previous investigations. The intent of the sampling activities is to provide enough information to accurately identifY the contaminants, evaluate the
contaminants chemical composition, and determine the leachability of contaminants from radiological
impacted material. In addition, groundwater samples will be collected from existing groundwater
monitoring wells and analyzed for isotopic uranium (U), radium (Ra), and thorium (Th), and gross alpha,
to determine iflv!ED material at the Site has already impacted groundwater at the Site and, if so, what is
the potential for further MED-related contaminant's mobility.
The DQOs listed above will be satislled by the data to be collected as listed in Table 1-1 of the FSP
and as shown in the Table below:
DQO# Data QualityObjective Data to be Collected to Satisfy this Objective 1 V crifY lv!ED- related material is Gamma Surface Scan
present at the site. Soil Samples - Radiological Analyses
Sediment Samples- Radiological Analyses
Surface Water Samples- Radiological Analyses
2 Delineate the extent and Gamma Surface Scan
concentration of the MED- Gamma Scans of Subsurface Cores
related material, identifY areas Soil Samples- Radiological Analyses
that would exceed removal Physical Survey
criteria, and determine volume of
IviED-related material;. ' Evaluate the impact ofMED- Soil Samples - Radiological Analyses .)
related material and related Soil Samples- Geotechnical Analyses
compounds (if present) to Site Groundwater Samples - Radiological Analyses soil and groundwater. Sediment Samples - Radiological Analyses
Surface Water Samples - Radiological Analyses
Physical Survey
4 Assess long term risks posed by Soil Samples - Radiological Analyses
leaving IviED- related material in Soil Samples- Geotechnical Analyses and
place includingan assessment of isotopic chemical form
3-2 6/1.0 I

I I I I I I I I I I I I I I I I I I I
DQO# Data Quality Objective Data to be Collected to Satisfy this Objective
the mobility and migration Groundwater Samples - Radiolot,>ical Analyses
capabilities of the material to Sediment Samples- Radiological Analyses
surrounding receptors. Surface Water Samples- Radiological Analyses
5 Determine if chemical or norr Soil Samples- Chemical Analyses
MED wastes are commingled
with the MED- related materials.
6 If radiological contamination is Soil Samples - Radiological Analyses
present, determine if it is due to Soil Samples - Chemical Analyses
MED- related material, NORM, Visual Observation
Arrr24l contamination, or other Soil Samples - Geotechnical Analyses
source(s).
7 Evaluate characteristics of Waste Characteristics Sampling
disturbed material (soil and
QJ"Oundwater) for waste disposal.
3.2 QUALITY ASSURANCE OBJECTIVES FOR MEASUREMENT DATA
An analytical DQI summary for this investigation is presented in Tables 3-1 and 3-2.
Laboratories arc required to comply with all methods as written. The laboratory selected for the project
will be required to submit all lab method standard operating procedures (SOPs) and references, and the
actual method detection limits to be achieved in all analyses to SAl C.
As per the EPA guidance ( l993a), a combination of Screening Level and Definitive Level data will be
required for each project.
Defmitivc data represent data generated under laboratory conditions using EPA-approved procedures.
Data of this type, both qualitative and quantitative, are used for determination of source, extent, or
characterization and to support evaluation of remedial technologies and preliminary assessment
memorandum.
3.2.1 Level of Quality Control Effort
To assess whether QA objectives have been achieved, analyses of specific field and laboratory QC
samples will be required. These QC samples include tleld duplicates, laboratory method blanks,
laboratory control samples, laboratory duplicates, rinsate blanks, field blanks, and matrix spike/matrix
spike duplicate (MS/MSD) samples.
Field Duplicates will be submitted for analysis to provide a means to assess the quality of the data resulting
from the field sampling program. Field duplicates are analyzed to determine sample heterogeneity and
3-3 6/1/01
I I I I I I I I I I I I I I I I I I I
sampling methodology reproducibility. Analytical criteria that are expected to apply to the Town of
Tonawanda Landfill arc found in Tables 3-1 through 3-3, and are discussed in Section 8.3. Rinsatc blanks and field blanks will not be collected, as only dedicated sampling equipment will be used.
One field duplicate sample will be collected for every ten investigative samples.
Laboratory method blanks and laboratory control samples arc employed to determine the accuracy and precision of the analytical method implemented by the laboratory. Matrix spikes provide infonnation about the effect of the sample matrix on the measurement methodology. Laboratory sample duplicates and MSDs assist in determining the analytical reproducibility and precision of the analysis for the
samples of interest. One MS/MSD sample will be designated in the field and collected for at least every 20 investigative samples.
The QC effort for in- field measurements including organic vapor concentrations, and radiation levels, will include daily calibration of instmmcnts using National Institute of Standards and Technology (NIST) traceable standards and approved in-house SOPs (refer to Volume 3 of the SAP). Daily calibration checks will also be performed on all radiation detection field meters. Field instmments and their method of calibration are discussed fi.rrther in Section 7.0 of this QAPP.
3.2.2 Accuracy, Precision, and Sensitivity of Analysis
The fundamental QA objectives for accuracy, precision, and sensitivity oflabomtory analytical data are the QC acceptance criteria of the analytical protocols. The accuracy and precision required for each project's analytical parameters are incorporated in Table 3-1 and Table 3-2 and will be consistent with the analytical protocols. Typical sensitivities required for project analyses are provided in Table 3-3.
Analytical accuracy is expressed as the percent recovery of an analyte that has been added to a blank sample or environmental sample at a known concentration before analysis. Accuracy will be determined in the laboratory through the use ofMS analyses, and laboratory control sample (LCS) analyses. The percent recoveries for specific target analytes will be calculated and used as an indication of the accuracy of the analyses performed.
Precision will be determined through the use of spike analyses conducted on duplicate pairs of environmental samples (MS/MSD) or comparison of positive duplicate pair responses. The relative percent difference (RPD) between the two results will be calculated and used as an indication of the precision of the analyses performed.
Sample collection precision will be measured in the laboratory by the analyses of field duplicates. Precision will be reported as the RPD for two measurements.
r )11s-up wna" mfplom 'I"PP'-1-_' .'-1!1 <J11ppjin doc 3-4 6/110 I
I I I I I I I I I I I I I I I I I I I
3.2.3 Completeness, Representativeness, and Comparability
Completeness is a measure of the amount of valid data obtained from a measurement system compared to the amount expected to be obtained under normal conditions. It is expected that laboratories will
provide data meeting QC acceptance criteria for all samples tested. Overall project completeness goals are identitled in Tables 3-l and 3-2.
Representativeness expresses tbe degree to which data accurately and precisely represent a characteristic of a population, parameter variations at a sampling point, a process condition, or an environmental condition. Representativeness is a qualitative parameter that depends upon the proper
design of the sampling program and proper laboratory protocol. The sampling network was designed to provide data representative of site conditions. During development of this plan, consideration was given to site history, past waste disposal practices, existing analytical data, physical setting and processes, and constraints inherent to this investigation. The rationale of the sampling design is discussed in detail in the SAP.
Representativeness will be satistled by ensuring that the SAP is followed, proper sampling techniques are used, proper analytical procedures are followed, and holding times of the samples are not exceeded. Representativeness will be determined by assessing the combined aspects of the QA program, QC measures, and data evaluations.
Comparability expresses the contldence with which one data set can be compared with another. The extent to which existing and planned analytical data will be comparable depends upon the similarity of sampling and analytical methods. The procedures used to obtain the planned analytical data are expected to provide comparable data.
r· tmmp '"'""'m(pf<m_,.'I"I'P' .1· _'_'.1!/''I"PPfi" dot 3-5 6!1101

I I I I I I I I I I I I I I I I I I I
4.0 SAMPLING LOCATIONS Al'ID PROCEDURES
It is anticipated that investigations performed at the Town of Tonawanda Landfill will produce soil,
groundwater and investigation-derived waste (IDW) samples for analyses as appropriate to the specific investigation. Additional samples will be collected to complete tield QC duplicate and field blank analyses. [Estimated numbers of samples (including activities and analytes) are incorporated into the FSP.] Investigation samples will require chemical and radionuclide determinations, as represented in Tables 3-1 through 3-3.
Identification of the primary tield equipment and supporting materials to be used for these investigations is presented throughout the FSP. Several different types of field measurements will be performed during
these investigations. A description of the field instruments and associated calibration requirements and performance checks to be used for field measurements is presented in the FSP and Section 7.0 of this QAPP.
The locations of the sampling stations and sample media to be collected during these investigations, and the rationales for the selection of these stations, are presented in the SAP along with sampling procedures. (Refer to Volume 3 of the SAP- Field Operating Procedures).
4.1 GENERAL INFORMATION AND DEFINITIONS
Contractor Laboratory
The laboratories subcontracted to perform analysis of samples will be selected through the SAlC procurement and review process prior to field mobilization. The laboratory supporting this project's efforts is TBD.
QA and QC Samples
These samples are analyzed for the purpose of assessing the quality of the sampling effort and of the reported analytical data. QA and QC samples to be used are duplicates, equipment rinsate blanks, trip
blanks and field blank samples. Analytical parameters, methods, and sample types are summarized in Tables 4-1 and 4-2.
Field Duplicate QC Samples
These samples are collected by the sampling team for analysis by the contract laboratory. The identity of duplicate QC samples is held blind to the analysts and the purpose of these samples is to provide fieldoriginated information regarding the homogeneity of the sampled matrix and the consistency of the sampling effort. These samples are collected concurrently with the primary environmental samples and equally represent the medium at a given time and location. Duplicate samples will be collected from each
medium addressed by this project, and submitted to the contractor laboratory for analysis.
r. fiisrOp'IV11<1"mJ'plm"''I<'PP•-1-.!1-11/ </<'Jlp}i11 doc 4-1 6/l/01
I I I I I I I I I I I I I I I I I I I
4.2 SAMPLE CONTAINERS, PRESERVATION, At'ID HOLDING TIMES
Sample containers, chemical preservation techniques, and holding times for soil and groundwater
collected during investigations are descJibed in Table 4-3. The specific number of containers required for each study will be estimated and supplied by the analytical facilities. Additional sample volmnes will
be collected and provided, when necessary, for the express purpose of performing associated
laboratory QC (laboratory duplicates, MS/N!SD).
All sample containers will be provided by the analytical support laboratories, which will also provide the
required types and volumes of preservatives with containers as they are delivered to SA! C. In the event
that sample integrity, such as holding times, is compromised, resampling will occur as directed by the
USACE Project Manager. Any affected data will be flagged and qualified per data validation
instructions and guidance.
4.3 FIELD DOCUMENTATION
4.3.1 Field Logbooks
Sufficient information will be recorded in the field logbooks to permit reconstruction of all drilling and
sampling activities conducted. Information recorded on other project documents will not be repeated in
the logbooks except in summary form where determined necessary. All field logbooks will be kept in
the possession of field personnel responsible for completing the logbooks, or in a secure place when not
being used during field work. Upon completion of the field activities, all logbooks will be submitted to
US ACE to become part of the final project file.
4.3.2 Sample Numbering System
A wtique sample numbering screme will be used to identifY each sample collected, following the general
outline established in Table 4-4. The purpose of this numbering scheme is to provide a tracking system
for the retrieval of analytical and field data on each sample. Sample identification numbers will be used
on all sample labels or tags, field data sheets or logbooks, COC records, and all other applicable documentation used during each project. A listing of all sample identification numbers will be maintained
in the field logbook. The project database will be prepopulated with sample numbers and information
consistent with instructions found in the Data Management Plan (Dlv!P), Appendix A.
The sample numbering scheme used for field samples will be employed for duplicate samples and other
field QC such that they will not be readily discemablc by the laboratory.
4-2 6/1/01
I I I I I I I I I I I I I I I I I I I
4.3.3 Documentation Procedures
Labels will be affixed to all sample containers during sampling activities. Information will be recorded on
each sample container label at the time of sample collection. The information to be recorded on the labels will be as follows:
• contractor name,
• sample identilication number, • sample type (discrete or composite), • site name and sample station number,
• analysis to be performed, • type of chemical preservative present in container, • date and time of sample collection, and • sampler's name and initials.
Sample logbooks and COC records will contain the same information as the labels affixed to the containers along with sample location measurements. These records will be maintained and record all information related to the sampling effort and the process employed. The tracking procedure to be used for documentation of all samples collected during the project will involve the steps outlined in the Data Management Plan, Appendix A
4.4 FIELD V ARlAl"'CE SYSTEM
Procedures cannot fully encompass all conditions encountered during a field investigation; therefore, variances from the operating procedures, field sampling plan, and/or safety and health plan may occur. All variances that occur during field investigations will be documented on a field change request (FCR) form or an NCR and will be noted in the appropriate field logbooks. Examples of the FCR (Figure 4-l) and NCR (Figure 4-2) forms to be used for these investigations are presented in this QAPP. If a variance is anticipated (e.g., because of a change in the field instrumentation), the applicable procedure will be modified and the change noted in the field logbooks.
FCRs are processed in accordance with SAIC Field Technical Procedure, FTP-1200, Field Quality ControL NCRs are processed in accordance with SAIC QA Administrative Procedure, QAAP 15.1, Control of Nonconforming Items and Services.
~- }ll.lmp ""'""m/plom ''I"PI'·l·.'J-1!/'qappjin doc 4-3 6/!/0!

I I I I I I I I I I I I I I I I I I I
5.0 SAMPLE CUSTODY AND HOLDING TIMES
It is the policy ofSAIC and the intent of these investigations to follow EPA policy regarding sample custody and COC protocols as described in NEIC Policies and Procedures (EPA 1985). This custody is in three parts: sample collection, laboratory analysis, and fmal evidence tiles. Final evidence files, including originals of laboratory reports and electronic files, are maintained under document control in a secure area. A sample or evidence file is under your custody when it is:
• in the sampler's possession; • in the sampler's view, after being in the sampler's possession;
• in the sampler's possession and placed in a secured location; or • in a designated secure area.
5.1 SAMPLE DOCUMENTATION
The sample packaging and shipment procedures summarized below will ensure that samples will arrive at the laboratory with the COC intact. The protocol for specific sample numbering using case numbers and trat1ic report numbers (if applicable) and other sample designations will be followed.
5.1.1 Field Procedures
The field sampler is responsible for the care and custody of the samples until they are transferred or properly dispatched. As lew people as possible should handle the samples. Each sample container will be labeled with a sample number, date and time of collection, sampler, and sampling location. Sample labels are to be completed for each sample. The SAIC Task Manager, in conjunction with the USACE, will review all tield activities to determine whether proper custody procedures were followed during the tield work and to decide if additional samples are required.
5.1.2 Field Logbooks/Documentation
Samples will be collected following the sampling procedures documented in the SAP. When a sample is collected or a measurement is made, a detailed description of the location will be recorded. The equipment used to collect samples will be noted, along with the time of sampling, sample description, depth at which the sample was collected, volume, and number of containers. A sample identitication
number will be assigned before sample collection. Field duplicate samples and QA split samples, which will receive an entirely separate sample identification number, will be noted under sample description.
Equipment employed to make tield measurements will be idcntitied along with their calibration dates.
r · /1"r<IJ.>'I<JI><fl' m{j.>lrm> '<1"1'1'' J-!! ·Ill' '1"1'1-'lin.do< 5-l 611/0 l

I I I I I I I I I I I I I I I I I I I
5.1.3 Transfer of Custody and Shipment Procedures
Samples arc accompanied by a properly completed COC form. The sample munbers and locations will
be listed on the COC form. When transfening the possession of samples, the individuals relinquishing and receiving will sign, date, and note the time on the record. This record will document transfer of custody of samples from the sampler to another person, to a mobile laboratory, to the permanent
laboratory, or to/from a secure storage area. An example of the COC form to be used for these
investigations is illustrated in Figure 5- 1 .
All shipments will be accompanied by the COC record identifYing the contents. The original record will
accompany the shipment, and copies will be retained by the sampler for return to project management and the project file.
All shipments will be in compliance with applicable United States Department of Transportation (DOT)
regulations for environmental samples
5.2 LABORATORY COC PROCEDURES
Custody procedures, along with the holding time and sample preservative requirements for samples, will be described in laboratory QA Plans. These documents will identifY the laboratory custody procedures for sample receipt and log-in, sample storage, tracking during sample preparation and analysis, and
laboratory storage of data.
5.2.1 Cooler Receipt Checklist
The condition of shipping coolers and enclosed sample containers will be documented upon receipt at the analytical laboratory. This documentation will be accomplished using the cooler receipt checklist presented in Table 5-l. One of these checklists will be placed into each shipping cooler along with the completed COC form or provided to the laboratory at the start of the project. A copy of the checklist will be faxed to the SAIC Task Manager immediately after it has been completed at the laboratory. The
original completed checklist will be transmitted with the final analytical results from the laboratory.
5.2.2 Letter of Receipt
The laboratory will confirm sample receipt and log-in information through transmission of a Letter-ofReceipt (LOR) to SAl C. This will include returning a copy of the completed COC, a copy of the cooler receipt checklist, and confmnation of the analytical log- in indicating laboratory sample numbers.
r: _lll:;mp-W1W"m!'p/om .1(111-'P l--'!-1!/'qllppfin.dvc 5-2 6/!/0!

I I I I I I I I I I I I I I I I I I I
5.3 FINAL EVIDENCE FILES CUSTODY PROCEDURES
SAIC is the custodian of the evidence file and will maintain the contents of evidence files for these
investigations, including all relevant records, reports, logs, field notebooks, pictures, subcontractor reports, correspondence, laboratory logbooks, and COC forms. The evidence file will be stored in a secure, limited-access area and under custody of the SAIC Task Manager or designee.
Analytical laboratories will retain all original raw data information (both hard copy and electronic) for a period of five years after the completion of the project. Analytical laboratories shall store all original
raw data information in a secure, limited-access area and under custody of the Laboratory Project Manager.
5-3 6/l;U I

I I I I I I I I I I I I I I I I I I I
6.0 Ac'iALYTICAL PROCEDURES
All samples collected during these investigation activities will be analyzed by laboratories reviewed and validated by the USACE HTRW CX, Omaha, Nebraska. QA samples will be collected for
groundwater and soil, and analyzed by the designated USACE QA Laboratory. Each laboratory supporting this work will provide statements of qualifications including organizational structure,
QA Manual, and SOP.
6.1 LABORATORY AL'IALYSIS
Samples collected during these investigations will be consistent with nationally recognized methods such as EPA SW846 Test Methods and DOE Environmental Measurements Laboratory (EML), HASL Procedures Manual. Laboratory standard operating procedures arc based on these or equivalent methods and will be submitted to the project for reference.
Principal laboratory facilities will not subcontract or transfer any portion of this work to another facility, unless expressly permitted to do so in writing by the USACE Project Manager.
If contaminant concentrations are high, or for matrices other than normal waters and soils, analytical protocols may be inadequate. In these cases, sample analysis may require modifications to defined methodology. Any proposed changes to analytical methods specified require written approval from SAIC and USACE. All analytical method variations will be identified in field change records. These may be submitted for regulatory review and approval when directed by the USACE Project Manager.
These SOPs must be adapted from and reference standard accepted methods and thereby specifY:
• procedures for sample preparation, • instrument start- up and performance check, • procedures to establish the actual and required detection limits for each parameter, • initial and continuing calibration check requirements, • specific methods for each sample matrix type, and
• required analyses and QC requirements.
6.2 FIELD SCREENING AL'IALYTICAL PROTOCOLS
Procedures for field measurement of activity levels are described in Section 7. 0 of this QAPP.
~- jwrop•WI1<1\\m/plom '</<IJ.'P'·]-! !./)/ 'I"I'Piin.doc 6-l 6/l;Ol

I I I I I I I I I I I I I I I I I I I
7.0 CALIBRATION PROCEDURES AL'ID FREQUENCY
1l1is section describes procedures for maintaining the accuracy of all the instruments and measuring
equipment that arc used for conducting field tests and laboratory analyses. 1l1ese instruments and
equipment will be calibrated before each usc or on a scheduled, periodic basis according to
manufacturer instructions.
7.1 FIELD INSTRUMENTS/EQUIPMENT
lnstnunents and equipment used to gather, generate, or measure environmental data will be calibrated
with sufficient frequency and in such a manner that accuracy and reproducibility of results are consistent
with the manufacturer's specitications. All field instruments for this purpose will have unique identifiers, and each instrument will be logged in the Measuring and Testing Equipment (M& TE) Log Book before
use in the field. The SSHO or his/her designate will be responsible for performing and doctunenting daily
ealibrationfchcekout records for instruments used in the field.
Equipment to be used during field sampling will be examined to certifY that it is in operating condition.
This will include checking the manufacturer's operating manual and instructions for each instrument to
ensure that all maintenance requirements are being observed. Field notes from previous sampling trips
will be reviewed so that the notation on any prior equipment problems will not be overlooked, and all
necessary repairs to equipment will be carried out. Spare parts or duplication of equipment will be
available to the sampling effort.
Calibration of field instruments is governed by the SOP for the applicable field analysis method, and will be performed at the intervals specified in the SOP. If no SOP is available, calibration of field instruments
will be performed at intervals specified by the manufacturer or more frequently as conditions dictate.
Calibration procedures and frequency will be recorded in a field logbook.
Field instruments will include hand- held scintillation detectors for radioactivity screening levels and
photoionization detectors (Pills) for organic vapor detection. If an internally calibrated field instrument
fails to meet calibration/checkout procedures, it will be returned to the manufacturer for service and a
back-up instrument will be calibrated md used in its place. Field instrument uses, detection levels, and
calibration are summarized in Table 7-1.
Detailed instructions on the proper calibration and use of each field instrument follow the guidelines
established by the manufacturer. The technical procedures for each instrument used on this project
include the manufacturer's instructions detailing the proper use and calibration of each instrument.
r:·Jmmp flmu~>m{plu"'·qupp•J·! !·fl/ 'l"l'l'}i" do< 7-1 6/\/01

I I I I I I I I I I I I I I I I I I I
7.1.1 Organic Vapor Detection
Organic vapor detectors will be checked daily according to the manufacturer's instructions. Flame
ionization detectors (Fills) will be checked daily by using the internal calibration mechanism. Pills will be calibrated daily with a gas of known concentration. All daily calibration information will be recorded in the M&TE Log Book.
7.1.2 Radiation Monitoring
Scintillation detectors will be checked daily according to the manufacturer's instructions. Meters will be checked daily by using scaled calibration source checks. Meters will be calibrated routinely, with calibration dates clearly identified on each instrument. All daily calibration check information will be
recorded in the M& TE Log Book.
Section 2.4 of the FSP provides details on the gamma walkover sw-vey instrumentation. gamma scanning instrumentation is provided in Section 2.5 of the FSP.
Down-hole
7.2 LABORATORY INSTRUMENTS
Calibration of laboratory equipment will be based on approved written procedures. Records of
calibration, repairs, or replacement will be filed and maintained by laboratory personnel performing QC activities. These records will be filed at the location where the work is performed and will be subject to QA audit. Procedures and records of calibration will follow USACE and SAIC reviewed laboratoryspecific QA Plans. For analyses governed by SOPs, refer to the appropriate SOP for the required calibration procedures and frequencies.
Records of calibration will be kept as follows:
• If possible, each instrument will have a record of calibration with an assigned record number. • A label will be affL'<ed to each instrument showing identification numbers, manufacturer, model
numbers, date of last calibration, signature of calibrating analyst, and due date of next calibration. Reports and compensation or correction figures will be maintained with instrument.
• A written step-wise calibration procedure will be available for each piece of test and measurement equipment.
• Any instrument that is not calibrated to the manufacturer's original specification will display a warning tag to alert the analyst that the device carries only a "Limited Calibration."
r:'{ll>rop ''"'"""'} plom '1"1'1''3-:2-fl/ ''I"PJl}ir> """' 7-2 6/1/01
I I I I I I I I I I I I I I I I I I I
8.0 INTERNAL QUALITY CONTROL CHECKS
8.1 FIELD SAMPLE COLLECTION
The assessment of ticld sampling precision and accuracy will be made by collecting lield duplicates in accordance with the procedures described in the FSP. Trip blanks will accompany sample bottles at all
times.
8.2 FIELD MEASUREMENT
QC procedures for most field measurements (i.e., activity levels, headspace, etc.) arc limited to
checking the reproducibility of the measurement by obtaining multiple readings on a single sample or standard and by calibrating the instruments. Refer to Section 7.0 of this QAPP for more detail regarding
these measurements.
8.3 LABORATORY Al"'ALYSIS
Analytical QC procedures for these investigations are specified in the individual method descriptions. These specifications include the types of QC checks normally required; method blanks, LCS, MS, MSD, calibration standards, internal standards, tracer standards, calibration check standards, and
laboratory duplicate analysis
To ensure the production of analytical data of known and documented quality, laboratories associated with these investigations will implement all method QA and QC checks.
8.3.1 QA Program
All subcontracted analytical laboratories will have a written QA program that provides rules and guidelines to ensure the reliability and validity of work conducted at the laboratory. Compliance with the QA program is coordinated and monitored by the laboratory's QA department, which is independent of the operating departments. For these investigations selected support laboratory QA Plans will be referenced and implemented in their entirety.
The stated objectives of the laboratory QA program are to:
• properly sub-sample, preserve, and store all samples;
• maintain adequate custody records from sample receipt through reporting and archiving of results;
• use properly trained analysts to analyze all samples by approved methods within holding times;
r_Jwmp•lullll"m(plw>Oj<lpp _1-.'!.1!/ 'I"I'Pf"' doc 8-1 6/1/01

I I I I I I I I I I I I I I I I I I I
• produce defensible data with associated documentation to show that each system was calibrated and operating within precision and accw·acy control limits;
• accurately calculate, check, report, and archive all data using the Laboratory Information Management System; and
• document all the above activities so that all data can be independently validated.
All laboratory procedures are documented in writing as SOPs, which are edited and controlled by the QA department. Internal QC measures for analysis will be conducted with their SOPs and the individual method requirements specified.
Extemal QA will be provided by the USACE QA Laboratory. The extemal QA laboratory will receive QA sample splits as identified in this QAPP.
8.3.2 QC Checks
Implementation of QC procedures during sample collection, analysis, and reporting ensures that the data obtained are consistent with its intended use. Both field QC and laboratory QC checks are performed throughout the work effort to generate data confidence. Analytical QC measures are used to determine if the analytical process is in control, as well as to detemaine the sample matrix effects on the data being generated.
Specifications include the types of QC required (duplicates, sample spikes, surrogate spikes, reference samples, controls, blanks, etc.), the frequency for implementation of each QC measure, compounds to be used for sample spikes and isotopic tracers, and the acceptance criteria for this QC.
Laboratories will provide documentation in each data package that both initial and ongoing instrument and analytical QC functions have been met. Any nonconfomaing analysis will be reanalyzed by the laboratory, if sufficient sample volume is available. It is expected that sufficient sample volumes will be collected to provide for reanalyses, if required.
8.3.2.1 Analytical Process QC
8.3.2.1.1 Method Blanks
A method blank is a sample of a noncontaminated substance of the matrix of interest (usually distilled/de-ionized water or silica sand) that is then subjected to all of the sample preparation (digestion, distillation, extraction) and analytical methodology applied to the samples. The purpose of the method blank is to check for contamination from within the laboratory that might be introduced during sample preparation and analysis that would adversely affect analytical results. A method blank must be analyzed
with each analytical sample batch.
r· fi"mJ' rumn<mf'pla"' '<Japp' J.!!.fl/ 'l"f.'f.'fin.duc 8-2 6/!,"01

I I I
I I I I I I I I I I I I I I I I
Analytical sensitivity goals have been identified in this QAPP as practical quantitation limits (PQLs).
The practical quantitation limit is the lowest concentration that can be reliably achieved within specified limits of precision and accuracy during routine laboratory operating conditions. The PQL is generally 5
to 1 0 tunes the MDL. Method blank levels should be below these levels ( quantitation limits) for all analytes. Method blank levels are considered acceptable if they are consistent with SW-846. Reporting limits for this project arc specified in Table 3-3.
8.3.2.1.2 Laboratory Control Samples
The LCS contains known concentrations of analytcs representative of the contaminants to be detem1ined and is canied through the entire preparation and analysis process. Commercially available LCSs or those from EPA may be used. Each LCS analyte must be plotted on a control chart. The primary purpose of the LCS is to establish and monitor the laboratory's analytical process control. An LCS must be analyzed with each analytical sample batch.
8.3.2.2 Matrix and Sample-Specific QC
8.3.2.2.1 Laboratory Duplicates
Laboratory duplicates are separate aliquots of a single sample that are prepared and analyzed concurrently at the laboratory. This duplicate sample should not be a method blank or field blank. The primary purpose of the laboratory duplicate is to check the precision of the laboratory analyst, the sample preparation methodology, and the analytical methodology. If there are significant differences between the duplicates, the affected analytical results will be re-examined. A laboratory duplicate will be performed at a frequency of once per batch.
8.3.2.2.2 Surrogate Spikes
A surrogate spike is prepared by adding a pure compound to a sample betore extraction. The compound ill the surrogate spike should be of a similar type to that being assayed in the sample. The purpose of a surrogate spike is to determine the efficiency of recovery of analytes in the sample preparation and analysis. The percent of recovery of the surrogate spike is then used to gauge the total accuracy of the analytical method for that sample.
8.3.2.2.3 Isotopic Tracers
An isotopic tracer is prepared by adding a unique isotope of the same or similar element to a sample
before preparation and analysis. The purpose of this isotopic tracer is to determine the efficiency of recovery of the targeted isotope or isotopes ill the sample preparation and analysis. The percent of recovery of the tracer is then used to gauge the total accuracy of the analytical method for that sample and to compensate for the quantification of the analyte of interest.
8-3 611.:01

I I I I I I I I I I I I I I I I I I I
8.3.2.2.4 Matrix Spikes and Matrix Spike Duplicates
An MS is an aliquot of a sample spiked with known quantities of analytes and subjected to the entire
analytical procedure. It is used to indicate the appropriateness of the method for the matrix by
measuring recovery or accuracy. Accuracy is the nearness of a result or the mean of a set of results to
the true or accepted value. An MSD is a second aliquot of the same sample with known quantities of
compounds added. The purpose of the MSD, when compared to the MS, is to determine the effect of
the matrix on method precision. Precision is the measure of the reproducibility of a set of replicate
results among themselves or the agreement among repeat observations made onder the same conditions.
MSs and MSDs arc performed per 20 samples of similar matrix.
8.3.2.2.5 Method-Specitic QC
The laboratory must follow specific quality processes as defmed by the method. These will include
measures such as calibration verification samples, instrument blank analysis, internal standards implementation, tracer analysis, method of standard additions utilization, serial dilution analysis, post
digestion spike analysis, chemical carrier evaluation, etc.
8-4 6/l/Ol

I I I I I I I I I I I I I I I I I
I I
9.0 CALCULATION OF DATA QUALITY INDICATORS
9.1 FIELD MEASUREMENTS DATA
Field data will be assessed by the site CQC Representative. The site CQC Representative will review
the field results for compliance with the established QC criteria that arc specified in this QAPP, and SAP. Accuracy of the field measurements will be assessed using daily instrument calibration, calibration check, and analysis of blanks. Precision will be assessed on the basis of reproducibility by multiple reading of a single sample.
Field data completeness will be calculated using Equations (la) and (!b).
Sample Collection (Ia):
Nwnbcr of Sample Points Sampled Completcne ss = x 100%
Nwnber of Sample Points Planned
Field Measurements (I b):
Number of Valid Field Measurements Made Completeness =
9.2 LABORATORY DATA
X \00% Number of Field Measurements Planned
(la)
(lb)
Laboratory results will be assessed for compliance with required precision, accuracy, completeness, and sensitivity as follows.
9.2.1 Precision
The precision of the laboratory analytical process will be determined through evaluation of LCS
analyses. The standard deviation of these measurements over time will provide confidence that implementation of the analytical protocols was consistent and acceptable. These measurements will establish the precision of the laboratory analytical process.
Investigative sample matrix precision will be assessed by comparing the analytical results between MS/lv!SD for organic analysis and laboratory duplicate analyses for inorganic analysis. The RPD will be calculated for each pair of duplicate analysis using Equation (2) below and produce an absolute value
for RPD. This precision measurement will include variables associated with the analytical process, influences related to sample matrix interferences, and sample heterogeneity.
r. '/wrup /onanm{plom 'qopp _l-.':!.1//'qopp/i" dvc 9-1 611101

I
' I I I I I I I I I I I I I I I I I
lS-D I RPD= X 100
(S +D) ' (2)
2
where
S =first sample value (original or MS value), D =second sample value (duplicate or lv!SD value).
9.2.2 Accuracy
The accuracy of the laboratory analytical measurement process will be determined by comparing the
percent recovery for the LCS to control chans.
Investigative sample accuracy will be assessed for compliance with the established QC criteria that are described in Section 3.0 of this QAPP using the analytical results of method blanks, reagent/preparation blank, MS!lv!SD samples, field blank, and trip blanks. The percent recovery (%R) of !viS samples will be calculated using Equation (3) below. This accuracy will include variables associated with the analytical process, intluences related to sample matrix interferences, and sample heterogeneity.
where
%R = A - B x 100, c
A = the analyte concentration determined experimentally from the spiked sample, B = the background level determined by a separate analysis of the unspiked sample, C =the amount of the spike added.
9.2.3 Completeness
Data completeness of laboratory analyses will be assessed for compliance with the amount of data
required for decision making. The completeness is calculated using Equation ( 4) below.
Ntunber of Valid Labomtory Measuremcn ts Made 11 Completene ss = x I OOO,o
Ntunbcr of Laboratory Measuremcn ts Planned
9,2.4 Sensitivity
(3)
(4)
Achieving method detection limits depends on sample preparation techniques, instrument sensitivity, and
matrix effects. 111erefore, it is important to determine actual method detection limits (MDLs) and
9-2 6/l/0 1

I
' I I I I I I I I I I I I I I I I I
minimum detectable concentration (MDC) through the procedures outlined in 40 CFR 136, Appendix B. MDLs and MDCs will be established for each major matrix under investigation (i.e., water, soil)
through multiple dctcnninations, leading to a statistical evaluation of the MDL/NlDC. Sensitivity shall be
adequate to ensure that the MDLsltv!DCs are below the project quantitation levels specified in Table 3-3.
It is important to monitor instrument sensitivity through calibration blanks and low concentration
standards to ensure consistent instrument performance. It is also critical to monitor the analytical method sensitivity through analysis of method blanks, calibration check samples, and LCSs, etc.
9.3 PROJECT COMPLETE;'I/ESS
Project completeness will be determined by evaluating the planned versus actual data. Consideration will be given for project changes and alterations during implementation. All data not flagged as rejected by the review, verification, validation, or assessment processes will be considered valid. Overall, the project completeness will be assessed relative to media, analyte, and area of investigation. Completeness objectives are listed in Table 3-1 (soil) and Table 3-2 (groundwater).
9.4 REPRESENTATIVENESS/COMPARABILITY
Representativeness expresses the degree to which data accurately reflect the analyte or parameter of interest for the environmental media examined at the site. It is a qualitative term most concerned with the proper design of the sampling program. Factors that a!Tect the representativeness of analytical data include appropriate sample population definitions, proper sample collection and preservation techniques, analytical holding times, use of standard analytical methods, and determination of matrix or analyte interferences. Sample collection, preservation, analytical holding time, analytical method application, and matrix interferences will be evaluated by reviewing project documentation and QC analyses.
Comparability, like representativeness, is a qualitative term relative to a project data set as an individual. These investigations will employ nanowly defined sampling methodologies, site audits/surveillances, usc of standard sampling devices, uniform training, documentation of sampling, standard analytical protocols/procedures, QC checks with standard control limits, and universally accepted data reporting units to ensure comparability to other data sets. Through proper implementation and documentation of these standard practices, the project will establish confidence that data will be comparable to other project and programmatic information.
Additional input to determine representativeness and comparability may be gained through statistical evaluation of data populations, chemical charge balances, compound evaluations, or dual measurement compansons.
r:j,rrrp·lommm/pi<m> 'f"PI' J-!:'-11/ '1"1'1'/ill doc· 9-3 6/l,Q I
I I I I I I I I I I I I I I I I I I I
10.0 CORRECTIVE ACTIONS
Corrective actions may be required for two major types of problems: analytical/equipment problems and noncompliance with criteria. Analytical and equipment problems may occur during sampling, sample handling, sample preparation, laboratory instrumental analysis, and data review.
Noncompliance with specified criteria and analytical/equipment problems will be documented through a formal corrective action progrdm at the time the problem is identified. The person identifying tl1e problem is responsible for notifying the SAIC Task Manager and the USACE Project Manager. When the problem is analytical in nature, information on these problems will be promptly communicated to the SAlC Analytical Laboratory Coordinator. Implementation of corrective action will be confirmed in
writing.
Any nonconformance with the established QC procedures in the QAPP or SAP will be identified and corrected in accordance with the QAPP. The SAlC Task Manager or his/her designee will issue an NCR (Figure 4-2) lor each nonconfmming condition.
Corrective actions will be implemented and documented in the field record book. No staff member will
initiate corrective action without prior communication of findings through the proper channels. If corrective actions are deemed insufficient, work may be stopped through a stop- work order issued by the SAlC Task Manager and the USACE Project Manager.
10.1 SA.cviPLE COLLECTION/FIELD MEASUREMENTS
Technical staff and project personnel will be responsible for reporting all suspected technical and QA nonconformances or suspected deficiencies of any activity or issued document by reporting the situation to the SAIC Project Manager or his/her designee. The manager will be responsible for assessing the suspected problems in consultation with the SAlC QA/QC Officer and SAlC Laboratory Coordinator to make a decision based on the potential for the situation to impact the quality of the data. When it is determined that the situation warrants a reportable nonconformance and corrective action, then an NCR will be initiated by the manager.
The manager will be responsible for ensuring that corrective actions for nonconformances are initiated
by:
• evaluating all reported nonconformances,
• controlling additional work on nonconforming items, • determining disposition or action to be taken, • maintaining a log of nonconformances, • reviewing NCRs and corrective actions taken, and • enswing that NCRs arc included in the fmal site documentation project files.
10-1 6/1/0 I

I I I I I I I I I I I I I I I I I I I
If appropriate, the SAIC Task Manager will ensure that no additional work dependent on the nonconfom1ing activity is performed until the corrective actions are completed.
Corrective action for field measurements may include:
• repeating the measurement to check the error, • checking tor all proper adjustments for ambient conditions such as temperature, • checking the batteries, • re-ca\ibrating equipment, • checking the calibration, • modifying the analytical method including documentation and notification (i.e., standard additions),
• replacing the instrument or measurement devices, and • stopping work (if necessary).
The SAIC Task Manager or his/her designee is responsible for all site activities. In this role, he/she may at times be required to adjust the site activities to accommodate activity-specific needs. When it becomes necessary to modify an activity, the responsible person notifies the SAIC Task Manager of the anticipated change and implements the necessary changes after obtaining the approval of the SAIC Task Manager and the USACE Project Manager. All such changes will be documented on an FCR that will be signed by the initiators and the SAIC Task Manager. The FCR for each document will be numbered serially as required. The FCR will be attached to the file copy of the affected document. The SAIC Task Manager must approve the change in writing or verbally before field in1plementation. If unacceptable, the action taken during the period of deviation will be evaluated in order to determine the significance of any departure from established program practices and action taken.
The SAIC Task Manager for the site is responsible for controlling, tracking, and in1plementing the identified changes. Reports on all changes will be distributed to all affected parties, including the USACE Project Manager. The USACE will be notified whenever program changes in the field are made.
10.2 LABORATORY Al'IALYSES
Laboratory QA plans will provide systematic procedures to identify out-of-control situations and corrective actions. Corrective actions will be implemented to resolve problems and restore malfunctioning analytical systems. Laboratory personnel will receive QA training and be made aware that corrective actions are necessary when:
• QC data are outside warning or control windows for precision and accuracy. • Blanks contain target analytes above acceptable levels and must be investigated. • Undesirable trends are detected in spike recoveries or RPD between duplicates. • T11ere are unusual changes in detection limits.
r. _I<" mp-IOrtll'\ nrlplwr,< 'I" PI'' J.! _'-Ill ''I"PP)il>.doc 10-2 6/1/01

I I I I I I I I I I I I I I I I I I I
• Deficieocics arc detected by internal audits, external audits, or from performance evaluation samples
results.
• Inquiries concerning data quality arc received.
Corrective action procedures are often handled at the bench level by the analyst who reviews the
preparation or extraction procedure for possible errors, checks the instrument calibration, spike and
calibration mixes, instrument sensitivity, and so on. Ifthe problem persists or cannot be identified, the
matter is referred to the Laboratory Supervisor, Manager, and/or QA Department for further
investigation. Once resolved, full documentation of the corrective action procedure is filed with project
records and the Laboratory QA Department, and the information is summarized within case narratives.
Corrective actions may include:
• re-analyzing the samples, if holding time criteria pennit;
• evaluating blank contaminant sources, elimination of these sources, and reanalysis;
• modifYing the analytical method (i.e., standard additions) with appropriate notification and
documentation;
• resampling and analyzing;
• evaluating and amending sampling procedures; or
• accepting data and acknowledging the level of nncertainty.
If resampling is deemed necessary due to laboratory problems, the SAIC Task Man~ger will identifY the
necessary recovery approach to implement the additional sampling effort.
The following corrective action procedures will be required:
• Problems noted during sample receipt will be documented in the appropriate laboratory LOR.
SAIC and USACE will be contacted immediately to determine problem resolution. All corrective
actions will be thoroughly documented.
• When sample extraction/digestion or analytical holding times arc not within method required
specifications, SAIC and USACE will be notified immediately to determine problem resolution. All
corrective actions will be thoroughly documented.
• All initial and continuing calibration sequences that do not meet method requirements will result in a
review of the calibration. When appropriate, re-analysis of the standards or re-analysis of the
affected samples back to the previous acceptable calibration check is warranted.
• All appropriate measures will be taken to prepare and clean up samples in an attempt to achieve the
practical quantitation limits as stated. When difficulties arise in achieving these limits, the laboratory
will notifY SAIC and the USACE to determine problem resolution. All corrective actions will be
thoroughly documented.
• Any dilutions impacting the practical quantitation lin1its will be documented in case narratives along
with revised quantitation limits for those analytes affected. Analytes detected above the method
detection limits, but below the practical quantitation limits, will be reported as estimated values.
r /i,rop Mna>,m(plo"> '1"1'1'' ;.:!-111 '<rapp!in do< I 0-3 6/l/0!

I I I I I I I I I I I I I I I I I I I
• Failure of method-required QC to meet the requirements specified in this project QAPP shall result
in review of all affected data. Resulting corrective actions may encompass those identified earlier.
SAIC and USACE will be notified as soon as possible to discuss possible corrective actions,
particularly when unusual or difficult sample matrices arc encountered.
• When calculation and reporting errors arc noted within any given data package, reports will be
reissued with applicable corrections. Case nanatives will clearly state the reasons for reissuance of reports.
10-4 6/\.10\

I I I I I I I I I I I I I I I I I I I
11.0 DATA REDUCTION, VALIDATION, fu'iD REPORTING
11.1 DATAREDUCTION
11.1.1 Field Measurements and Sample Collection
Raw data from tleld measurements and sample collection activities will be appropriately recorded in tield logbooks. Data to be used in project reports will be reduced and summarized. The methods of
data reduction will be docmnented.
The SAIC Task Manager or his/her designee is responsible for data review of all tield-generated data. This includes verifYing that all tield descriptive data are recorded properly, that all tield instnunent calibration requirements have been met, that all field QC data have met frequency and criteria goals, and that field data are entered accurately in all applicable logbooks and worksheets.
11.1.2 Laboratory Services
All samples collected for these investigations will be sent to USACE HTRW CX qualified laboratories. Data reduction, evaluation, and reporting for samples analyzed by a laboratory will be performed according to specifications outlined in the laboratory's QA plan. Laboratory reports will specifically
include documentation verifYing analytical holding time compliance.
Laboratories will perform in-house analytical data reduction under the direction of the Laboratory QA Manager. The Laboratory QA Manager is responsible for assessing data quality and infonning SAlC and USACE of any data which are considered unacceptable or require caution on the part of the data user in terms of its reliability. Data will be reduced, evaluated, and reported as described in the laboratory QA plan. Data reduction, review, and reporting by the laboratory will be conducted as follows:
• Raw data are produced by the analyst who has primary responsibility for the correctness and
completeness of the data. All data will be generated and reduced following the QAPP- and the activity-specific QAPP-detined methods and implementing laboratory SOP protocols.
• Level l technical data review is completed relative to an established set of guidelines by a peer analyst. The review will ensure the completeness and correctness of the data while assuring all method QC measures have been implemented and were within appropriate criteria.
• Level 2 technical review is completed by the area supervisor or data review specialist. This reviews the data for attainment of QC criteria as outlined in the established methods and for overall reasonableness. It will ensure that all calibration and QC data arc in compliance and check at least 10 percent of the data calculations. This review will docmnent that the data package is complete and ready for reporting and archival.
• Upon acceptance of the raw data by the area supervisor, the report is generated and sent to the Laboratory Project Manager for Level 3 administrative data review. This review will ensure
11-1 6/ !/01

I I I I I I I I I I I I I I I I I I I
consistency and compliance with all laboratory instructions, the laboratory QA plan, the project laboratory SOW, and this QAPP.
• The Laboratory Project Manager will complete a thorough review of all reports. • Final reports will be generated and signed by the Laboratory Project Manager. • Data will then be delivered to SAIC for data validation.
The data review process will include identification of any out-of.control data points and data omissions, as well as interactions with the laboratory to correct data deficiencies. Decisions to repeat sample collection and analyses may be made by the Project Manager based on the extent of the deficiencies and their importance in the overall context of the project. The laboratory will provide t1agged data to
include such items as: (I) concentration below required detection limit, (2) estimated concentration due to poor spike recovery, and (3) concentration of chemical also found in laboratory blank.
Laboratories will prepare and retain full analytical and QC documentation for the project for a period of five years after completion of the project. Such retained documentation will be both hard (paper) copy and electronic storage media (e.g., magnetic tape) as dictated by the analytical methodologies employed. As needed, laboratories will supply hard copies of the retained information.
Laboratories will provide the following information to USACE and SAIC in each analytical data package submitted:
• cover sheets listing the samples included in the report and narrative comments describing problems encountered in analysis;
• tabulated results of inorganic, organic, radionuclide, and miscellaneous parameters identified and quantified;
• analytical results for QC sample spikes, sample duplicates, initial and continuous calibration verifications of standards and blanks, standard procedural blanks, LCSs, and other deliverables as identified in Section 11.3 of this QAPP; and
• method detection limits.
11.2 DATA VALIDATION
11.2.1 Data Validation Approach
A systematic process for data verification and validation will be performed to ensure that the precision and accuracy of the analytical data are adequate lor their intended use. The greatest uncertainty in a measurement is often a result of the sampling process and inherent variability in the environmental media rather than the analytical measurement. Therefore, analytical data validation will be performed only to the level necessary to minimize the potential of using false positive or lalse negative results in the decision-making process (i.e., to ensure accurate identification of detected versus non-detected
compounds). This approach is consistent with the DQOs for the project, with the analytical methods, and for determining contaminants of concern and calculating risk.
r- }i.,rop WIIW>'IT!fp/of!>'IJ"f'P' .J-!!-11/'<foppjin doc 11-2 6/l;'O I
I I I I I I I I I I I I I I I I I I I
Samples will be analyzed through implementation of definitive analytical methods. Definitive data will be reported consistent with the deliverables identified in Section 11.4, and shown in Tables 11-1 and 11-2.
This report content is consistent with what is understood as an EPA Level Ill deliverable (data forms including laboratory QC and calibration information). This defmitive data will then be validated througb the review process presented in Section 11.2.2. DQOs identified in Section 3.0 and method-specified
criteria will be validated. Comprehensive analytical information will be retained by the subcontract laboratory.
Validation will be accomplished by comparing the contents of the data packages and QNQC results to requirements contained in the requested analytical methods. The SAIC validation support staff will be responsible for these activities. The protocol for analyte data validation is presented in:
• SAIC Quality Assurance Technical Procedures, Volume I, Data Management; • Laboratory Data Validation Guidelines For Evaluating Radionuclide Analyses, SAIC Document
Number: 143-ARCS-00.08, Revision 06, June 2000 (SAIC, 2000) • EPA National Functional Guidelines for Organic Data Review (EPA 1994b), modified for SW-
846;and • EPA National functional Guidelines for Inorganic Data Review (EPA 1994c) ), modified for
SW-846.
SAIC validation support staff will conduct a systematic review of the data for compliance with the established QC criteria based on the following categories:
• holding times, • blanks, • LCSs, • surrogate recovery (organic methods), • internal standards (primarily organic methods), • isotopic tracers (radionuclide methods), • inductively coupled plasma (ICP) or atomic absorption QC,
• calibration, • sample reanalysis, • secondary dilutions, and • laboratory case narrative.
Consistent with the data quality requirements as defmed in the DQOs, all project data and associated QC will be evaluated on these categories and qualified as per the outcome of the review. Information gathered during this validation process will be consistent with the information demonstrated by the USACE Data Validation Form (Figure 11-1). Either these forms or SAIC validation forms containing
equivalent documentation will be completed and presented with the Quality Control Summary Report
(QCSR).
11-3 6ili01

I I I I I I I I I I I I I I I I I I I
11.2.2 Primary Analytical Data Validation Categories
11.2.2.1 Holding Times
Evaluation of holding times ascertains the validity of results based on the length of time from sample
collection to sample preparation or sample analysis. Verification of sample preservation must be
confnmed and accounted for in the evaluation of sample holding times. The evaluation of holding times is
essential to establishing sample integrity and representativeness. Concerns regarding physical, chemical,
or biochemical alteration of analyte concentrations can be eliminated or qualified through this evaluation.
11.2.2.2 Blanks
The assessment of blank analyses is performed to determine the existence and magnitude of
contamination problems. The criteria for evaluation of blanks apply to any blank associated with the
samples, including field, trip, equipment, and method blanks. Contamination during sampling or analysis,
if not discovered, results in false- positive data.
Blanks will be evaluated against quantitation limit goals as specified in this QAPP and established by
SW-846.
11.2.2.3 Laboratory Control Samples
The LCS serves as a monitor of the overall perfonnance of the analytical process, including sample
preparation, for a given set of samples. Evaluation of this standard provides confidence in or allows
qualification of results based on a measurement of process control during each sample analysis.
11.2.2.4 Surrogate Recovery
System monitoring compounds are added to every sample, blank, matrix spike, MS, MSD, and
standard. They are used to evaluate extraction, cleanup, and analytical efficiency by measuring recovery
on a sample-specific basis. Poor system performance as indicated by low surrogate recoveries is one of
the most common reasons for data qualification. Evaluation of surrogate recovery is critical to the
provision of reliable sample-specific analytical results.
11.2.2.5 Internal Standards
Intemal standards are utilized to evaluate and compensate for sample-specific influences on the analyte
quantification. They are evaluated to determine if data require qualification due to excessive variation in acceptable internal standard quantitative or qualitative performance measures. For example, a decrease
or increase in internal standard area counts for organics may reflect a change in sensitivity that can be
11-4 6/1/0 l

I I I I I I I I I I I I I I I I I I I
attributed to the sample matrix. Because quantitative determination of analytes is based on the use of
internal standards, evaluation is critical to the provision of reliable analytical results.
11.2.2.6 Isotopic Tracers
Isotopic tracers arc utilized to evaluate and compensate for sample-specific influences and preparation
aberrations on the radionuclide quantification. They are evaluated to determine if data require
qualification due to excessive variation in acceptable tracer quantitative or qualitative performance
measures. For example, a decrease or increase in tracer recovery for a given isotope may reflect a
change in sensitivity that can be atrnbutcd to the sample matrix or preparation process. Because
quantitative determination of many radionuc\ides is based on the usc of tracers, evaluation is critical to
the provision of reliable analytical results.
11.2.2.7 Calibration
The purpose of initial and continuing calibration verification analyses is to verify the linear dynamic range
and stability of instrument response. Relative instrument response is used to quantitate the analyte
results. If the relative response factor is outside acceptable limits, the data quantification is uncertain and
requires appropriate qualification.
11.2.2.8 Sample Reanalysis
When instrnment performance-monitoring standards indicate an analysis is out of control, the laboratory is required to reanalyze the sample. If the reanalysis docs not solve the problem (i.e., surrogate
compmmd recoveries are outside the limits for both analyses), the laboratory is required to submit data
from both analyses. An independent review is required to determine which is the appropriate sample
result.
11.2.2.9 Secondary Dilutions
When the concentration of any analyte in any sample exceeds the initial calibration range, a new aliquot
of that sample must be diluted and reanalyzed. The laboratory is required to report data from both
analyses. When this occurs, an independent review of the data is required to determine the appropriate
results to be used for that sample. An evaluation of each analyte exceeding the calibration range must be
made, including a review of the dilution analysis performed. Results chosen in this situation may be a
combination of both the original results (i.e., analytes within initial calibration range) and the secondary
dilution results.
11-5 6/l/U l

I I I I I I I I I I I I I I I I I I I
11.2.2.10 Laboratory Case Narratives
Analytical laboratory case narratives arc reviewed for specific information concerning the analytical
process. This information is used to direct the data validator to potential problems with the data.
11.3 PROJECT ANALYTICAL DATA SET
Analytical data for each project will be verified electronically and validated by qualified chemists. Flags signifYing the usability of data will be noted and entered into an analytical database. Deficiencies in data deliverablcs will be corrected through direct communication with the field or laboratory, generating immediate response and resolution. All significant data discrepancies noted during the validation process will documented through NCRs, which are sent to the laboratory for clarification and correction.
Decisions to repeat sample collection and analyses may be made by the USACE Project Manager or the SAIC Task Manager based on the extent of the deficiencies and their importance in the overall context of the project.
All data generated for investigations will be computerized in a format organized to facilitate data review and evaluation. The computerized data set will include data flags in accordance with the above
referenced protocols as well as additional comments of the Data Review Team. The associated data flags will include such items as:(!) estimated concentration below-required reporting limit; (2) estimated concentration due to poor calibration, internal standard, or surrogate recoveries; (3) estimated concentration due to poor spike recovery; and ( 4) estimated concentration of a chemical that was also determined in the laboratory blank.
SAIC data assessment will be accomplished by the joint efforts of the data validator, the data assessor, and the Task Manager. Data assessment by data management will be based on the criteria that the sample was properly collected and handled according to the SAP and Sections 4.0 and 5.0 of this QAPP. An evaluation of data accuracy, precision, sensitivity and completeness, based on criteria in Section 9.0 of this QAPP, will be performed by a data assessor and presented in the QCSR. This data quality assessment will indicate that data are: (l) usable as a quantitative concentration, (2) usable with caution as an estimated concentration, or (3) unusable due to out-of.control QC results.
Project investigation data sets will be available for controlled access by the SAIC Task Manager and authorized personnel. Each data set will be incorporated into investigation reports as required.
11.4 DATA REPORTING
Laboratories will prepare and submit analytical and QC data reports to USACE and SAIC in compliance with the requirements of this QAPP including data forms listed in Table 11-1. An electronic
ll-6 61\10 l

I I I I I I I I I I I I I I I I I I I
copy of data will be provided in an ASCII data file or other compatible format for entry into the SAIC
database. An acceptable configuration is presented in Table 11-2 with all QA/QC sample data being provided in a companion ASCII file.
·n1e laboratory will be required to confirm sample receipt and log-in information. The laboratory will
return a copy of the completed COC and confirmation of the laboratory"s analytical log-in to SAIC within 24 hours of sample receipt.
The subcontract analytical laboratory will prepare and retain full analytical and QC documentation for a period of five years after completion of the project. Such retained documentation will include all hard copies and other storage media (e.g., magnetic tape). As needed, the subcontract analytical laboratory will make available all retained analytical data information.
II- 7 6/l/U l
I I I I I I I I I I I I I I I I I I I
12.0 PREVENTIVE MAINTENANCE PROCEDURES
12.1 FIELD INSTRUMENTS A:\'D EQUIPMENT
The field equipment for each project may include alpha/beta and gamma survey meters; and organic vapor detectors (FlO or PID). Specific preventative maintenance procedures to be followed for field
equipment are those recommended by the manufacturers. These procedures are included in the technical procedures governing the usc of these instruments.
Field instmments will be checked and/or calibrated before they are shipped or carried to the field. Each field instmment will be checked daily against a traceable standard or reference with a known value to ensure that the instmment is in proper calibration. Instmments fmmd to be out of calibration will be recalibrated before usc in the field. If an instmmcnt cannot be calibrated, it will be returned to the supplier or manufacturer for recalibration, and a back-up instmrnent will be used in its place. Calibration checks and calibrations will be documented on the Field Meter/Calibration Log Sheets in the M&TE
Log Book. Any maintenance conducted on field equipment must also be documented in the M& TE Log Book.
Critical spare parts such as tapes, papers, and batteries will be kept on site to minimize down time of malfi.mctioning instruments. Back-up instruments and equipment should be available on site or within 1-day shipment to avoid delays in the field schedules.
12.2 LABORATORY INSTRUMENTS
As part of their QNQC Program, a routine preventive maintenance program will be conducted by all investigation- associated laboratories to minimize the occurrence of instmrnent failure and other system malfunctions. All laboratory instruments will be maintained in accordance with manufacturers' specifications and the requirements of the specific method employed. This maintenance will be carried out on a regular, scheduled basis and will be documented in the laboratory instmment service log book for each instrument. Emergency repair or scheduled manufacturer's maintenance will be provided under
a repair and maintenance contract with factory representatives.
12-1 6; \;OJ
I I I I I I I I I I I I I I I I I I
perfonnancc review audits would be conducted by SAIC only at the direction of ancl in conjunction
wir:1 the USACE, when requested.
External audits may be conducted in conjunction with or at the direction of the EPA Region or the State
of New York regulatory agency.
13-2 6/!10 I
I I I I I I I I I I I I I I I I I I I
13.0 PERFORNIANCE AND SYSTEM AUDITS
Performance and system audits of both field and laboratory activities will be conducted to verifY that sampling and analysis are performed in accordance with the procedures established in the SAP, and QAPP. Audits of laboratory activities will include bofh internal and external audits.
13.1 FIELD AUDITS
Internal audits of field activities (sampling and measurements) will be conducted by the SAJC QNQC Officer (or designee) and/or Field Team Leader. 1l1e audits will include examination of field sampling records, field instrument operating records, sample collection, handling and packaging in compliance with the established procedures, maintenance of QA procedures, COC, etc. These audits will occur at
the onset of the project to verifY that all established procedures are followed (systems audit).
Performance audits will follow to ensure deficiencies have been corrected and to verifY that QA practices/procedures are being maintained throughout the duration of fhe project work effort. These audits will involve reviewing field measurement records, instrumentation calibration records, and sample documentation.
External audits may be conducted at fhe discretion of the USACE, fhe EPA Region, or the State of New York.
13.2 LABORATORY AUDITS
The USACE HTRW CX conducts on-site audits and validates laboratories on a regular basis. 1l1ese USACE independent on-site systems audits in conjtmction with performance evaluation samples qualifY laboratories to perform USACE environmental analysis every 24 months.
These system audits include examining laboratory documentation of sample receiving, sample log- in, sample storage, COC procedures, sample preparation and analysis, instrument operating records, etc. Performance evaluation samples are sent to USACE laboratories for on-going assessment oflaboratory precision and accuracy. The analytical results of fhe analysis of performance evaluation samples are evaluated by USACE HTRW CX to ensure that laboratories maintain an acceptable perfom1ance.
Internal performance and system audits oflaboratories will be conducted by the Laboratory QA Manager as directed in the laboratory QA plan. These system audits will include examination of laboratory documentation of sample receiving, sample log-in, sample storage, COC procedures, sample preparation and analysis, instrument operating records, etc. Internal performance audits are also conducted on a regular basis.
SAJC is not contracted to perform laboratory audits; however, additional audits of laboratories may be planned and budgeted within specific USACE task scopes. These project-specific laboratory
~- '}ll>'rop·lrmrl\\ mfplrrm ''-{ffi'IJi_/- 2~ -Ill 'rJoppjin due 13-1 6/liOI
I I I I I I I I I I I I I I I I I I I
14.3 QUALITY CONTROL SUMMARY REPORTS
At the conclusion of field investigation activities and laboratory analysis, SAIC, in addition to any review
conducted by the laboratory, will perform its own validation of the submitted data. This activity will
include assignment of flags to data, documentation of the reason( s) for the assignments, and description of any other data discrepancies. SAIC will then prepare a QCSR, which will be included as an
appendix to the final report. This report will be submitted to the USACE Project Manager as determined by the project schedule. The contents of the QCSR will include data validation documentation and discussion of all data that may have been compromised or influenced by aberrations in the sampling and analytical processes. Both field and laboratory QC activities will be summarized,
and all DQCR information will be consolidated. Problems encountered, corrective actions taken, and their impact on project DQOs will be determined.
The following arc examples of elements to be included in the QCSR as appropriate.
• Laboratory QC evaluation and summary of the data quality for each analytical type and matrix. Part of the accuracy, precision, and sensitivity summarized in the data quality assessment.
• Field QC evaluation and summary of data quality relative to data usability. Part of the accuracy, precision, and sensitivity summarized in the data quality assessment.
• Overall data assessment and usability evaluation. • DQCR consolidation and summary. • Summary of lessons learned during project implementation.
Specific elements to be evaluated within the QCSR include the following:
• sample results, • field and laboratory blank results, • laboratory control sample percent recovery (method dependent), • sample matrix spike percent recovery (method dependent), • MS/MSD or sample duplicate RPD (method dependent),
• analytical holding times, and • surrogate recovery, when appropriate.
An example of the format that will be used by SAIC for preparation of the project QCSR is presented in Figure 14-2.
r:'jmrop·!Wll"•mJ'p/<ll!>'<f"I'I''J·:?]-11/'<fapp}in_do;.• 14-2 6/1/01

I I I I I I I I I I I I I I I I I I I
15.0 REFERENCES
ASTM (American Society of Testing and Materials). 1996. Annual Book of ASTM Standards, Volume 04.08, Soil and Rock.
BNI 1995. Bechtel National, Incorporated. Town of Tonawanda Landfill Contaminated Waste Volume Estimate. October 1995.
DOE 1992. Document No. 098386, Memorandum- Designation of Tonawanda Vicinity Properties, December 1992.
EG&G, 1979, Summary Report- Aerial Radiological Survey, Tonawanda, New York Date of Survey: September 1979. Prepared for Department of Energy
EG&G, 1984, An Aerial Radiological Survey for Am241 Contamination in Tonawanda, New York Date of Survey: May 1984. Prepared for Department of Energy
EPA (U.S. Environmental Protection Agency), 1985. NEIC Policies and Procedures, EPA-300/9-78DDI-R, Revised June.
EPA, 1 991. Interim Guidelines and Specifications for Preparing Quality Assurance Project Plans, QAMS-005/80.
EPA, 1993a. Data Quality Objectives Process, EPA-540-R-93-071, September.
EPA, 1993b. Test Methods for Evaluating Solid Waste, Physical/Chemical Methods, SW-846, Third Edition, Revision 1, Updates 1, 2, and 3.
EPA, 1994a. EPA Requirements for Quality Assurance Project Plans for Environmental Data Operations, EPA QA/R-5, January.
EPA, 1994b. EPA National Functional Guidelines for Organic Data Review, EPA-540/R-94/012, February.
EPA, 1994c. EPA National Functional Guidelines for Inorganic Data Review, EPA-540/R-94/013, February.
EPA, 1995. Methods for Chemical Analysis of Water and Wastes, EPA Manuals, 600/4-79-020, current edition.
OR.J'lL 1990. Results of Mobile Gamma Scanning Activities in Tonawanda in Tonawanda, New York, Oak Ridge National Laboratory, Oak Ridge, Tennessee. December 1990.
15-1 61!10 1

I I I I I I I I I I I I I I I I I I I
ORNL 1992. Results of the Radiological Survey at the Town of Tonawanda Landfill. Tonawanda, New York, Oak Ridge National Laboratory, Oak Ridge, Tennessee. October 1992.
SAIC (Science Applications International Corporation), 1995. SAIC Quality Assurance Technical Procedures, Vol. 1: Data Management, Data Validation, TP-DM-300-7.
SAIC, 2000. Laboratory Data Validation Guidelines For Evaluating Radionuclide Analyses, SAIC Document Number: 143-ARCS-00.08, Revision 06, June 2000
TMA/Eberlinc 1988. Radiological Characterization of iv!unicipal Landfill- Tonawanda, NY. February 1988.
ToT, 1999. Tonawanda Landfill Closure- FUSRAP Material, Camilleri (Town of Tonawanda) to Youngberg (NYSDEC), 6/ll/99
USACE (United States Army Corps of Engineers), 1990. Chemical Data Quality Management for Hazardous Waste Remedial Activities, USACE, ER 1110-1-263, October.
US ACE, 1994. Requirements for the Preparation of Sampling and Analysis Plans, EM 200-1-3, September.
USACE 1998, "Shell for Analytical Chemistry Requirements", Version 1.0, November 2, 1998.
USACE 1999a. Scope of Work for Remedial Investigation/Feasibility Study, Linde Site- Tonawanda, NY, Tonawanda Landfill Vicinity Property. December 1999.
USACE 1999b. Technical Memorandum: Radiological Human Health Assessment for the Town ofTonawanda Landfill, Tonawanda, New York. U.S. Army Corps of Engineers. February 1999.
US ACE 1999c. Risk Assessment Handbook, Vol. 1: Human Health Evaluation, EM 200-1-4.,
USACE January, 1999.
Wehran 1994. Town of Tonawanda Landfill- Drafi Closure Plan. March 1994.
15-2 6/l/01

I I I I I I I I I I FIGURES
I I I I I I I I I
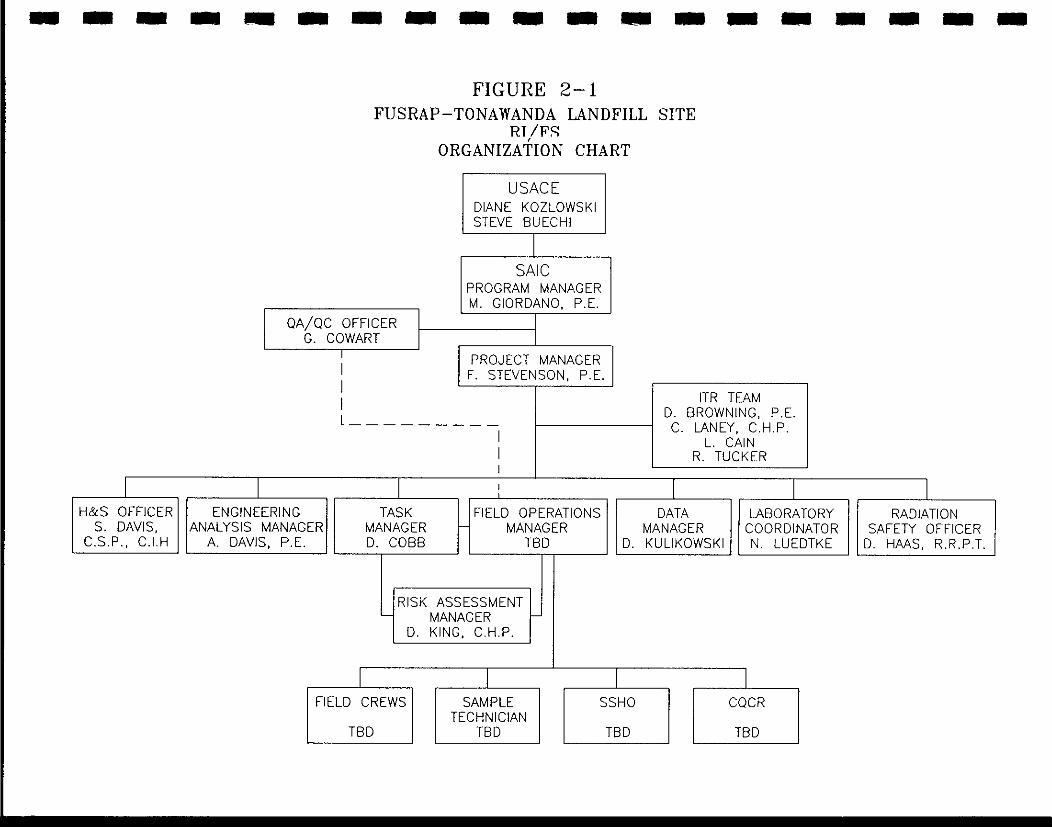
-------------------
I H&S OFFICER
S. DAVIS, C.S.P., C.I.H
FIGURE 2-1 FUSRAP-TONAWANDA LANDFILL SITE
RT/F'S ' ORGANIZATION CHART
USACE DIANE KOZLOWSKI STEVE BUECHI
SAIC PROGRAM MANAGER M. GIORDANO, P.E.
OA/OC OFFICER G. COWART
I PROJECT MANAGER I F. STEVENSON, P.E. I
ITR TEAM I D. BROWNING, P.E. [ _________ C. LANEY, C.H.P.
I L. CAIN I R. TUCKER I
I I I I I ENGINEERING TASK FIELD OPERATIONS DATA LABORATORY
ANALYSIS MANAGER MANAGER MANAGER MANAGER COORDINATOR A. DAVIS, P.E. D. COBB TBD D. KULIKOWSKI N. LUEDTKE
RISK ASSESSMENT MANAGER
D. KING, C.H.P.
I I I FIELD CREWS SAMPLE SSHO CQCR
TECHNICIAN TBD TBD TBD TBD
I RADIATION
SAFETY OFFICER D. HAAS, R.R.P.T.

I I I I I I I I I I I I I I I I I I I
Figure 4-1. Example of a Field Change Request Form
FCONO DATE INITIATED
PROJECT
OONTRACT NO. PRIORITY
RECUESTER IDENTIFICATION
NAME ORGANIZATION PHONE
TITLE SIGNATURE
BASELINE IDENTIFICATION
BASELINE(S) AFFECTED OcosT OscoPE 0 MILESTONES 0METHOD OF ACOOMPLISHMENT AFFECTED DOCUMENT (TITLE, NUMBER AND SECTION) DESCRIPTION OF CHANGE:
JUSTIFICATION:
IMPACT OF IMPLEMENTING REQUEST:
PARTICIPANTS AFFECTED BY IMPLEMENTING REQUEST:
COST ESTIMATE ($) ESTIMATOR SIGNATURE
PHONE DATE
PREVIOUS FC AFFECTED 0YES 0 NO
CLIENT PROJECT MANAGER DATE
CLIENT QA SPECIALIST DATE
SAIC H&S MANAGER SIGNATURE (IF APPLICABLE) DATE

I I I I I I I I I I I I I I I I I I I
Figure 4-2. Example of a Nonconformance Report
NONCONFORMANCE REPORT
INITIATOR
INITIATOR Date
PROPOSED
YES REINSPECT/RETEST REQUIRED 0
DATE OF NCR NCR NUMBER
LOCATION OF NONCONFORMING
QA/QC OFFICER
NAME
IF YES:---Date
NAME
Date
Result
YES NO CARREO'D0 0
Date
Date
Date
Revision 3, 3/15196, QAPP 15.1

- - - - - - - - - - - - -Figure 5-l. Example of a Chain-of-Custody Form
PROJECT NAME:
PROJECT NUMBER:
PROJECT MANAGER: Sltrflllt (Signalun)
Science Appllcal/ons International Corporation An £1TJ>Io,_•·Own•d CIM>PI"Y
(42J}.Ur....f4co
!Print..:! Ntm.)
Sampl11tiD Dale Collected Time Collected
AEUNOUINSHEO BY: Date/Time RECEIVED BY:
COMPANY NAME: COMPANY NAME:
RECEIVED BY: Oahrr/Time AELINQUISUEO BY:
COMPANY NAME: COMPANY NAME:
RELINOUINSHED BY: RECEIVED BY:
COMPANY NAME: COMPANY NAME:
Matrix
CHAIN OF CUSTODY RECORD
REQUESTED PARAMETERS
;;
~ ~ ' ' z
!:~¢ 'J~ -. ·r '-' -~J ,h!. ~Y-
;t}: ,;1/ :·q -~~ Gi ~- ;:w l),)
I!~ :# n:r ~·-·· >~ 8:
{:% ;!•' j' Iii
,_., ('/ "' ·<.-: _;;..
C·i;;, ~!.~; A- t-\~ ~-:: . ~-, :·-;· :·-"
;.lj ,.1,
!f, w: . )f· ~-,~ ~\l! -1),
n ~~~ ~1,;; ~f.
{·' ....,. -~
l¥· ~-:,?; ._}1' --~ ~~i ,-,:
i ::~¥ ~,') .p
~ i :; {d ~~ ·~'· P#, : \1::
·.:# ;)•'i .,., ;;; , 1'(!rj l(f,: \j ···?: <~·
;~ i.'.t, :i:Yf ,; eJ ,{;_. d
i'i~ ;~;~ I,;;; .:j;! ~ ... .:;t '),_.
:\~ ki .'~ >_'l: --.. ~i
•*' DateiTJnM TOTAL NUMBER OF CONTAINERS:
Coo!.riO:
Date/Time
- - - - -CDC NO:
LABORATORY NAME:
lABORATORY ADDRESS:
PHONE NO:
O'A
SCREENINO
OD:>EAVA liONS, COMMENTS, SPECIAL INSTAUCTJONS,
-

I I Figure 11-l Data Validation Form, USACE
I DATE:
REVIEWER NA:VIE:
I SIGNATURE:
TITLE:
DAT -\ VALIDATION CHECKLIST
I PROJECT NAME:
PROJECT :--lUMBER:
S""v!PLE ID (NUMHERS):
SAMPLING TEA1YI: I SAMPLE MATRIX:
I A:--IAL YSES PERFORMED:
CESAS DATA REPORTING LEVEL
I FIELD DATA DOCUMENTATION· .. REPORTED ACCEPTABLE
NOT FIELD SAMPLING LOGS: NO YES :--10 YES REQUIRED
I. SAMPLING DATES NOTED I 2. SAMPLING TEAM INDICATED
3. SAMPLE ID TRACEABLE TO LOCATION I 4. SAMPLE LOCATION
5. SAMPLE DEPTHS FOR SOILS
6. COLLECTION TECHNIQUE (BAILER, PUMP, ETC.) I 7. SAMPLE TYPE (GRAB, COMPOSITE)
8. SAMPLE CONTAINER
9. SA:VIPLE PRESERVATION I
10. CHAIN OF CUSTODY FORM COMPLETED
II. REQUIRED ANALYTICAL METHODS I 12. FIELD WATER AND SOIL SAMPLE LOGS
I 13. NUMBER Of QA & QC SA:VIPLES COLLECTED
14. FIELD EQUIPMENT CALIBRATION
15. FIELD EQUIPMENT DECONTAMINATION
16. SAMPLE SHIPPING I COMMENTS:
I I I I

I I Figure 11-1. Data Validation Form, USACE (continued)
I REPORTED ACCEPTABLE NOT LABORATORY DATA VAUDATfOI'\:
NO YES NO YES REQUIRED
I. SAMPLING RESULTS
2. PARAMETERS ANALYZED I 3. ANALYTICAL METHOD
4. SAMPLE RECEIPT DATE
5. SA~IPLE PREPARATION DATE I 6. HOLDING TIMES
7. CALIBRATION
8. MS/MSD RPD OR SAMPLE LD RPD I
9. SURROGATE SPIKE RESULTS
10. BLANKS I A. RINSATES
B. FIELD BLANKS
c. TRIP BLANKS I II. SAMPLE pH
I 12. SA:VIPLE TEMPERATURE
13. DETECTION LIMITS
14. QC DATA
A. lNORCiANIC
B. ORGANIC I I ANALYTE:
FLAG:
I REMARKS:
I OVERALL COMMENTS:
I DEFINITIONS: U Analyte not detected J Analyte identified, concentration is estimated value UJ Analyte not detected above estimated detection limits 8 Blank contaminated R Rejected value, presence or absence of analyte cannot be verified UR Rejected detection limits
I MS Matrix Spike
I MSD Matrix Spike Duplic<~te RPD Relative Percent Difference LD Laboratory Duplicate
I I I

I I I I I I I I I I I I I I I I I I I
Figure 14- I. Example of the Daily Quality Control Report
DAILY QUALITY CONTROL REPORT
COE PROJECT MANAGER
PROJECT
JOB NO.
CONTRACT NO.
SUB-CONTRACTORS ON SITE:
EQUIPMENT ON SITE:
WORK PERFORMED IINCLUDING SAMPLING\:
>'"\,
DATE ;::;::;~:;;:;::;;::::;::;;;~~ DAy I s I M I T I w I TH I F I s I
WEATHER il~ISIJ(l c•~ OfOIIrt:asl A•in s~
TEMP To :J.2" 32·30" 30-70" 7o-s..s· as· up
WIND Shll ""~· Hi91l Meport No.
HUMIDITY o, """~· """"'
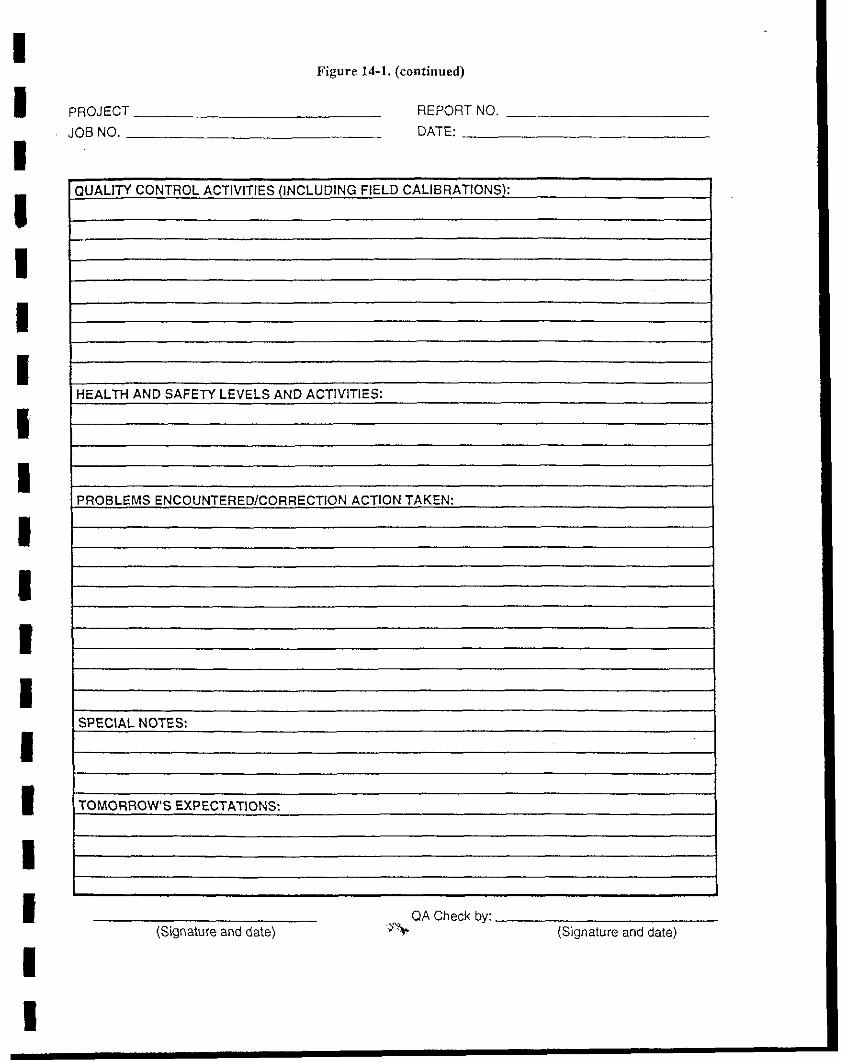
I I I I I I I I I I I I I I I I I I I
Figure 14-1. (continued)
PROJECT ________________________ __ REPORT NO.---------------------JOBNO. ________________________ _ DATE: ________________________ __
QUALITY CONTROL ACTIVITIES (INCLUDING FIELD CALIBRATIONS):
HEALTH AND SAFETY LEVELS AND ACTIVITIES:
PROBLEMS ENCOUNTERED/CORRECTION ACTION TAKEN:
SPECIAL NOTES:
TOMORROW'S EXPECTATIONS:
(Signature and date) '1'"-. OA Check by:--------:=-,-------:---
.,.. (Signature and date)

I I I I I I I I I I I I I I I I I I I
Figure 14-2 Quality Control Summary Report Format
I. Introduction
1.1 Project Description 1.2 Project Objectives !.3 Project Implementation !. 4 Purpose of this Report
2. Quality Assurance Program
2.1 Monthly Progress Reports 2.2 Daily Quality Control Reports (DQCRs) 2. 3 Laboratory "Definitive" Level Data Reporting
3. Data Validation
3.1 Field Data Validation 3. 2 Laboratory Data Validation 3. 3 Definition of Data Qualifiers (Flags) 3 .4 Data Acceptability
4. Data Evaluation
4.1 Accuracy • Metals • Radionuclides • Water Quality • etc.
4. 2 Precision • Laboratory Precision • Field Precision
4. 3 Sensitivity 4.4 Representativeness and Comparability 4.5 Completeness
5. Data Quality Assessment Summary
6. References

I I I I I I I I I I TABLES
I I I I I I I I I

I I I I I I I I I I I I I I I I I I I
Data Usc
Screening for sample site selection
Gamma Walkover Survey
Downhole Gamma Scanmng
Confinnation of contamination extent and risk assessment, and detennination of waste characteristics
DQI =data quality indicator LCS '"""' laboratory control sample MS =matrix spike FlO = flame ionization detector TAL= Target Analyte List
Table 3-1 Surface Soil/Subsurface Soil DQI Summary
Sample Type
Field
t-ield
Field
field
Discrete
Discrete
Discrete
Discrete
Discrete
Discrete
Discrete
Discrete
Analytical Precision ;\lcthod Field Dups
FID/PID +I-Volatile Organics comparison
Radiological monitonng +I- I 00 cpmc
Radiologic:1l monitonng .;.../_ I 00 cpm'
Radiological monitonng +/- l 00 cpm'·
Radiochemical <50 RPD vanous
T,\L Metals 6010B <50 RPD 7471 (Hg)
TCL Volatiles <50 RPD
8260B
TCL ScmiVolatiles <50 RPD
8270C
TCL Pesticides <50 RPD
8081A
TCL PCBs <50 RPD
8082
Other Waste NARPD Characteristics e
Physical T <:sting! NA ASTC.l
PID = photoionization detector NA =not applicable ppm= parts per million PCBs ..oo polychlorinated biphenyls TCL =Target Compound List
Lab Dups (RPD)' I (DER)"
Nr\
NA
NA
NA
<IDER or
<::35% RPD
<35 RPD
<35 RPD
<35 RPD
<35 RPD
<35 RPD
<40 RPD
<40 RPD
Accuracy Laboratory (LCS/MS)'. Completeness
+/- 0.1 ppm 95%
NA 95%
NA 95%
NA 95%
75-125% 90% recovery
75-125% 90% recovery
75-125% 90% recovery
75-125% 90% recovery
75-125% 90% recovery
75-125% 90% recovery
50-150% 90% recovery
NA 90%
a DER =Duplicate Error Ratio is the ratio of the difference between the duplicate results to the propagated 2 standard deviations uncertainties for the sum of the duplicate results. This is used instead of the RPD for rad results ncar the detection limit. hRPD =Relative Percent Difference; at values within five times the reporting level, comparison is acceptable when values are plus or minus three times the reponing level. These DQ!s will also apply to waste, investigation-derived waste, air filter, soil gas absorbent, and other solid sample media. '"Sample matrix spike percent recovery evaluation is considered applicable only when the spike concentration is at least 25% of the initial sample concentration. Jcpm =counts per minute 'Other waste characteristics will be delineated in an actlvlty-specific Sampling and Analysis Plan. 1Physical testing requirements= moisture content, Atterburg limits, and grain size analysis.

I I I I I I I I I I I I I I I I I I I
Sample Data l!se Type
Determination of p re.sence of, and extent of
Discrete contamination in groundwater. Use
for risk assessrnenr.
Detem1ination of Waste
Discrete Characteristics for
disposal options
DQO = data qualiry objective MS = matrix spike TCL ::=::: Target Compound List
Table 3-2 Groundwater DQI Summary
Lab Dups Analytical Precision (RPD)' I
.\-lcthod Field Dups (DER)"
Radiochemical <35 RPD <1 DER vanous or (Total) <_t25%
RPD
N/A <±25% Waste Characteristics d
RPD
LCS = \ahorarory comrol sample ppm = pans per mi!lion NA = not applicable
Accuracy Laboratory (LCS/MS)" Completeness
75-l25% 90% recovery
75-125% 90% recovery
"DER = Duplicare Error Ratio is the ratio of the difference between the duplicate results to the propagated 2 standard deviations uncertainties for the sum of the duplicate results. This is used instead of the RPD for rad results near the detection limit. "RPD = Relative Percent Difference: at values within five times the reporting level, comparison is acceptable when values are plus or minus three times the reporting level. csample matrix spike percent recovery evaluation is considered applicable only when the spike concentration is at least 25% of the initial sample concentration . .~Other waste characteristics will be delineated in an activiry-specific Sampling and Analysis Plan.

I I I I I I I I I I I I I I I I I I
Table 3-3
Analytical/Methods, Parameters, and Project Quantitation Limits
Analytical Methods* Project Quantitation Levels'
Paran1eters Water Soil/Solid Water Soil
TAL Metals (Total)
AlLU11imun N/A 60lOB N/A 10 mg/kg
Antimony NIA 6010B N/A 0.5 mg/kg
Arsenic N/A 60lOB N/A 0.5 mg/kg Barium N/A 60lOB N/A 1 mg/kg Beryllium N/A 60lOB N/A 0.1 mg/kg
Cadmium NIA 6010B N/A 0.1 mg/kg
Calcium N/A 60lOB NIA 10 mg/kg
Chromium N/A 6010B N/A 0.5 mg/kg
Cobalt N/A 6010B N/A 0.5 mg/kg
Copper N/A 6010B N/A 0.5 mg/kg
Cyanide, T oral N/A 9012 N/A 0.5 mg/kg
Iron N/A 60lOB N/A 10 mg/kg
Lead N/A 6010B N/A 0.3 mg/kg
Magnesium N!A 6010B N/A 10 mg/kg
Manganese NIA 6010B N/A 1 mg/kg
Mercury N/A 7470 N/A 0.1 mg/kg
Nickel NIA 60IOB N/A lO mg/kg Potassium N/A 60lOB N/A 10 mg/kg
Selenium NIA 60lOB N/A 0.5 mg/kg Silver NIA 6010B N/A 0.5 mglkg Sodium N/A 6010B N/A 10 mg/kg
Thallium N/A 60lOB/6020 N/A 0.2 mg/kg
Vanadium N/A 60IOB N/A 1 mg/kg
Zinc N/A 60lOB N/A 1 mglkg
TCL Volatiles Acetone N/A 5035- 8260B N/A 1 mg/kg Benzene N/A 5035- 8260B N/A 1 mg/kg Bromochloromethane N/A 5035- 8260B N/A 1 mg/kg Bromodichloromethane N/A 5035- 8260B N/A 1 mg/kg Bromoform N/A 5035- 8260B N/A 0.1 mg/kg Bromomethane/Methyl N/A
5035- 8260B N/A
1 mg/kg Bromide 2-Butanone/MEK N/A 5035- 8260B N/A 0.1 mg/kg Carbon Disulfide N/A 5035- 8260B N/A 1 mg/kg Carbon Tetrachloride N/A 5035- 8260B N/A 1 mg/kg Chi oro benzene N/A 5035- 8260B N/A 1 mg/kg Chloroethane N/A 5035- 8260B N/A 1 mg/kg Chlorofonn N/A 5035- 8260B N/A 0.1 mg/kg

I I I I I I I I I I I I I I I I I I I
Table 3-3 Analytical/Methods, Parameters, and Project Quantitation Limits
Analytical Methods* Project Quantitation Levels"
Parameters Water Soil/Solid Water Soil Chloromethane/Methyl N/A 5035- 82608 N/A 1 mg/kg Chloride Dibromochloromcthane N/A 5035- 82608 N/A 1 mg/kg 1,2-Dibromo-3- N/A 5035- 82608
N/A 1 mgikg chloropropane
l ,2-Dibromoethane N/A 5035- 82608 N/A 1 mg/kg 1,2-Dichlorobenzene N/A 5035- 82608 N/A 1 mg/kg l ,3- Dichlorobenzene N/A 5035- 82608 N/A 1 mg/kg I ,4-Dichlorobenzene N/A 5035- 82608 N/A 1 mg/kg I, 1-Dichloroethane N/A 5035- 82608 N/A 1 mg/kg l ,2-Dichlorocthane N/A 5035- 82608 N/A 1 mg/kg I, 1-Dichloroethene N/A 5035- 82608 N/A 1 mg/kg cis-! ,2-Dichloroethane N/A 5035- 82608 N/A 1 mg/kg trans -1,2- Dichloroethane N/A 5035- 82608 N/A 1 mg/kg 1,2-Dichloropropane N/A 5035- 82608 N/A 0 1 mg/kg cis-1 ,3-Dichloropropene N/A 5035- 82608 N/A 0.01 mglkg trans -1 ,3-Dichloropropene N/A 5035- 82608 N/A 0. 0 1 mg/kg Ethylbenzene N/A 5035- 82608 N/A 1 mg/kg 2-Hexanone N/A 5035-82608 N/A 1 mgikg Methylene Chloride N/A 5035- 82608 N/A 0.1 mg/kg 4- Methyl-2- Pentanone/ NIA 5035-82608
N/A 0.1 mglkg MIBK
Styrene N/A 5035-82608 N/A 1 mg/kg 1,1 ,2,2-Tetrachloroethane N/A 5035- 82608 N/A 0.01 mg/kg Tetrachloroethene N/A 5035- 82608 N/A 0.1 mg/kg Toluene N/A 5035- 82608 N/A l mgikg l, l, 1-Trichloroethane N/A 5035- 82608 N/A 1 mg/kg l,l ,2-Trichloroethane N/A 5035- 82608 N/A 0.1 mg/kg Trichloroethene N/A 5035- 82608 N/A 0.1 mgikg Vinyl Chloride N/A 5035- 82608 N/A 0.1 mgikg Xylenes (total) N/A 5035- 82608 N/A 1 mg/kg
TCL Semivolatiles Acenapthene N/A 8270C N/A 1 mg/kg Acenapthylene N/A 8270C N/A 1 mg/kg Anthracene N/A 8270C N/A 1 mg/kg 8enzo( a )anthracene N/A 8270C N/A 0.1 mg/kg Benzo(b )fluoranthene N/A 8270C N/A 0.1 mg/kg 8enzo(k)t1uoranthene N/A 8270C N/A 0.1 mg/kg Benzo(ghi)perylene N/A 8270C N/A 0.1 mg/kg 8enzo(a)pyrene N/A 8270C N/A 0.1 mg/kg bis(2-Chloroethoxy)methane N/A 8270C N/A 1 mg/kg

I I I I I I I I I I I I I I I I I I I
Table 3-3 Analytical/Methods, Parameters, and Project Quantitation Limits
Analytical Methods* Project Quantitation Levels'
Parameters Water Soil/Solid Water Soil bis(2-Chloroethyl)ether N/A 8270C N/A I mg/kg bis(2- E thylhexy I )phthalate . N/A 8270C N/A I mg/kg 4-Bromophenyl phenyl ether N/A 8270C N/A 1 mg/kg Butyl Benzyl Phthalate N/A 8270C N/A 1 mg/kg 4-Chloroaniline NIA 8270C N/A I mg/kg p-Chloro-m-Cresol N/A 8270C N/A 1 mg/kg 2-Chloronapthalene N/A 8270C N/A 1 mg/kg 2-Chlorophenol N/A 8270C N/A 1 mg/kg 4-Chlorophenyl Phenyl N/A 8270C N/A 1 mg/kg Ether Chrysene N/A 8270C N/A 1 mg/kg o-CresoV2- Methyl phenol N/A 8270C N/A 1 mg/kg p-CresoV4-Methylphenol N/A 8270C N/A 1 mg/kg Di-n-butyl Phthalate N/A 8270C N/A 1 mg/kg Dibenz( a,h )anthracene N/A 8270C N/A 0.1 mg/kg Dibenzofuran N/A 8270C N/A 1 mg/kg 3,3'-Dichlorobenzidine N/A 8270C N/A 1 mg/kg 2,4-Dichlorophenol N/A 8270C N/A 1 mg/kg Diethyl Phthalate N/A 8270C N/A 1 mg/kg 2,4-Dimethylphenol N/A 8270C N/A 1 mg/kg Dimethyl Phthalate N/A 8270C N/A 1 mg/kg 4,6- Dinitro-2-methylphenol N/A 8270C N/A 1 mg/kg 2,4-Dinitrophenol N/A 8270C N/A 1 mg/kg 2,4- Dinitrotoluene N/A 8270C N/A 1 mg/kg 2,6-Dinitrotoluene N/A 8270C N/A 1 mg/kg Di-n-octyl phthtalate NIA 8270C N/A 1 mg/kg Fluoranthene N/A 8270C N/A 1 mg/kg Fluorene N/A 8270C N/A 1 mg/kg Hexachlorobenzene N/A 8270C N/A 1 mg/kg Hexachlorobutadiene N/A 8270C N/A 1 mg/kg Hexachlorocyclopentadiene N/A 8270C N/A 1 mg/kg Hexachloroethane N/A 8270C N/A 1 mg/kg lndeno( 1 ,2,3-cd)pyrene N/A 8270C N/A 1 mg/kg lsophorone N/A 8270C N/A 1 mg/kg 2- Methylnapthalene N/A 8270C N/A 1 mg/kg Napthalene N/A 8270C N/A 1 mg/kg 2-Nitroaniline N/A 8270C N/A 1 mg/kg 3-Nitroaniline N/A 8270C N/A 1 mg/kg 4-Nitroaniline N/A 8270C N/A 1 mg/kg Nitrobenzene N/A 8270C N/A 1 mg/kg 2-Nitrophenol N/A 8270C N/A 1 mg/kg

I I I I I I I I I I I I I I I I I I I
Table 3-3
Analytical/Methods, Parameters, and Project Quantitation Limits
Analytical Methods* Project Quantitation Levels"
Parameters Water Soil/Solid Water Soil 4-Nitrophenol N/A 8270C NIA 1 mg/kg n-N itrosodiphen ylamine N/A 8270C N/A 1 mg/kg n-Nitrosodipropylamine NIA 8270C N/A 1 mg/kg 2-2'-0xybis(l- N/A 8270C N/A 1 mg/kg chloropropane) Pentachlorophenol N/A 8270C N/A 1 mg/kg Phenanthrene N/A 8270C NIA 1 mg/kg Phenol N/A 8270C N/A 1 mg/kg Pyrene N/A 8270C N/A I mg/kg 1,2,4-Trichlorobenzene N/A 8270C N/A 1 mg/kg 2,4,5-Trichlorophenol N/A 8270C N/A 1 mg/kg 2,4,6-Tric hlorophenol N/A 8270C N/A 1 mg/kg
TCL Pesticides/PCBs
Aldrin N/A 8081A N/A 0.01 mg/kg
alpha-BHC N/A 8081A N/A 1 mg/kg
beta-BHC N/A 8081A N/A 0.1 mg/kg
ganuna-BHC (Lindane) N/A 8081A N/A 1 mg/kg
delta-BHC N/A 8081A N/A 1 mg/kg
alpha -Chlordane N/A 8081A N/A 1 mg/kg
ganuna-Chlordane N/A 8081A N/A 1 mg/kg
4,4'-DDT N/A 8081A N/A 1 mg/kg
4,4'-DDE N/A 8081A N/A 1 mg/kg
4-4'-DDD N/A 8081A N/A 1 mg/kg
Dieldrin N/A 8081A N/A 0.01 mg/kg
Endosul fan I N/A 8081A N/A 0.01 mg/kg
Endosulfan II N/A 8081A N/A 0.01 mg/kg
Endosulfan Sulfate N/A 8081A N/A 0.01 mg/kg
Endrin N/A 8081A N/A 0.01 mg/kg
Endrin Aldehyde N/A 8081A N/A 1 mg/kg
Endrin Ketone N/A 8081A N/A 0.1 mg/kg
Heptachlor N/A 8081A N/A 0.1 mg/kg
Heptachlor Epoxide N/A 8081A N/A 0.1 mg/kg
Methoxychlor N/A 8081A N/A 1 mg/kg
Aroclor 1016 N/A 8082 NIA 1 mg/kg
Aroclor 1221 N/A 8082 N/A 1 mg/kg
Aroclor 1232 N/A 8082 N/A 1 mg/kg
Aroclor 1242 N/A 8082 N/A 1 mg/kg
Aroclor 1248 N/A 8082 N/A 1 mg/kg
Aroclor 1254 N/A 8082 N/A 1 mg/kg

I I I I I I I I I I I I I I I I I I I
Table 3-3 Analytical/Methods, Parameters, and Project Quantitation Limits
Analytical Methods* Project Quantitation Levels"
Parameters Water Soil/Solid Water Soil
Aroclor 1260 N/A 8082 NIA 1 mg/kg
Toxaphene N/A 8081A N/A 1 mg/kg Radiochemical Parameters
Radiochemical Radiochemical !so-Uranium 234, 235, 238 Separation/ Alpha Separation/ Alpha 1pCi/L 1 pCi/g
Spectrometry' Spectrometry' Radiochemical Radiochemical
!so-Thorium 228, 230, 232 Separation/ Alpha Separation/ Alpha 1 pCi/L 1 pCi/g Spectrometry' Spectrometry'
Radiochemical
EPA 903.1 Rn Separation/Rn
Emanation Emanation 0.5 pCi/L 0.5 pCilg Radium 226
Method' Method' or Gamma
Spectrometry'
EPA 904.0 Radiochemical Radium 228 Method or Separation/Beta 1 pCi/L 1 pCi/g
equivalent' Count'
EPA 900.0 Gas Proportional
Gross Alpha and Gross Beta method or or Liquid 1 pCi/L 1 pCilg equivalent'
Scintillation Counting'
Gamma Spectroscopy Gamma Gamma 1 pCi/L
(Isotope identification) Spectrometry' Spectrometry' (Not including l pCi/g
(Including Am-241) Am-241)
Liquid Liquid Total Activity Scintillation!"'T c Scintillationi"'T c 10 pCi/L 10 pCi/g
Calibration' Calibration'
Total Uranium KPA or Fluorometry
N/A 10 l'g/L N/A
I I I I I I I I I I I I I I I I I I I
Table 3-3 Analytical/Methods, Parameters, and Project Quantitation Limits
'These are expected quantitation limits based on reagent-grade water or a purified solid matrix. Actual quantitation limilS may be higher depending upon the narure of the sample marrix. The limit reported on final laboratory reports will take into account the actual sample volume or \Veight, percent solids (where applicable), and the dilution factor, if any. The quantitation limits for additional analytes to this list may vary, depending upon the results of laboratory srudies. All solids will be reported on a dr;-weight basis, with the associated sample percent moisture reported separately.
~aboratory-specitic procedures, shall be conducted in accordance with the specified EPA-600/4-80-032 Prescribed Procedures for Meamremem of Radioacriviry in Drinking Water, August 1980; EPA SW -846 Test Aferhods for Evaluating Solid Waste Physical/Chemical Methods, December 1987; EPA 520f5-8...t.-006 Easrem Environmental Radiarion Faciliry Radiochemisft)' Procedures Manual, August 1984; E'vfL HASL-300 Environmental Measurements Laboratory Procedure
Manual. 26th or 27th editions; LA-10300-M Heatrh and Environmenraf Chemistry: Analytical Techniques. Data Management, and Qualiry Assurance, October 1996; ISBN-157477-021-7 DOE Methods for Eva!uaring Environmental and Waste tV!anagemenr Samples - 1997 edition; any appropriate ASTM methods; or any additional project-approved methods.
* SW -846 Methods unless otherwise specified

-------------------Table 4-1 a
Sample Numbers and Types- Surface/Subsurface Soil and Sediment TOTAL
Parameters Field Field Site Source Samples Duplicate Water
Samples Radiochemical -
702 70 2 various (soil)
Radiochemical - various 3 I 0
(sediment)
TAL Metals-70 7 2
various
TCL Volatiles -70 7 2
8260B
TCL SemiVolatiles-70 7 2
8270C
TCL Pesticides/ PCBs -70 7 2
8080
Other Waste 2 N/A N/A
Characteristics"
Physical Testing' ASTM 10 I N/A
uOther waste characteristics will be delineated in an activity-spccitic Sampling and Analysis Plan ~Auerburg limits, Grain Size, Moisture Contcnt.
Additional QA samples for analysis by USACE QA Laboratory to be designated by USACE
Sampler Trip Rinsates Blanks
5 0
I 0
5 0
5 28
5 0
5 0
N/A I
N/A N/A
Total A&E Samples
779
5
84
112
84
84
3
II

-------------------Table 4-lb
Sample Numbers and Types- Surface/Subsurface Soil and Sediment LANDFILL OPERABLE UNIT
Parameters Field Field Site Source Samples Duplicate Water
Samples Radiochemical -
441 44 I various (soil)
Radiochemical - various 3 I 0
(sediment)
TAL Metals-44 4 I
vanous
TCL Volatiles -44 4 I
8260B
TCL SemiVolatiles-44 4 I
8270C
TCL Pesticides/ PCBs -44 4 I
8080
Other Waste I N/A N/A
Characteristics"
"Other waste characteristics will be delineated in an activity-specitlc Sampling and Analysis Plan Additional QA samples for <malysis by USACE QA Laboratory to be designated by USACE
Physical testing listed on Table 4-2.
Sampler Trip Rinsates Blanks
3 0
I 0
3 0
3 18
3 0
3 0
N/A I
Total A&E Samples
489
5
52
70
52
52
2

-------------------Table 4-Ic
Sample Numbers and Types- Surface/Subsurface Soil and Sediment MUDFLATS OPERABLE UNIT
Parameters Field Field Site Source Samples Duplicate Water
Samples Radiochemical -
261 26 I various (soil)
TAL Metals-various
26 3 I
TCL Volatiles -26 3 I
8260B
TCL SemiVolatiles-26 3 I
8270C
TCL Pesticides/ PCBs -26 3 I
8080
Other Waste 1 N/A N/A
Characteristics'
aOther waste characteristics will be delineated in an activity-specific Sampling and Analysis Plan Additional QA samples for analysis by USACE QA Laboratory to be designated by USACE
Sampler Trip Rinsates Blanks
2 0
2 0
2 10
2 0
2 0
N/A 0
Total A&E Samples
290
--
32
42
32
32
I

-------------------Table 4-2
Sample Numbers and Types- Groundwater and Surface Water /Geotech
Parameters Field Field Site Sampler Samples Duplicate Source Rinsates
Samples Water
Radiochemical various 16* 2 I I
(Total)
Radiochemical various 16* 2 I 0 (Dissolved)**
Other Waste I N/A N/A N/A Characteristics '
Soil - Physical Testing 10 I N/A N/A ASTM'
"Other waste characteristics will be delineated in an activity-specific Sampling and Analysis Plan Additional QA samples for analysis by USACE QA Laboratory to be designated by USACE ~>Auerburg limits, Grain Size, Moisturt: Content.
*13 groundwater, 3 surface water **0.45 mm field filters
Trip Blanks
0
0
I
N/A
Total A&E
Samples 20
19
2
II

I I I I I I I I I I I I I I I I I I I
Analyte Group
TCL Volatiles
TCL Semi volatiles
TCL Pesticides/PCBs
TAL Metals - Total
Radionuclides
Geotechnical Parameters
Radiochemical Parameters -Total
Radiochemical Parameters -
Dissolved
Total Alpha
Dissolved Alpha
Table 4-3. Container Requirements for Samples
Container Minimum Preservative Holding Time Sample
Size
Surface/Subsurface Soil/Sediment
2-40 mL VOA Sg MeOH (VOCs > 30 d
or 200 l'g/kg)
Encore Sampler Sodium Bisulfide
30 d (VOCs < 200
l'g/kg)
or None, 4'C (if use 48 h (extract) Encore)
1 - 4 oz wide mouth 100 g Cool, 4'C 40d glass jar with Teflon
lined cap
1 - 8 oz glass jar with 90g Cool,4'C 14 d (extraction) Teflon-lined cap 40 d (analysis)
I - 4oz wide mouth 20 g Cool, 4'C 180 d, plastic or glass jar Hg at 28 d
1 - 16 oz witle mouth 200 g Cool,4'C 180 d (isotope glass jar with Teflon- dependant)
lined cap
1 - 16 oz witle mouth 500 g None N/A glass jar with Teflon
lined cap
Groundwater/Surface Water
1 - 1 gal polybottle 1000 mL HNO, to pH <2 180 d (isotope (unfiltered) Cool,4'C dependant)
1 - 1 gal polybottle (0.45 lOOOmL HNOJ to pH <2 180 d (isotope I'm filter) Cool,4'C dependant)
4- 1 L glass (untiltered) 1 gallon HNOJ. 4'C 180 d
4 - I L glass (0 .45 I'm I gallon HNOJ. 4°C 180 d filter)

I I I I I I I I I I I I I I I I I I I
Table 4-4 Sample Numbering Scheme for the Town of Tonawanda Landfill
Sample Identification: XXX-AAAAmmNNNNnnz
XXX = Site Designator
AAAA = Project Designator
mm = Sample Media
NNNN = Sample Number
nnn = Sample Interval
z = Sample Type
Site designators used for the project will be as follows: Town of Tonawanda Landfill= TLF Town of Tonawanda Mudflats = TMF
The Project Designator used for this project will be TLSCTonawanda Land till Site Characterization Examples Soil Sample = SS Groundwater Sample = GW
The Field Manager will maintain a listing of four digit station identifiers and correlate them to specific sampling/station locations. Numbers from 0 to 8999 indicate regular samples. Numbers from 9001 to 9999 indicate duplicates.
Examples 005 = 0 to 0.5 foot sample interval (surface sample) 010 = 0. 5 to 1 foot sample interval 040 = 3.5 to 4 foot sample interval 075 = 7 to 7.5 foot sample interval !00 = 9. 5 to 10 foot sample interval
For groundwater samples, the interval shall be specified as "000".
Examples 0 = Regular 1 = Duplicate 2 = Split 3 = Trip Blank 4 = Equipment Rinsate S = Site Source Water Blank

I Table 5-l. Example of a Cooler Receipt Checklist
I COOLER RECEIPT CHECKLIST LIMS number Chain-of-Custody No. ---------
Project: Date received: _____________ _
A. Prelimin;~IY Examination Phase Date cooler(s) opened: _____________ _ I by (print)> ______________ (signature) ______________ _
I Circle response below as appropriate
I. Did coo!er(s) come with a shipping slip (airbill, etc.)? ................................................. . Yes No NA
I If YES, enter courier name & airbill number here: ----------------------
2. Were custody seals on outside of coo\er(s)? .................................................... . Yes No NA
How many & where:. ______ Seal date: _______ Seal name:. ___________ _
I 3. Were custody seals unbroken and intact at the date and time of arrival? .............. Yes No NA
4. Did you screen samples for radioactivity using a Geiger Counter? ................................ Yes No NA
I 5. Were custody papers sealed in a plastic bag & taped inside the cooler !id? .................... Yes No NA
6. Were custody papers filled out properly (ink, signed, etc.)? .......................................... Yes No NA
I 7. Did you sign custody papers in the appropriate place for acceptance of custody? .. ....... Yes No NA
8. Was project identifiable from custody papers? ............................................................... Yes No NA
9. If required, was enough ice present in the cooler(s)? ................................................. Yes No NA I identify type of ice used in cooler and temperanJre reading upon receipt:---------------
I Source of temperature reading {check one): Temperature Vial ( Sample Material ( )
10. Initial a11d date this form to acknowledge receipt ofcooler(s): (initia!), _____ (date), ______ _
Date samples were logged in: ----------
by (print)/ ______________ (signature)l ______________ _ I I 12. Were all bottles sealed in separate plastic bags?.. .............................................. ..
11. Describe type of packing in cooler(s): ---~---------------------
Yes No NA
I 13. Did all bottles arrive unbroken & were labels in good condition? ....................... .
14. Was all required bottle label information complete? ..................................................... ..
Yes No NA
Yes No NA
15. Did all bottle labels agree with custody papers? ............................................................. . Yes No NA
I 16. Were correct containers used for the analyses indicated: ............................................... .. Yes No NA
17. Were correct preservatives placed into the sample containers? ..................................... .. Yes No NA
I 18. Was a sufficient amount of sample sent for the analyses required? ............................... .. Yes No NA
19. Were bubbles absent in VOA vials? .............................................................................. . Yes No NA
I If no, list by sample number:---~--~-------~------------
20. Has a copy of this Cooler Receipt Checklist been faxed to the SAIC Laboratory Coordinator? ................................................................................................................... .
I Yes No NA
I I
I I I I I I I I I I I I I I I I I I I
Table ll-1 Summary of Analytical Hard-Copy Data Deliverables
Method Requirements
Requirements for aU methods: - Holding time information and methods requested - Discussion of laboratory analysis, including any laboratorv oroblems
Wet Clzemistry - Sample results - Matrix spike recovery - Matrix spike duplicate or duplicate - Method blank - Initial calibration - Continuing calibration check - LCS - Run loa
lladioclzemical AJZa/ysis - Sample results - Initial calibration - Efficiency check - Background determinations - Spike recover results - Internal standard results (tracers or carriers) - Duplicate results - Self-absorption factor (a.~)
- Cross-talk factor (a.~) - LCS
- Run log
CLP GFAA LCS RPD RSD
comract laboratory program graphite furnace atomic absorption laboratory control sample relative percent difference relative standard devimion
Deliverables
Signed chain-of-custody forms Case narratives
Report result %Recovery
%Recovery and % RPD Report results Calibration curve and correlation coefficient Recovery and % difference LCS result and control criteria Copy of run loa
Report results Efficiency determination %Difference from calibration Report results Report results Report results Spike added and %Recovery Standard added and %Recovery Report results and % RPD Report factors Report factors and control criteria LCS results and control criteria Copy of run log

I I I I I I I I I I I I I I I I I I I
Table 11-2 Standard Electronic Data Deliverables
Column Position Length Field Description
Header Record J,2Q 20 SAIC Project Number
2U8 8 Data Submission Date (M:Vf/DD/YY)
29-33 6 Number of Records (Rows) in the f!le including header and terminating records
34-74 40 Submitting Laboratory Name
Detail Record l-20 20 SAIC Sample Identification Number
21-28 8 Date of Sample Collection (MM/DD/YY)
29-33 5 Time of Sample Collection (HH:MM military format)
34-48 15 Laboratory Analytical Batch/Sample Delivery Group (SDG) Number
49-56 8 Sample Matrix
57-76 20 Laboratory Sample Identification Number
77-84 8 Sample ExtractiowPreparation Date (MM/DD/YY)
85-92 8 Sample Analysis Date (MM/DD/YY)
93-97 5 Sample Analysis Time (HH:MM military fonnat)
98-100 3 Analysis/Result Type -This field is used to designate the type of analysis performed. Valid values are as follows:
REG = Regular Sample Analysis DUP == Laborarory Duplicate Analysis DIL = Secondary Dilution Analysis REn = Re-analysis where "n" is a sequential number
lOl-112 12 Chemical Abstract Services (CAS) Number
113-142 30 Analysis Name
143-157 15 Analysis Method (Method numbers shall be the EPA, SW-846, NIOSH, etc. method number)
158-167 lO Result (Report detection limit if not detected)
168-177 lO Radiological Counting Error
178-182 5 Result Qualifier (U, J, etc.)
183-190 8 Unit of measure
191-200 10 Instrument Detection Limit
201-205 5 Percem Solids (Report "0" for water matrices)
206-300 5 Sample Weight/Volume
301-302 2 Sample Weight/Volume Units
303-307 5 Dilution
Termination Record l-3 3 $$$
Electronic deliverables must have file structure defined in this table. The deliverable file may be either an ASCII
text tile, a dBASE compatible file (.DBF file extension), or an Excel spread sheet file (.XLS file extension). All fields must be presented. Fields that are not applicable for the reported method shall be reported as blank. Data shall be provided on a CD-ROM in a searchable PDF format.

I I I I I I I I I I I I I I I I I I I
APPENDIX A
DATA MANAGEMENT PLAN

I I I I I I I I I I I I I I I I I I I
A.l.O INTRODUCTION
This appendix to the Town of Tonawanda Landfill Quality Assurance Project Plan (QAPP) represents
the Data Management Plan (DMP) for project activities to be performed by Science Applications
International Corporation (SAIC) for the Town of Tonawanda Landfill. This plan describes the data
management process to be implemented for this project. The DMP presents the process used for the
planning, collection, tracking, verification, validation, analysis, presentation, and storage of data. The
plan identifies required data documentation materials and procedures, as well as project file
requirements. The plan also provides the reporting requirements for presenting the raw data and
conclusions of the investigation.
The characterization activities planned for these sites will produce a large amount of information. The
information collected is critical for several reasons. Because the proposed work plan is a dynamic work
plan, information collected during the course of the site characterization will influence the cmtr.>e of the
characterization work. All data will be maintained in electronic files. The information collected will
provide the foundation for determining the nature and extent of contamination at the site, for assessing
the risks associated with potential contaminants of concern at the site, and for evaluating potential
remedial actions. This section describes the data acquisition, management, and analysis requirements for
the site investigation efforts.
Project activities will generate data, including sample locations, measurements of field parameters, and
results of sample analyses and data reviews. Important records regarding the collection and analysis of
the samples and data will also be generated. The data management process requires the proper flow of
data from field collection and processing by the analytical laboratory to those involved in the project
evaluation and decision making. This Dtv!P will ensure the validity and accessibility of data to support
environmental data analysis and the evaluation of corrective measures.
A.2.0 INVESTIGATION DATA
A.2.1 DATA TYPES
Data acquisition activities associated with site characterizations fall into ten broad categories:
I. Existing historical information, including photographs and the results from any previous
characterization activities at the site.
2. Mapping data (including survey data from surveying crews).
3. Gradation walkover data.
4. Discrete sample results.
A-l 611/01

I I I I I I I I I I I I I I I I I I I
5. Organic screening data.
6. Secondary borehole information.
7. Gamma exposure measurement data.
8. Critical project records.
A.2.1.1 Historical Information
Significant histmical information exists for this site. This information is included in reports documenting
past investigations and discrete soil analytical results. Most of the analytical results exist in electronic
format. SAIC has reviewed the historical data reports.
A.2.1.2 Mapping Data
Mapping data will he collected during the course of the program. These data will he input into the
geographical database along with previously created mapping data. The primary issue associated with
mapping data is the issue of ensuring that the various data sets that include spatial location information are consistent relative to each other.
The base coordinate system for the characterization work is NY State Plane. All data produced by this
characterization effort will be delivered in NY State Plane. Elevation data (e.g., ground surface
elevations) will be in feet above mean sea leveL Depth data (e.g., depth to water table measurements, or
depth to samples) will be in feet below a known elevation reference point.
Survey monuments will be established at key locations across the site to facilitate the establishment of
local grids and the implementation of spatial accuracy quality assurance/quality control (QNQC) techniques. These monuments may be based on established site features (i.e., building comers, large
rocks, trees, etc.) or may be introduced. All monuments will be appropriately marked in the field so that
they are readily identifiable, will be tagged with their name and NY State Plane location, and will have
their positions in NY State Plane recorded electronically. The subcontractor responsible for the civil
survey will provide the project with a hard-copy report and an electronic copy of the civil survey.
In certain instances (i.e., nonintrusive geophysical surveys and gamma walkover surveys), it may be
advantageous to work with local coordinate systems. In the event that local coordinate systems are
used, these local coordinate systems will be tied to at least three established monuments and the fmal
data deliverables will be transformed into the ]'o.'Y State Plane requirement.
The base level of accuracy for all mapping work at the site is O.l ft for horizontal coordinates and O.l ft for general ve11ical measurements. If methodologies are used to determine locations that cannot
guarantee a locational error of less than O.l ft horizontally or 0.1 ft vertically, these data will be
r:'. fusrap\lon~wm f,plans\qappd ·:!:! -0 I \q~pptlo.tloc A-2 6/J/01

I I I I I I I I I I I I I I I I I I I
recorded by field staff at the time of probe completion. These data typically arc hand entered in field
notebooks during the completion of the probe.
These field notebooks will be maintained in a logical and reasonable manner. All data collected in the
field log books (i.e., screening results, depth-to-water table data, soils information, etc.) will be entered
directly into an appropriate FEllviS table. These data will be used for archiving and dissemination
purposes.
A.2.1.5 Gamma Exposure Measurement Data
Limited gamma exposure measurement data will be collected from locations identified in the site SAP
Addendum prior to the commencement of intrusive field sampling activities. The results from these data
will be entered into the appropriate FEI.MS data table and made available to the investigating team.
Maps indicating the locations where the measurements were taken will also be provided. Locations will
be provided in NY State Plane.
A.2.1.6 Critical Project Records
Critical project records such as survey reports, COC forms, laboratory data packages, and validation
results will be maintained in accordance with Section A4.8.
A.2.2 KEY IDENTIFIERS
The key identifiers for project sampling data will be the sample location/station and a unique sample identification number. All samples will be assigned an area and station to identify the specific pcint
where the field measurements or samples were collected. Descriptions, geographic coordinates, and elevations will be obtained for these sampling stations.
Unique sample numbers are derived from the location, sampling station within the location, sample
medium, and sample type, plus a sequential number. Field duplicates represent a separate sample type,
and distinct depths receive different sequential numbers so no duplication of sample numbers will occur. The sample identification will appear on the sample collection log sheet, sample label, COC form, and
on any correspondence related to the sample. Additional information regarding sample identification is presented in the SAP.
Measurements not associated with physical samples (walkover surveys) will be identified by the
coordinates of the measurement location NY State Plane and the date and time of measurement.
A.3.0 DATA MAL'IAGEMENT SYSTEM
The data management system facilitates the information flow by providing a means of tracking,
organizing, reporting, and archiving data and information. The system has four primary compcnents:
r:1 fusrap,lo na wm ~;plans\qappiJ-22 .Q I \qappti n.doc A-4 6/l/01

I I I I I I I I I I I I I I I I I I I
(1)
(2)
(3)
(4)
A multi-disciplinary team of data management professionals.
A process model that integrates activities relevant to ensuring that data are complete,
consistent, and fully qualified, and minimizes the uncertainties associated with the data,
data products, or interpretations of results.
Guidance provided in the SAIC Quality Assurance Technical Procedures Volume I: Data Management.
A standardized database structure to support the collection, management, analysis, and
presentation of site characterization data.
To facilitate management of the data collected a table, such as Table A-1, which identifies each data
type, data source, location, and responsible person, should be completed.
Table A-1. Data Matrix
Data Type Data Source Location Responsibility~
"Person managing the Fonncr!y Utilized Sites Remedial Action Program data set.
A.4.0 DATA MAL','AGEMENT AND TRACKING PROCESS
To meet the regulatory requirements for the acquisition of technically sound and legally admissible data,
a traceable audit trail will be established from the development of the project work plan through the
archiving of infonmation and data. Each step or variation of the sampling and analytical process will be
documented. Standardized formats for electronic transfer and reporting will be used. To meet this
requirement, the following data management process will be tollowed throughout the collection,
management, storage, analysis, and presentation of the site environmental data.
r:\fu:.r~p\tonJwm f,plan>lqapp\3-2:!-0 I \q;~ppfi n.doc A-5 6/l/0 l

I I I I I I I I I I I I I I I I I I I
A.4.1 SAMPLING AND ANALYSIS PLANNING
Plans for the collection of field and laboratory quality control samples arc detailed in the FSP and
QAPP. These plans together specifY all applicable sampling and analytical data that will be entered into
the database.
The interface with the analytical laboratory is crucial for achieving the goal of generating technically
sound data. Based upon the laboratory data quality objectives presented in the QAPP, the laboratory
statement of work details analytical methods, validation criteria, deliverables, and deliverable formats
required of the analytical laboratory. The analytical laboratories that have been contracted for chemical
and radiological testing arc identified in the QAPP.
Prior to initiating field work, an activity-specific project database will be populated with sample locations, sample numbers, analytical parameters and detection limits, and associated sampling and
laboratory information based on the requirements of the SAP. A report of all planned samples will be
generated tor review by the SAIC Field Operations Manager (FOM). After approval of this report, the
data coordinator will generate field sampling forms including preprinted sample information, bind and
number the logbooks, and print and organize the required sample labels. This process will increase the
accuracy of the final database and minimize the amount of information samplers must record in the field.
A.4.2 FIELD SANIPLE COLLECTION Al'!D MEASUREMENT
Prior to beginning field sampling, field personnel will be trained as necessary and participate in a
project-specific readiness review. These activities ensure that standard procedures will be followed in
sample collection and in completing field logbooks, COC forms, labels, and custody seals.
Documentation of training and readiness is submitted to the project file.
The master field investigation document will be site field logbooks. The primary purpose of these
documents is to record each day's field activities; personnel on each sampling team; and any
administrative occurrences, conditions, or activities that may have affected the field work or data quality
of any environmental samples for any given day.
Each field sampling team will have a field logbook in which it will record data collected in the field. To
the extent possible, preprinted field logbook sheets will be generated from the data management system.
If preprinted logbook sheets are not used lor a given sample, required information will be recorded
manually. As samples are collected in the field, the field sampling team members will complete the
logbooks with sample collection data and required field measurements as specified in the SAP and
QAPP. Standardized reporting formats will be used to document this information.
The field logbooks will be signed and dated by the data recorder and will specifY whether field methods
and procedures were followed. Entries will be verified by a sampling team member other than the
r:l fllsrnp,ton~wm t:pl ~ns\qapp\)·2 2 .Q I lqapptin.doc A-6 6/1101

I I I I I I I I I I I I I I I I I I I
recorder, or by the SAIC FOM, who will per!om1 a quality assurance (QA) review and sign and date
the logbook to document the review.
Backup photocopies of the field logbooks will be made and submitted to the project tile. Sample
collection and measurement infmmation from the logbooks and data forms will be manually entered into
the database and checked for accuracy. Ent1ics will be verified by using double entry and comparing
protocols. As necessary, the actual forms used will be modified to include the appropriate intormation
codes to facilitate data entry. Completed logbooks and appropriate field forms will be submitted to the
project file upon completion of the project.
At any point in the process of sample collection or data or document review, a Nonconformance
Report (NCR) may be initiated if nonconformances are identified, and data entered into the database
may be flagged accordingly. Additional information regarding NCRs is presented in Section 10.0 of the QAPP and the SAP.
A.4.3 CHAIN-OF-CUSTODY DOCUMENTATION
Sample containers will be tracked from field collection activities to the analytical laboratory following proper COC protocols and using standardized COC forms.
When the samples are received at the laboratory, the laboratory receiving staff will check and document
the condition of the samples upon arrival, check that the sample identification numbers on containers and
COC forms match, and assign laboratory sample identification numbers traceable back to the field
identification numbers. Within 24 hours of receipt of the sample containers, the laboratory will send a
letter of receipt (LOR) to the SAIC Laboratory Coordinator or his designee. This letter will provide the following information:
• sample receipt date, • problems noted at the time of receipt,
• list of sample identification numbers and corresponding laboratory identification numbers for all
samples received,
• analyses requested for each sample received, and
• completed cooler receipt checklists for each cooler received.
The LOR will be accompanied by the completed and signed COCs for the samples, and both
documents will be submitted to the project file. Sample information recorded on the COC form and in
the LOR will be entered into the sample tracking database. This database will allow for tracking of the
status of samples from the time of collection through analysis and validation. The database tracking
program will produce reports that will inform the project team of potential delays or problems related to
sample analysis and validation.
r:\ fusr~p'. tonawm f.plans\qapp' 3-2 2 ·0 I ',qapp(tn.doc A-7 6/1/01

I I I I I I I I I I I I I I I I I I I
A.4.4 ANALYTICAL LABORATORY DOCUMENT AND DATA SUBMISSION
Prior to release of a data package, the Laboratory Project Manager will review the data package for
precision, accuracy, and completeness and will attest that it meets all data analysis and reporting requirements for the specific method used. The Laboratory Project Manager will then sign the hard copy forms certifying that the data package and any electronic fom1at delivcrables were reviewed and arc approved for release.
Analytical results will be submitted to the SAIC Laboratory Coordinator, or designee, on standardized forms in data packages in accordance with the scope of work for analytical services. These forms will
contain results and required QA/QC information applicable to the analytical laboratory method used for analysis. In addition, as required by the scope of work, results of analyses will also be provided in electronic format on diskettes. The data coordinator receiving laboratory deliverables will make a copy of each data package and/or diskette and submit the originals to the project file. Results will be transferred to the database either electronically by diskette or manually from the hard copy into appropriate data tables within the database.
A.4.5 DATA VERIFICATION AND VALIDATION
All data packages received from the analytical laboratory will be reviewed, veri!led, and validated by
SAIC data management personnel. Details regarding the data verification and validation processes are presented in SAIC validation procedures.
With regard to data reduction, any replicate measurements associated with a single sample will be averaged prior to further data reduction. Correction of extreme (outlier) values will be attempted if the cause tor the outlier value can be documented. This type of data will be corrected if the outliers are caused by incorrect transcription and the correct values can be obtained and documented from valid records. If the values can be docmnented as resulting from a catastrophic event or a problem in methodology, the values will be appropriately qualified. Docmnentation and validation of the cause of outliers will accompany any attempt to correct or delete these data values. Outlier values will not be omitted from tl1e raw data reported to the USACE District, and valid values will be included in data smnmary tables. Analytical values determined to be at or below the detection limit will be reported
numerically (e.g., <J= 0.1 mg!L). The data presentation procedures will cite analytical methods used including appropriate detection limits.
A.4.6 DATA CENTRALIZATION Al'<D STORAGE
Once the data lor a given sample or group of samples are complete and entered into the database, the data coordinator will check that logbooks, other field records, and all analytical data are complete and properly stored, including both the electronic form and associated data packages. Each piece of information will be documented as to its source, and hard-copy information will be appropriately indexed and filed.
n fusro.pi!O no. wrn fplo.ns,qJppd -?.?.-0 I ··.qapptin.doc A-8 611/01

I I I I I I I I I I I I I I I I I I I
Procedure-based routines for establishing data security, backup, archival, and maintaining proper
database changes arc also used to maintain database integrity. Classes of users will be defmed with
access levels approved and controlled by the SAIC Data Manager. Once loaded, the database will be
secured from physical com1ption (i.e., hardware or software failure) or from unauthorized access and
illegal updating. Physical security requires recovery procedures, time-stamping, and other related
standard operating processes and controls. Any changes made to the completed database will be
documented on standardized forms which will be placed into the project file.
A.4.7 DATA SUMMARIZATION Al~D REPORTING
When field sampling has been completed and the analytical data have been received, validated, and
transferred into the project database, the project report and Quality Control Summary Report (QCSR)
will be generated. Information regarding the format and content for QCSRs is presented in Section 14.0
of the QAPP.
Project data will be screened for potential data errors, compared to activity-specific background values
and applicable regulatory limits, summarized in both tabular and graphical form to facilitate data
interpretation. Data reduction and summation will be accomplished using quality-controlled and
documentable reporting programs. Data summaries will be generally produced using predefmed report
formats available within the data management system. Statistical summaries will be generated by
transferring data to an SAS dataset and adapting exiting data analysis programs to include project
specific aggregation or screening criteria. Any new programs developed under this project will be
tested, reviewed, and documented as error-free following SAIC QA technical procedures. Data
presented on maps, figures, or tables will be transferred electronically as far as possible to avoid
introducing typographical errors.
A.4.8 RECORDS MANAGEMENT Al~D DOCUMENT CONTROL
Hard copies of all original site and field logbooks, COC forms, data packages with analytical results and
associated QA/QC information, data verification and validation forms, and other project-related
information will be indexed, catalogued into appropriate file groups and series, and archived. Permanent
record copies will be submitted to the SAIC Central Records Facility, in accordance with SAIC
procedure QAAP 17-l, "Records Management," when complete.
The SAIC Data Manager will archive the project data to the appropriate electronic media. A data
archive information package will be prepared that describes the data system, file format, and method of
archival. Sufficient documentation will accompany the archived data to fully describe the source,
contents, and structure of the data to ensure future usability. Computer programs used to manipulate or
report the archived data will also be included in the data archive information package to further enhance
the data's future usability.
r:\ f<.tsr~p,tona wm f.plans\<.ppp\3 -2 ~ -0 I \qappfin.doc A-9 6/l/0 l

I I I I I I I I APPENDIXB
I I RADIOLOGICAL DATA
I VALIDATION GUIDELINES
I I I I I I I I

I I I I I I I I I I I I I I I I I I I
Laboratory Data Validation Guidelines For Evaluating Radionuclide Analyses
DRAFT DRAFT DRAFT DRAFT DRAFT DRAFT DR.c"'-FT DRAFT
Prepared by:
, Ph.D. and , Jr.
of
Science Applications International Corporation (SA! C) An Employee-Owned Company 301 Laboratory Road P.O. Box 2501
Oak Ridge, TN 37830
DRAFT DRAFT DRAFT DR.c"'-FT DRAFT DRAFT DRAFT DRAFT
Revision 06 June 2000
SAIC Document :--lllinber: 143-ARCS-00.08

I I I I I I I I I I I I I I I I I I I
TABLE OF CONTENTS
Page INTRODUCTION .. . . . . . . . . . . . . . . . . . . . . . . . . . . . l
PRELIMINARY REVIEW ... .2
RADIONUCLIDE PROCEDURE .. -··· 3 L HOLDING TIMES .. ·················· ......... 4 II CALIBRATION .. . ............. 6 IlL BLANKS ... . ......................... ll IV SAMPLE SPECIFIC CHEMICAL RECOVERY..... . ................. 12 V LABORATORY CONTROL SAlviPLE.. . .......................... 14 VL MATRIX SPIKE SAMPLE A1'iAL YSIS . . .......................... 15 VII. DUPLICATE A!\IAL YSIS SAl\ifPLES .......................... 17 Vlll FIELD DUPLICATES ANALYSIS.. . ........................ 18 IX RADIONUCLIDE QUANTITATION AND IlvfPLlED DETECTION LIMITS. . .......... 19 X CHEMICAL SEPARATION SPECIFICITY (Alph<l Spectrometry) .. 22 XL TARGET RADIONUCLIDE LIST IDENTIFICATION (Gamma Spectroscopy).. . .. . . . . .... 24 XII TENTATIVELY IDENTIFIED RADIONUCLIDES (Gamma Spectroscopy).. . ......... 25 XliL SYSTEMS PERFORMANCE.. . ......................... 28
GLOSSARY A .. . .......................... 31
GLOSSARY B .. . ........................ 32
REFERENCES .. ··························· 35
APPENDIX I
NOTE: Data validation worksheets (Appendix: II) the data report forms from the laboratory (Appendix III) are not included in this copy of the procedure.
APPENDIX II
APPENDIX III
I I I I I I I I I I I I I I I I I I I
TABLE OF FORMS
FORM l: Radiometric Analysis Results
FORM 2: Blank Summary
FORM 3: Chemical Recovery
FO!Uvl 4: Laboratmy Control Sample
FORiY! 5: Matrix Spike Sample Recovery
FORM 6: Duplicates
FORJvl 7: Preparation Log
I I I I I I I I I I I I I I I I I I I
Science 1lpplicalions International Corporation (SA/C) 143-ARCS-00.01
DRAFT
INTRODUCTION 1
This document is desit,'llc:d to offer guidance in laboratory evaluation and validation of
raclioanalytical data. It is the intent of this document to provide data validation guidelines for radioanalytical data equivalent to those provided by the Environmental Protection Agency (EPA) under irs Contract Laboratory Protocol (CLP) guidance. Therefore, the format used is similar to that contained in reference :Z. In some aspects, it is equivalent to a standard operating procedure (SOP). In more subjective areas, only general guidance is offered due to the complexities and uniqueness of data relative to specitic samples.
Four tenns are used throughout this document: shall indicates a requirement for the data validator, must indicates a requirement for the data, should indicates a recommendation, and !D.'!Y indicates an acceptable practice (neither a requirement nor a recommendation).
Those areas where specific SOPs are possible are primarily areas in which definitive performance requirements are established. These requirements are concerned with specifications that are not sample dependent; they specifY performance requirements on matters that should be completely under a laboratory's controL These specific areas include blanks, calibration standards, calibration verification standards, laboratory control standards, and interference check standards. In particular, mistakes such as calculation and transcription errors must be rectified by submission of
corrected data sheets.
This document is intended to be used for teclmical review of radiological data. Some areas of overlap between technical review and contract compliance screening (CCS) exist; however, detennining contract compliance is not intended to be a goal of these guidelines. It is assumed that CCS is available and can be utilized to assist in the data review procedure.
At times, there may be an urgent need to use data that do not meet all contract requirements and technical criteria. Use of these data docs not constitute either a new requirement standard or full
acceptance of the data. Any decision to utilize data for which performance criteria have not been met is strictly to facilitate the progress of projects requiring the availability of the data. A laboratory submitting out-of-specification data may be required to rerun or resubmit data even if the previously submitted data have been utilized due to urgent program needs; data that do not meet specitied requirements are never fully acceptable. The only exception to this requirement is in the area of requirements for individual sample analysis; if the nature of the sample itselflimits the attainment of specifications, appropriate allowances should be made. The oveniding concern is to obl1in data that are technically valid and legally defensible.
I Largely adapted !Tom reference 2's introduction.
Cop.vrighr'O 1992 SA!C- :1!1 Right.\· Reserved Page 1 o/35

I I I I I I I I I I I I I I I I I I I
Science :lfJp!icutioi1S lnlernationul Corporation (S'.·IIL) /4LlRCS-OO.OI
DRAFT
All data reviews shall have a data validation nanative (Appendix I). If mandatory actions are required, they should be specifically noted on this sheet. In addition, this sheet is to be used to summarize overall deficiencies requiring attention, as well as general laboratory perfom1ance and any discemiblc trends in the quality of the data. ('[1lis sheet is not a replacement for the data
review.) Data validation worksheets (Appendix II) and a flagged copy of the data report forms from the laboratory (Appendix liT) shall accompany the nanative to clearly identify the problems associated with a case,
PRELIMINARY REVIEW'
In order to use this document effectively, the reviewer should have a general overview of the case at hand. The exact number of samples, their assigned numbers, and their matrix are essential infmmation. Background information on the site is helpful, but oflen tl1is information is very difficult to locate. The site project officer is the best source for answers or further direction.
CCS is a source of a large quantity of summarized information. It can be used to alert the reviewer of problems in the case or of what may be sample-specific problems. TI1is information may be utilized in data validation. If CCS is unavailable, tl1ose criteria affecting data validity shall be
addressed by the data reviewer.
Cases routinely have unique samples that require special attention by the reviewer. Field blanks, field duplicates, and performance audit samples need to be identified. The sampling records should provide at least the following information:
1. Project officer for site
2. Complete list of samples with notations on
a) sample matrix
b) blanks*
c) field duplicates*
d) field spikes*
2 Largely adapted !rom reference 2's preliminary review.
Copyright,:<:, 1992 S:IIC- All Rights Reserved Page 2 of35

I I I I I I I I I I I I I I I I I I I
Science Applicutivns {ntemutionul Corporation (S.-1/C) 1 43-.-IRCS-00. 0 I
DRAFT
c) quality control (QC) audit sample*
t) shipping dates
g) labs involved
* If applicable
1l1e chain-of-custody record includes sample descriptions and elate of sampling. Although the
sampling date is not addressed by contract requirements, the reviewer shall take into account lag
time between sampling and shipping while assessing sample holding times.
RADIONUCLIDE PROCEDURE
The requirements to be checked in validation arc listed below ("CCS" indicates that the contractual
requirements for these items will also be checked by CCS; CCS requirements arc not always the
same as the data review criteria).
l. Holding times (CCS - Lab holding times only)
2. Calibration
Initial and Continuing (CCS)
Routine Perforrnance Check (CCS)
3. Blanks (CCS)
4. Sample specific chemical recovery (CCS)
5. Laboratory control sample (CCS)
6. Matrix spike (CCS)
7. Field duplicates
8. Duplicate sample (CCS)
9. Radionuclide quantitation and implied detection limits
CopyrightCrJ 1992 SAIC- All Rights Reserved Page 3 of35
I I I I I I I I I I I I I I I I I I I
Science Applicutions lntemotionol Corpurotion (St!IC) J 43-ARCS-00.0 J
I.
DRAFT
10. Chemical separation specificity
ll. Target radionuclide list identification
12. Tentatively identified radionuclides
13. System performance (CCS)
14. Overall assessment of data for a case
HOLD lNG TIMES
A.
B.
Objective
The objective is to ascertain the validity of results based on the holding time of the sample from time of collection to time of analysis.
Note: The holding time is based on the date of collection (rather than verified time of sample receipt) and date of digestion/distillation. It is a technical evaluation rather than a contractual requirement
Criteria
The following technical requirements for sample holding times and preservation have only been established tor water matrices. Due to limited information concerning holding times for soil samples, it is left to the professional judgment of the data reviewer whether to apply water holding time criteria to soil samples.
Cop_vrighr:f) 1992 SA!C- All Rights Reserved Page 4 of35

I I I I I I I I I I I I I I I I I I I
Science ·fpplicutions fnlenwtionul Corpora/ion (5,/IC) 143-.·1RCS-OO.O!
c.
D.
DRAFT
l. Tritium solutions: 6 months, with no preservative and stored in glass.
2. Carbon-14: 6 months, cool to 4,= C and slightly basic with NaOH.
3. Iodine solutions: 6 months, with no preservatives.
4.
5.
6.
7.
Radon-222: 4 days, cool to 4l~C and stored in glass with teflon-lined septum.
Cesium: 6 months, when preserved to pH <2 in hydrochloric acid.
Plutonitun: 6 months, when preserved in 2M nitric acid.
Other radionuclides: 6 months, when preserved to pH <2 in nitric or hydrochloric acid.
Evaluation Procedure
Actual holding times are established by comparing the sampling date on the sample traffic report with the dates of analysis found in the laboratory raw data (digestion logs and instrument run logs). Examine the sample receiving logs or chain-ofcustody to determine if samples were preserved at the proper pH.
Analyte Holding Times (Days) = Analysis Date - Sampling Date
Action
l.
2.
3.
If criteria for holding times and preservation arc not met, qualifY all results as estimated (J).
lfholding times arc exceeded, the reviewer shall usc professional judgment to determine the reliability of the data and the effects of additional storage on the sample results. The expected bias would be low and the reviewer may determine that results less than the critical level (CL) are unusable (R).
Due to limited information concerning holding times for soil samples, it is left to the professional judgment of the data reviewer whether to apply water holding time criteria to soil samples. If the data are qualified when water
holding time criteria are applied to soil samples, it shall be clearly
CopvriglllD !992 S,lfC- All Rights Reserved Page 5 of35

I I I I I I I I I I I I I I I I I I I
Science :lpplicalions fnlenwliona/ Cmpof'ation (S,IIC) 143-ARCS-00 0 I
II.
DRAFT
documented in the review.
CALIBRATION
A
B.
Objective
Compliance requirements for satisfactory instrument calibration are established to
ensure that t.'Je instrument is capable of producing acceptable quantitative data. Initial and continuing calibration demonstrates that the instrument is capable of acceptable perfmmance at the beginning of the calibration period and routine calibration verification and system checks document that the initial calibration is still valid.
Criteria
Calibrations and routine system checks are to be performed according to the following schedule:
I. Initial and Continuing Calibration
a. Gas Flow Proportional and Other Gross Counting Measurements
The gross counting systems must be efficiency calibrated for each alpha and beta counting geometry at least annually or when the daily performance check indicates an unacceptable change in system efficiency. Self-absorption curves must be developed at least annually, or if the absorption correction is included in an et1iciency curve, a new curve must be developed when the daily performance check indicates an unaccept.1ble change in system efficiency. A plateau curve and alpha/beta cross- talk factors must be established, and a performance check must be made after each P-I 0 counting gas bottle change. If an unacceptable change has occurred due to the new counting gas, then the new gas must be replaced. If, out of necessity, counting is performed using undesirable counting gas, a special calibration must be performed
for that gas.
The counter background must be established quarterly or when the routine performance check indicates an unacceptable change in
Copyrighti:J 1992 SAIC- All Rights Reserved Page 6 of35

I I I I I I I I I I I I I I I I I I I
Science _,fpplic(/fions lntermaionul Corporation (SA/C) 1-13-IRCS-00 01
b.
c.
DRAFT
instmment background. If desired, matrix or batch blanks may be
used for background subtraction rather than counter background.
Liquid Scmtillation Spectrophotometer
Efficiency quench curves must be established for the liquid scintillation spectrophotometer for each radionuclide to be counted at least annually or when the daily performance check indicates an unacceptable change in system efficiency. Instrument high voltage,
gain, energy calibration, or quench indicator calibration must be adjusted using standard instrument calibration sources prior to calibration and routinely (usually daily) thereafter in order to maintain valid quench calibrations over the year. An efticiency calibration is not required when comparative measurement or internal standardization is used. However, calibration verilication
shall be performed.
The counter backgrmmd must be established quarterly or when the routine performance check indicates an unacceptable change in instmment background. Background quench curves must be established for each radionuclide to be counted unless matrix or batch blanks are used for backgrow1d subtraction.
Spectroscopy Measurements
Energy versus channel calibration must be established for spectroscopy systems at least quarterly or when the daily performance check indicates an unacceptable change in energy gain or zero offset.
Resolution versus energy calibration must be established for gamma spectroscopy systems quarterly or when the daily performance check indicates an unacceptable change in system resolution.
Spectroscopy systems must be efficiency calibrated lor each counting geometry at least annually or when the daily perlormance check indicates an unacceptable change in system efticiency. Efficiency versus energy curves must be established for gamma
Copyngluf:;. 1992 SAIC- All Rights Reserved Page 7 of35

I I I I I I I I I I I I I I I I I I I
Science Applicutions lnternutinnul Corporation (SA/C) /43-ARCS-00.0/
2.
d.
DRAFT
spectroscopy systems for the energy region of interest with par1icular attention to energy regions where the efficiency depends strongly on energy. Single efficiency values may be used tor alpha
spectroscopy systems for alpha energies between 4.0 and 6.0 MeV. An efficiency calibration is not required when
comparative measurement or intemal standardization is used. However, calibration verification must be performed.
Spectroscopy system background detem1inations must be established quarterly or when the routine performance check indicates an unacceptable cha11gc in system background.
Lucas Cells and Radon Flask Cmmting Systems
Each Lucas Cell and radon flask counting system must be efficiency calibrated with the DcpaJ1ment of Energy Environmental
Measurements Laboratory Radon Program at least armually or when calibration verification shows a11 unacceptable cha11ge in efficiency. A high voltage plateau curve must be established at least aJIDually or if there arc a11y unusual events affecting the power supply or the counting instrun1ent.
The Lucas Cell a11d radon bubbler background must be established betore each use.
Routine Calibration Performance Check
a. Gas Flow Proportional and Other Gross Counting Measurements
The efficiency calibration of gross counting systems must be checked using alpha and beta (if applicable) check sources each day that the system is used. The net alpha and beta counts (corrected for decay) and the alpha/beta cross-talk must be recorded and should be plotted on a QC chart daily.
The counter background must be checked each clay that the system is used. The background alpha and beta counts must be recorded and should be plotted on a QC chart daily.
Cupyrightrs::· 1992 S:-1./C- All Rights Reserved Page 8 of 35

I I I I I I I I I I I I I I I I I I I
Science :lpp/ications fntematiomtl C01porurion (S·IIC) ln-.. JRCS-00.01
b.
c.
DRAFT
Acceptable tolerances must be established for each QC chart
based on system performance and analytical requirements.
Maximum tolemncc limits of± I 0% of the value determined at time
of calibration are recommended for efficiency verification control
charts; otherwise, tolerance limits of± 3 standard deviations arc
recommended. When tolerance limits are exceeded, recalibration
is required.
Liquid Scintillation Spectrophotomctcrs
The ef1!ciency of liquid scintillation spectrophotometers must be
checked using a calibration source each day that the system is used. The net counts (corrected for decay) must be recorded and
should be plotted on a QC chart daily.
The counter background must be checked each day that the
system is used. The background alpha and beta counts must be
recorded and should be plotted on a QC chart daily.
Acceptable tolerances must be established for each QC chart
based on system performance and analytical requirements. Maximum tolerance limits of± I 0% of the value determined at time
of calibration are recommended for efficiency verification control
charts; otherwise, tolerance limits of± 3 standard deviations are recommended. When tolerance limits are exceeded, recalibration
is required.
Spectroscopy Systems
The energy, resolution, and efficiency must be monitored using a
calibration source each day that the system is used and must be
compared against the initial calibration values. The check source
must have both low- and high-energy peaks. TI1e centroid energy,
full width at half maximum (FWHM), and net counts w1der each
calibration peak (corrected for radioactive decay) must be
recorded and should be plotted on a QC chart daily.
The cmmter background must be checked at least once every
Copyright© /91.)2 SA!C- All Rights Reserved Page 9 of 35

I I I I I I I I I I I I I I I I I I I
Science App!icutions International Corporation (5,·1 !C) UJ-ARCS-00 01
d.
DRAFT
20 counting periods. The net count rate in each background peak
(gamma) or region (alpha) must be recorded and should be plotted on a QC chart. The background check c aunt rate is compared to the established background spectra used for background
subtraction. Acceptable tolerances must be established tor each background peak or region. When tolerance limits are exceeded or when new background peaks are identified, a new background must be established for the system.
Acceptable tolerances must be established for each QC chart based on system performance and analytical requirements. Ma"<imum tolerance limits of ± 10% are recommended for efficiency calibration verification control charts and± 1 FWHM for energy calibration verification control charts; otherwise, tolerance limits of± 3 standard deviations are recommended. All control limits arc relative to the value determined at time of calibration. When tolerance limits are exceeded, recalibration must be performed.
Lucas Cells and Radon Flask Counting Systems
The efficiency calibration of the Lucas Cells must be checked using a NIST traceable radium source in a radon bubbler once every 20 times it is used. The counts (corrected for decay) must be
recorded and should be plotted on a QC chart.
The dark current background must be checked at least weekly or when a new high voltage plateau has been established. The dark
current background must be recorded and should be plotted on a QC chart.
Acceptable tolerances must be established tor each QC chart based on system performance and analytical requirements. Maximum tolerance limits of± I 0% of the value determined at time of calibration arc recommended for efficiency verification control charts; otherwise, tolerance limits of± 3 standard deviations are recommended. When tolerance limits are exceeded, recalibration
is required.
Copyright{) 1992 s,uc- All Rights Reserved Page I 0 of 35

I I I I I I I I I I I I I I I I I I I
Science rlpplicarions lntenwtionu/ C01pomtion (S,IfC) U]-ARCS-00.01
III.
c
D.
DRAFT
Evaluation Procedure
1.
2.
3.
Action
l.
2.
V crify that the instrument was calibrated each time the instrument was setup
and at the required frequency as stated above. Evaluate the shape and
smoothness of high voltage plateaus, efficiency versus energy curves, and
quench curves. Evaluate the standard counting statistics to verifY that the
counting uncertainty (lcr) was less than or equal to 1%.
Observe the QC charts and verify that proper limits have been established
and that recalibration was performed whenever the limits were exceeded. Also, evaluate the check source counting statistics to verifY that the
counting uncertainty (lcr) was less than or equal to 1%.
VerifY, at a minimum, 10% of the calibration calculations. If errors are
fmmd in the calculations, verifY more calculations by using professional
judgment to see the extent of the errors.
If the specified calibration and/or verification frequency is not followed, the
efficiency or quench curves arc not smooth, or the QC results fall outside the appropriate tolerance limits, qualifY the results for all samples analyzed
between acceptable calibration verifications as estimated (J).
When significant errors are found in the calculations, flag all affected results that allow a bias of between 10-20% as estimated (J), and greater than
20% as unusable (R).
BLAi'iKS
A. Objective
Blank analysis results are assessed to determine the existence and magnitude of
contamination problems. The criteria for evaluation of blanks applies to any blank
associated with the samples. If problems with i!!2Y blank exist, all data associated
with the case shall be carefully evaluated to determine whether or not there is an
inherent variability in the data for the case, or if the problem is an isolated
occurrence not affecting other data.
CoP.vright© 1992 SAIC- All Rights Reserved Page 11 of35

I I I I I I I I I I I I I I I I I I I
Science .-lpplications !ntemational Corporation (SA/C) /43-ARCS-00.0/
B.
c.
D.
DRAFT
Criteria
At least one blank must be analyzed for every matrix, every batch, or for every
20 samples (5% of samples), whichever is more frequent. The result of all blanks
must be recorded and should be plotted on a QC chart at least daily for each
method. Acceptable tolerances must be established for each QC chart based on
system performance and analytical requirements. Tolerance limits of± 3 standard deviations arc recommended.
When average blanks or instrument backgrounds are subtracted to determine net
counts, the net blank result must be less than the associated uncertainty.
Contamination shall be suspected when the net blank result is larger than the
associated uncertainty.
Evaluation Procedures
Review the results reported on the Blank Summary (Form 2) and evaluate the
blank control charts as well as the raw data for all blanks. VerifY that the results
were accurately reported and that tolerance limits were not exceeded. VerifY that
net blank results are less than the associated uncertainry.
Action
If the blank QC results fall outside the appropriate tolerance limits or if the net blank results are not less than the associated uncertainty, qualifY the results for all
associated samples that are less than I 0 times the blank value as estimated (J).
IV. SAMPLE SPECIFIC CHEMICAL RECOVERY
A Objective
A tracer or carrier is used to measure and correct for losses that may have occurred during
separation and quantification of the analyte (in a specific sample). Abnormally high or low recoveries
may be indicative of inappropriate separation methods for certain matrix interferences, instrument
problems, calibration errors, or errors in the preparation of the tracer or carrier.
Both tracer and carrier yields are expressed as a percentage value. Abnormally low recoveries
can cause large uncertainly in affected sample results. Recoveries greater than I 00% may add negative
CopyrighLCC 1992 SA/C-All Righi.<; Reserved Page 12 of35

I I I I I I I I I I I I I I I I I I I
Science Applications fnternarional Corporation (SA/C) 143-ARCS-0001
DRAFT
bias of at least the amount greater tl1an I 00%. Limits tor botb high and low chemical recovery arc
established by the MQOs.
B.
c.
Criteria
I.
2.
Sample specific recoveries must be witbin limits as per applicable scope of work (SOVv'). Generally, recoveries of 50-100% are considered acceptable. However, lower recoveries may be typical for some matrices and the acceptable lower limit may be lowered in such instances. Each chemical tracer percent recovery (CT %R) must be recorded and should be plotted on a QC chart for each radionuclide and method and fall within
the prescribed limits.
The quantity of tracer material used must be adequate to provide a maximum of 10% uncertainty at the 95% confidence level in tbe measured recovery.
Evaluation Procedure
1.
2.
3.
Review Form 3 and verify tbat sample specific recoveries tall witbin tbe
control limits.
Check the raw data to verify that sample specific recoveries are accurately reported on Form 3. Recalculate, at a minimum, 10% of tbe sample specific recoveries (CT %R) using tbe following equation:
CT%R =
Where:
CTFo11nrl * 100
CTrwe
CTfound = ammmt of tracer or carrier (in pCi or mg) measured in tbe
sample.
CTTrue =amount of tracer or carrier (in pCi or mg) added to tbe sample.
Check spike levels to verify tbat sufficient levels are used to provide adequate precision for recovery determination.
Copyright© 1992 SA!C- till Righrs Reserved Page 13 ofJj

I I I I I I I I I I I I I I I I I I I
Science Appliwtions International Corpomtion (SA!C) 143-ARCS-00.01
V.
D.
DRAFT
4. Evaluate recovery to verity that limits specified in SOW arc met.
Action
For sample specific recoveries out of specification, the following approaches are suggested based on a review of all data from the case, especially considering the apparent complexity of the sample matrix:
If the uncertainty (2 sigma) is> 10% (or other limits as specified by the MQOs), quality the sample result as estimated ( J). If tracer recovery is greater than 110%, quality the sample result as estimated ( J) or unusable ( R) based on the amotmt of bias allowed by the MQOs.
2. When significant errors arc found in the calculations, flag all affected results that allow a bias of between 10-20% as estimated (J), and greater than 20% as unusable (R).
LABORATORY CONTROL SANIPLE
A Objective
The laboratory control sample (LCS) serves as a monitor of the overall accuracy and performance of all steps in the analysis, including the sample preparation. For the following limits to apply, the LCS must contain greater than 10 times the radionuclide's detection limit activity.
Criteria
1. At least one LCS must be analyzed for every matrix, every batch, or for every 20 samples (5% of samples), whichever is more frequent.
2.
3.
All aqueous LCS results must fall within the control limits of 80-120% recovery of the standard value.
All solid LCS results must fall within the control limits of 70- 130%
recovery of the standard value.
Copyright(() 1992 SA!C- All Rights Reserved Page 14 of35

I I I I I I I I I I I I I I I I I I I
Science ,·lpplications fntematiotwl Corpowtion (SA!C) f.IJ.~RCS-00 01
c
D.
DRAFT
4. All LCS results must be recorded and should be plotted on a QC chart
according to sample type and radionuclidc and fall within the prescribed
limits.
Evaluation Procedure
I .
2.
Action
I.
2.
Review Form 4 and verify that results fall within the control limits.
Check the raw data (counter printout, strip charts, bench sheets, etc.) to
verify the reported recoveries on Form 4. Recalculate, at a minimum, I 0"/o of the LCS percent recoveries (LCS %R) using the following equation:
LCS %R =
Where:
LCS""""" OO * 1 LCSrwc
LCSFound = concentration (in pCi!L for aqueous; pCilkg for solid) of
each analyte measured in the analysis of LCS solution
LCSTrue =concentration (in pCi!L for aqueous; pCiJkg for solid) of each
analyte in the LCS source.
Aqueous LCS
a. If LCS %R are <80% or > 120%, qualify results
radionuclide in all associated samples as estimated (J).
Solid LCS
for that
a. If LCS %R are <70% or > !30%, qualify results for that
radionuclide in all associated samples as estimated (J).
Copyright(F;; 1992 SA!C ~All Rights Reserved Page 15 of35
I I I I I I I I I I I I I I I I I I I
Science ;lpplications International C01p0mtion (SA!C) 143-ARCS-00.01
VI.
DRAFT
MATRIX SPIKE SAMPLE ANALYSIS
A.
B.
c.
Objective
The matrix spike sample (MSS) analysis provides information about the effect of
each sample matrix on the digestion and measurement methodology. MSSs are
required when sample specific chemical recovery mechanisms arc not available and the samples cmdergo a chemical process.
Criteria
I. At least one MSS must be analyzed for every matrix, every batch, or for
every 20 samples ( 5% of samples), whichever is more frequent, when
sample specific chemical recovery mechanisms are not available and the
samples undergo a chemical process.
2.
3.
4.
Samples identified as field blanks must not be used flr spiked sample
analysis.
Matrix spike sample percent recovery (MSS %R) must be within the limits
of 80-120% for aqueous matrix and 70-130% for solid matrix samples.
However, spike recovery limits do not apply when sample concentration
exceeds the spike concentration by a factor of 4 or more.
The MSS %R of the matrix spike must be recorded and should be plotted
on a QC chart and fall within the prescribed limits.
Evaluation Procedure
I . Review F onm 5 and verifY that results fall within the specified limits.
Check raw data and recalculate, at a minimum, 10% of the %R using the
following equation to verifY that the results were correctly reported on
Fonn 5.
MSS%R = (SSR - SR) * lOG
SA
Copvright© 1991 SA!C- All Rights Reserved Page 16 of Jj
I I I I I I I I I I I I I I I I I I I
Science Applications fntenwnonal Corporation (S;f/C) /43-ARCS-00.01
3.
D. Action
1.
2.
DRAFT
Where:
SSR Spiked Sample Result
SR Sample Result
SA Spike Added
Verity that the field blank was not used for spike analysis.
If spike recovery is <50% (<40% for solids) or >120% (>130% for
solids), quality the results for that radionuclide for associated samples as estimated (J).
If the field blank was used for matrix spike analysis, all other QC data shall be carefully checked and professional judgment exercised when evaluating the data.
VII. D UPLI CA TE Al'IAL YSIS SA,'\1PLES
A. Objective
Duplicate analyses arc indicators of laboratory precision based on each sample matrix.
B. Criteria
1.
2.
3.
Samples identified as field blanks must not be used for duplicate sample analysis.
At least one duplicate must be analyzed for every matrix, every batch, or
for every 20 samples (5% of samples), whichever is more frequent.
The duplicate analyses results must not be significantly different from each other based on a 95% confidence level. For this to be true, the duplicate
error ratio (DER) as defined in the following equation must be less than I. The DER must be recorded and should be plotted on QC charts with a control limit set at 1.
CopvrigJn© 1992 SAIC ~All Rights Reserved Page 17 of35

I I I I I I I I I I I I I I I I I I I
Science rlpplicotions International Corporation (SeliC)
c.
D.
DRAFT
DER 1s- a
=
Nz~t + (zo;,)')
Where,
S =First Sample Value (original)
0 =Second Sample Value (duplicate)
2o-s =First Sample 2o- Uncertainty
2on = Second Sample 2o- Uncertainty.
Evaluation Procedure
I. Review Form 6 and verifY that DER results are less than 1.
2. Check, at a minimum, I 0% of the duplicate results and recalculate the DER
values. Use the above equation to verifY that DER results have been
correctly reported on Form 6.
3. Verify that the field blank was not used for duplicate analysis.
Action
I.
2.
If DER for a particular radionuclide is greater than I, qualifY the results for
that radionuclide in all associated samples of the same matrix as estimated
(J).
If the field blank was used for duplicate analysis, all other QC data shall be
carefully checked and professional judgment exercised when evaluating the
data.
CopyrightCiJ 1992 SAIC- All Rights Reserved Page 18 of 35

I I I I I I I I I I I I I I I I I I I
Science :lpp/ications International Corporation (SA /C) 143-ARCS-00.0/
DRAFT
VIII. FIELD DUPLICATES Al'IAL YSIS
IX.
A. Objective
Field duplicate samples may be taken and analyzed as an indication of overall precision. These analyses measure both field and lab precision; therefore, the
results may have more variability than lab duplicates that measure only lab performance. It is expected that soil duplicate results will have a greater variance than water matrices due to difficulties associated with collecting identical field samples.
B. Criteria
c.
D.
There are no review criteria for field duplicate analyses comparability.
Evaluation Procedures
Samples that are field duplicates should be identified using sample field sheets. The reviewer should compare the results reported for each sample and calculate the DER.
Action
Any evaluation of the field duplicates shall be provided with the reviewer's comments.
RADIONUCLIDE QUAl'ITITATION AND IMPLIED DETECTION LIMITS
A. Objective
The objective is to ensure that the reported quantitation results are accurate and
that the required detection limits have been met. When detection limit requirements are not met, the data quality objectives may not have been met. All results shall be evaluated relative to the uncertainty associated with the analysis.
B. Criteria
1. Radionuclide quantitation must be calculated according to the appropriate procedures specified in the contractual SOW.
CopyrightCO 1992 SA!C- Afl Rights Resetved Page 19 of 35
I I I I I I I I I I I I I I I I I I I
Sctence Applications International Corporation (Sti!C) I 43-ARCS-00_0 I
c.
2.
3.
4.
5.
6.
DRAFT
Detection limits specified in the specific procedures must be met unless other detection limits are specified in the SOW.
Analytical uncertainties must be reported with all results in order to qualifY the data. Results and uncertainties must be reported for all required analyses regardless of the size or sign of the result. The reported uncertainty must include alltmccrtainties associated with the analysis. If the
reported uncertainty only includes counting uncertainty, this fact must be documented in the case narrative.
For solid samples a minimum of 100 grams must be homogenized prior to subsampling an aliquot for analysis. Homogenization of the entire sample is recommended for all samples and is required for liquid samples with more than one phase. The minimum homogenized sample aliquot size used for analysis must be 1 g for dry solids or 1 ml for liquid samples, although further dilution may be performed after chemical dissolution or extraction.
When samples are dry mounted for counting, mounting aliquots must be selected in order to keep the dry mounted weight to = 5 mgicm2 for alpha
analyses and "10 mgicm2 for beta analyses.
An analyte will be considered as positively detected if the result is above the sample specific decision level (l,). The a posteriori decision level or critical value, l,, should be set at a ninety- five percent probability. The decision level, to be calculated for each measurement result, determines the minimum activity or concentration result that can be considered as statistically different from blank results. Therefore, the l, is the level at which blank results will not exceed more than 5% of the time. Information and guidance on the calculational methods used to estimate the MDC and l, are available from several sources (Currie, ANSI N42.23).
Evaluation Procedures
1. The raw data shall be examined to verifY the correct calculation of sample results reported on Form 1 by the laboratory.
a. Examine the raw data for any anomalies (i.e., omissions, legibility,
CopyrightC0 /992 SAIC- All Rights Reserved Page 20 o/35

I I I I I I I I I I I I I I I I I I I
Science Applications !ntenwlional Corporation (SA/C) 143-ARCS-00.0/
2.
3.
4.
b.
C.
d.
DRAFT
etc.). Recalculate, at a minimum, l 0% of the results to verifY proper calculation. If calculation errors arc found, recalculation of more results may be required in order to determine the extent of the error.
VerifY that there are no transcription or reduction errors (e.g., dilutions, percent solids, sample weights) on one or more samples.
Veiily that all analytical uncertainties have been propagated and reported or otherwise documented.
VerifY that appropiiate aliquot sizes have been used for sample preparation (Form 7) and mounting.
V crifY that uncertainties (Form l) have been reported for all results.
Check that the obtained detection limits the required detection limits by veiifYing that, tor blanks or any other samples that have a 2cr uncertainty greater than the result, the 2cr uncertainty multiplied by 1.65 is less than or equal to the specified required detection limit.
For sample results close to or less than the L" the L, can be estimated by the following equation:
where:
L, = 1.65 TPU
decision level (dpm/unit) total propagated uncertainty of the result, R (dpm/unit)
Even though the TPU will be larger for samples larger than the L" this equation can always be used for the positive detection decision since the result will grow larger faster than the TPU. Using this equation actually evaluates the 95% probability that the true result is greater than zero.
When the detector background or appropriate blank information is available, the critical level may be estimated by the following equation:
Copyright© /992 SAIC- All Rights Reserved Page 2/ of35

I I I I I I I I I I I I I I I I I I I
Science Applications fnternational Coijmratinn (SA/C) 143-,iRCS-00 0 I
D. Action
I.
2.
3.
4.
DRAFT
lc = ((t · Sa)+ Ra) I (E · R · IDF · W)
where: L, decision level (dpm/unit),
Sa standard deviation of a set of appropriate
blank net count rates after background
subtraction for blanks counted for the same
length of time as the sample,
Ra average blank count rate,
student t factor for appropriate degree of
freedom,
E fractional detector efficiency ( c/d) for the
sample,
R fractional chemical recovery for the
sample,
IDF ingrowth or decay factor for the sample,
w weight or volume of sample.
When significant errors are found in the calculations, t1ag all affected results
that allow a bias of between 10-20% as estimated (J), and greater than
20% as unusable (R). If errors are found in the calculation of the
uncertainties or they have been rounded improperly, t1ag the uncertainty as
estimated ( JE).
When inappropriate aliquot sizes are used, t1ag all affected results as
estimated (J).
For net negative results that have uncertainties smaller than their absolute
value, t1ag the data as unusable (R). This is an indication of improper blank
subtraction.
When detection limits are not met, t1ag the data as detection limit exceeded
(DL).
5. When analytical uncertainties are not reported, t1ag the results as estimated
Cvpyright'J:J 1992 SA!C -till Rights Reserved Page 21 o/35

I I I I I I I I I I I I I I I I I I I
Science Applications International Corporation (S;/ !C) 143-ARCS-00.01
X.
DRAFT
(J).
[f any discrepancies are found, the laboratory may be contacted by the designated representative to obtain additional information that could resolve any differences. [f a discrepancy remains unresolved, the reviewer may determine that qualification of
the data is warranted based on the reviewer's professional judgment.
CHEMICAL SEPARATION SPECIFICITY (Alpha Spectrometry)
A.
B.
c.
Objective
Chemical separation specificity is the contract laboratory's ability to separate various radionuclidcs by chemical separation techniques. The chemical separation specificity can be verified for alpha spectroscopy measurements by observation of the alpha energy spectrum.
Criteria
1. There are not to be any radionuclides that interfere with the quantitation of the radionuclide of interest once the chemical separation process has been completed.
2. Energy of the radionuclide of interest must be within 40 keV of the observed peak energy.
Evaluation
1.
2.
3.
Check that the energy of the observed peak of interest is within 40 keY of the energy for the radionuclide of interest.
Check the energy spectra for any peaks that overlap or that have associated peaks that may interfere with the peak of the radionuclide of interest.
When interfering radionuclides are present and can be corrected for from associated peaks in the spectrum, check to see if the peak area for the radionuclide of interest has been properly corrected.
D. Action
Copyright'{;) 1992 SA!C- Ail Rights Reseto:ed Page 23 o/35
I I I I I I I I I I I I I I
I I I I
Science Applications lntenwtional Cotporation (Sill C) 143-ARCS-00.01
XI.
1.
2.
DR<\FT
If the energy of the peak of interest is more than 40 keY from the energy
for the radionuclide of interest, quality the results as unusable (R).
If the alpha energy spectra contains any peaks that overlap with or have associated peaks that may interfere with the peak of the radionuclide of
interest and it is impossible to correct for the interference, quality the results as unusable (R).
3. If the results have not been properly corrected tor the interfering radionuclidc, quality the data as unusable (R).
TARGET RADIONUCLIDE LIST IDENTIFICATION (Gamma Spectroscopy)
A.
B.
C.
Objective
The target radionuclide list (TRL) contains those radionuclides for which a quantitative analysis is required. There lore, net quantitation with uncertainties must be provided for all TRL radionuclides (whether or not the radionuclide is identified in the peak search and identification). This is accomplished by determining the net area in the region associated with the radionuclide when the radionuclide is not detected by the computerized peak search routine. When a peak is detected for the radionuclide, positive identification is achieved through the use of the following criteria.
Criteria
1.
2.
The target radionuclide energy must be within 2 keY of the observed peak
There are not to be any radionuclide gamma peaks that interfere with the
quantitation of the radionuclide of interest. If there is an interference, the radionuclide of interest result must be corrected to negate the interfering radionuclide's contribution to the radionuclide of interest's gamma peak.
Evaluation Procedure
1. Check that the energy of the identified peaks is within 2 keY of the standard library energy for the identified radionuclide.
CopvrightCO 1992 SAIC- All Rights Reserved Page 24 of35

I I I I I I I I I I I I I I I I I I I
Science :lpplications International Corpor(ltion (S/JJC) /.j}-ARCS-00.01
D.
2.
3.
DR<\FT
Verify that net peak areas and associated uncertainties have been obtained
for all TRL rddionuclidcs not meeting the above criteria.
Check the energy spectra for any peaks that overlap or that have
associated peaks that may interfere with the peak of the radionuclide of
interest
4. When interfering radionuclides are present and can be corrected for from
associated peaks in the spectrum, check to see if the peak area for the
radionuclide of interest has been properly corrected.
Action
Qualify the data according to the following:
I . For TRL wdionuclides that are not detected in the computerized peak
search, qualify the net peak area results as described in Section IX.
2. For TRL radionuclide peaks that are detected but fail to meet the positive
identification criteria, t1ag the data as unusable (R).
3. If improper methods arc used, flag the data as estimated (J).
4.
5.
If the gamma energy spectra contains any peaks that overlap with or have associated peaks that may interfere with the peak of the radionuclide of
interest and it is impossible to correct tor the interference, qualify the results
as unusable (R).
If the results can be and have not been properly corrected for he
interfering radionuclide, qualify the data as unusable (R).
If any discrepancies are found, the laboratory may be contacted by the designated
representative to obtain additional information that may resolve any differences. If a
discrepancy remains unresolved, the reviewer shall decide which value is the best
value. Under these circumstances, the reviewer may detennine whether
qualification of data is warranted.
Copyright© 1991 SAIC -:Ill Rights Reserved Page 25 o/35

I I I I I I I I I I I I I I I
I I I
Science Applications International C01porution (SA/C) 143-ARCS-00.01
XII.
DR<\FT
TE='ITA TIVEL Y IDENTIFIED AADIONUCLIDES (Gamma Spectroscopy)
A. Objective
B.
One of the objectives of the criteria for gamma spectroscopy qualitative analysis is
to minimize the number of erroneous identifications of radionuclides. An erroneous
identification can either be a false positive (reporting a radionuclide present when it
is not) or a false negative (not reporting a radionuclide that is actually present). It is
much easier to detect talse positives than false negatives. because more information
is available due to the requirement tor submittal of data supporting positive
identification. Negatives, or nondetected radionuclides, on the other hand,
represent an absence of data and are, therefore, much more difficult to assess.
Gamma spectra peaks in radionuclide analyses that are not TRL isotopes arc
potential tentatively identified mdionuclides (TIRs ). TIRs must be qualitatively
identified by a radionuclide spectra library computer search and the identifications assessed by the data reviewer.
Criteria
!. Identified radionuclide energy must be within 2 keY of the observed peak.
2.
3.
4.
Gamma spectra of the sample radionuclide and the standard radionuclide
library must match according to the following criteria:
a.
b.
50% of total abundance of all gamma peaks listed in the standard
radionuclide library must be present in the sample spectrum.
The sampling to count time must not be greater than I 0 half lives of
the identified radionuclide.
Radionuclide concentrations present m the gamma spectra must be
consistent with related radionuclides (e.g., when daughter radionuclides are
expected to be in equilibrium with parents, detection of both provides
confirmation of identification).
All peaks greater than three standard deviations of the background
identified radionuclidcs spectrum shall be considered and accounted for.
Cop_vright© /992 S,1/C- All Rights Reserved Page 26 of 35

I I I I I I I I I I I I I I I I I I I
Science ;/pplicarions International Corporation (SA!CJ 1<13-ARCS-00 01
c.
5.
DRAFT
Guidelines for tentative identification are as follows:
a.
b.
Peaks present in the sample spectrum but not in the reference
spectrum shall be reviewed for possible background contamination
or interference.
When the above criteria are not met, but the data reviewer or
gamma spectral interpretation specialist judges the identification to
be correct, the data reviewer may report the identification.
c. If the data reviewer judges the identification to be tmcertain or
there are extenuating factors affecting radionuc !ide identifications,
the TIR result may be reported as "tmknown."
Evaluation Procedure
l.
2.
3.
Check the raw data to verify that the laboratory has generated a computer
library search for all required peaks in the spectra (samples and blanks).
Examine the blank spectra to verify that TIR peaks present in samples are not found in blanks. vvbcn a low-level non-TRL radionuclide that is a
common artifact or laboratory contaminant is detected in a sample, a
thorough check of blank spectra may require examining for peaks that arc
less than the critical level but present in the blank spectra at similar cmmting
time.
Examine all gamma peaks in every sample and blank spectra.
Copyright't:J {992 SA!C- All Rights Reserved Page 27 of 35

I I I I I I I I I I I I I I I I I I I
Science Applic(ltiom International Corporation (SA/C) I 43-ARCS-00. 0 I
4.
D. Action
1.
2.
3.
4.
5.
6.
DRAFT
Check that expected related radionuclides arc present.
Note: Since TIR computer library searches often yield several
candidate radionuclides having close matching peaks, consider all
reasonable choices.
Note: The reviewer should be aware of common laboratory
artifacts/contaminants and their sources (e.g., radon and thoron
daughters in the air, etc.). These may be present in blanks and not
reported as sample TIR.s.
All verified TIRs shall be listed in the evaluation report.
All TIRs shall be flagged as tentatively identified (N).
General actions related to the review of TIR results are as follows:
a.
b.
If it is determined that a tentative identification of a non- TRL
radionuclide is not acceptable, the tentative identification shall be
flagged as unusable (R) or changed to an appropriate identification.
If all peaks were not library searched, the designated
representative could request these data from the laboratory.
TIR results that are not sufficiently above the level in the blank should not
be reported. (Dilutions, sample size, and counting times shall be taken into
account when comparing the amounts present in blanks and samples).
When a radionuclide is not found in any blanks, but is a suspected artifact
of common laboratory contamination, the result may be flagged as unusable
(R).
In deciding whether a library search result for a TIR represents a realistic identification, professional judgment shall be exercised. If there is more
than one reasonable match, the result may be reported as "either
radionuclide X or radionuclide Y."
Copyright© 1992 Sti!C ~All Rights Reserved Page 28 of35
I I I I I I I I I I I I I I I I I I I
Science ,-/pplications lntemational Corporation (SA/C) I.JJ-ARCS-00.0 I
7.
8.
DRAFT
Other case-specit!c factors may influence TIR judgments. If a sample TIR match is poor but other samples have a TIR with a good library match and
similar gamma peaks, identification information may be inferred from the
other sample TIR results.
Physical constants, such as half life, shall be factored into professional judgment of TIR results.
XIII. SYSTEMS PERFORlviAc'ICE
A. Objective
B.
During the period following instrument performance QC checks (e.g., blanks, tuning, calibration, etc.), changes may occur in the system that degrade the quality of the data. While this degradation would not be directly shown by QC checks until the next required series of analytical QC runs, a thorough review of the ongoing data acquisition may yield indicators of instrument performance.
Criteria
Some examples of instrument performance indicators for various factors are shown below. (Note: TIJ.is is not an exhaustive list.)
l.
2.
Abrupt, discrete shifts in background or detector response may indicate contamination and/or gain or threshold changes.
Poor spectroscopy performance affects both qualitative and quantitative results. Indications of substandard pertormance include:
a. High background levels or shifts in energy calibration.
b.
C.
d.
Extraneous peaks.
Loss of resolution.
Peak- tailing or peak splitting that may result m inaccurate quantitation.
C. Evaluation Procedure
Cop:r•righl'f:J 1992 SA!C- All Rights Reserved Page 29 of35
I I I I I I I I I I I I I I I I I I I
Science Applications International Corporation (SA/C) 143-ARCS-00.01
D.
DRAFT
Evaluate the raw data for each sample to determine if unexpected activity, extraneous peaks, loss of resolution, or loss of expected background peaks has occurred.
Action
Continued analytical activity with degraded performance suggests lack of attention or professional experience. Based on the instrument perfommnce indicators, the
data reviewer shall decide if the system has degraded to the point of affecting data quality or validity. If data quality may have been affected, data shall be qualified using the reviewer's best professional judgment.
XIV. OVERALL ASSESSMENT OF DATA FOR A CASE3
"It is appropriate for the data reviewer to make professional judgments and express concerns and comments on the validity of the overall data for a case. This is particularly appropriate when there are several QC criteria out of specification. The additive nature of QC factors out of specification is difficult to assess in an objective manner, but the reviewer
has a responsibility to inform the user concerning data quality and data limitations in order to assist that user in avoiding inappropriate use of the data, while not precluding any consideration of the data at alL If qualifiers other than those used in this document are necessary to describe or qualifY the data, it is necessary to thoroughly document/explain the additional qualifiers used. The data reviewer would be greatly assisted in this endeavor if the data quality objectives were provided. The cover form and supplementary documentation shall be included with tl1e review."
3 1l1is section was taken from the "Overall Assessment of Data for a Case" section of reference 2.
Copyright© 1992 SAIC- A!i Rights Reserved Page 30 of35

I I I I I I I I I I I I I I I I I I I
Science -lppliculions fnterrwtional Cmporation (SAl C)
DRAFT
GLOSSARY A
Data Qualifier Definitions
/43-ARCS-00.01
The qualillers listed below can be used simultaneously to qualifY a result for different reasons.
J - The associated numerical value is an estimated quantity.
N - Presumptive evidence of the presence of the radionuclide.
DL - Detection limit requirements not met. Data quality objectives may not be met.
R- The data are unusable (radionuclide may or may not be present). Resampling and
reanalysis is necessary for verification.
JE - Uncertainty is an estimated quantity. This estimated flag applies only to the uncertainty and
has no reflection on the quality of the result.
Copyright© /992 SAIC- All Rights Reserved Page 31 of35

I I I I I I I I I I I I I I I I I I
Science Applications International Corporution (SA/C)
DRAFT
GLOSSARYB
Additional Terms
143-ARCS-00.01
Calibration Curve - An analytical curve based on the pulse energy, detector efficiency, energy
absorbance, or other measured characteristic obtained from standard sources and a reagent blank.
Calibration Source - A radionuclide source counted daily to verifY the calibration of a counting
system.
Case- A fmite (usually predetermined) number of samples collected over a given time period for a
particular site. A case consists of one or more sample delivery group(s).
Chemical Tracer - A trace quantity of a different radioisotope of the same element or a carrier quantity of an inactive isotope of the same or a chemically similar element.
Contract Compliance Screening (CCS) - A process in which the analytical data is reviewed for
contractual compliance.
Critical Level (CL) - The net count rate that must be exceeded before there is a specific degree of
confidence that the sample contains any measurable radioactive material above background.
Customer Reguired Detection Limit (CROLl- The minimum concentration in a given matrix type
that a customer will accept of a radionuclide that can be measured and reported with a specific degree of confidence that the radionuclide activity is greater than zero.
Duplicate - Two aliquots taken from a homogenized sample and analyzed as individual samples.
These are used to determine the precision of the method.
Duplicate Error Ratio - The ratio of the difference between the duplicate results to the sum of the
two standard deviation uncertainties for duplicate results.
Field Blank - A sample of radionuclide- free media which is taken to the field in sealed containers
and transferred from one vessel to another at the sampling site and preserved with the appropriate
reagents. This serves as a check on reagent and environmental contamination. These blanks are
treated as actual samples but may not be used for matrix spikes or sample duplicates.
Field Duplicate - Independent samples that are collected as close as possible to the same point in
space and time. They are two separate samples taken from the same source, stored in separate
containers, and analyzed independently. These duplicates are useful in documenting the precision
Copyright© /992 SAIC- All Rights Reserved Page 32 of 35
I I I I I I I I I I I I I I I I I I I
Science Applications lnternulional Corporation (SA/C) /43-ARCS-00.01
DRAFT
of the sampling process.
Full Width at Half Maximum (FWHi\1)- the width of the distribution at a level which is half the
maximum ordinate of the peak.
Holding Times- The time between the date of collection of sample and the date of sample analysis.
Laboratory Control Sample (LCS)- A control sample ofknown composition_ Aqueous and solid
laboratory control samples are analyzed using the same sample preparation, reagents, and
analytical methods employed for the unknown samples being analyzed. The results from the
analysis of the controls are plotted and compared to control limits to determine the usability of the
data.
Matrix Spike Sample (MSS) - An aliquot of sample spiked with a known concentration of target
radionuclide(s). The spiking occurs prior to sample preparation and analysis. A matrix spike is
used to document the bias of a method in a given sample matrix. (Some Federal Regulations
require that data be corrected for spike recovery prior to reporting. Environmental Protection
Agency recommends a minimum of l 0 times the method detection limit or 2 to 4 times the
measured quantity.)
Method Blank- A radionuclide- free matrix to which all reagents are added in the same volumes or
proportions as used in sample processing. The method blank is carried through the complete
sample preparation and analytical procedure. The method blank is used to document
contamination resulting from the analytical process and should not be used for matrix spikes or
sample duplicates.
Method Detection Limit (MDL) - TI1e minimum concentration of a radionuclide that can be
measured and reported wth a specific degree of confidence that the radionuclide's activity is
greater than zero and is determined for analysis of a sample in a given matrix type. MDL is
equivalent to LLD, MDA, etc.
Percent Recovery (%R) - The fractional amoU!lt of the known activity of the radionuclide of
interest that was obtained in the analysis.
Quality Control (QC)- An aggregate of activities designed to ensure adequate quality of analytical
data.
QC Chart- A graphic representation on which the values obtained on the analysis ofbackgroUllds,
blank, calibrations, and laboratory control samples are plotted sequentially. The chart usually
Cop_vright(O 1992 SA!C- All Rights Reserved Page 33 of35
I I I I I I I I I I I I I I I I I I I
Science Applications International Corporation (SA/C) /43-ARCS-00.01
DRAFT
consist of a central line and two control limit lines parallel to the central line. The distribution of the
plotted values with respect to the control limits provide valuable visual and statistical information on
the quality of the analyses.
Quench Curve - A plot of efficiency versus degree of quenching tor quenched standards.
Quenching - A reduction in the pulse height from the output of the photomultiplier tube due to
physical or chemical processes occurring during or after the deposition of energy by the ionizing particle in the scintillator. Quenching reduces the scintillation efficiency and hence produces a loss
in cow1ting efficiency.
Standard Operating Procedure (SOP) - Established or prescribed methods to be followed
routinely for the performance of designated operations or in designated situations.
Scope of Work (SOW) - A detailed description of work to be performed by a contracted
laboratory or facility.
Target Radionuclide List (TRL) - A listing of radionuclides for which a quantitative analysis is
required. Therefore, net quantitation with uncertainties must be provided for all TRL radionuclides
whether or not the radionuclide is identified in the computerized peak search and identification
routine.
Tentatively Identified Radionuclide (T!R)- A detected radionuclide not on the Target Radionuclide
List.
Copyright© /992 SA!C- All Rights Reserved Page 34 of35

I I I I I I I I I I I I I I I I I I I
Science Applications International Corporation (SA/Cj 143-ARCS-00. 0 I
DRAFT
REFERENCES
American Society for Testing and Materials (ASTM), "Establishing a Quality Asstrrance Program for Analytical Chemistry Laboratories Within the Nuclear Industry," American Society for Testing and Materials C 1009-83, Philadelphia, PA, 1986.
2 B!eyler, Ruth, comp., Laboratory Data Validation Functional Guidelines for Evaluating Inorganics Analyses, (Draft), Hazardous Site Evaluation Division of the U.S. Environmental Protection Agency, 1988.
3 Bleylcr, Ruth, comp., Laboratory Data Validation Functional Guidelines for Evaluating Organics Analyses, (Draft), Hazardous Site Evaluation Division of the U.S. Environmental Protection Agency, 1988.
4 Drinking Water Laboratory Certification Implementation Work Group, Manual for the Certification of Laboratories Analyzing Drinking Water, EPA-570/9-82-002, U.S. Environmental Protection Agency, Washington DC, October 1982.
5 National Primary Drinking Water Regulations; Radionuclides - Notice of Proposed Rulemaking, 40 CFR Parts 141, 142, U.S. Environmental Protection Agency, Federal Register, Volume 56, Number 138, July 18, 1991.
6 Gibson, J.A.B., "Modern Techniques for Measuring the Quenching Correction in a Liquid Scintillation Counter: A Critical Review," pp 153-172 in Liquid Scintillation Counting: Recent Applications and Development -Volume I Physical Aspects, ed. Chin-Tzu Peng, Donald L. Horrocks, and Edward L. Alpen, Academic Press, New York, 1980.
7 Institute of Nuclear Power Operations, Quality Control Program for Chemistry Instrumentation, INPO 83-016 (Revision 01) (CY-701), Institute of Nuclear Power Operations, Atlanta, GA, January 1986.
8 Lochamy, Joseph C., The Minimum Detectable Activity Concept, proceedings of the
National Bureau of Standards 75th Anniversary Symposium, and EG&G Ortec System Applications Studies, PSD No. 17, September 1981.
9 Department of Energy, The Environmental Survey Manual Appendix D - Part 4 (Radiochemical Analysis Procedures), 2Jd Edition, Department of Energy, Office of the Assistant Secretary Environment, Safety, and Health, Office of Environmental Audit, Washington, DC, January 1989.
Cop_vright© 1992 SAIC ~All Rights Reserved Page 35 of 35

I Science Applicalions lntenwtional Corporation fSA !C) 143-ARCS-00. 0 I
I DRAFT
I I
APPENDIX I
I I I I I I I I I I I I I I Copyright© 1992 SA!C- All Rights Reserved
I

I I I I I I I I I I I I I I I I I I I
RADIOLOGICAL
DATA VALIDATIONNARRATNE
Case#: __________ _
SDG #: ________ _
The identified radiological data package has been reviewed and validated in accordance with
Laboratory Data Validation Functional Guidelines for Evaluating Radionuclide Analyses -Revision 06.
DATA VALIDATION QUALIFIERS
The qualifiers listed below can be used simultaneously to qualifY a result for different reasons.
J - The associated numerical value is an estimated quantity.
N - Presumptive evidence of the presence of the radionuclide.
DL - Detection limit requirements not met. Data quality objectives may not be met.
R - The data are unusable (radionuclide may or may not be present). Resampling and reanalysis is necessary for verification.
JE - Uncertainty is an estimated quantity. This estimated flag applies only to the uncertainty and has no reflection on the quality of the result.
RADIOLOGICAL DATA VALIDATION CRITERIA AND REMARKS
I. Holding Times: Sample holding times exceeded 2. Holding Times: Sample improperly preserved 3. Initial and continuing calibration: Frequency not met 4. Initial and continuing calibration: Errors in calculations 5. Calibration verification: Frequency not met
6. Calibration verification: Unacceptable change in efficiency 7. Calibration verification: Unacceptable change in system energy gain or offset

I I I I I I I I I I I I I I I I I I I
8. 9.
10. 11. 12. 13.
Calibration verification: Calibration verification: Calibration verification: Calibration verification: Calibration verification: Calibration verification:
Unacceptable change in resolution Unacceptable change in absorption factor Unacceptable change in background Unacceptable change in plateau voltage Unacceptable change in cross talk factors Unacceptable change in dark current
14. Calibration verification: Errors in calculations 15. Blanks: Frequency not met 16. Blanks: Value> associated uncertainty 17. Blanks: ± 3cr exceeded 18. Chemical Recovery: Sample-specific recovery outside limits 19. Laboratory Control Sample: Frequency not met 20. Laboratory Control Sample: Recovery of standards outside limits 21. Matrix Spike: Frequency not met 22. Matrix Spike: Recovery of standard spikes outside limits 23. Duplicate Analysis: Frequency not met 24. Duplicate Analysis:Duplieate Error Ratio> 1.0 25. Field Duplicate Analysis Duplicates not in agreement 26. Quantitation: Errors in calculation of activity 27. Quantitation: Errors in calculation of uncertainty 28. Quantitation: Negative result with absolute value> uncertainty 29. Quantitation: Uncertainty not reported 30. Quantitation: Less than minimum amount of sample homogenized 31. Quantitation: Less than minimum homogenized sample aliquot used 32. Quantitation: Exceeded maximum mass/area on planchet for alpha, beta counting 33. Quantitation: Detection limits not exceeded 34. ldentit1cation: Energy difference> 40 keY (alpha) 35. Identification Energy difference> 2 keY (gamma) 36. Identification: Interference peak in region of interest 37. Identification: <50% total gamma abundance found 38. System Performance: Degraded system performance
A summary of the review and validation findings is outlined below:
Holding Times and Preservation
I I I I I I I I I I I I I I I I I I I
Calibration
Blanks
Sample-Specific Chemica\ Recovery
Laboratory Control Sample
Matrix Spike
Duplicates
Field Duplicate Analysis
Radionuclide Quantitation and Implied Detection Limit
I I I I I I I I I I I I I I I I I I I
Chemical Separation Specificity
Target Radionuclide List Identification
Tentatively Identified Radionuclides
System Performance
Nonconformances/Deficiencies
I certifY that the data review and validation of samples included in this package have been conducted in
accordance with the guidance document specified above.
NAME
TITLE COMPANY REPRESENTED
ADDRESS
NAME Date


![< B A B L G U ? D : J L H Q D B R e d h ] j Z n b y · J Z a f _ j b a h [ j Z ` _ g b y r l r l r l r l r l r l r l r l ^ h d \ k f h l ^ h d \ k f](https://img.pdfslide.us/doc/110x75/6057f9c27a09a5619b5ae169/-b-a-b-l-g-u-d-j-l-h-q-d-b-r-e-d-h-j-z-n-b-y-j-z-a-f-j-b-a-h-j-z-.jpg)