Embed Size (px)
Citation preview
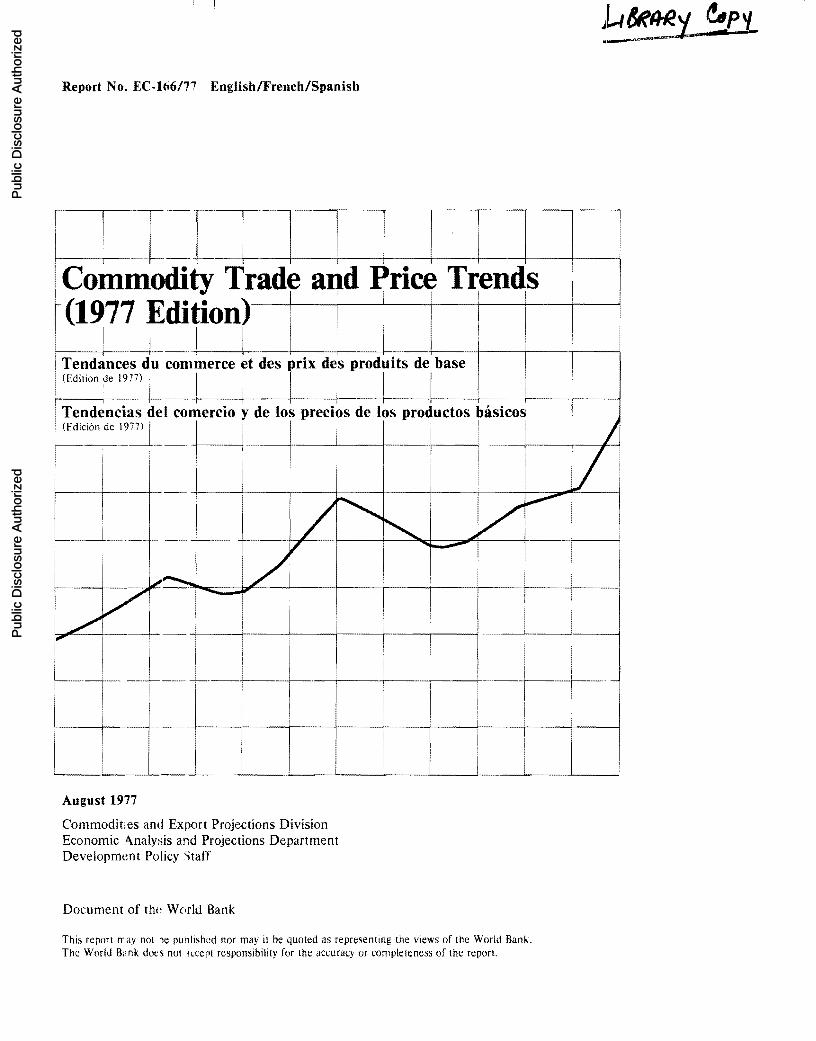
Report No. EC-lti6177 English/French/Spanish
I I [ : ] I I
I
Commodity Tradf a.,d ~rice T~en~s (1977 Edition) /' I i I I
: I -L_I r i I I ,
i ~!'~~"~d~~:~71t corncce r des rx d:S proTs del base . ~~-----i-! __ -ti __ ~ Tendencias del comercio y de los precios de los productos blisicos I
rl--·~·· -
i
I !
I
., .............
VI -
~ i I ,. I i I
!
I
I I i
August 1977
Commodities and Export Projections Division Economic Analysis and Projections Department Development Policy Staff
Document of tht: World Bank
I I I
I I
i
I I
I
I I ! i
I
This report rr.ay not De pUl'llished nor may it be quoted as representing the views of the World Bank. The World Bank dOeS not lccepl responsibility for the accuracy or completeness of the report.
I
I
Pub
lic D
iscl
osur
e A
utho
rized
Pub
lic D
iscl
osur
e A
utho
rized
Pub
lic D
iscl
osur
e A
utho
rized
Pub
lic D
iscl
osur
e A
utho
rized
Pub
lic D
iscl
osur
e A
utho
rized
Pub
lic D
iscl
osur
e A
utho
rized
Pub
lic D
iscl
osur
e A
utho
rized
Pub
lic D
iscl
osur
e A
utho
rized
4
La Banque Mondlale n 'accepte aucune responsabilite quant a ['exactitude ou au caractere exhaust(f de ce rapport. En aucun cas II ne saurait etre publIe ou cite comme representant ses vues.
Este inJorme no podra publicarse ni citarse como representativo de los puntos de vista del Banco Mundial, el que no asume responsabilidad a/guna respecto a su exactitud 0 caracter exhaustivo.

PREFACE
This issue of the statistical handbook contains changes in the presentation of data and includes two new tables showing developed countries' imports of selected commodities. These changes are explained in the introduction.
The data for this issue were updated by Mesdames. Augusto and Chhabra, Miss Schneidman, Messrs. Ahuja, Helterline, Sihsobhon and Yang; coordination was done by Mrs. Bothwell.
The last edition of Commodity Trade and Price Trends (EC-166176) was published in August 1976.
Shams her Singh Chief
Commodities 'and Export Projections Division
ii
PREFACE
La presente edition de l'annuaire statistique comporte certains changements dans la presentation des donnees et comprend deux nouveaux tableaux d'importations pour certains produits de base des pays developpes. On trouvera des explications a ce sujet dans I'introduction.
Les donnees recueillies pour la presente edition ont ete mises a jour par Mmes Augusto et Chhabra, Mile Schneidman, MM. Ahuja, Helterline, Sihsobhon et Yang; Mme Bothwell a assure la coordination des travaux.
La derniere edition de "Tendances du commerce et des prix des produits de base" (EC-166176) a paru en aout 1976.
Shamsher Singh Chef de la Division des projections sur les
produits de base et les exportations
iii
PREFACIO
La presente edicion del manual estadistico registra cambios en la presentacion de los datos e inc\uye dos neuvos cuadros de importaciones de algunos productos seleccionados de paises desarrollados. Estos cam bios se explican en la introduccion.
La actualizacion de los datos para esta edicion fue realizada por las Sras. Augusto y Chhabra, la Srta. Schneidman y los Sres. Ahuja, Helterline, Sihsobhon y Yang. La Sra. Bothwell estuvo encargada da la coordinacion.
La ultima edicion de Tendencias del comercio y de los precios de los producloS btisicos (EC-166176) se publico en agosto de 1976.
Shamsher Singh Jefe
Division de Productos Bisicos y Proyecciones de las Exportaciones
iv
T ABLE OF CONTENTS
(The statistical data precede each chart.)
I. INTRODUCTION
Economic Classes and Regions
Standard International Trade Classification for Selected Commodities
Conventiohal Symbols Employed
II. TRADE
(a) General-Developing and Developed Countries
Value of Primary Commodities and Manufactures as a Percentage of Total Exports, 1960, 1970 and 1975
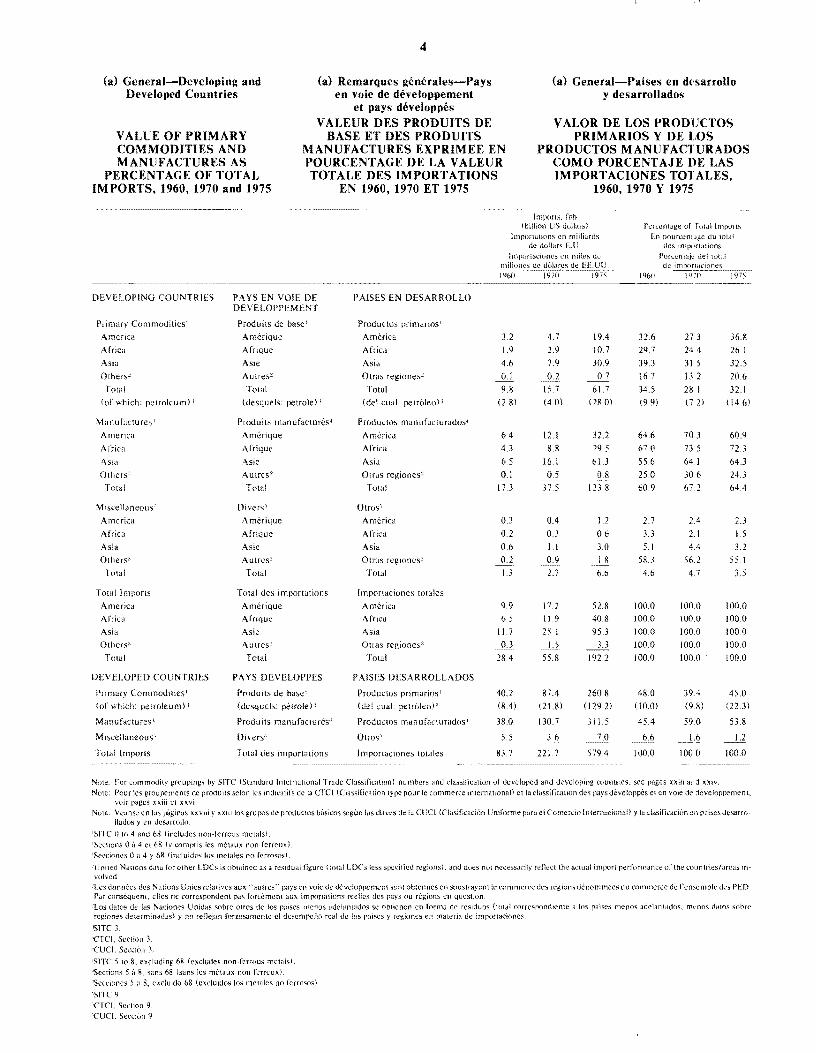
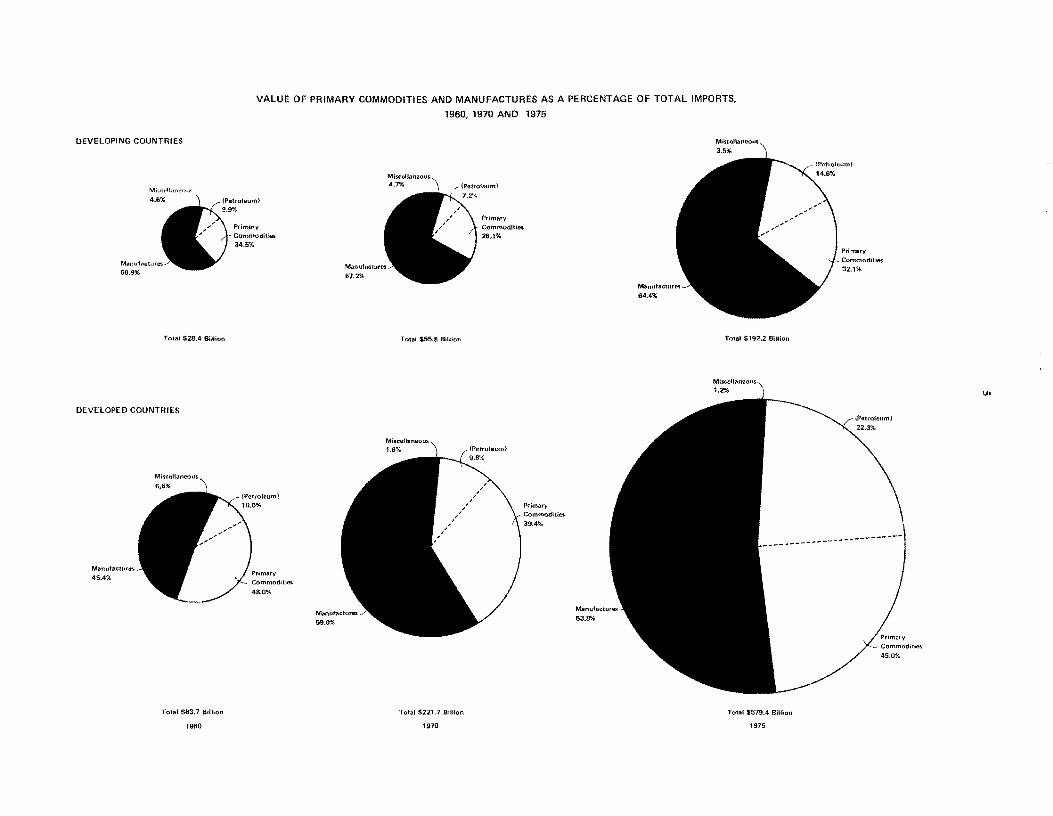
Value of Primary Commodities and Manufactures as a Percentage of Total Imports, 1960, 1970 and 1975
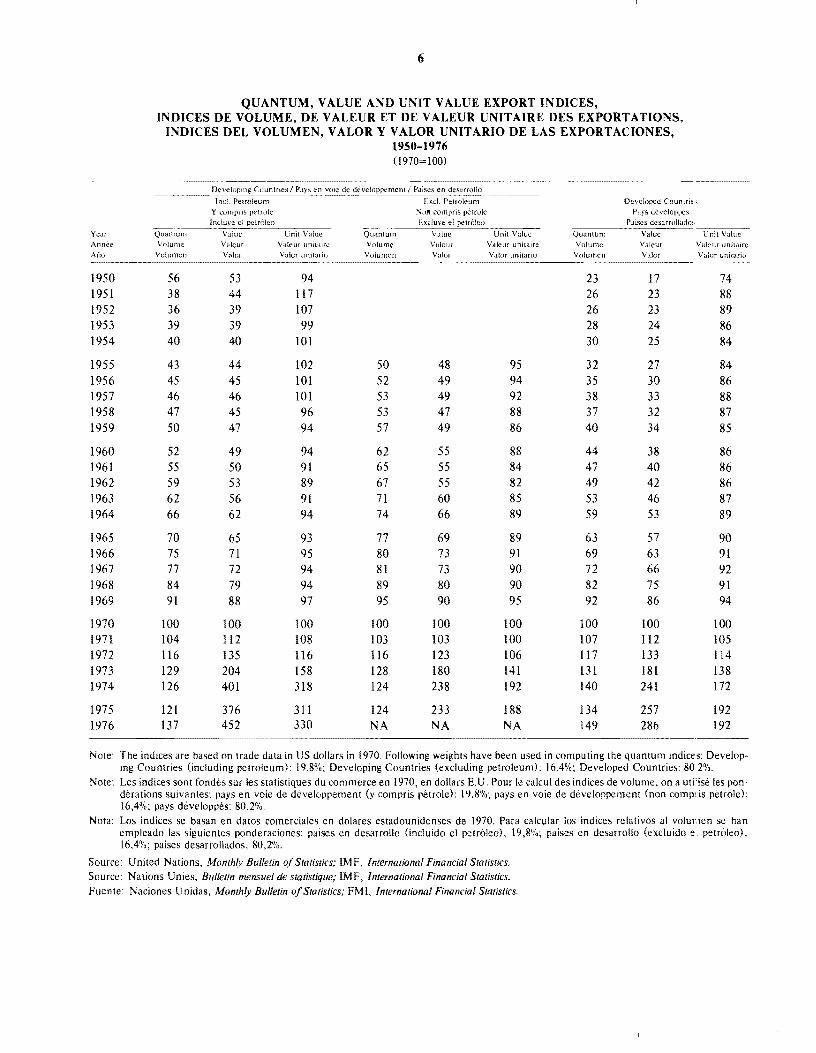
Quantum, Value & Unit Value Export Indices, 1950-76
Terms of Trade, 1950-1976
Value Indices of Direction of Exports, 1950-1976
Market Shares of World Trade by Economic Classes, 1950·1976 (Percent)
(b) Exports of the Developing Countries
Value of Exports of Principal Commodities, 1960-1975
Index Numbers of Volume of Exports of Principal Commodities, 1960-1975
(c) Commodity/Country Matrix of Exports of Selected Primary Commodities from Developing Countries, Value, Average Calendar 1973-1975
Country Share of World Commodity Exports
Commodity Share of Country Exports
(d) Imports of the Developed Countries
Developed Countries' Imports of Selected Commodities from Developing Countries and the World, 1970 0,000 Metric Tons}
Developed Countries' Imports of Selected Commodities from Developing Countries and the World, 1970 (Million US Dollars, c.i.f.)
Page No.
xvii
xxiii
xxiv
xxx
2&3
4&5
6&7
8&9
10&11
12
13 & 14
15 & 16
17 & 18
19 & 20
21 & 22
23
24
III. PRICE ANn FREIGHT RATE INDICES
Selected Price Indices
Price Indices of GDP at Market Prices: OECD: Total OECD: Europe United States
US General Wholesale Price Index Prices of Manufactures
Ocean Freight Rates and Indices, 1955·1977
IV. PRICES
AGRICUL TURAL PRODUCTS
. Beverages
Cocoa, Accra, spot New York
Coffee, Mams, spot New York Coffee, Guatemalan Prime Washed, spot New York Coffee, Santos 4, spot New York Coffee, Ambriz 2AA, spot New York
Tea, Sri Lanka, London Auction Tea, Northern India, London Auction Tea, Kcmya, London Auction Tea, Average All Tea, London Auction
Cereals
Wheat, US, Soft Red Winter Wheat. Canadian, Western Red Spring
Rice, lhai, f.o.b. Bangkok Rice, Burmese, government contract Rice, liS, f.o.b. mill
Maize, Argentine, c.i.f. Rotterdam Maize, US No.3, c.iJ. United Kingdom
v
25
26 & 2?
28
29
30 &.3i
32 & 33
34 & 35
36 & 37
38 & 39
40 & 41
Fibers
Cotton, US, c.Lf. Liverpool Cotton, Egyptian, c.Lf. Liverpool Cotton, Mexican, c.i.f. North Europe
Jute, White C, c.i.f. Dundee Jute, White D, f.o.b. Chittagong/Chalna
Burlap, US, spot, New York
Sisal, East African, UG, d.f. Europe Sisal, Kenya/Tanzania, c.i.f. London
Wool, 56's, Dominion, c.i.f. United Kingdom
Vegetable Oils, Oilseeds, Cakes and Meals
Copra, Philippines, c.i.f. Europe Coconut Oil, Sri Lanka, ex-tank Rotterdam
Palm Kernels, Nigerian, c.i.f. Europe Palm Oil, Malayan, c.i.f. Europe
Groundnuts, Nigerian, c.i.f. Europe Groundnut Oil, Nigerian, c.i.f. Europe
Soybeans, US, c.i.f. London/Hull Soybean Oil, any origin, c.i.f. Rotterdam Soybean Meal, US, c.i.f., Rotterdam
Linseed, Canadian No.1, c.i.f. European ports Linseed Oil, Argentine, c.i.f. Europe
Fishmeal, Peruvian, c & f Hamburg
Others
Beef, US, frozen, f.o.b. port of entry Beef, Argentina chilled, London Beef, Argentina, f.o.b. unit value of exports
Lamb, New Zealand frozen, London
Sugar, World, raw Sugar, US, preferential
Pepper, black, Co.b. New York
Bananas, Ecuador, fresh, c.i.f. Hamburg Bananas, any origin, fresh, New York
Rubber, natural, RSS I, London Rubber, natural, RSS 1, New York
Logs, Philippines, lauan, Tokyo Logs, West Africa, niangon, f.o.b. Ivory Coast
Plywood, Philippines, lauan, spot Tokyo
Sawnwood, Malayan, c.i.f. French ports
vi
42 & 43
44 & 45
46 & 47
48 & 49
50 & 51
52 & 53
54 & 55
56 & 57
58 & 59
60 & 61
62 & 63
64 & 65
66 & 67
68 & 69
70 & 71
72 & 73
74 & 75
76 & 77
78 & 79
80 & 81
NON-AGRICULTURAL PRODUCTS
Non-Ferrous Metals
Aluminum, 99-99.5% ingot, London Aluminum, 99.5%, unalloyed ingot, New York
Copper, electrolytic, London Copper, .!Iectrolytic, New York
Lead, soft pigs, London Lead, pig, desilverized, New York
Zinc, good ordinary brands, London Zinc, Prime Western grade, New York
Tin, standard, London Tin, pig, Straits, New York
Others
Petroleum, Saudi Arabian, f.o.b. Ras Tanur\l
Iron Ore, Sweden, c.i.f. Rotterdam Iron Ore, Brazil, c.i.f. North Sea ports
Steel, Germany, delivered Oberhausen Steel, US, f.o.b. mid-western points
Phosphate Rock, Morocco, fa.s. Casablanca
vii
Diammonium Phosphate (DAP), US, Lo.b. Gulf ports
Potassium Chloride, Canadian, Lo.b. Vancouver
Urea, any origain, Lo.b. Europe
82 & 83
84 & 85
86 & 87
88 & 89
90 & 91
92 & 93
94 & 95
96 & 97
98 & 99
100 & 101
102 & 103
104 & 105
viii
TABLE DES MATIERES
(Les statistiques sont indiquees avant Ie diagramme)
I. INTRODUCTION
Categories economiques et regions
Classification type pour Ie commerce international pour certains produits
Signes conventionnels utilises
II. COMMERCE
(a) Remarques generales-Pays en voie de developpement et.pays developpes
Valeur des produits de base et des produits manufactures exprimee en pourcentage de la valeur totale des exportations en 1960, 1970 et 1975
Valeur des produits de base et des produits manufactures exprimee en pourcentage de la valeur totale des importations en 1960, 1970 et 1975
Indices de volume, de valeur et de valeur unitaire des exportations, 1950-1976
Termes de l'echange, 1950-1976
Indices de valeur des courants d'exportations mondiales, 1950-1976
Parts du marche du commerce mondial par categories economiques, 1950-1976 (en pourcentage)
(b) Exportations des pays en voie de developpement
Valeur des exportations des principaux produits de base, 1960-1975
Nombres-indices du volume des exportations des principaux produits de base, 1960-1975
(c) Matrice des exportations de quelques produits de base en provenance des pays en voie de developpement, par produits de base et par pays, valeur moyenne au cours de la periode 1973-75
Part du pays dans les exportations mondiales de produits de base
Part du produit dans les exportations de pays
(d) Importations par les pays industrialises
Importations par les pays industrialises de produits de base en provenance de pays en developpement et de \'ensemble du monde, 1970 (milliers de tonnes metriques).
Importations par les pays industrialises de produits de base en provenance de pays en developpement et de l'ensemble du monde, 1970 (millions de dollars E.U., c.a.f.)
Page No.
xix
xxiii
xxvi
xxx
2&3
4&5
6&7
8&9
10 & II
12
13 & 14
15 & 16
17 & 18
19 & 20
21 & 22
23
24
III. INDICES DES PRIX ET DES TAUX DE FRET
Indices de prix selectionnes
Indices des prix du PIB aux prix du marche: OCDE: Total OCDE: Europe Etats-Unis
Indice general des prix de gros des E.U. Prix des produits manufactures
ix
Taux de fret et indices des taux de fret par voie maritime, 1955-1977
IV. PRIX
PRODUITS AGRICOLES
Boissons
Cacao, Accra, comptant New Yark
Cafe, Mams, comptant New York Cafe, g1;.atemalien, lave, qualite "Prime", comptant New York Cafe, Santos 4, comptant New York Cafe, Ambriz 2AA, comptant New York
The, Sri Lanka, encheres Londres The, lode du Nord, encheres Londres The, Kenya, encheres Londres The, Malawi. encheres Londres
cereales
Ble, E.1 ., "Soft Red Winter" Ble, canadien "Western Red Spring"
Riz, thallandais, f.o.b. Bangkok Riz, birman, contrats avec l'Etat Riz, E.lI., f.o.b. usine
Ma'is, argentin, c.a.f. Rotterdam Miis, E U. No 3, c.a.f. Royaume-Uni
25
26 & 27
28
29
30 & 31
32 & 33
34 & 35
36 & 37
38 & 39
40 & 41
Fibres
Coton, E.U., c.aJ. Liverpool Coton, egyptien, c.aJ. Liverpool Coton, mexicain, c.a.f. Nord de I'Europe
Jute. "White C", c.a.f. Dundee Jute, "White D", f.o.b. Chittagong/Chalna
Toile de Jute, E.U., comptant New York
Sisal, est-africain, UG, c.a.f. Europe Sisal, Kenya/Tanzanie, c.aJ. Londres
Laine, 56, Dominion, c.aJ. Royaume-Uni
x
Huiles vegetales, graines oieagineuses, tourteaux et rnoulus
Copra, philippin, c.a.f. Europe Huile de coco, Sri Lanka, depart reservoir Rotterdam
Palmistes, nigerians, c.aJ. Europe Huile de palme. malaisienne, c.a.f. Europe
Arachides, nigerians, c.aJ. Europe Huile d'arachide, nigerians, c.a.f. Europe
Graines de soja, americaines, c.aJ. Londres/Hull Huile de soja, lOute origine, c.aJ. Rotterdam Farine de soja, E.U., c.a.f. Rotterdam
(imine de lin, canadienne, c.aJ. ports europeens Huile de graine de lin, argentine, c.a.f. Europe
Farine de poisson., peru vie nne, c & f Hambourg
Divers
Boeuf, congele, E.U., f.o.b. port d'entree Boeuf, argentine frigorifie, Londres Boeuf, argentine, valeur unitaire f.o.b.
Agneau, neo-zelandais congeie, Londres
Sucre, mondial, brut Sucre, E.U. preferentiel
Poivre, noir, f.o.b. New York
Bananes, equateur, frruches, c.aJ. Hambourg Bananes, toute origine, fra1ches, New York
Caoutchouc, naturel, RSS 1, Londres Caoutchouc, naturel, RSS 1, New York
Bois en grumes, lauan Philippines, Tokyo Bois en grumes, Niangon, f.o.b. Cote d'Ivoire
Bois contre-plaque, lauan Philippines, comptant Tokyo
Bois de sciage, malaisienne, c.a.f. port fran~ais
42 & 43
44 & 45
46 & 47
48 & 49
50 & 51
52 & 53
54 & 55
56 & 57
58 & 59
60 & 61
62 & 63
64 & 65
66 & 67
68 & 69
70 & 71
72 & 73
74 & 75
76 & 77
78 & 79
80 & 81
PRODUITS NON AGRICOLES
Metaux non ferreux
Aluminium, 99-99,5%, \ingots, Londres Aluminium, lingots locaux purs, 99,5%, New York
Cuivre, electrolytique, Londres Cuivre, electrolytique, New York
Plomb, mou, en saumons, Londres Plomb, en saumons, desargente, New York
Zinc, bonnes marques ordinaires, Londres Zinc, "Prime Western" grade, New York
Etain, stmdard, Londres Etain, en saumons, Insulinde, New York
Divers
Petrole, Arabie Saoudite, f.o.b. Ras Tanura
Minerai tie fer, Suede, c.aJ. Rotterdam Minerai tie fer, Bresil, c.aJ. ports de la Mer du Nord
Acier, Allemagne, rendu Oberhausen Acier, E.U., f.o.b. Etats du centre des Etats-Unis
Phosphate natureL Maroc, f.a.s. Casablanca
xi
Phosphates ammoniacaux, f.o.b. ports du Golfe du Mexique, Etats-Unis
ChLorure de potasse, canadienne, f.o.b. Vancouver
Uree, toute origine, f.o.b. Europe
82 &83
84 & 85
86 & 87
88 & 89
90 & 91
92 & 93
94 & 95
96 & 97
98 & 99
100 & 101
102 & 103
104 & 105
xii
INDICE
(Los datos estadisticos preceden a cada grafico)
I. INTRODUCCION
Categorias econ6micas y regiones
Clasificaci6n uniforme para el comercio internacional, para productos seleccionados
Signos convencionales utilizados
II. COMERCIO
(a) Generalidades-paises en desarrollo y desarrollados
Valor de los productos primarios y de los productos manufacturados como porcentaje de las exportaciones totales, 1960, 1970 y 1975
Valor de los productos primarios y de los productos manufacturados como porcentaje de las importaciones totales, 1960, 1970 y 1975
Indices del volumen, valor y valor unitario de las exportaciones, 1950-1976
Relacion de intercambio, 1950-1976
Indices de valores de la corriente de exportaciones mundiales, 1950-1976
Participaciones de los mercados en el comercio mundial, por categorias economicas, 1950-1976 (porcentaje)
(b) Exportaciones de los paises en desarrollo
Valor de las exportaciones de los principales productos basicos, 1960-1975
Numeros indices de volumenes de exportaci6n de los principales productos basicos, 1960-1975
(c) Matriz de producto basico/pais de las exportaciones de productos primarios seleccionados de los paises en desarrollo, valor en el ano natural de 1973-75
Proporci6n del pais en las exportaciones mundiales del producto basico
Proporcion del producto basico en las exportactiones del pais
(d) Importaciones de paises desarrollados
Importaciones de productos seleccionados de paises en desarrollo y del mundo efectuadas por paises desarrollados, 1970 (miles de toneladas metricas).
Importaciones de productos sleeccionados de paises en desarrollo y del mundo efectuadas por paises desarrollados, 1970 (millones de US$, c.LO
Pagina No.
xxi
xxiii
xxviii
xxx
1
2 y 3
4 Y 5
6y7
8y9
10 y 11
12
13 Y 14
15 y 16
17 y 18
19 y 20
21 y 22
23
24
III. INDICES DE PRECIOS Y DE FILETES
Indices de precios seleccionados
Indices de precios del PUB a precios de mercado: OCDE: Total OCDE: Europa Estados U nidos
xiii
Indice general de precios al por mayor de los Estados Unidos Precios de los productos manufacturados
Fletes maritimos e indices de fletes maritimos, 1955-1977
IV. PRECIOS
PRODUCTOS AGROPECUARIOS
Bebidas
Cacao, Accra, precio inmediato, N ueva York
Cafe, Mams, precio inmediato, Nueva York Cafe, guatemalteco, precio inmediato, Nueva York Cafe, Santos 4, precio inmediato, Nueva York Cafe, Ambnz 2 AA, precio inmediato, Nueva York
Te, Sri Lanka, subasta de Londres Te, Norte de India, subasta de Londres Te, Kenya, subasta de Londres Te, Malawi, subasta de Londres
Cereales
Trigo, ~E.CU., "Soft Red Winter" Trigo, ,,;anadiense "Western Red Spring",
Arroz, tailandes. f.o.b. Bangkok Arroz, birmano. contrato del gobierno Arroz, EE.CU., f.o.b. molino
Maiz, agemino, c.i.f. Rotterdam Maiz, EE.UU. No.3, c.i.f. Reino Unido
25
26 y 27
28
29
30 y 31
32 y 33
34 y 35
36 y 37
38 y 39
40 y 41
Fibras
Algodon, EE.UU., c.i.f. Liverpool Algodon, egipcio, c.i.f. Liverpool Algodon, mexicano, c.i.f. Liverpool
Yute, "Blanco e", c.i.f. Dundee Yute, "Blanco D", f.o.b. Chittagong/Chalna
xiv
Tela de Yute, EE.lJU., precio al contado, Nueva York
Sisal, East African U.G., c.i.f. Europa SisaL Kenya/Tanzania, c.i.f. Londres
Lana, 56, Dominion, c.i.f. Reino Unido
Aceites vegetates, semillas oteaginosas, tortas y harinas
Copra. filipina, c.i.f. Europa Aceite de coco, Sri Lanka, salida deposito Rotterdam
Pepitas de palma. nigerianas, c.i.f. Europa Aceite de palma, malayo, c.i.f. Europa
Mani, nigeriano, c.i.f. Europa Aceite de man!' nigeriano, c.i.f. Europa
Soja, americana, c.i.f. Londres/Hull Aceite de soja, cualquier origen, c.i.f. Rotterdam Harina de soja, US, c.i.f. Rotterdam
Linaza, canadiense No.1, c.i.f. puertos europeos Aceite de linaza, argentino, c.i.f. Europa
Haiina de pescado, peruana, c. y f. Hamburgo
Varios
Carne de vacuno congelada, EE.UU., f.o.b. puerto de entrada Carne de vacuno refrigerada, argentina, Londres Carne de vacuno, argentina, valor unitario f.o.b.
Carne de ovino, congelada, Nueva Zelandia, Londres
Azucar, mundial, no refinada Azucar, precio preferencial de los EE.lJU.
Pimienta, negra, f.o.b. Nueva York
Bananos, frescos, cuaiquier origen, Nueva York Bananos, Ecuador, frescos, c.iJ. Hamburgo
Caucho, natural, RSS 1, Londres Caucho, natural, RSS 2, Nueva York
Troncos, iauan, Filipinas, Tokyo Troncos, Niangon, f.o.b. Costa de Marfil
Madera terciada, Filipinas, precio inmediato Tokyo
Madera aserrada, malayo, c.iJ. puertos franceses
42 y 43
44 y 45
46 y 47
48 y 49
50 y 51
52 y 53
54 y 55
56 y 57
58 y 59
60 y 61
62 y 63
64 y 65
66 y 67
68 y 69
70 y 71
72 y 73
74 y 75
76 y 77
78 y 79
80 y 81
PRODUCTOS NO AGROPECUARIOS
Metales no ferrosos
Aluminio, lingotes de 99-99,5%, Londres Aluminio, Iingotes puros, 99,5%, Nueva York
Cobre, electrolitico, Londres Cobre, t~lectrolitico, Nueva York
Plomo, en galapagos, suave, Londres Plomo, en galapagos, desplatado, Nueva York
Zinc, buenas clases orginarias, Londres Zinc, "Prime Western grade", Nueva York
Estano, estandar, Londres Estano, en galapagos, "Straits", Nueva York
Varios
Petroleo, de Arabia Saudita, Lo.b. Ras Tanura
Mineral de hierro, Suecia, c.iJ. Rotterdam
xv
Minerai de hierro, Brasil, c.iJ. puertos del Mar del Norte
Acero, Alemania, entrega Oberhausen Acero, EE.lU., Lo.b. lugares del medio-oeste
Fosfori':a, Marruecos, f.a.s. Casablanca
Fosfato diamonico, EE.UU., f.o.b. puertos del Golfo de Mexico
Clorurc· de potasio, canadiense, fo.b. Vancouver
Urea, cualquier origen, f.o.b. Europa
82 y 83
84 y 85
86 y 87
88 y 89
90 y 91
92 y 93
94 y 95
96 y 97
98 y 99
100 y 101
102 y 103
104 y'105

xvi
I. INTRODUCTION
I. Introduction
I. Introduccion
xvii
I. INTRODUCTION
1. The purpose of this handbook is to present factual historical information on the export trade of the developing countries and 72 market price quotations for 44 commodities which figure importantly in international trade. These data are presented in Sections II and IV.
2. Seetion II of this edition includes trade matrices for the period 1973-75 average which are complementary to the matrices for the years 1972-74 average given in the 1976 edition. The table of developing countries' value of exports of principal commodities has been updated through 1975 whereas the earlier years 1950-59 have been deleted. The table of index numbers of developing countnes' export volumes for these same commodities has been updated through 1975 as welL Two new tai)les have been added showing the developed countries' imports of selected commodities in both volume and value for the year 1970 from the developing countries and the world.
3. D~ ve10ping countries' exports as well as their imports of primary commodities and manufactures for the years 1960, 1970 and 1975 have been shown by regions to enable the reader to form a broad idea ()f trade and industrial development in different developing areas of the world. C omparahie data for the developed countries are also shown.
4. It will be noted in Section IV that actual current dollar prices and 1975 constant dollar prices for the pe-iod 1950-1976 (with partial information for 1977) are shown in both tabular and graphic form i 1 order to indicate the movement of commodity prices relative to the international price level. Also. for some commodities more than one price series is shown. There are ba:sically two reasom for this. In some cases, there are different grades or varieties of a commodity (e.g. coffee. tea and catIOn) which have a substantial price differential. In other cases, trade barriers Of industry practices h,lve resulted in isolating the two principal commodity markets, the lJ nired States and Western Emope, from each other for the same variety or grade (e.g. non-ferrous meLals).
5. To facilitate comparability, all commodity prices are shown in a single currency, the US dollar. These prices are presented in both current or nominal dollars as well as in terms of 1975 (onstant or real dollars. deflated by the c.Lf. index of prices of developed countries' manufm:tured exports to all destinations which appears on page 26. The deflated prices shown represent all approximation of the true purchasing power of primary commodities over the 1950-\976 period.
6. Section III of the report shows a selected set of general price indices that can be used as denators. These include the US General Wholesale Price Index, the Index of International Prices on both FOB and CIF bases, the US GOP Implicit Deflator and the OECD GDP Implicit Deflator, as well as the GOP Implicit Deflator for Europe. These series are widely used as deflators to eliminate the effect of changes in the general price level over time. The re:sul ling adjusted price series is often referred to as a "relative", "constant" or "real" price. The actual price and the detlated price in any designated base year (e.g. 1975 100) would be identicaL
7. Selected data on ocean freight rates are also shown in Section III, since most of the price series are based on c.i.f. quotations at the major consuming markets. Although the freight element in e1.f.
xviii
prices varies greatly among the different commodities, it is ordinarily not more than approximately 10 percent of the c.i.f. value for most of the commodities shown.
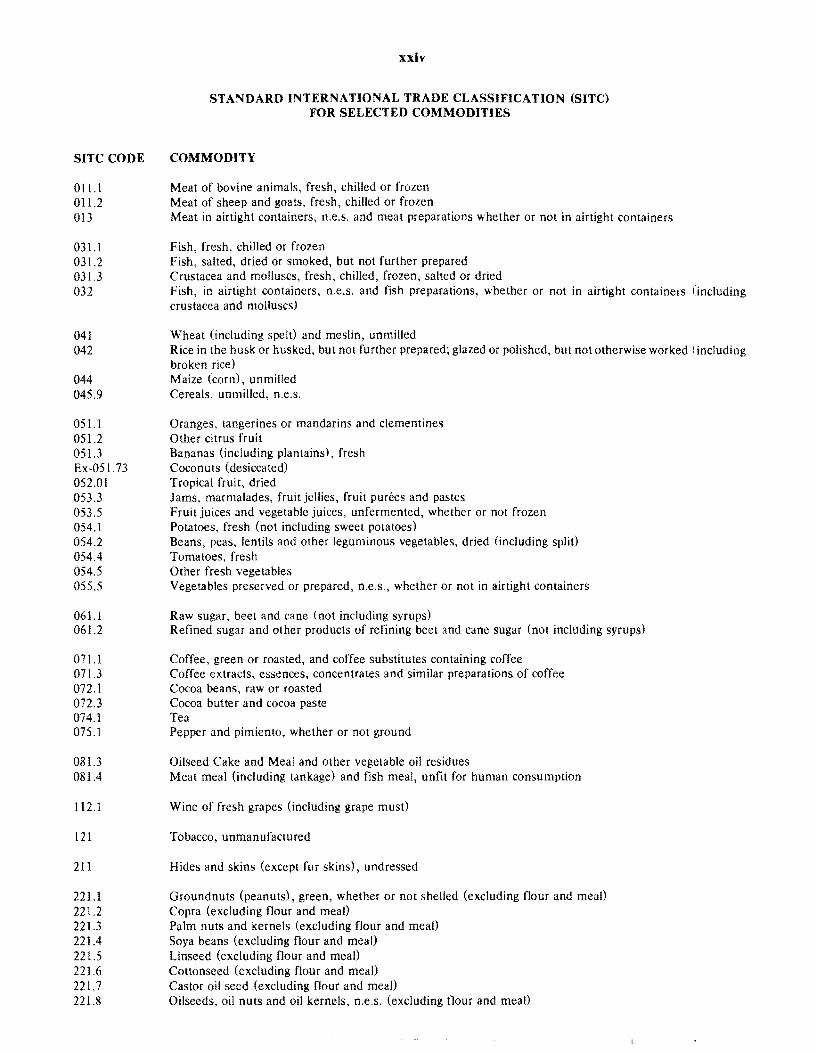
8. The economic classification of countries and regions and a list of the United Nations Standard International Trade Classification (SITC) codes covering the commodities listed in the trade tables follow the introduction.
xix
I. INTRODUCTION
1. Cet annuaire a pour objet de fournir des donnees historiques sur les tendances du commerce d'exponation des pays en developpement. Les statistiques recueillies se rapportent a 72 pays et a 44 produits de base qui occupent une place importante dans Ie commerce international (voir Sections II et IV: .
2. La Section II de la presente edition comprend des matrices du commerce pour la moyenne de la periode 1973-75, qui complt!tent les matrices relatives aux annees 1972-74 parues dan l'edition de 1976. Lt! tableau de la valeur des exportations des principaux produits de base des pays en developpement a eti: mis a jour jusqu'a la fin de 1975 alors que les annees 1950 a 1959 ont ete supprimees. Le tableau des indices des volumes d'exportations des pays en developpement pour les memes produits a egalement ete mis ajour jusqu'a la fin de 1975. On a ajoute deux nouveaux tableaux qui font apparitr,~ Ie volume et la valeur des importations de certains produits provenant des pays en developpemt!nt et du monde en tier effectuees par les pays developpes en 1970.
3. Les exportations des pays en developpement, com me leurs importations de produits de base et de produits manufactures pour les annees 1960, 1970 et 1975 sont presentees par regions, pour permettre au lecteur de se faire une idee generale des echanges et de l'evolution de I'industrie dans diverses reg:ons du monde en developpement. On trouvera egalement des donnees comparables concernant les pays developpes.
4. On notera a la Section IV que les prix reels en doIlars courants et les prix de 1975 en dollars constants pour la periode 1950-1976 (avec des renseignements partie Is pour 1977) figurent sous une forme a la fois tabulaire et graphique, pour indiquer I'evolution des prix des produits de base par rapport au niveau des prix internationaux. En outre, pour certains produits, plusieurs series de prix sont intiiquees. On peut en donner deux raisons principales: dans certains cas, iI existe diverses classes ou varietes d'un produit (cafe, the, coton), dont les prix different sensiblement; dans d'autres cas .. les barrieres commerciales ou les pratiques industrielles ont entraine l'isolement, I'un de l'autre, des deux principaux marcMs de produits de base, les Etats-Unis et l'Europe occidentale, pour la meme variete ou classe de produits (par exemple, pour les metaux non ferreux).
5. Pour faciliter la comparaison, tous les prix de produits de base sont indiques en une seule monnaie, Ie doliar des Etats-Unis; en outre, ils sont presentes aussi bien en valeur courante qu'en valeurlomlnale, en valeur constante 1975 qu'en valeur reele, et ils sont ajustes d'apres I'indice c.a.f. des prix d'exportation de produits manufactures des pays developpes a toutes destinations figurant a la page 26. Les prix ajustes indiques representent une approximation du veritable pouvoir d'achat des produits de base pour la periode 1950-1976.
6. La Section III du rapport presente une serie d'indices generaux des prix qui peuvent etre utilises comme coefficients de reduction. Elle comprend notamment I'indice general des prix de gros dei Etats-Unis, I'indice des prix internationaux f.o.b. et c.a.f., le coefficient implicite de reduction dei prix du PIB des Etats-Unis, Ie coefficient implicite de reduction des prix du PIB pour les pays de ]'OCDE et Ie coefficient implicite de reduction des prix du PIB pour l'Europe. Ces series
xx
sont largement utilisees comme indices d'ajustement pour eliminer l'effet dans Ie temps des variations du niveau general des prix. Les series de prix ajustes que l'on obtient ainsi sont souvent designees par prix "relatifs", "constants" ou "reels". Les couts effectifs correspondraient ainsi, pour toute an nee de base designee (par exemple 1975 = 100), aux cours ajustes.
7. La Section III comprend egalement un choix de donnees concernant les taux de fret par voie maritime, car la piupart des series de prix sont fondees sur les prix c.a.f. des principaux marches de consommation. Bien que la part de fret entrant dans la composition des prix c.aJ. varie considerablement d'un produit it l'autre, elle n'entre generalement pas pour plus de 10 % environ dans la valeur c.aJ. de la plupart des produits recenses.
8. L'introduction est suivie d'une classification economique des pays et regions et d'une liste des codes de la Classification type pour Ie commerce international (CTC!) des Nations Unies, qui couvrent les produits de base figurant dans les tableaux.
xxi
I. INTRODUCCION
1. Este manual tiene por objeto presentar datos historicos sobre el comercio de exportacion de los paises en desarrollo y 72 cotizaciones de precios de mercado correspondientes a 44 productos basicos que desempenan papel importante en el comercio internacional. Estos datos figuran en las Secciones 11 y IV.
2. La Seccion II de la presente edici6n contiene matrices comerciales para el promedio del periodo 1973-75 que complementan las matrices correspondientes a los promedios de los anos 1972-74 presentadas en el volumen de 1976. EI cuadro de valores de los productos principales exportados por paises en desarrollo ha sido actualizado hasta 1975 y los correspondientes a los anos anteriores, 1950-59, han sido suprimidos. EI cuadro de numeros indices de volumenes de exportacion de los paises en desarrollo correspondientes a esos mismos productos tambien ha sido actualizado hasta 1975. Se han incluido dos cuadros nuevos en los que se dan las importaciones de ciertos productos por los paises desarrollados, tanto en volumen como en cantidad para el ana de 1970, procedentes de paisl~s dtsarrollados y del mundo entero.
3. Tanto las exportaciones como las importaciones de productos primarios y manufacturas de los paises en desarrollo correspondientes a 1960, 1970 y 1975 se dan por regiones de modo que ellector se puec.a for mar una idea general de la evolucion del comercio y la industria en las diversas zonas en desarrcllo del mundo. Se dan tambien datos comparativos sobre los paises desarrollados.
4. En la Secci6n IV podra observarse que los precios efectivos en dolares corrientes y los precios en d6lares constantes de 1975 para el periodo 1950-1976 (con datos parciales para 1977) se presentan tan:o en forma tabular como en grafico, a fin de ilustrar el movimiento de los precios de los productos basiros frente al nivel internacional de precios. Ademas, para algunos productos basicos, se ha incllido mas de una serie de precios, 10 cual se debe basicamente, ados razones. En algunos casos hay distintas calidades 0 variedades del mismo producto (como el cafe, el te y el algodon) que registra.n considerables diferencias de precios. En otros, las barreras comerciales 0 las practicas de la industria han dado lugar al aislamiento reciproco de los dos mercados principales de productos basicos, que son los Estados Unidos y Europa occidental, respecto de la misma caUdad 0 variedad (por ejemplo, los metales no ferrosos).
5. Para facilitar la comparaci6n, todos los precios de los productor basicos se han indicado en una sola moneda, el d61ar de los Estados Unidos. Tales precios se dan tanto en d6lares corrientes 0
nominales como en d61ares constantes 0 reales de 1975, deflactados segun el indice c.Lf. de PI ecios de las exportaciones de manufacturas de los paises desarrollados a todos los lugares de destino que aparecei en la pagina 26. Los precios deflactados que se dan representan una aproximacion del verdadero poder adquisitivo de los productos primarios en el periodo de 1950-1976.
6. En la Secci6n III del informe se da un conjunto seleccionado de indices generales de precios que pueder, emplearse como deflactores. Entre elIos estan el indice general de precios al por mayor de los Estados Unidos, el indice de precios internacionales tanto f.o.b. como c.i.f., el deflactor implicito del PIB de los Estados Unidos y el deflactor implicito del PIB establecido por la OCDE, 10 mismo
xxii
que el deflactor implicito del PIB para Europa. Estas series se utilizan ampliamente como deflactores para eliminar el efecto de los cam bios en el nivel general de los precios con el transcurso del tiempo. Las series de precios ajustados asi resultantes suelen conocerse como precios "relativos", "constantes" 0 "reales". El precio deflactado y el precio efectivo en cualquier ano base que se designe (v.gr. 1975 = 100) serian, pues, identicos.
7. En la Secci6n III figuran tam bien datos seleccionados sobre fletes maritimos, ya que en su mayor parte las series de precios se basan en cotizaciones c.i.f. en los principales mercados de consumo. Si bien la parte que corresponde a fletes en los precios c.i.f. varia considerablemente segun los distintos productos, no suele ser mas de aproximadamente el 10% del valor c.iJ. de la mayor parte de los productos estudiados.
8. A continuci6n de la Introducci6n figura la clasificaci6n econ6mica de los paises y regiones y una lista de las claves de la Clasificaci6n Uniforme para el Comercio Internacional (CUCn de las Naciones Unidas, que comprende los productos enumerados en los cuadros relativos al comercio.
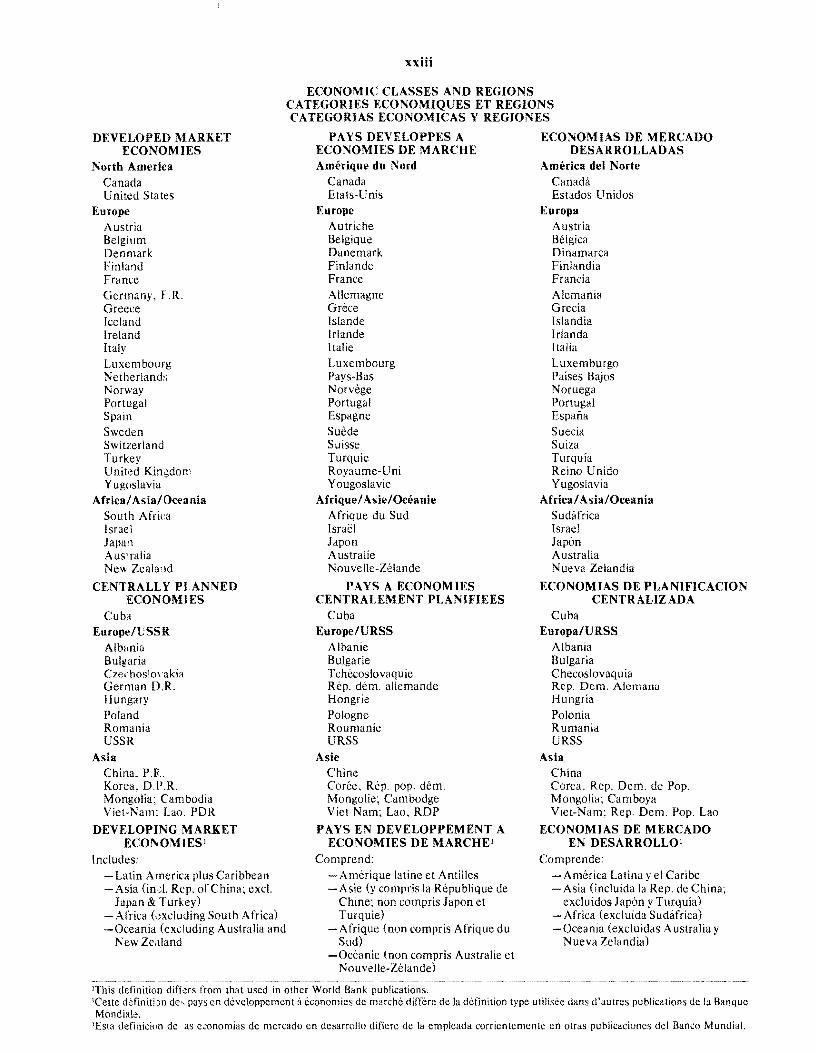
DEVELOPED MARKET ECONOMIES
North America Canada United States
Europe Austria Belgium Denmark Finland France Germany, f .R. Greece Iceland Ireland Italy Luxembourg Netherland~; Norway Portugal Spain Sweden Switzerland Turkey Unitl~d Kinsdon' Yugoslavia
Africa/ Asia/ Oceania South Africa Israel Japan Ausl.ralia New Zeala:ld
CENTRALLY PI.ANNED ECONOMIES
Cuba Europe/USSR
Albhnia Bulgaria Czechoslo\'akia German D.R. Hungary Poland Romania USSR
Asia China, P.R. Korea, D.i'.R. Mongolia; Cambodia Viet-Nam: Lao. PDR
DEVELOPING MARKET ECONOMIESl
Includes: - Latin America plus Caribbean - Asia (in.;!. Rep. of China; excl.
Japan & Turkey) Africa (\~xc!uding South Africa)
-Oceania (excluding Australia and New Ze.tland
xxiii
ECONOMIC CLASSES AND REGIONS CATEGORIES ECONOMIQUES ET REGIONS CATEGORIAS ECONOMICAS Y REGIONES
PAYS DEVELOPPES A ECONOMIES DE MARCHE Amerique du Nord
Canada Etats-Unis
Europe Autriche Belgique Danemark Finlande France Allemagne Grece Islande Irlande Italie Luxembourg Pays-Bas Norvege Portugal Espagne Suede Suisse Turquie Royaume-Uni Y ougosla vie
Afrique/ Asie/Oceanie Afrique du Sud Israel Japon Australie Nouvelle-Zelande
PAYS A ECONOMIES CENTRALEMENT PLANIFIEES
Cuba Europe/URSS
Albanie Bulgarie T c hecoslo vaq u ie Rep. dem. allemande Hongrie Pologne Roumanie URSS
Asie Chine Coree, Rep. pop. dem. Mongolie; Cambodge Viet Nam; Lao, RDP
PAYS EN DEVELOPPEMENT A ECONOMIES DE MARCHEl
Comprend: - Amerique (atine et Antilles -Asie (y compris la Republique de
Chine; non compris Japon et Turquie)
-Afrique (non compris Afrique du Sud)
-Oceanie (non compris Australie et Nouvelle-Zelande)
ECONOMIAS DE MERCADO DESARROLLADAS
America del Norte Canada Estados U nidos
Europa Austria Belgica Dinamarca Finlandia Francia Alemania Grecia Islandia Irlanda Italia Luxemburgo Paises Bajos Noruega Portugal Espana Suecia Suiza Turquia Reino Unido Yugoslavia
Africa/ Asia/Oceania SudMrica Israel Japan Australia Nueva Zelandia
ECONOMIAS DE PLANIFlCACION CENTRALIZADA
Cuba Europa/URSS
Albania Bulgaria Checoslovaquia Rep. Oem. Alemana Hungria Polonia Rumania URSS
Asia China Corea, Rep. Oem. de Pop. Mongolia; Camboya Viet-Nam; Rep. Oem. Pop. Lao
ECONOMIAS DE MERCADO EN DESARROLLOl
Comprende: - America Latina y el Caribe - Asia (incluida la Rep. de China;
excluidos Japan y Turquia) - Africa (excluida Sudafrica) -Oceania (exc!uidas Australia y
Nueva Zelandia)
lThis definition differs from that used in other World Bank publications. lCette definiti)n de, pays en developpement a economies de march€: differe de la definition type ulilisee dans d'autres publications de la Banque Mondiale.
lEsta definieilln de as e~onomias de mercado en desarrollo difiere de la empleada corrientemente en otras publicaciones del Banco Mundial.
SITC CODE
Oll.l 011.2 013
031.1 031.2 031.3 032
041 042
044 04S.9
OSl.l OS1.2 OS 1.3 Ex-OS 1.73 OS2.01 OS3.3 OS3.S OS4.1 OS4.2 OS4.4 OS4.S 055.S
061.1 061.2
071.1 071.3 072.1 072.3 074.1 075.1
081.3 081.4
112.1
121
211
221.1 221.2 221.3 221.4 221.5 221.6 221.7 221.8
xxiv
STANDARD INTERNATIONAL TRADE CLASSIFICATION (SITC) FOR SELECTED COMMODITIES
COMMODITY
Meat of bovine animals, fresh, chilled or frozen Meat of sheep and goats, fresh, chilled or frozen Meat in airtight containers, n.e.s. and meat preparations whether or not in airtight containers
Fish, fresh, chilled or frozen Fish, salted, dried or smoked, but not further prepared Crustacea and molluscs, fresh, chilled, frozen, salted or dried Fish, in airtight containers, n.e.s. and fish preparations, whether or not in airtight containers (including crustacea and mollUSCS)
Wheat (including spelt) and meslin, unmilled Rice in the husk or husked, but not further prepared; glazed or polished, but not otherwise worked lincluding broken rice) Maize (corn), unmilled Cereals, unmilled, n.e.s.
Oranges, tangerines or mandarins and clemen tines Other citrus fruit Bananas (including plantains), fresh Coconuts (desiccated) Tropical fruit, dried Jams, marmalades, fruit jellies, fruit purees and pastes Fruit juices and vegetable juices, unfermented, whether or not frozen Potatoes, fresh (not including sweet potatoes) Beans, peas, lentils and other leguminous vegetables, dried (including split) Tomatoes, fresh Other fresh vegetables Vegetables preserved or prepared, n.e.s., whether or not in airtight containers
Raw sugar, beet and cane (not including Syrups) Refined sugar and other products of refining beet and cane sugar (not including syrups)
Coffee, green or roasted, and coffee substitutes containing coffee Coffee extracts, essences, concentrates and similar preparations of coffee Cocoa beans, raw or roasted Cocoa butter and cocoa paste Tea Pepper and pimiento, whether or not ground
Oilseed Cake and Meal and other vegetable oil residues Meat meal (including tankage) and fish meal, unfit for human consumption
Wine of fresh grapes (including grape must)
Tobacco, unmanufactured
Hides and skins (except fur skins), undressed
Groundnuts (peanuts), green, whether or not shelled (excluding flour and meat) Copra (excluding flour and meal) Palm nuts and kernels (excluding flour and meal) Soya beans (excluding flour and meal) Linseed (excluding flour and meal) Cottonseed (excluding flour and mea!) Castor oil seed (excluding flour and meal) Oilseeds, oil nuts and oil kernels, n.e.s. (excluding flour and meat)
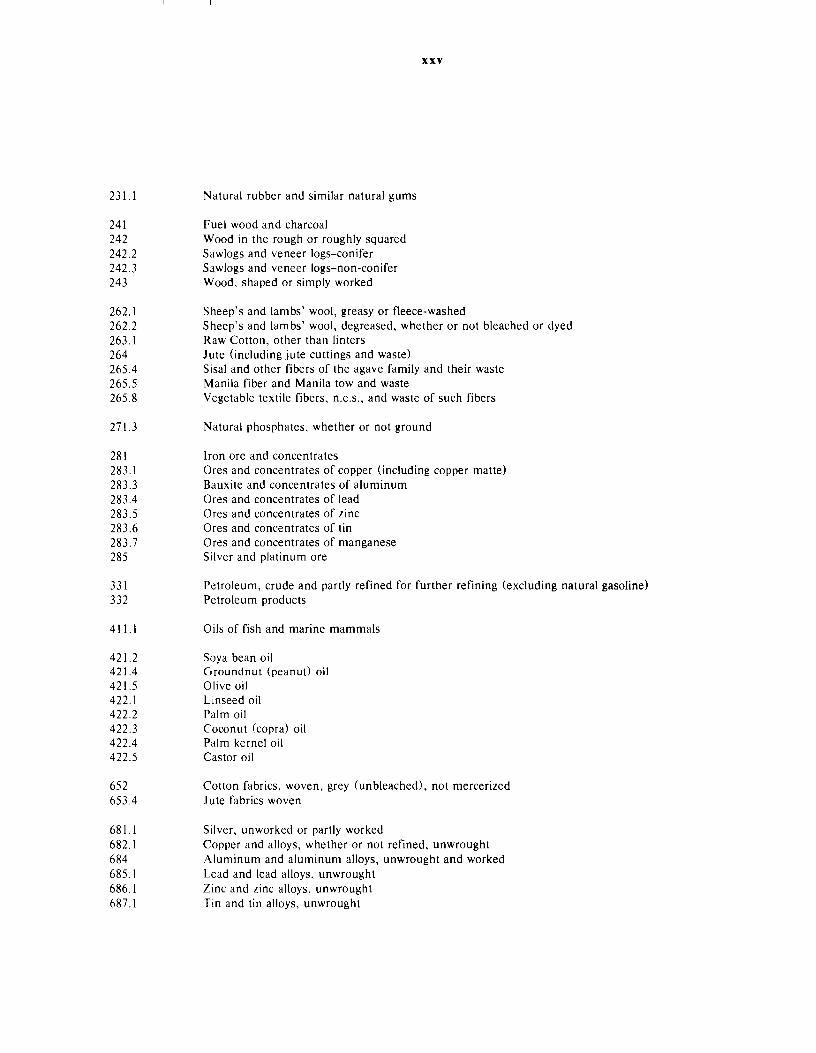
231.1
241 242 242.2 242.3 243
262.1 262.2 263.1 264 265.4 265.5 265.8
271.3
281 283.1 283.3 283.4 283.5 283.6 283.7 285
331 332
41l.l
421.2 421.4 421.5 422.1 422.2 422.3 422.4 422.5
652 653.4
681.1 682.1 684 685.1 686.1 687.1
Natural rubber and similar natural gums
Fuel wood and charcoal Wood in the rough or roughly squared Sawlogs and veneer logs-conifer Sawlogs and veneer logs-non-conifer Wood, shaped or simply worked
xxv
Sheep's and lambs' wool, greasy or fleece-washed Sheep's and lambs' wool, degreased, whether or not bleached or dyed Raw Cotton, other than linters Jute (including jute cuttings and waste) Sisal and other fibers of the agave family and their waste Manila fiber and Manila tow and waste Vegetable textile fibers, n.e.s., and waste of such fibers
Natural phosphates, whether or not ground
Iron ore and concentrates Ores and concentrates of copper (including copper matte) Bauxite and concentrates of aluminum Ores and concentrates of lead Ores and concentrates of zinc Ores and concentrates of tin Ores and concentrates of manganese Silver and platinum ore
Petroleum, crude and partly refined for further refining (excluding natural gasoline) Petroleum products
Oils of fish and marine mammals
Soya bean oil Groundnut (peanut) oil Olive oil Linseed oil Palm oil Coconut (copra) oil Palm kernel oil Castor oil
Cotton fabrics, woven, grey (unbleached), not mercerized Jute fabrics woven
Silver, unworked or partly worked Copper and alloys, whether or not refined, unwrought Aluminum and aluminum alloys, unwrought and worked Lead and lead alloys, unwrought Zinc and zinc alloys, unwrought Tin and tin alloys, unwrought
INDlCATIF CTCI
01Ll 011.2 013
031.1 031.2 031.3 032
041 042
044 045.9
05Ll 051.2 051.3 Ex-051.73 052.01 053.3 053.5 054.1 054.2 054.4 054.5 055.5
061.1 061.2
071.1 071.3 072.1 072.3 074.1 075.1
081.3 081.4
112.1
121
211
221.1
221.2 221.3
xxvi
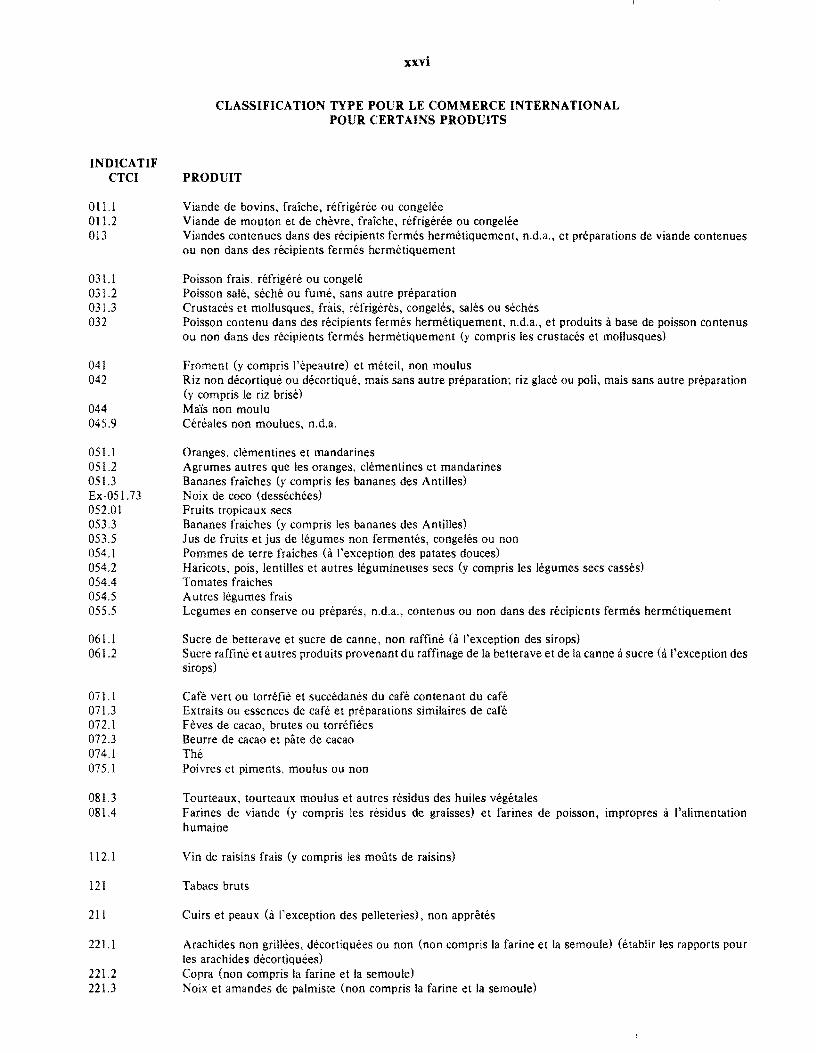
CLASSIFICATION TYPE POUR LE COMMERCE INTERNATIONAL POUR CERTAINS PRODUlTS
PRODUlT
Viande de bovins, fra'iche, refrigeree ou congeh~e Viande de mouton et de chevre, fraiche, refrigeree ou congelee Viandes contenues dans des recipients fermes hermetiquement, n.d.a., et preparations de viande contenues ou non dans des recipients fermes hermetiquement
Poisson frais, refrigere ou conge Ie Poisson sale, seche ou fume, sans autre preparation Crustaces et mollusques, frais, refrigeres, congeles, sales ou seches Poisson contenu dans des recipients fermes hermetiquement, n.d.a., et produits a base de poisson contenus ou non dans des recipients fermes hermetiquement (y compris les crustaces et mollusques)
Froment (y compris I'epeautre) et meteil, non moulus Riz non decortique ou decortique, mais sans autre preparation; riz glace ou poli, mais sans autre preparation (y compris Ie riz brise) MaYs non moulu Cereales non moulues, n.d,a.
Oranges, clemen tines et mandarines Agrumes autres que les oranges, clementines et mandarines Bananes fra'iches (y compris les bananes des Antilles) Noix de coco (dessechees) Fruits tropicaux secs Bananes fraiches (y compris les bananes des Antilles) Jus de fruits et jus de legumes non fermentes, congeles ou non Pommes de terre fraiches (a I'exception des patates douces) Haricots, pois, lentilles et autres legumineuses secs (y compris les legumes secs casses) Tomates fraiches Autres legumes frais Legumes en conserve ou prepares, n.d.a., contenus ou non dans des recipients fermes hermetiquement
Sucre de betterave et sucre de canne, non raffine (a l'exception des sirops) Sucre raffine et autres produits provenant du raffinage de la betterave et de la canne a sucre (a I'exception des sirops)
Cafe vert ou torrefie et succedanes du cafe contenant du cafe Extraits ou essences de cafe et preparations similaires de cafe Feves de cacao, brutes ou torrefiees Beurre de cacao et pate de cacao The Poivres et piments, moulus ou non
Tourteaux, tourteaux moulus et autres residus des huiles vegetales Farines de viande (y compris les residus de graisses) et farines de poisson, impropres a I'alimentation humaine
Yin de raisins frais (y compris les mofHs de raisins)
Tabacs bruts
Cuirs et peaux (a I'exception des pelleteries), non appretes
Arachides non grillees, decortiquees ou non (non compris la farine et la semoule) (etablir les rapports pour les arachides decortiquees) Copra (non compris la farine et la semoule) Noix et amandes de palmiste (non compris la farine et la semoule)
221.4 221.5 221.6 221.7 221.8
231.1
241 242 242.2 242.3 243
262.1 262.2 263.1 264 265.4 265.5 265.8
271.3
281 283.1 283.3 283.4 283.5 283.6 283.7 285
331 332
411.1
421.2 421.4 421.5 422.1 422.2 422.3 422.4 422.5
652 653.4
681.1 682.1 684 685.1 686.1 687.1
xxvii
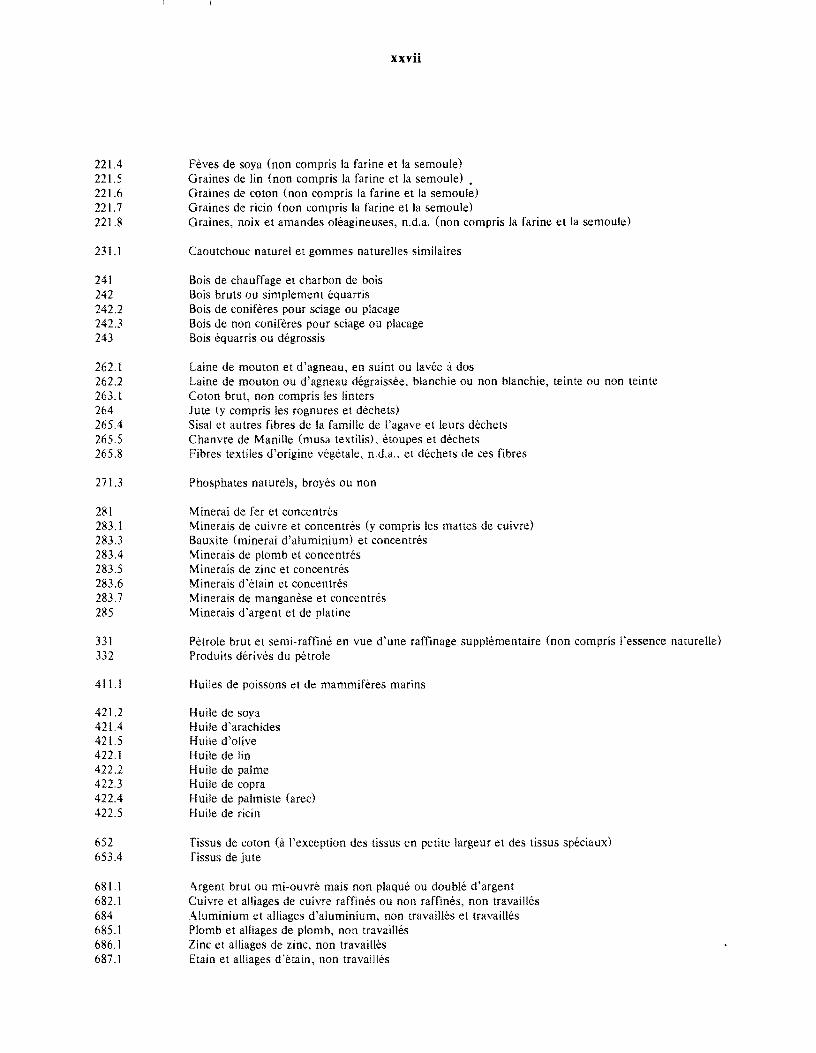
Feves de soya (non compris la farine et la semoule) Graines de lin (non compris la farine et la semoule) • Graines de coton (non compris la farine et la semoule) Graines de ricin (non compris la farine et la semoule) Graines, noix et amandes oleagineuses, n.d.a. (non compris la farine et la semoule)
Caoutchouc naturel et gommes naturelles similaires
Bois de chauffage et charbon de bois Bois bruts ou simplement equarris Bois de coniferes pour sciage ou placage Bois de non coniferes pour sciage ou placage Bois equarris ou de gross is
Laine de mouton et d'agneau, en suint ou lavee ados Laine de mouton ou d'agneau degraissee, blanchie ou non blanchie, teinte ou non teinte Coton brut, non compris les linters Jute (y compris les rognures et dechets) Sisal et autres fibres de la famille de I'agave et leurs dechets Chanvre de ManiHe (musa textilis), etoupes et dechets Fibres textiles d'origine vegetaie, n.d.a., et dechets de ces fibres
Phosphates naturels, broyes ou non
Minerai de fer et concentres Minerais de cuivre et concentres (y compris les mattes de cuivre) Bauxite (minerai d'aluminium) et concentres Minerais de plomb et concentres Minerais de zinc et concentres Minerais d'etain et concentres Minerais de manganese et concentres Minerais d'argent et de platine
Petrole brut et semi-raffine en vue d'une raffinage supplementaire (non compris I'essence nature lie) Produits derives du petrole
Huiles de poissons et de mammiferes marins
Huile de soya Huile d'arachides Huile d'olive Huile de lin Huile de palme Huile de copra Huile de palmiste (ared Huile de ricin
Tissus de coton (a l'exception des tissus en petite largeur et des tissus speciaux) fissus de jute
Argent brut ou mi-ouvre mais non plaque ou double d'argent Cuivre et alliages de cuivre raffines ou non raffines, non travailles Aluminium et alliages d'aluminium, non travailles et travailles Plomb et alliages de plomb, non travailles Zinc et alliages de zinc, non travailles Etain et alliages d'etain, non travailles
CLAVE CUCI
011.1 011.2 013
031.1 031.2 031.3 032
041 042
044 045.9
051.1 051.2 051.3 Ex-051.73 052.01 053.3 053.5
054.1 054.2 054.4 054.5 055.5
061.1 061.2
071.1 071.3 072.1 072.3 074.1 075.1
081.3 081.4
112.1
121
211
221.1 221.2 221.3 221.4 221.5 221.6
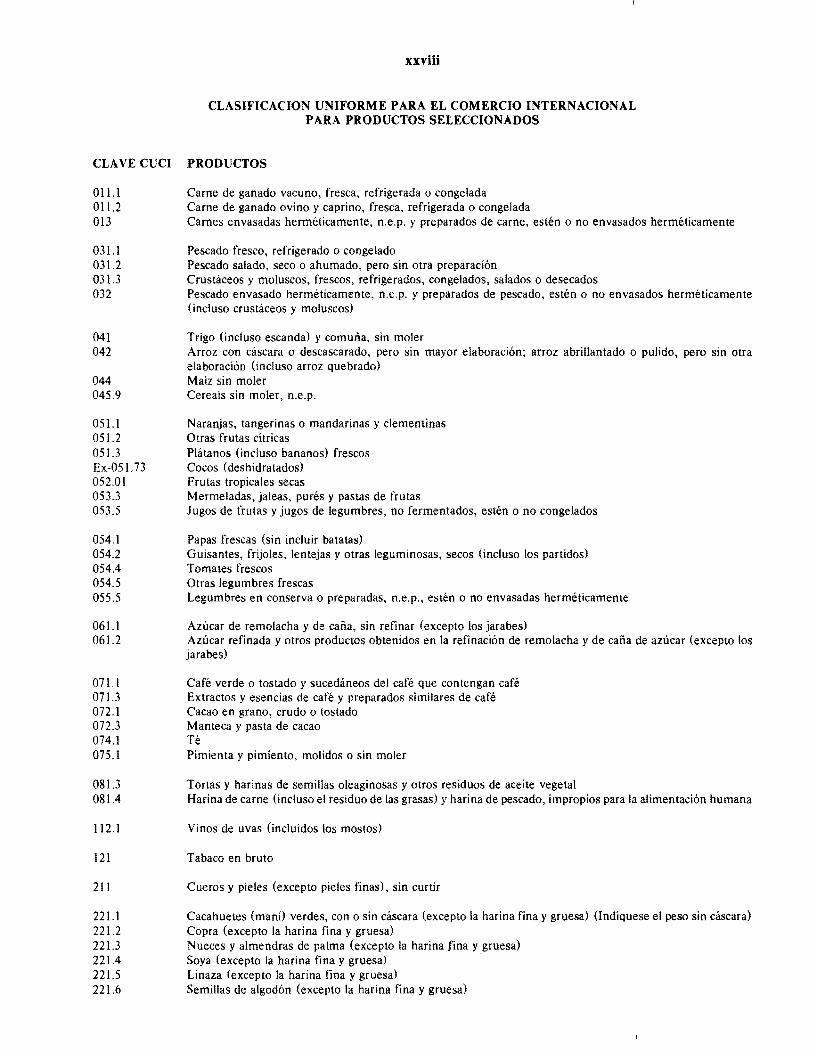
xxviii
CLASIFICACION UNIFORME PARA EL COMERCIO INTERNACIONAL PARA PRODUCTOS SELECCIONADOS
PRODUCTOS
Carne de ganado vacuno, fresca, refrigerada 0 congelada Carne de ganado ovino y caprino, fresca, refrigerada 0 congelada Carnes envasadas hermeticamente, n.e.p. y preparados de carne, esten 0 no envasados hermeticamente
Pescado fresco, refrigerado 0 congelado Pescado salado, seco 0 ahumado, pero sin otra preparacion Crustaceos y moluscos, frescos, refrigerados, congelados, salados 0 desecados Pescado envasado hermeticamente, n.e.p. y preparados de pescado, esten 0 no envasados hermeticamente (incluso crustaceos y moluscos)
Trigo (incluso escanda) y comuna, sin moler Arroz con cascara 0 descascarado, pero sin mayor elaboracion; arroz abrillantado 0 pulido, pero sin otra elaboracion (incluso arroz quebrado) Maiz sin moler Cereals sin moler, n.e.p.
Naranjas, tangerinas 0 mandarinas y c1ementinas Otras frutas citricas Plata nos (inciuso bananos) frescos Cocos (deshidratados) Frutas tropicales secas Mermeladas, jaleas, pures y pastas de frutas lugos de frutas y jugos de legumbres, no fermentados, esten 0 no congelados
Papas frescas (sin incluir batatas) Guisantes, frijoles, lentejas y otras leguminosas, secos (incluso los partidos) Tomates frescos Otras legumbres frescas Legumbres en conserva 0 preparadas, n.e.p., esten 0 no envasadas hermeticamente
Azucar de remolacha y de cana, sin refinar (excepto los jarabes) Azucar refinada y OtTOS productos obtenidos en la refinacion de remolacha y de cana de azucar (excepto los jarabes)
Cafe verde 0 tostado y sucedaneos del cafe que contengan cafe Extractos y esencias de cafe y preparados simi lares de cafe Cacao en grano, crudo 0 tostado Manteca y pasta de cacao Ie Pimienta y pimiento, molidos 0 sin moler
Tortas y harinas de semillas oleaginosas y otros residuos de aceite vegetal Harina de carne (incluso el residuo de las grasas) y harina de pescado, impropios para la alimentaci6n humana
Vinos de uvas (incluidos los mostos)
Tabaco en brute
Cueros y pieles (excepto pieles finas), sin curtir
Cacahuetes (mani) verdes, con 0 sin cascara (excepto la harina fina y gruesa) (Indiquese el peso sin cascara) Copra (excepto la harina fina y gruesa) Nueces y almendras de palma (excepto la harina [ina y gruesa) Soya (excepto la harina fina y gruesa) Linaza (excepto la harina fina y gruesa) Semi lias de algodon (excepto la harina fina y gruesa)
CLAVE CUCI
221.7 221.8
231.1
241 242 242.2 242.3 243
262.1 262.2 263.1 264 265.4 265.5 265.8
271.3
281 283.1 283.3 283.4 283.5 283.6 283.7 285
331 332
411.1
421.2 421.4 421.5 422.1 422.2 422.3 422.4 422.5
652 653.4
681.1 682.1 684 685,1 686.1 687.1
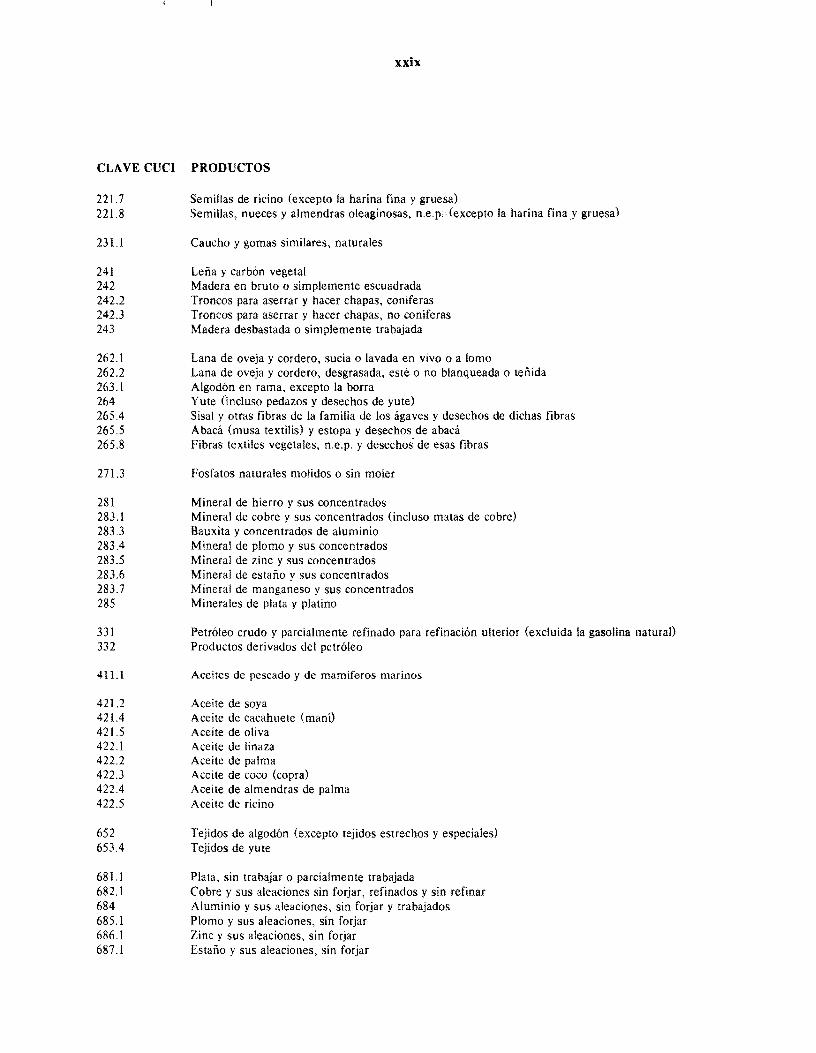
xxix
PRODUCTOS
Semillas de ricino (excepto la harina fina y gruesa) Semillas, nueces y almendras oleaginosas. n.e.po(excepto la harina finay gruesa)
Caucho y go mas simi/ares, naturales
Lena y carbon vegetal Madera en bruto 0 simple mente escuadrada Troncos para aserrar y hacer chapas, coniferas Troncos para aserrar y hacer chapas, no coniferas Madera desbastada 0 simplemente trabajada
Lana de oveja y cordero, sucia 0 lavada en vivo 0 a lomo Lana de oveja y cordero, desgrasada, este 0 no blanqueada 0 tenida Algodon en rama, excepto la borra Yute Oncluso pedazos y desechos de yute) Sisal y otras fibras de la familia de los agaves y desechos de dichas fibras Abaca (musa textilis) y estopa y desechos de abaca Fibras textiles vegetales, n.e.p. y desechos de esas fibras
Fosfatos naturales molidos 0 sin moter
Mineral de hierro y sus concentrados Mineral de cobre y sus concentrados (incluso matas de cobre) Bauxita y concentrados de aluminio Mineral de plomo y sus concentrados Mineral de zinc y sus concentrados Mineral de estano y sus concentrados Mineral de manganeso y sus concentrados Minerales de plata y platino
Petroleo crudo y parcialmente refinado para refinaeion ulterior (exc!uida la gasolina natural) Productos derivados del petroleo
Aceites de pescado y de mamiferos marinos
Aceite de soya Aceite de cacahuete (man\) Aceite de oliva Aceite de Iinaza Aceite de palma Aceite de coco (copra) Aceite de almendras de palma Aceite de rieino
Tejidos de algodon (excepto tejidos estrechos y espeeiales) Tejidos de yute
Plata, sin trabajar 0 pareialmente trabajada Cobre y sus aleaeiones sin forjar, refinados y sin refinar Aluminio y sus aleaciones, sin forjar y trabajados Plomo y sus aleaciones, sin [orjar Zinc y sus aleaciones, sin forjar Estano y sus aleaciones, sin forjar
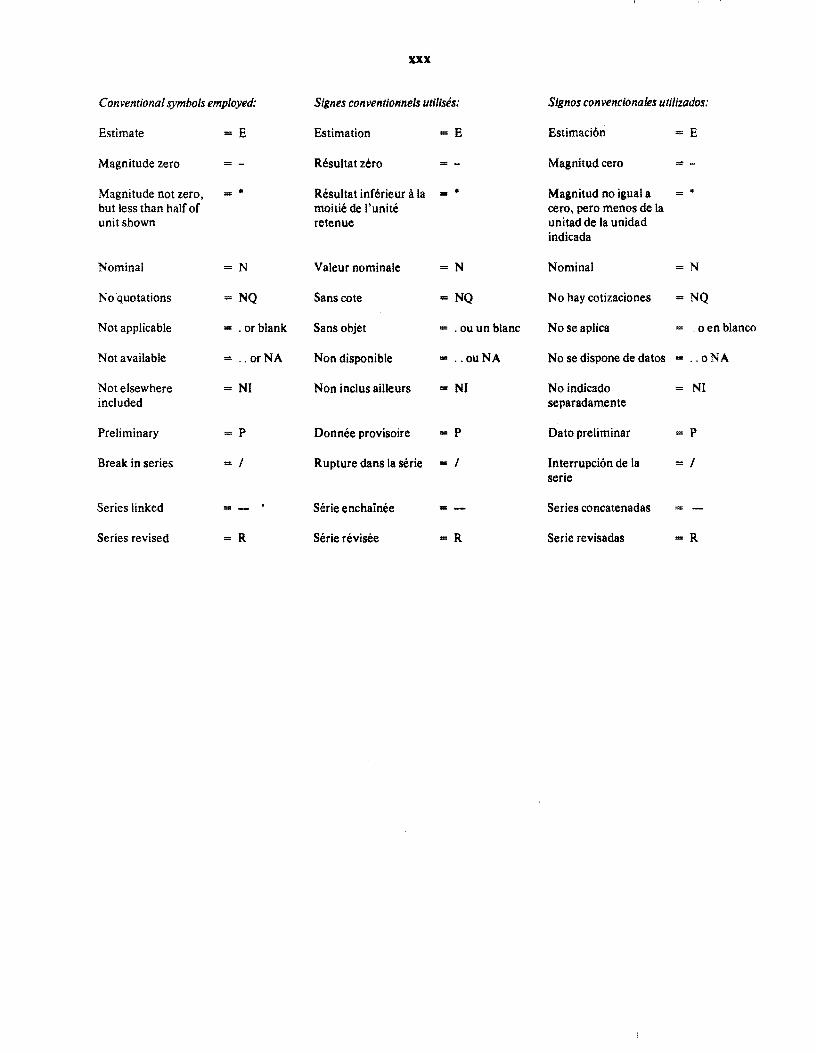
XXX
Conventional symbols employed: Signes convent/onnels utilises: Signos convenc/onates utilizados:
Estimate = E Estimation =E Estimacion = E
Magnitude zero Resultat zero = - Magnitud cero
Magnitude not zero, • Resultat inferieur Ii. la • Magnitud no igual a but less than half of moitie de I'unite cero, pero menos de la unit shown retenue unitad de la unidad
indicada
Nominal N Valeur nominale =N Nominal =N
No quotations NQ Sans cote = NQ No hay cotizaciones = NQ
Not applicable . or blank Sans objet . ou un blanc No se aplica _ oen blanco
Not available .. 0rNA Non disponible = .. ouNA No se dispone de datos .. oNA
Not elsewhere == NI Non inclus ailJeurs .. NI No indicado NI included separadamente
Preliminary P Donnee provisoire == P Dato preliminar P
Break in series I Rupture dans la serie I Interrupcion de la I serie
Series linked Serie enchainee == - Series concatenadas
Series revised = R Serie revisee =R Serie revisadas R
1
II. TRADE
II. Commerce
II. Comercio
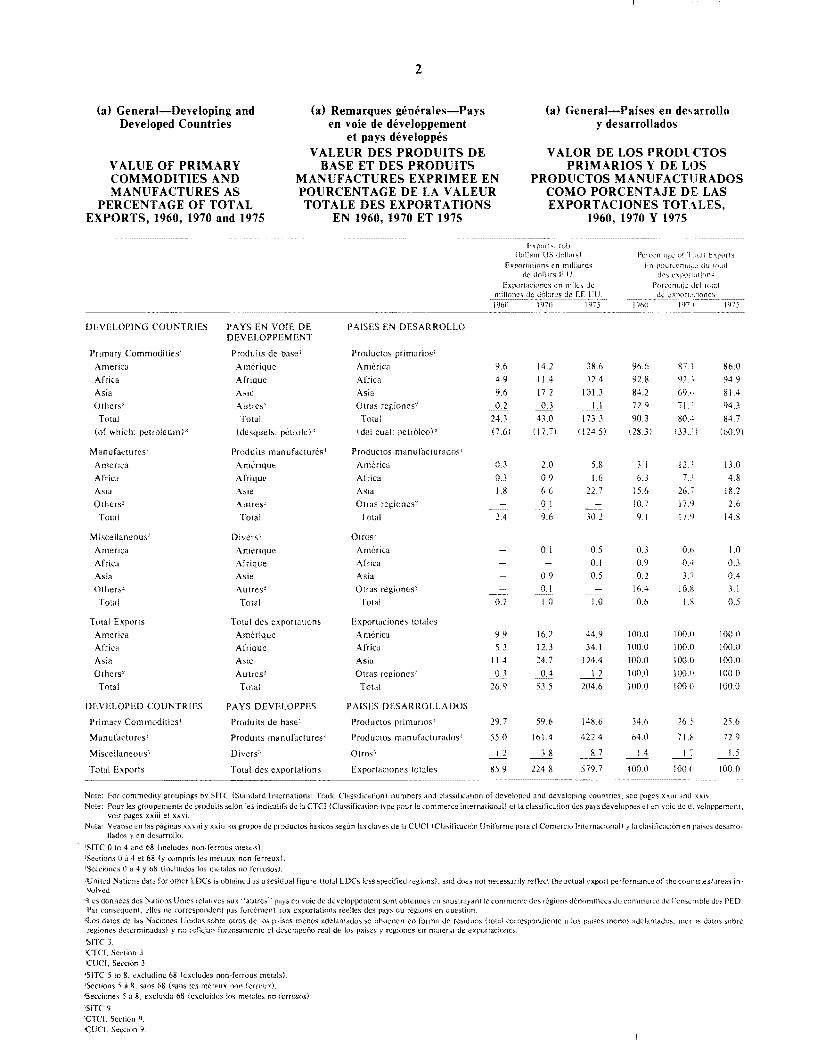
(a) General-Developing and Developed Countries
V ALUE OF PRIMARY COMMODITIES AND MANUFACTURES AS
PERCENTAGE OF TOTAL EXPORTS, 1960, 1970 and 1975
2
(a) Remarques generales-Pays en voie de developpement
et pays developpes V AtEUR DES PRODUITS DE
BASE ET DES PRODUITS MANUFACTURES EXPRIMEE EN POURCENTAGE DE LA VALEUR TOTALE DES EXPORTATIONS
EN 1960, 1970 ET 1975
(a) General-Paises en de~arrollo y desarrollados
V ALOR DE LOS PRODl CTOS PRIMARIOS Y DE LOS
PRODUCTOS MANUFACTURADOS COMO PORCENTAJE DE LAS EXPORTACIONES TOTALES,
1960, 1970 Y 1975
Export~, fob (blElon US doll.lrs)
EXI'Of',mi,)ns en milliards uollars ~.U.
Pcrccntag1.: of 1 Jldl Exports En d'J w.u!
DEVELOPING COUNTRIES
Prim"ry Commodities'
America
Africa
Asia
Others"
Total
(of which: petroleum)"
Manufactures'
America
Africa
Asia
Others'
TOlal
Miscellaneous"
America
Africa
Asia
Olhers'
Total
TOlal Exports
America
Africa
Asia
Others'
TOlal
DEVELOPED COUNTRIES
Primary Commodities'
Manufactures'
Miscellaneous"
Total Exports
PA YS EN VOlE DE DEVELOPPEMENT
ProduilS de base'
Amerique
Afrique
Asie
Autres'
Total
(desqucls: petrolel"
ProduilS manufactures'
Amerique
Afrique
Asie
Autres'
TOlal
Divers·'
Amerique
Afrique
Asie
Autres'
Total
TOlal des exportations
Amerique
Afrique
Asie
Aulres'
Total
PA YS DEVELOPPES
Produits de base'
Produils manufactures'
Divers"
Total des exportations
PAISES EN DESARROLLO
Productos primarios'
America
Africa
Asia
Otras regiones';
Total
(del cual: petroleo),
Productos manufacturados'
America
Africa
Asia
Onas regiones'
TOlal
Otros',
America
Africa
Asia
Olras regiones'
TOlal
Exportaciones totales
America
Africa
Asia
Otras rcgiones1
Total
PAISES DESARROLLADOS
Productos rrimarios'
Produclos manufacturados'
Otro5"
Exportaciones totales
Exportw':loncs cn miles de
9.6
4.9
9,6
0,2
24,3 (7,6)
0.3
0,3
1.8
24
0.2
9.9
5.3
114
0.3
26.9
29,7
55.0
1.2
85,9
14,2
114
17.2
0,3
43.0
117.7)
2.0
0.9
6,6
0.1
9.6
0.1
0.9
0.1
1.0
16.2
12.3
24,7
53.5
59.6
161A
3.8
224.8
38.6
32.4
IOU
17,Ll
(1245)
5.8
1.6 22.7
30.2
0.5
0.1
0,5
1.0
44,9
34.1
124.4
1.2 204.6
148.6
422.4
8.7
579.7
96,6 87.1
92.8 92. ;
84.2 69"
72.9 71
90.3 80." ( 283) 133')
3.1 12 .. '
6.3 7 .. 1
15.6 26.'?
10.7 17.9
9.1 179
0.3 O.b 0.9 0..1
0,2 3.1
16,4 10.X
0.6 I.E
100.0 100.0
100.0 100,()
100,0 100.0
100.0 100.0
100.0 100.0
34.6 26.~
64.0 71.8
14
100.0 100.[1
Note: For commodity groupings by SITC (Standard International Tratle Classification) numbers and classification of develop-ctl and developing (oumries, see pages xX;li and xxiv.
86.0
94.9
Sl.4
94,3
84.7 160,9)
13.0
4.8
18.2
2.6
14.8
1.0
0.3
0.4
3.1
0.5
100.0
100.0
100.0
1000
1000
25.6
72.9
1.5
1000
Note: Pour les groupements de produils selon les indicatirs de la CTCI (Classification type pour Ie commerce international) et fa classification des pays deve[oppes et en vOle de d.'vc!oppemenl, voir pages xxiii et xxvi
Nota Veanse en las raginas xxviii y xxiti los grupos de PI :>ductos baskos segun las duves de la Cllel iClasiricadbn Unirorme pura el Comercio Intcrnaciomd) y lu cll.1sificuci6n en paiscs desarro~ lIados en desarrollo,
[SITe 0 to 4 and 68 (includes non-ferrous metalsL JScetions 0 it 4 et 68 (y compris les metaux non ferreux)' JSccciones 0 a 4 y 68 Onduidos los melales no ferrosos}
:!Cnited Nations data for other LDCs is obtained as a residual figure {tol,-JI LDCs less specified regions), and does nut necessarily reflect the actual export perrormance of the counrieshlrc,-is in· volved
:!Les donnees des ~ations Unies relatives aux "autrcs" pays cn voie de developr;emem son! obtenues cn sous1rayam Ie commerce des regions Jenommccs du commerce de rensc:nble dc~ PED. Par l'onsequen1. elles ne correspondem pas forcement aux exportalions reelles des pays ou regions en question"
tLos datos de las Nacioncs Cnidas sobre otros de los paises menos HdelHnludos ~c obtienen en forma de fcsiuuo;; (total corresp-ondiente d los raiscs menos adelunwdos, mefd:'> ;.kH05 sobre regiones determinadas) y no reficjan forzosamente el desempcno real de los paises y regioncs en materia de exportacioncs"
"SITC 3. 'CTCI. Section J. 'CUel, Seccion J
~SiTC 5 to 8, eXcluding 68 (excludes non· ferrous mctals}, 'Sections 5 a 8, sans 68 (s~IOS les metaux non ferrcuxL 4Secciones 5 a 8, excluido 68 (excluidos los melales no ferrosos)
'SITe 9. '«'Tel. Section 9. 'CUC!. Seed()n 9.
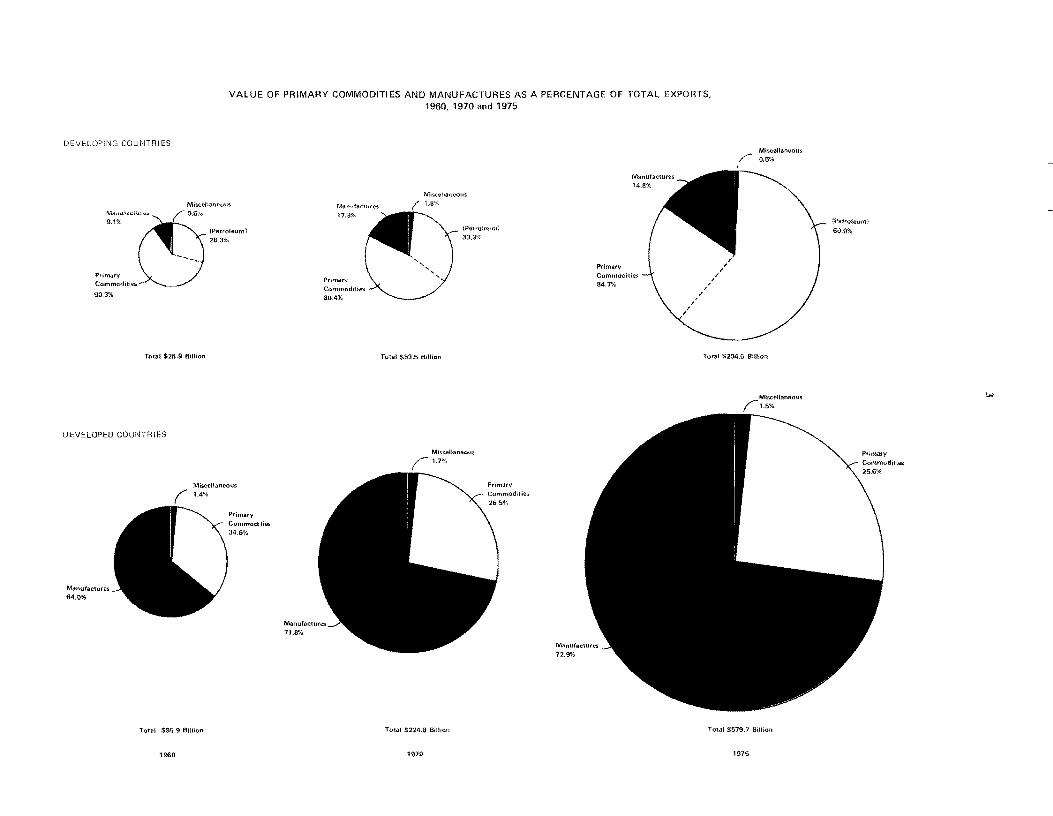
VALUE OF PRIMARY COMMODITIES AND MANUFACTURES AS A PERCENTAGE OF TOTAL EXPORTS, 1960, 1970 and 1975
DEVELOPING COUNTRI ES
Miscellaneous
~';I,ctU~'<. (0.6')<,
----Primary Commodities
90.3%
Total $26.9 Billion
DEVELOPED COUNTRIES
(petroleum)
28.3%
Miscellaneous
Manufactures 64.0%
1.4%
Total $85.9 Billion
1960
Primary
Commodities 34.6%
17,9"'{'
Prlmarv Commodities 80.4%
MISCfd,ancous
Total $53.5 Bimoo
!Petrolnuml 33,3%
Miscellaneous
(1.7%
Total $224.8 Billion
1970
Primary
Manufactures 14.8%
Commoditie~
84.7%
Manufactures 72.9%
Miscellaneous /" O.S"/'
" , , ,
Total $2G4.6 Billion
Total $519.7 Billion
1975
(Petroleum)
60.9%
Primary Commoditie$ 25.6%
......
(a) General-Developing and Developed Countries
V ALUE OF PRIMARY COMMODITIES AND MANUF ACTURES AS
PERCENTAGE OF TOTAL IMPORTS, 1960, 1970 and 1975
4
(a) Remarques generales-Pays en voie de developpement
et pays developpes VALEUR DES PRODUITS DE
BASE ET DES PRODUITS MANUFACTURES EXPRIMEE EN POUR CENT AGE DE LA VALEUR TOTALE DES IMPORTATIONS
EN 1960, 1970 ET 1975
(a) General-Paises en dE'sarrollo y desarrollados
V ALOR DE LOS PRODUCTOS PRIMARIOS Y DE lOS
PRODUCTOS MANUF ACTURADOS COMO PORCENT AJE DE LAS IMPORTACIONES TOTALES,
1960, 1970 Y 1975
------------ -~~---~~~~~~~~~~~~~~~~~ -------~-~----~- ~--~~~
DEVELOPING COUNTRIES
Primary Commodities'
Amenca
Africa
Asia
Others'
Total
tor which: petroleum)'
Manufactures I
America
Africa
/\sia
Others'
TOldl
Miscellaneous'
America Africa
Asia
Others'
Total
TOlallmporls
America
Africa
Asia
Others'
Total
DEVELOPED COUNTRIES
Primary CommodIties'
(of which: petroleum)"
Manufactures 1
Miscellaneous~'
Total Imports
PAYS EN VOlE DE DEVELOPPEMENT
Produits de base'
Amerique
Afrique
Asic
Autres'
Total
(oesquels: petrole)~'
Produits manufactures'
Amerique
Afrique
Asic Autres'
Total
Divers')
Amerique
Afrique
Asic
Aulres'
Total
Total des importations
Amerique
Afrique
Asic
AUlres'
Total
PA YS DEVELOPPES
Produit' de base'
(desquels: petrole),
Produits manufactures'
Divers'
TOlal des importations
I'AISES EN DESARROLLO
Productos primarios'
America
Africa
Asia
Otras regiones'
Total
(del cual: pelri>leo)~'
Productos manufaclurados'
America
Arrica
Asia
Otras regiones'
Total
Otros"
America
Arrica
Asia
OlraS regiones'
TOlal
Importaciones 10lales
America
Africa
Asia
Otras regiones'
Total
PAISES DESARROLLADOS
Productos primarios'
(del CUll!: petroleo),
ProducLOs manufacturados'
Olros:'
I mportaciones IOlales
imports, fob r btllion US dollars)
llnporiutioo:. cn milliilrds de dollars E, U ~
1 mport<lcionc::' cn miles de
3.2 4,7 19.4
1.9 2 ~9 I O~ 7
4.6 7,9 }0~9
0.1 0.2 0.7
9~8 15~ 1 61.7 (28) (40) (280)
6.4 12.1 32.2 4~3 8.8 29.5
6~S 16.1 61.3
O~ I 0.5 0,8 17.3 3 7 ~ 5 123~8
OJ 0.4 1.2
0,2 0,3 0~6
0,6 1.1 30 0,2 0,9 L8
1.3 2,7 66
9.9 17.2 52,8
6~ 5 II ~ 9 40,8
11.7 25.1 953
3.3
28.4 55,8 192,2
40,2 81,4 260.8 (8,4) (21.8) ( 129,2)
38.0 130.7 31 J.5
5 ~ 5 3 ~6
83 ~ 7 221.7 579.4
Pcrccntuge or fOldl Imports En pourccnLlgc du tolal
des importations Pon..:cnlaje del total
32,6 273 36,8
29~ 7 244 26.1
39~3 31 5 32.5
16.7 I} 2 20,6
34.5 281 }2~ I (99) (72) (]4,6)
64,6 703 60,9
67.0 73 5 723 55~6 64 I 643 25~0 306 24,3
60~9 6 7 ~ 2 64.4
2,7 2.4 2,3
3,} 2~ 1 1.5 5,1 4.4 3 ~2
58,3 56~2 55,1 4~6 4~7 3~5
100~0 100,0 100.0 100,0 IOO~O 100~0
100~0 100.0 1000 100,0 100,0 \OO~O
100,0 1000 100,0
48~0 394 45~O
( IO~O) (98) t22.3 )
454 59 ° 5}~8
6~6 1.6 U
100,0 1000 100,0
Note: For commodity grollPings by SITe (Standard IntcrnalionJI Trade Classification) numbers Jnu dassiril.:ation of developed and developing countnes, see pages xxiii ar j xxiv, Note: Pour les groupements de produits scion les indicalifs de Ia CTCl (Cbssification type pour Ie commerce inlernalional) et 13 classificalion des pays developpcs el en voie de jeveloppemenL
voir pages xxiii ct xxvi. Nota; Veanse cn las paginas xxviii y xxui los grupo~ de produclOs biiSicos scgun las daves de la CLCI (Clasifiracion Uniforme para ei Comerdo InternlKional) y la clasificacl()n en paiscsJesarro-
Iludos y en desurrollo.
'SITC 0 [04 and 68 (includes non-ferrous melalsl. 'Sections 0 a 4 el 68 (y compris les mel;Wx non ferreuxL 'Se~cioncs 0 a 4 y 68 (inciuidos los melales no fcrrososl.
'Uniled NHiions d.Ha for other LDCs IS oblHincd as a residual figure (tottil LDCs less s~)Cdfied regJOns). and does not necessarily reflect the actual import p!.!rformance of the countries/areas m~ vaived
::Lcs dormcC's des Nations Unics relatives aux "aulres" pHyS en voie de sont obtcnucs en souslrayunt Ic commerce des regions dcnommees du commerce dc I'en~emble des PED Par consequent, clks ne correspondent pa~ forcemcnl aUX importations des pays ou regions cn Question. ~Los datos de NtH.:iones Unidas sobre QUOS de los paises menos adelLtntados sc obtlcncn en form<l de residuos {lo!.il! corresrondiente a 105 raises menos adelantados. m(.nos datos sobre fcgiones determin~ldHS) y no renejan fOflosu.mcntt: cI dcscmpcno rcul de los p~liscs y regiones en materia de imponHciones.
'SlTC 3 'eTCI. Section 3 'CUC!' Seccion ISITC 5 to 8. exduding 68 (excludes non-rcffouS metals). ~Sections 5 a 8, Sans 68 (sans les mctaux non ferrcuxl. ISccdoncs 5 -a 8, cxclukJo 68 (cxduldos los melalcs no rcrrosos)
'SITC 9~ ~'Crcl, Seclion 9~
~'CUCI, Seccion 9
DEVELOPING COUNTRIES
Mi<;r:f'lfarleoll"
60.9%
Total $28.4 Siilion
DEVELOPED COUNTRIES
Manuf~ctor6$
45.4%
Miscel!aneous
Tali'll $83.7 Billion
1960
VALUE OF PRIMARY COMMODITIES AND MANUFACTURES AS A PERCENTAGE OF TOTAL IMPORTS,
1960, 1970 AND 1975
Primary COmmodities 34.5%
67.2%
Total $55.8 Binion
59.0%
Total $221.7 Billion
1970
Primary Commodities 28.1%
Primary Commodities
39.4%
ManlJfactures
64.4%
'fatal $192.2 Biltion
Total $579.4 aUllon
1975
PrimarY Commodities
32.1%
--_ ... ----
(Petroleum}
22.3%
til
6
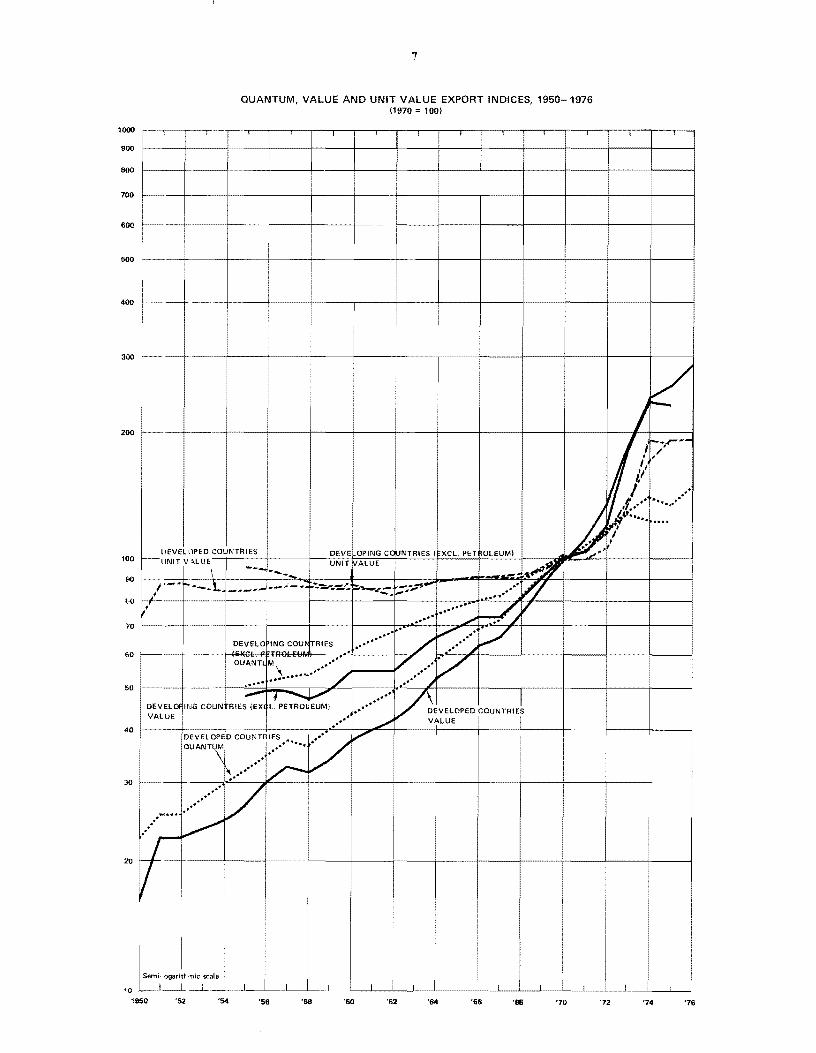
QUANTUM, VALUE AND UNIT VALUE EXPORT INDICES, INDICES DE VOLUME, DE VALEUR ET DE VALEUR UNITAIRE DES EXPORTATIONS,
INDICES DEL VOLUMEN, VALOR Y VALOR UNITARIO DE LAS EXPORTACIONES, 1950-1976 (1970=100)
en VOle de
Developed CounLriE ~
Y compris pelrole :\0,. compris petrolc Pay~ devcloppes
cl eI Paises dcsarroHado~,
Year Qu;mtum Value Quantum Quantum Value Unit Annee Volume Valeur Valeur unilairc Volume Valeur Valeur unilaire Volume Valeur Valeur unhaire Ano Volumen V.;tIOT Valor unitario Vulumen Valor Vdlor unitario Volumcn Valor Valor t.nitario
--_ ......
1950 56 53 94 23 17 74 1951 38 44 117 26 23 88 1952 36 39 107 26 23 89 1953 39 39 99 28 24 86 1954 40 40 101 30 25 84
1955 43 44 102 50 48 95 32 27 84 1956 45 45 101 52 49 94 35 30 86 1957 46 46 101 53 49 92 38 33 88 1958 47 45 96 53 47 88 37 32 87 1959 50 47 94 57 49 86 40 34 85
1960 52 49 94 62 55 88 44 38 86 1961 55 50 91 65 55 84 47 40 86 1962 59 53 89 67 55 82 49 42 86 1963 62 56 91 71 60 85 53 46 87 1964 66 62 94 74 66 89 59 53 89
1965 70 65 93 77 69 89 63 57 90 1966 75 71 95 80 73 91 69 63 91 1967 77 72 94 81 73 90 72 66 92 1968 84 79 94 89 80 90 82 75 91 1969 91 88 97 95 90 95 92 86 94
1970 100 100 100 100 100 100 100 100 100 1971 104 112 108 103 103 100 107 112 105 1972 116 135 116 116 123 106 117 133 114 1973 129 204 158 128 180 141 131 181 138 1974 126 401 318 124 238 192 140 241 172
1975 121 376 311 124 233 188 134 257 192 1976 137 452 330 NA NA NA 149 286 192
.......... ----_._---
Note: The indices are based on trade data in US dollars in 1970. Following weights have been used in computing the quantum indices: Develop-ing Countries (including petroleum): 19.8%; Developing Countries (excluding petroleum): 16.4%; Developed Countries: 802%.
Note: Les indices sont fondes sur les statistiques du commerce en 1970, en dollars E.U. Pour Ie calcul des indices de volume, on a uti'ise les pon-derations suivantes: pays en voie de deveiuppement (y compris petrole): 19,8%; pays en voie de developpement (non camp: is petrole): 16,4%; pays developpes: 80,2%.
Nota: Los indices se basan en datos comerciales en dolares estadounidenses de 1970. Para calcular los indices relativos al volunen se han empieado las siguientes ponderaciones: paises en desarrollo (incluido el petroleo), 19,8%; paises en desarrollo (excluido e petroleo), 16,4%; palses desarrollados, 80,2%.
Source: United Nations, Monthly Bulletin oj Statistics; IMF, International Financial SIatiSIics. Source: Nations Unies, Bulletin mensuel de statist/que; IMF, International Financial Statistics, Fuente: Naciones U nidas, Monthly Bulletin oj Statistics; FMI, International Financial Statistics.
1000
900
800
700
600 ~
500
400
300 f-.............
200 c······~
7
QUANTUM, VALUE AND UNIT VALUE EXPORT INDICES, 1950-1976 (1970 = 100)
•
i I
•
I
I
J k( l/
1/ 'I
t ~'r-I,l .. '" .....
W. I .",,'* - ••
~.t ......... /
I COUNTRIES DEVE OPING C( tvNTRIES I XCL, PET OLEUM) I--100 ~LUE UNIT ALUE
~2J \ --- -- _.IIi.-b2=r-
.-.q----- __ M_;+":..=~ t:.",--- -~ .0' W I ' ._-f..-'" .' I ... ",'t ...... ..:, ~ V ......
&0
--.' . V·, V .'
/ .' : DEVELO lNG COU~ TRIES .... .... ~ .' '- : 'cv~ b~n~' ~". . QUANTl Mi ••• ••• V .. ' V \ ........ / .' .... .... /
.... _- J •••• - L~PE~ .' V~EVELOPED COUNTRIES
.' DEVELOI ING COUN RIES lEX .' .' .' VALUE .' ./ VALUE i -~
,.' DEVELOPED COUNTRIES .... V QUANTUM •• ~" .... -\ .. '
.'
..... _. ~ ....... V ....
.' / .' .' .' l.·····= ..
"
y I I
eO
50
40
30
20
~ scale I I I I 10
1950 '52 '54 '56 '58 '60 '62 '64 '66 '66 '70
I I
'72 '74 '76
8
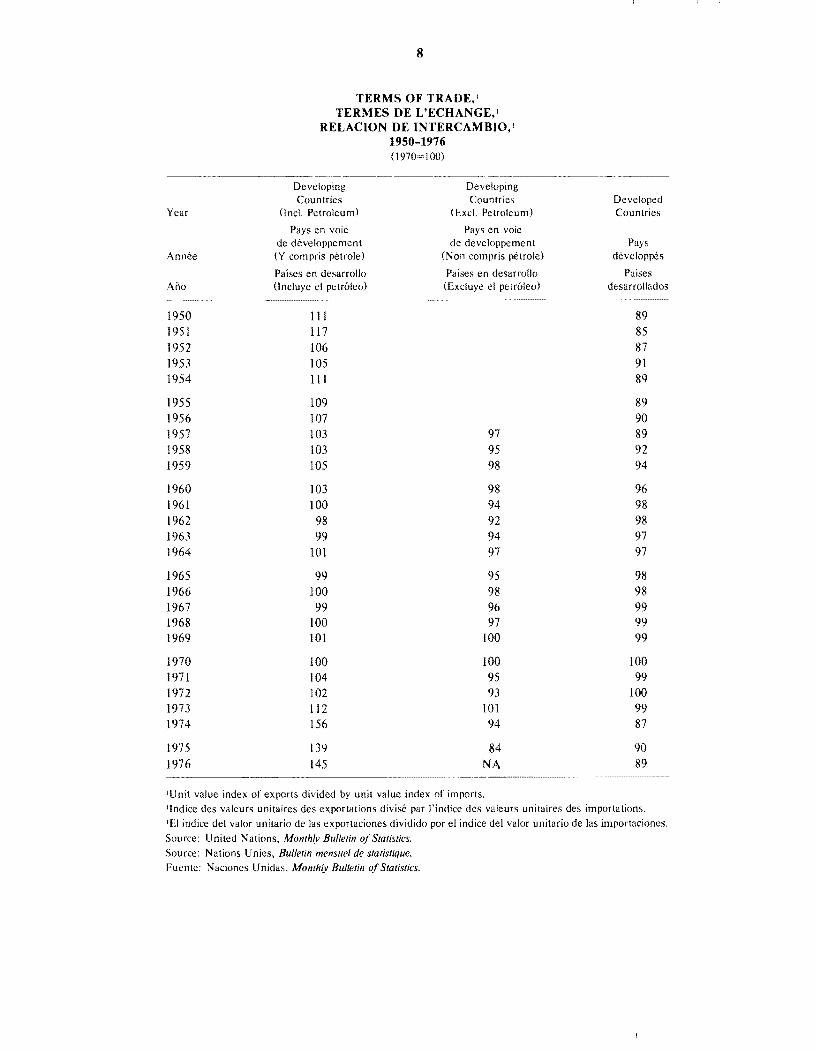
TERMS OF TRADE, I TERMES DE L'ECHANGE,I
RELACION DE INTERCAMBIO,I 1950-1976 (I970=100)
Developing Developing Countries Countries Developed
Year (Incl. Petroleum) (Excl. Petroleum) Countries
Pays en voie Pays en voie de developpement de developpement Pays
Annee (Y compris petrole) (Non compris petrole) developpes
Paises en desarrollo Paises en desarrollo Paises Ano Oncluye el petroleo) (Exduye el petroleo) desarrollados
.......... _-1950 111 89 1951 117 85 1952 106 87 1953 105 91 1954 111 89
1955 109 89 1956 107 90 1957 103 97 89 1958 103 95 92 1959 105 98 94
1960 103 98 96 1961 100 94 98 1962 98 92 98 1963 99 94 97 1964 101 97 97
1965 99 95 98 1966 100 98 98 1967 99 96 99 1968 100 97 99 1969 101 100 99
1970 100 100 100 1971 104 95 99 1972 102 93 100 1973 112 101 99 1974 156 94 87
1975 139 84 90 1976 145 NA 89
IUnit value index of exports divided by unit value index of imports.
Iindice des valeurs unitaires des exportations divise par l'indice des valeurs unitaires des importations.
'EI indice del valor unitario de las exportaciones dividido por el indice del valor unitario de las importaciones.
Source: United Nations, Monthly Bulletin 0/ Statistics.
Source: Nations Unies, Bulletin mensuel de statistique.
Fuente: Naciones Unidas, Momhly Bulletin o/Statistics.
200
180
160
140
'00
80
60
40 I~------------------------r-------~~
20
o 1950 '51 '52 '53 '54 '55 '56 '57 '!is '59 '60
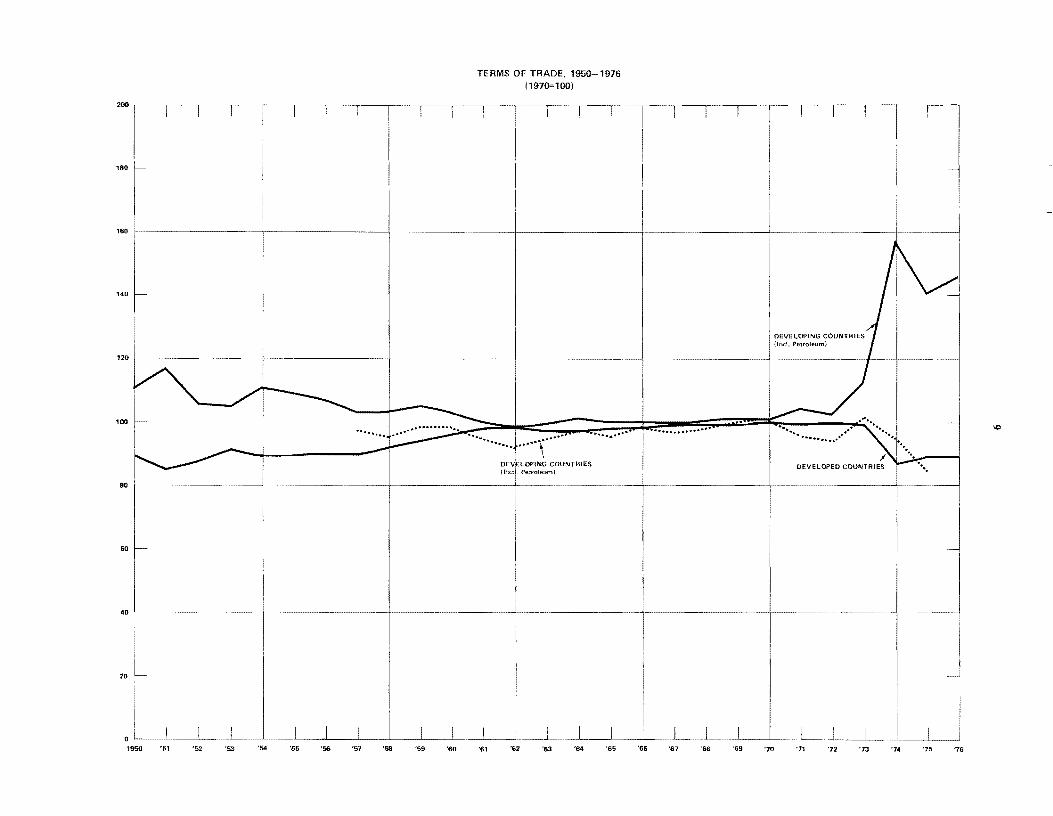
TERMS OF TRADE, 1950-1976 (1970=100)
............... . 1 ......... . ........ .., \ '"
DEVELOPING COUNTRIES (Excl. Petroleum)
'61 '62 '63 '64 '65 '66
.................
'67 '68 '69
DEVELOPING COUNTRIES (Ind. Petroleum)
" . ....
DEVELOPED COUNTRIES
'70 '71 '72 '73
'"
'74 '75 '76
YCdr ,\nnl'C Ailo ------------
1950 1951 1952 1953 1954 1955 1956 1957 1958 1959 1960 1961 1962 1963 1964 1965 1966 1967 1968 1969 1970 1971 1972 1973 1974 1975 1976 1970 Exports, fob (mil. US$)
10
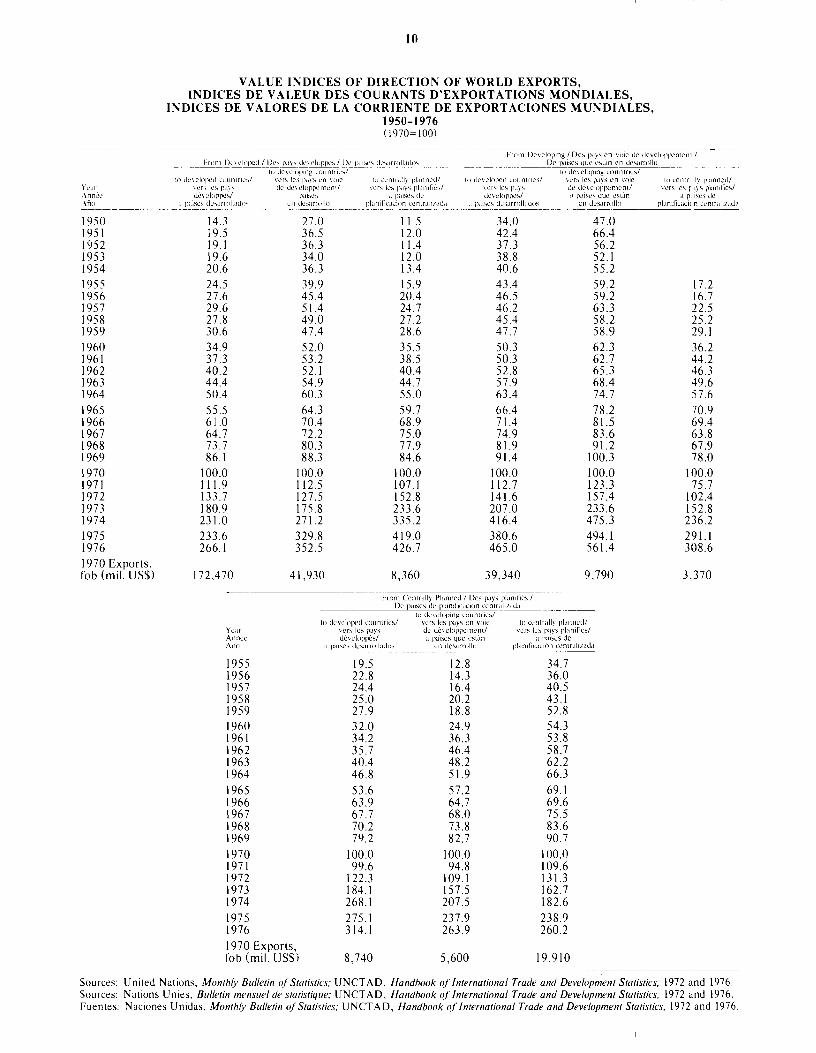
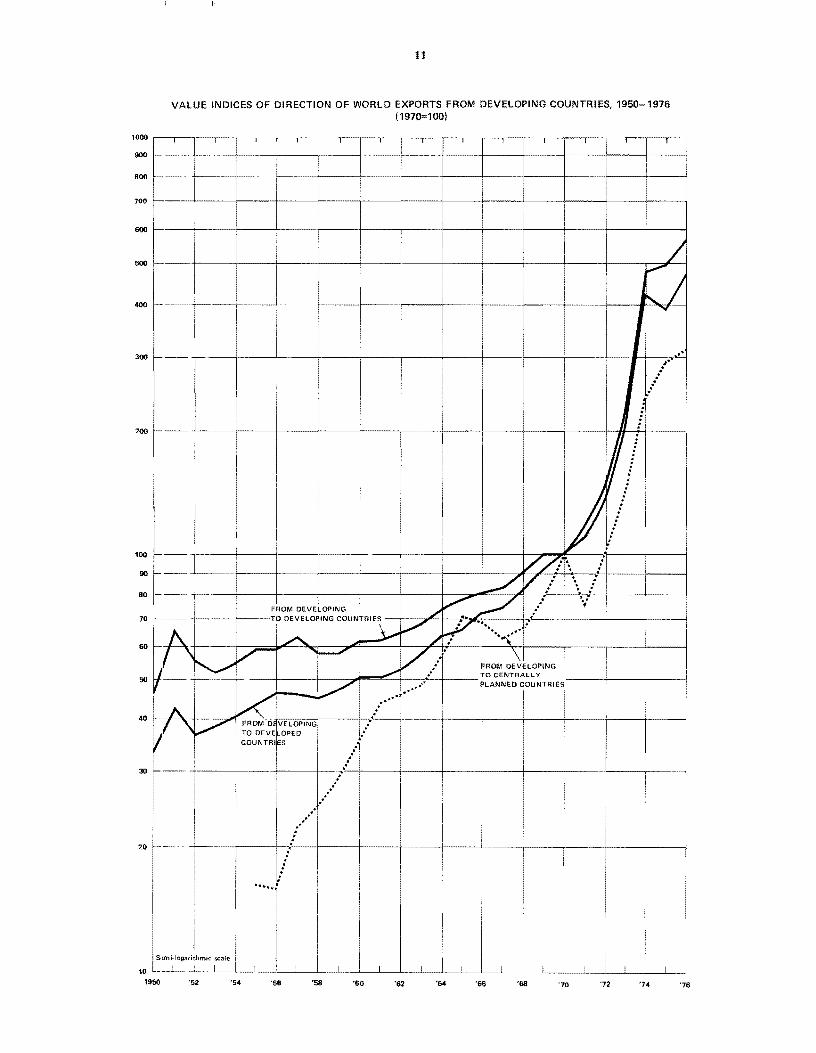
VALUE INDICES OF DIRECTION OF WORLD EXPORTS, INDICES DE VALEUR DES COURANTS D'EXPORTATIONS MONDIALES,
INDICES DE VALORES DE LA CORRIENTE DE EXPORTACIONES MUNDIALES, 1950-1976 (\970= 100)
;----cc-------From Developing / Dc:-. IMys en vOle LIe ucvcloppcmcnl /
Fn11ll l)~\l'l{lPCU / Dc . .., PdY:-' UL'\cl(JPPc::,/ [)c Ildl. ... L':-.lh:: .... drrtlllddo:-. Dc pai:-.cs que ('slim en uc:-.arrollo ----- ----lOllc\ cil)pmg cOLln-trll'-~/--- -- --- - --- -- ------[{) dcvClOplng C{)U~----
to lk\clopcd cOuIlLrh.: .... / \'L'r::. Ics pd)':-' en \Oll' to "':l'nlr,illy plttnncdl to developed ((Junlne..,/ \L'r:-. Ic~ PdYS I .. .'n \,ole
\Lr" Ie .... Pd):-' de dCH:loPPclll'':Tl!1 \(T:-, k:-. pdyS pl<lnific::../ \('1":-' le:-. p.l)':-' de dl'\cloPPcnlcm/ uc\cl()P11C:",j pal:'C.., ,] pal.,C,> de dC\C!<IPPL':"'/ ~I p~\lSCS que ('sLim
d j1dlSC:-' dC'>dfru]lduo.., ell desarrollo pldlllllldCi()n ccnlrailldud .1 p,\I..,C . .., ucsarrolbdo::; ell Jcs..lITollo - -------- --- ----------------
14.3 27.0 11.5 34.0 47.0 19.5 36.5 12.0 42.4 66.4 19.1 36.3 11.4 37.3 56.2 19.6 34.0 12.0 38.8 52.1 20.6 36.3 13.4 40.6 55.2 24.5 39.9 15.9 43.4 59.2 27.6 45.4 20.4 46.5 59.2 29.6 51.4 24.7 46.2 63.3 27.8 49.0 27.2 45.4 58.2 30.6 47.4 28.6 47.7 58.9 34.9 52.0 35.5 50.3 62.3 37.3 53.2 38.5 50.3 62.7 40.2 52.1 40.4 52.8 65.3 44.4 54.9 44.7 57.9 68.4 50.4 60.3 55.0 63.4 74.7 55.5 64.3 59.7 66.4 78.2 61.0 70.4 68.9 71.4 81.5 64.7 72.2 75.0 74.9 83.6 73.7 80.3 77.9 81.9 91.2 86.1 88.3 84.6 91.4 100.3
100.0 100.0 100.0 100.0 100.0 Ill. 9 112.5 107.1 112.7 123.3 133.7 127.5 152.8 141.6 157.4 180.9 175.8 233.6 207.0 233.6 231.0 271.2 335.2 416.4 475.3 233.6 329.8 419.0 380.6 494.1 266.1 352.5 426.7 465.0 561.4
172,470 41,930 8,360 39,340 9,790 ------------------------- ---- ----------
YCdl AnnL'e Ano
1955 1956 1957 1958 1959 1960 1961 1962 1963 1964 1965 1966 1967 1968 1969 1970 1971 1972 1973 1974
1975 1976 1970 Exports, fob (mil. US$)
From CenLrally Planncu / OC~ pay::; pldndtc~ / Dc p,lIses de planllicdCllln cenlr,tilldud
to devclol"x:'ll countrte~/ vcr:-. Ics p,-Iys uc\eloppes/
a Pdl:-'C:-' ue:-,arro[[duo~ -------------- - -- --- -
19.5 22.8 24.4 25.0 27.9 32.0 34.2 35.7 40.4 46.8 53.6 63.9 67.7 70.2 79.2
100.0 99.6
122.3 184.1 268.1 275.1 314.1
8,740
to uc" .... loping counmc:-./ ver~ les pa}'S en vOle ue uc"cloPPclllcnL/ a pabes que csLim
Cll uc~arroll()
12.8 14.3 16.4 20.2 18.8 24.9 36.3 46.4 48.2 51.9 57.2 64.7 68.0 73.8 82.7
100.0 94.8
109.1 157.5 207.5 237.9 263.9
5,600
LO ccntfdlly planned/ "cr:-. le:-. pay~ plamllcs/
d pai~cs de plantilGKll)ll centrdlilada
34.7 36.0 40.5 43.1 52.8 54.3 53.8 58.7 62.2 66.3
69.1 69.6 75.5 83.6 90.7
100.0 109.6 131.3 162.7 182.6 238.9 260.2
19,910
to ccntr .. Iy pl<mn::ul \cr~ les r lY" plamllcs/
d p.:ISC:-' lk
plamficacl( n (enlra lldua
17.2 16.7 22.5 25.2 29.1 36.2 44.2 46.3 49.6 57.6 70.9 69.4 63.8 67.9 78.0
100.0 75.7
102.4 152.8 236.2 291.1 308.6
3.370
-_._------_.
Sources: United Nations, Monthly Bulletin o/Statistics; UNCT AD, Handbook 0/ International Trade and Development Statistics, 1972 and 1976. Sources: Nations Unies, Bulletin mensuel de statistique; UNCTAD, Handbook o/International Trade and Development Statistics, 1972 and 1976. Fuentes: Naciones U nidas, Monthly Bulletin 0/ Statistics; UNCT AD, Handbook 0/ International Trade and Development Statistics, 1972 and 1976.
1000
900
800
700
600
11
VALUE INDICES OF DIRECTION OF WORLD EXPORTS FROM DEVELOPING COUNTRIES, 1950-1976 (1970=1001
! I r
i I !
! 500
I / , ~
!
I 400 !-! ~/
!
I 1
i 300 -
I
200 ~
i
:; J r
~/ l)/ . ' ,
"V
" ,j'
.:--".-
100 --'I' i 1/7)\: II 00 --+-----~--_4----_+----~----+_----~--_4----~~~ ~/~;~~~~.+---~----~
~V ... : .... : 80 ---- ____ ~----+_----~--~~--_+----~--~~~~L- ~+-~~~~ __ -+ __ --~
FROM DEVELOPING ! /~ :;:7 1.7 \' 1
70 +_-,--i----1" vD DEVELOP,ING COUNTRIES 1,/ I //~",-----+I .'-'-----1------'-------'--------1
60 ~' .A ./".. ! ~~ /~ •••••• "'\ ••• ~.. 1 1
/ \~, ~ V- ~ .. V./· ~ROM D~LOPING I 50 I --- ~ TO CENTRALLY ____ -+-____ -1-__ __
.../ -' PLANNED COUNTRIES
I Vr- -r / ........ . 40 !-, ·--A·I ~ I, FROM °1VELOPINGI" I !
:1, / \~ I TO DEVn~tOPED I • I ::" I' COUNTRI1ES l: ~ ~--~--~I--~.~!~:I--~----~--~--~--~--+---~~!
./ ! 1 1 / I
20 r- 1.---1-_-+-. __ ;' __ ..... +--__ 1--11 -----t---+---I-I
--I-----!------+-------1
... Y ! I I
:
I 1
10 I I I ! I I I , I I 1 i I I I
1950 '52 '54 '56 '56 '60 '62 '64 '65 '68 '70 '72 '74 '76
12
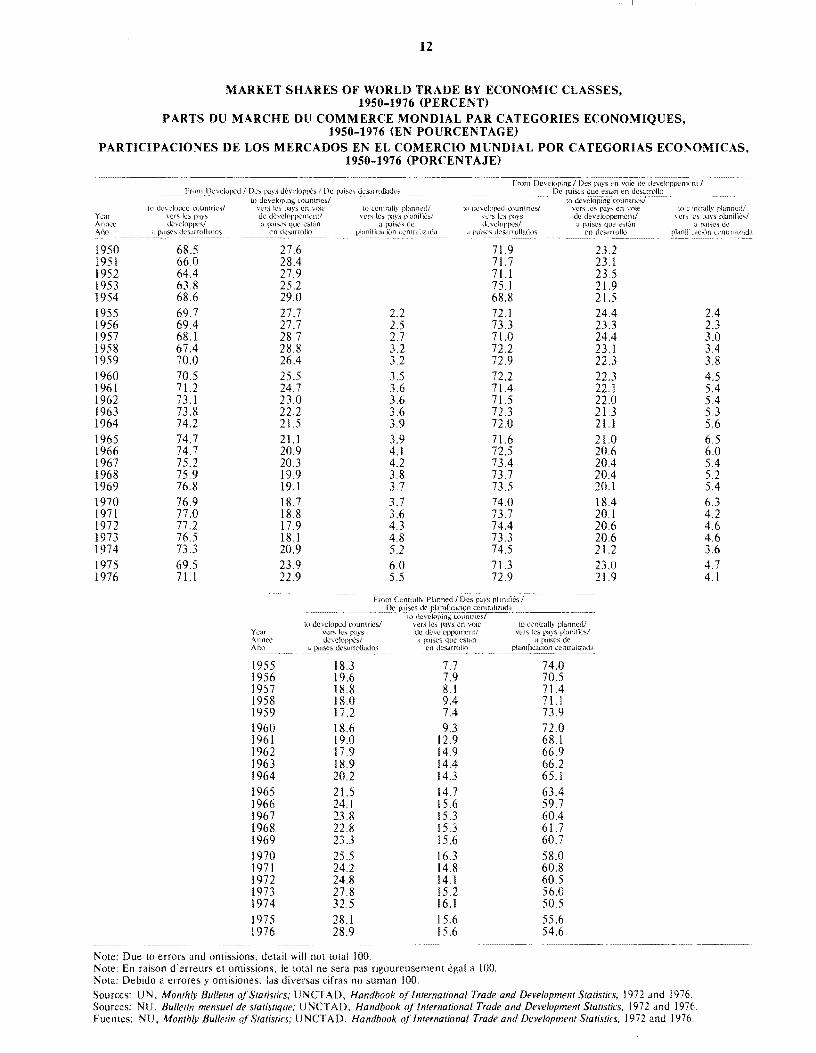
MARKET SHARES OF WORLD TRADE BY ECONOMIC CLASSES. 1950-1976 (PERCENT)
PARTS DU MARCHE DU COMMERCE MONDIAL PAR CATEGORIES ECONOMIQUES. 1950-1976 (EN POURCENTAGE)
PARTICIPACIONES DE LOS MERCADOS EN EL COMERCIO MUNDIAL POR CATEGORIAS ECO~OMICAS, 1950-1976 (PORCENTAJE)
.----,~----. -----,---_ .. ------
Year Anncc '\00
1950 68.5 27.6 71.9 1951 66.0 28.4 71.7 1952 64.4 27.9 71.1 1953 63.8 25.2 75.1 1954 68.6 29.0 68.8 1955 69.7 27.7 2.2 72.1 1956 69.4 27.7 2.5 73.3 1957 68.1 28.7 2.7 71.0 1958 67.4 28.8 3.2 72.2 1959 70.0 26.4 3.2 72.9 1960 70.5 25.5 3.5 72.2 1961 71.2 24.7 3.6 71.4 1962 73.1 23.0 3.6 71.5 1963 73.8 22.2 3.6 72.3 1964 74.2 21.5 3.9 72.0 1965 74.7 21.1 3.9 71.6 1966 74.7 20.9 4.1 72.5 1967 75.2 20.3 4.2 73.4 1968 75.9 19.9 3.8 73.7 1969 76.8 19.1 3.7 73.5 1970 76.9 18.7 3.7 74.0 1971 77.0 18.8 3.6 73.7 1972 77.2 17.9 4.3 74.4 1973 76.5 18.1 4.8 73.3 1974 73.3 20.9 5.2 74.5 1975 69.5 23.9 6.0 71.3 1976 71.1 22.9 5.5 72.9
1955 18.3 7.7 1956 19.6 7.9 1957 18.8 8.1 1958 18.0 9.4 1959 17.2 7.4 1960 18.6 9.3 1961 19.0 12.9 1962 17.9 14.9 1963 18.9 14.4 1964 20.2 14.3 1965 21.5 14.7 1966 24.1 15.6 1967 23.8 15.3 1968 22.8 15.3 1969 23.3 15.6 1970 25.5 16.3 1971 24.2 14.8 1972 24.8 14.1 1973 27.8 15.2 1974 32.5 16.1 1975 28.1 15.6 1976 28.9 15.6
Note: Due to errors and omissions, detail will nor total 100. Note: En raison d'erreurs et omissions, Ie total ne sera pas rigoureusernent egal il 100. Nota: Debido a errores y omisiones, las diversas cifras no suman 100.
23.2 23.1 23.5 21.9 21.5 24.4 23.3 24.4 23.1 22.3 22.3 22.1 22.0 21.3 21.1 21.0 20.6 20.4 20.4 20.1 18.4 20.1 20.6 20.6 21.2 23.0 21.9
74.0 70.5 71.4 71.1 73.9 72.0 68.1 66.9 66.2 65.1 63.4 59.7 60.4 61.7 60.7 58.0 60.8 60.5 56.0 50.5 55.6 54.6
Sources: UN, Monthly Bulle/in oj Slatis/ics; UNClAD, Handbook oj Inlernational Trade and Developmenl Statistics, 1972 and 1976. Sources: NU. Bulle/in mensuel de sialislique; UNClAD, Handbook oj International Trade and Development Statistics, 1972 and 1976. Fuentes: NU, Monthly Bulletin oj Slatis/ics; UNClAD. Handbook oj International Trade and Development Statistics, 1972 and 1976.
2.4 2.3 3.0 3.4 3.8 4.5 5.4 5.4 5.3 5.6 6.5 6.0 5.4 5.2 5.4 6.3 4.2 4.6 4.6 3.6 4.7 4.1
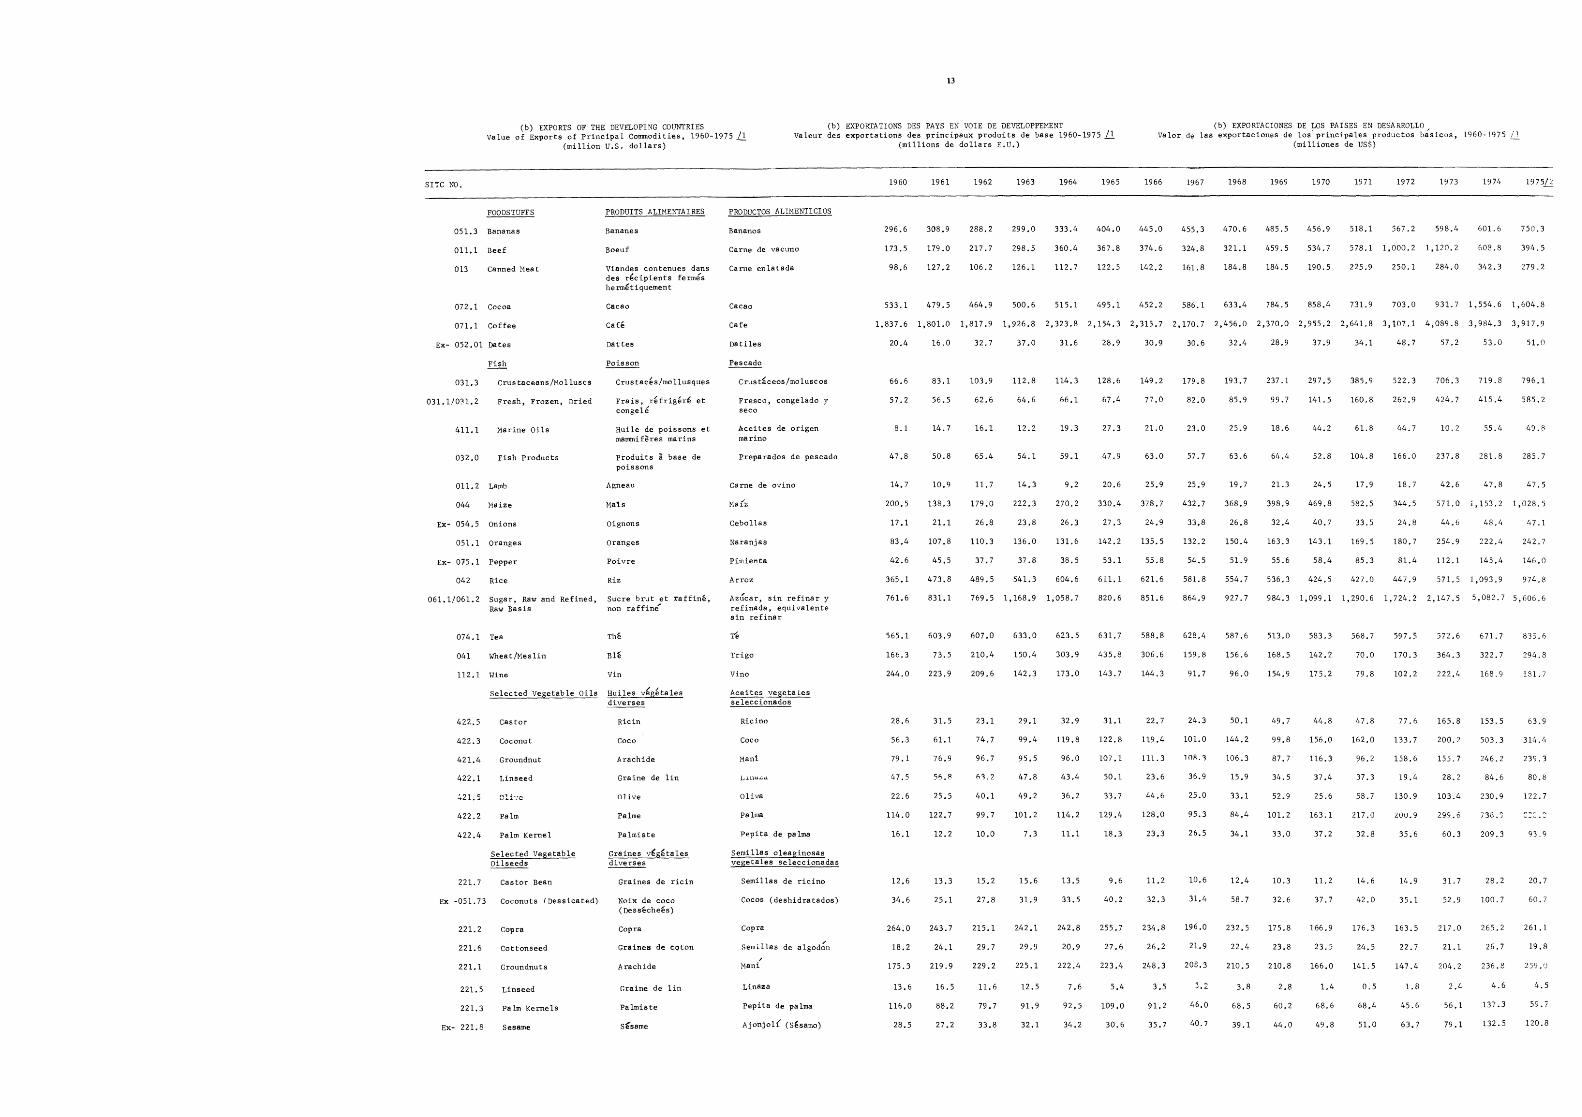
13
EXPORTS OF THE DEVELOPING COUNTRIES (b) EXPORTATIONS DES PAYS EN VOlE DE DEVELOPPEMENT value Exports of Principal Commodities, 1960-1975 11
(million U.S. dollars) -Valeur des exportations des principaux produits de !:lase 1960-1975 l.l.
(millions de dollars E.1:.)
SITC NO.
FOODSTUFFS
051.3 Bananas
011.1 Beef
013 Canned Mea t
072.1 Cocoa
PRODUITS ALIMENTAl RES
Bananes
Boeuf
Viandes contenues dans des r~cipients fenmfs herrnetiquement
Cacao
1960
PRODUCTOS ALIMENTICIOS
Bananos 296.6
Ca rne de vacuno 173.5
Carne en1atada 98.6
Cacao 533.1
1961 1962 1963 1964 1965
308.9 288.2 299.0 333.4 404.0
179.0 217.7 298.5 360.4 367.8
127.2 106.2 126.1 112.7 122.5
479.5 464.9 500.6 515.1 495.1
(b) EXPORTACIONES DE LOS PAISES EN DESARROLLO Valor de las exportacioncs de los princ;pa1es productos basicos, 1960-1975
(rni lliones de US$)
1966 1967 1968 1969 1970 1971 1972 1973 1974 1975L.?
445.0 455.3 470.6 485.5 456.9 518.1 567.2 598.4 601.6 750.3
374.6 324.8 321.1 459.5 534.7 578.11,000.21,120.2 608.8 394.5
142.2 161. 8 184.8 184.5 190.5 225.9 250.1 284.0 342.3 279.2
452.2 586.1 633.4 784.5 858.4 731.9 703.0 931.71,554.61,604.8
071.1 Coffee Cafe cafe 1,837.61,801.01,817.91,926.82,323.82,154.3 2,315.72,170.72,456.02,370.02,955.22,641.8 3,107.1 4,089.8 3,984.33,917.9
Ex- 052.01 !)ates
Fish
031.3 Crus taceans IMolluscs
031.1/031.2 Fresh, Frozen, Dried
411. 1 Marine Oils
032.0 Fish Products
OIl. 2 Lamb
044 Maize
Ex- 054.5 Onions
051.1 oranges
Ex- 075.1 Pepper
042 Rice
061.1/061.2 Sugar, Raw and Refined, Raw Basis
074.1 Tea
041 Wheat/~eslin
112.1 Wine
Se1ec ted Vegetab Ie Oils
422.5 Castor
422.3 Coconut
421.4 Groundnut
422.1 Linseed
Oli~."c
422.2 Palm
422.4 Palm Kernel
221. 7 Castor Bean
Ex -051.73 Coconuts (Dessicated)
221.2 Copra
221.6 Cottonseed
221.1 Groundnuts
221. 5 Linseed
221.3 Palm Kernels
Ex- 221. 8 Sesame
Dattes
Poisson
Crustac~s/mo 11usques
Frais, r~frigerf et conge1e
Huile de poissons et mammiferes marins
Produits a base de poissons
Agneau
Ma'is
Oignons
oranges
Poivre
Riz
Sucre brut et raffine, non raffine
The
B1e
Vin
Ricin
Coco
Araehide
Gra ine de lin
Olive
Pa1me
pa1miste
Graines de ricin
Noix de coco ( Dessechees)
Copra
Graines de coton
Arachide
Graine de lin
Palmiste
s'6same
fl8.tiles
Pescado
Crus t~ceos/mo 1uscos
Fresco, conge lado y seeo
Aceites de origen marino
Prepa rados de peseado
Carne de ovino
Ma{z
Cebollas
Naranjas
Pimienta
Arroz
AzU'car, sin refina r y refinada, equivalente sin refinar
Ye
Trigo
Vino
Ricino
Coco
Mani
LLndL.d
Oliva
Palma
Pepita de palma
Semil1as de ricino
Cocos (deshidratados)
Copra
, semillas de algodon
I
Mani
LinaZ8
Pepita de palma
Ajonjol ( (S~samo)
20.4
66.6
57.2
8.1
47.8
14.7
200.5
17.1
83.4
42.6
365.1
761.6
565.1
166.3
244.0
28.6
56.3
79.1
47.5
22.6
114.0
16.1
12.6
34.6
264.0
18.2
175.3
13.6
116.0
28.5
16.0 32.7 37.0 31.6 28.9
83.1 103.9 112.8 114.3 128.6
56.5 62.6 64.6 66.1 67.4
14.7 16.1 12.2 19.3 27.3
50.8 65.4 54.1 59.1 47.9
10.9 11. 7 14.3 9.2 20.6
138.3 179.0 222.3 270.2 330.4
21.1 26.8 23.8 26.3 27.3
107.8 110.3 136.0 131.6 142.2
45.5 37.7 37.8 38.5 53.1
473.8 489.5 541.3 604.6 611.1
831.1 769.5 1,168.9 1,058.7 820.6
603.9 607.0 633.0 623.5 631. 7
73.5 210.4 150.4 303.9 435.8
223.9 209.6 142.3 173.0 143.7
31.5 23.1 29.1 32.9 31.1
61.1 74.7 99.4 119.8 122.8
76.9 96.7 95,5 96.0 107.1
56.8 (,1.2 47.8 43.4 50.1
25.5 40.1 49.2 36.2 33.7
122.7 99.7 101.2 114.2 129.4
12.2 10.0 7.3 ILl 18.3
13.3 15.2 15.6 13.5 9.6
25.1 27 .8 31.9 33.5 40.2
243.7 215.1 242.1 242.8 255.7
24.1 29.7 29.9 20.9 27 .6
219.9 229.2 225.1 222.4 223.4
16.5 11.6 12.5 7.6 5.4
88.2 79.7 91.9 92.5 109.0
27 .2 33.8 32.1 34.2 30.6
30.9 30.6 32.4 28.9 37.9 34.1 48.7 57.2 53.0 51.0
149.2 179.8 193.7 237.1 297.5 385.9 522.3 706.3 719.8 796.1
77 .0 82.0 85.9 99.7 141. 5 160.8 262.9 424.7 415.4 585.2
21.0 23.0 25.9 18.6 44.2 61.8 44.7 10.2 55.4 49.8
63.0 57.7 63.6 64.4 52.8 104.8 166.0 237.8 281. 8 285.7
25.9 25.9 19.7 21.3 24.5 17.9 18.7 42.6 47.8 47.5
378.7 432.7 368.9 398.9 469.8 582.5 344.5 571.0 l,153.2 1,028.5
24.9 33.8 26.8 32.4 40.7 33.5 24.8 44.6 48.4 47.1
135.5 132.2 150.4 163.3 143.1 169.5 180. 254.9 222.4 242.7
55.8 54.5 51.9 55.6 58.4 85.3 81.4 112.1 145. 1, 146.0
621.6 581.8 554.7 536.3 424.5 427.0 447.9 571.5 1,093.9 974.8
851.6 864.9 927.7 984.31,099.11,290.61,724.2 2,147.5 5,082.75,606.6
588.8 628.4 587.6 513.0 583.3 568.7 597.5 572.6 671. 7 8'35.
306.6 159.8 156.6 168.5 142.2 70.0 170.3 364.3 322.7 294.8
llf4.3 91.7 96,0 154.9 175.2 79.8 102.2 222.4 168.9 ~.81 • 7
22.7 24.3 50.1 49.7 44.8 47.8 77.6 165.8 153.5 63.9
119.4 101.0 144.2 99.8 156.0 162.0 133.7 200.2 503.3 314.4
111.3 lOR.1 106.3 87.7 116.3 96.2 158.6 155.7 246.2 239. '3
23.6 36.9 15,9 34.5 37.4 37.3 19.4 28.2 84.6 80.ll
44.6 25.0 33.1 52.9 25.6 58.7 130.9 103.4 230.9 122.7
128.0 95.3 84.4 101. 2 163.1 217.0 20u.9 299.6 736.9
23.3 26.5 34.1 33.0 37.2 32.8 35.6 60.3 209.3 93.9
11.2 10.6 12.4 10.3 11. 2 14.6 14.9 31.7 28.2 20.7
32.3 31.4 58.7 32.6 37.7 42.0 35.1 52.9 100.7 60.7
234.8 196.0 232.5 175.8 166.9 176.3 163.5 217.0 265. ;I 261.1
26.2 21.9 22.4 23.8 23.5 24.5 22.7 21.1 26.7 19.8
248.3 20e.3 210.5 210.8 166.0 141. 5 147.4 ?04.2 236.8
3.5 j." 3.8 2.8 1.4 0.5 1.8 2.4 4.6 4.5
91.2 46.0 68.5 60.2 68.6 68.4 45.6 56.1 137.3 59.7
35.7 40.7 39.1 44.0 49.8 51.0 63.7 79. 132.5 120.8
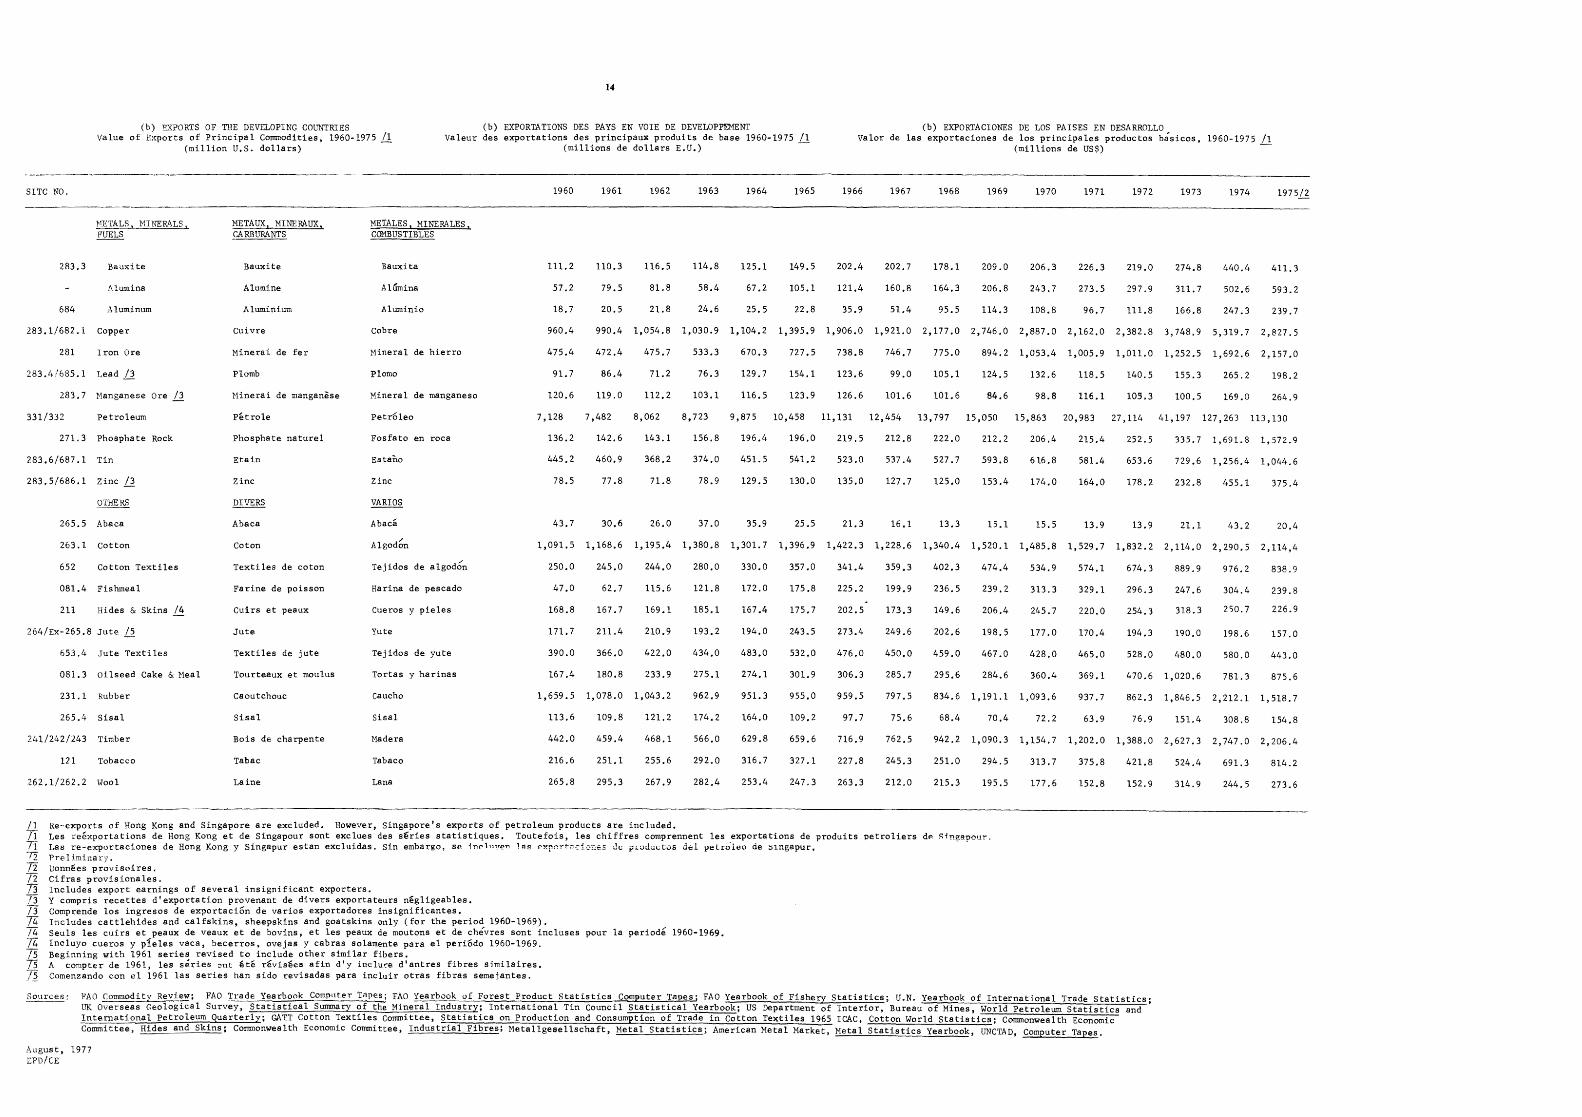
14
(b) EXPORTS OF TIlE DEVELOPING COUNTRIES (b) EXPORTATIONS DES PAYS EN VOlE DE DEVELOPPEMENT (b) EXPORTACIONES DE LOS PAISES EN DESARROLLO Value of E~ports of Principal Commodities, 1960-197511
(million U,S. dollars) Valeur des exportations des principaux produits de base 1960-1975 /1
(millions de dollars E.U.) --Valor de las exportaciones de los principa1es productos bisicos, 1960-1975 /1
(millions de US$) -
SITC NO. 1960 1961 1962 1963 1964 1965 1966 1967 1968 1969 1970 1971 1972 1973 1974 1975/2
-------_ .. _----------------------------------------------------------------------------
283.3 Bauxite
Alumina
684 Aluminum
283.1/682.1 Copper
281 Iron Ore
283.4/685.1 Lead /3
283.7 Hanganes€ Ore!2
METAUX, MINE RAUX, S.:ARBURANTS
Bauxite
A1umine
Aluminium
Cuivre
Minerai de fer
P10mb
"Hinerai de manganese
ME'IALES, MINERALES, cm-mus TIBLES
Bauxita
AlUmina
A1uminio
Cobre
Mineral de hierro
Plomo
Hinera1 de manganeso
111.2
57.2
18.7
960.4
475.4
91. 7
110.3 116.5 114.8 125.1 149.5 202.4 202.7 178.1 209.0 206.3 226.3 219.0 274.8 440.4 411.3
79.5 81.8 58.4 67.2 105.1 121.4 160.8 164.3 206.8 243.7 273.5 297.9 311. 7 502.6 593.2
20.5 21.8 24.6 25.5 22.8 35.9 51.4 95.5 114.3 108.8 96.7 111.8 166.8 247.3 239.7
990.4 1,054.8 1,030.9 1,104.2 1,395.9 1,906.0 1,921.0 2,177.0 2,746.0 2,887.0 2,162.0 2,382.8 3,748.9 5,319.7 2,827.5
472.4 475.7 533.3 670.3 727,5 738.8 746.7 775.0 894.2 1,053.4 1,005.9 1,011.0 1,252.5 1,692.6 2,157.0
86.4 71.2 76.3 129.7 154.1 123.6 99.0 105.1 124.5 132.6 118.5 140.5 155.3 265.2 198.2
120.6 119.0 112,2 103.1 116.5 123.9 126.6 101.6 101.6 84.6 98.B 116.1 105.3 100.5 169.0 264.9
331/332 Petroleum Petro1e Petr61eo 7,128 7,482 8,062 8,723 9,875 10,458 11,131 12,454 13,797 15,050 15,863 20,983 27,114 41,197 127,263 113,130
271.3 Phosphate Rock
283,6/687.1 Tin
283.5/686.1 Zinc /3
OTHERS
265.5 Abaca
Phosphate nature1
Etain
Zinc
DIVERS
Abaca
Fosfato en roca 136.2 142.6 143.1 156.8 196.4 196.0 219.5 212.8 222.0 212.2 206.4 215.4 252.5 335.7 1,691.8 1,572.9
Estano 445.2 460.9 368.2 374.0 451.5 541.2 523.0 537.4 527.7 593.8 616.8 581.4 653.6 729.6 1,256.4 1,044.6
Zinc 78.5 77.8 71.8 78.9 129.5 130.0 135.0 127.7 125.0 153.4 174.0 164.0 178.2 232.8 455.1 375.4
VARIOS
43,7 30,6 26,0 37.0 35.9 25.5 21.3 16.1 13.3 15.1 15.5 13.9 13.9 21.1 43.2 20.4
263.1 Cotton Coton
Abaca
A1god6n 1,091.5 1,168.6 1,195,4 1,380.8 1,301.7 1,396.9 1,422.3 1,228.6 1,340.4 1,520.1 1,485.8 1,529.7 1,832.2 2,114.0 2,290.5 2,114,4
652 Cotton Textiles Textiles de caton Tejidos de a1god~n 250.0 245.0 244,0 280.0 330.0 357.0 341.4 359,3 402,3 474.4 534.9 574.1 674.3 889.9 976.2 838.9
081.4 Fishmea1 Farine de poisson Harina de pescado 47.0 62.7 115.6 121.8 172.0 175.8 225.2 199.9 236.5 239.2 313.3 329.1 296.3 247.6 304.4 239.0
211 Hides & Skins /4 Cuirs et peaux Cueros y pie1es 168,8 167.7 169.1 185.1 167.4 175.7 202.5 173.3 149.6 206.4 245.7 220.0 254.3 318.3 250.7 226.9
264/Ex-265.8 Jute Jute Yute 171. 7 211.4 210,9 193.2 194,0 243.5 273.4 249.6 202.6 198.5 177 .0 170.4 194.3 190.0 198.6 157.0
653.4 Jute Textiles Textiles de jute Tejidos de yute 390.0 366.0 422.0 434.0 483,0 532.0 476,0 450.0 459.0 467.0 428.0 465.0 528.0 480.0 580.0 443.0
081.3 Oilseed Cake & Meal Tourteaux et mou1us Tortas y harinas 167.4 180.8 233.9 275.1 274.1 301.9 306.3 285.7 295.6 284.6 360,4 369.1 470.6 1,020.6 781.3 875.6
231.1 Ruhber Caoutchouc caucho 1,659.5 1,078.0 1,043.2 962.9 951.3 955.0 959.5 797.5 834.6 1,191.1 1,093.6 937.7 862,3 1,846.5 2,212.1 1,518.7
265.4 Sisal Sisal Sisal 113.6 109.8 121.2 174.2 164.0 109.2 97.7 75.6 68.4 70.4 72.2 63.9 76.9 151.4 308.8 154.8
241/242/243 Timber Bois de charpente Madera 442.0 459.4 468.1 566,0 629.8 659.6 716.9 762.5 942.2 1,090.3 1,154.7 1,202.0 1,388.0 2,627.3 2,747.0 2,206.4
121 Tobacco Tabac Tabaco 216.6 251.1 255.6 292.0 316.7 327.1 227.8 245.3 251.0 294.5 313.7 375.8 421.8 524.4 691.3 814.2
262.1/262.2 Wool Laine Lana 265.8 295.3 267.9 282.4 253.4 247.3 263.3 212.0 215.3 195.5 177.6 152.8 152.9 314.9 244.5 273.6
/1 Re-exports of Hong Kong and Singapore are excluded. However, Singapore's exports of petroleum products are included. /1 Les reexportations de Hong Kong et de Singapour sont exc1ues des s€ries statistiques. Toutefois, 1es chiffres comprennent 1es exportations de produits petro1iers dp ~;ngapour. 11 Las re-exportaciones de Hong Kong y Singapur estan exc1uidas. Sin embargo, se inr111"e!'! 1!!5 exp",.,...t:u::i.::::-,e=: J.t,; fIJ.;.;ducLos del VelLu'leo de :nngapur. "Pi Pre1i.minsry. Ti Donn~es provisoires. 72 Cifras provisionales. 73 Includes export earnings of several insignificant exporters. /3 Y compris recettes d' exporta tion provenaut de divers exportateurs n€gl1geab1es. 73 Comprende los ingresos de exportacion de varios exportadores insignificantes. 74 Includes catt1ehides and calfskins, sheepskins and goatskins only (for the period 1960-1969). /4 Seu1s 1es cuirs et peaux de veaux et de bovins, et 1es peaux de moutons et de chevres sont inc1uses pour 1a periode 1960-1969. /4 Inc1uyo cueros y pfe1es vaca, becerros, ovejas y cabras solamente para e1 periodo 1960-1969. 75 Beginning with 1961 series revised to include other similar fibers. T5 A compter de 1961, 1es series ont €te rC;:vis€eB afin cl'y inc1uce d'antres fibres simi1aires. 15 Comenzando con e1 1961 las series han sido revisadas para inc1uir otras fibras semejantes.
l'_~lrc~: FAO Commodity Review; FAa Trade Yearbook ComputeT Tllpes; FAa Yearbook of Forest Product Statistics Computer Tapes; FAO Yearbook of Fishery Statistics; U.N. Yearbook of International Trade Statistics; UK Overseas Geological Survey, Statistiaal Summary of the Mineral Industry; International Tin Council Statistical Yearbook; US Department of Interior, Bureau of Mines, World Petroleum Statistics and International Petroleum Quarterly; GATT Cotton Textiles committee, Statistics on Production and Consumption of Trade in Cotton Textiles 1965 IeAC, Cotton World Statistics; Commonwealth Economic Committee, Hides and Skins: Commonwealth Economic Committee, Industrial Fibres; Metal1gesel1schaft, Metal Statistics; American Metal Market, Metal Statistics Yearbook, UNCTAD, Computer Tapes.
August. 1977 I:PD/CE
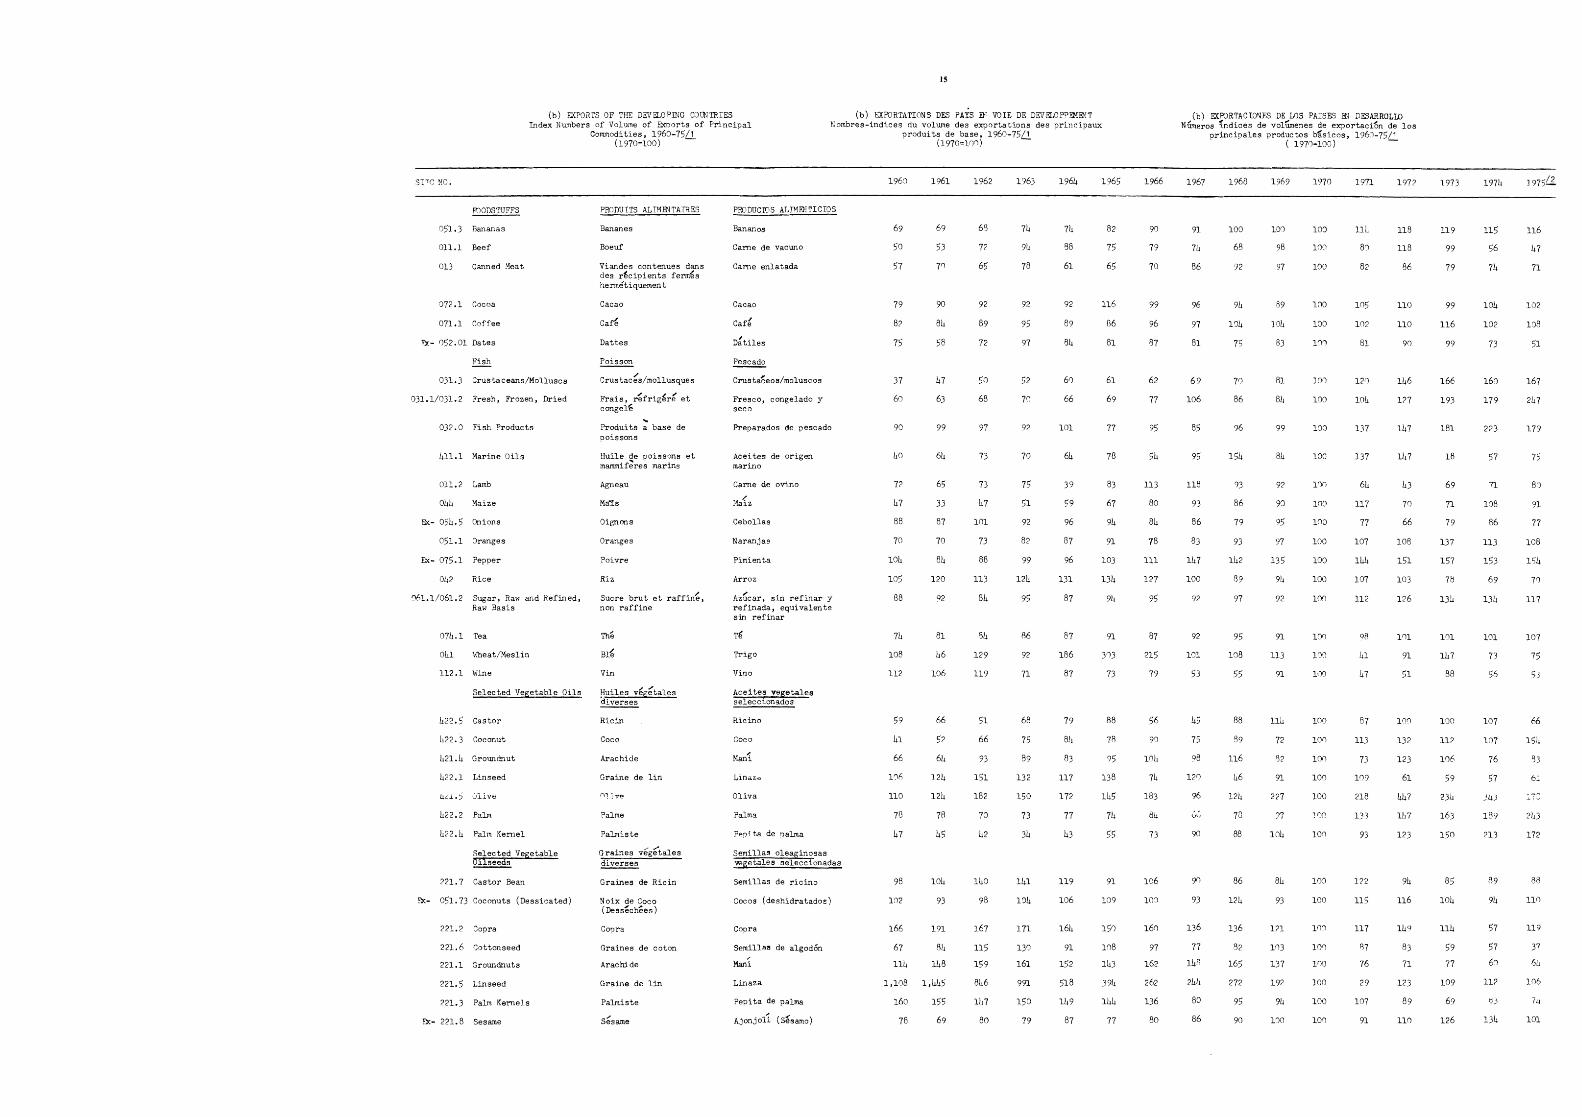
15
(b) EXRJRTATIONS DE.S PAYS ElT 'TOIE DE DE'JELOPP I!l1tNT (b) GX?ORrS OF THE DEVELOPING COUNTRIES Index l\umbers of Volume of Exoorts of Principal
Commodities, 1960-75/1 N ombres-indices exporta tions des principaux
1960-75L!.
8P!; NO.
FDODSTUFFS
051.3 Bananas
011.1 Beef
013 Canned Meat
On.l Cocoa
071.1 Coffee
~- ()52.01 Dates
Fish
031.3 Crustaceans/Molluscs
031.1/031. 2 Fresh, Frozen, Dried
032.0 Fish Products
411.1 Marine Oils
011.2 Lamb
044 Maize
Ex- 054.5 Onions
051.1 Oranges
Ex- 075.1 Pepper
042 Rice
')01.1/061.2 Sugar, Raw and Refined, Raw Basis
074.1 Tea
041 Hheat/Xeslin
112.1 Wine
Selected Vegetable Oils
422.5 Castor
L~22. 3 Coconut
421.4 Groundnut
422.1 Linseed
ud.S 'Jlive
422.2 Palm
422.4 Palm Kernel
Selected Vegetable Ol.lseeds
221. 7 Castor Bean
EX- 051. 73 Coconuts (Dessicated)
221.2 Copra
221. 0 Cottonseed
221.1 Groundnuts
221. 5 Linseed
221.3 Palm Kernels
Elc- 221. 8 Sesame
(1970~100) -
PRODUITS ALIMENTAIRES
Bananes
Boeuf
Vi andes contenues dans des r~cipients fernfes herme'tiquernen t
Cacao
Caf~
Dattes
Poisson
Crustac~s/mo11usques
Frais, r-efrig~re' et congel~
'" Produi ts a base de poissons
Huile de poissons et mammif;;'res marins
Agneau
Ma1:s
Oignons
Oranges
Poivre
Riz
Sucre brut et non raffine
Th';
Bl~
Vin
!'Iuiles v~g~tales ~
Ricin
Coco
Arachide
Graine de lin
n11Y~
Pa1me
Palmiste
Graines vegetales
~
Graines de Ricin
Noix de Coco (Dess-echees)
Copra
Graines de c oton
Arachide
Graine de lin
Palmiste
S~same
PRODUCros ALIMFWrr cros
Bananas
Came de vacuno
Came enlatada
Gacao
Caf~
D~tiles
~
Crustateos/moluscos
Fresco, congelado y seco
Preparados de pescado
Acei tes de origen marino
Carne de ovino
/' 11aiz
Cebol1as
Nara."1jas
Pimienta
Arroz
AzGcar, sin refinar y refinada, eq ui valen te sin refinar
Til
Trigo
'Tina
Aceites vegetsles seleccionados
Ricino
Coco
Man'i
Linazo
Oliva
Palma
P"pi til de TJalma
Semil1as oleaginosas vegeta1es seleccionadas
Semi11as de ricino
Cocos (deshidratados)
Copra
SemillRIl de algodon
Mani Linaza
Pepita de palma
Ajonjoll (S~samo)
1960
69
50
57
79
82
75
37
60
90
40
7?
47
88
70
104
105
88
74
108
112
59
41
66
10/S
110
78
47
98
1n2
1961
69
53
70
90
84
58
47
63
99
64
65
33
87
70
84
120
92
81
b6
106
66
52
64
124
124
78
45
104
93
166 191
67 8b
III ll8
1,108 1,445
160
78
IS5
69
1962
63
7?
65
92
89
72
50
68
97
73
73
47
101
73
88
113
84
84
129
119
51
66
93
151
182
70
42
luO
93
167
115
159
846
147
80
1963
74
9lJ
78
92
95
97
52
70
92
70
75
51
92
82
99
124
95
86
92
71
68
75
89
132
150
73
34
141
104
171
13')
161
991
150
79
1964
74
88
61
92
89
84
60
66
101
64
39
59
96
[37
96
131
87
87
186
87
79
84
83
117
172
77
43
119
106
16h
91
152
518
149
87
1965
82
75
65
116
(36
81
61
69
77
78
83
67
94
91
103
13h
94
91
31)3
73
88
78
95
138
11:5
74
55
91
109
150
108
11:3
394
144
77
1966
90
79
70
99
96
87
62
77
95
54
113
80
84
78
111
127
95
87
215
79
56
90
loh
74
183
04
73
106
100
160
97
162
262
136
80
(b) ElCRJRTACIONES DE LOS PAISES EN DESARROLW Ntl.'lleros 'indices de voliime:1es de enortaci'6n de los
principales productos b1i\sicos, 1960-75/1
1967
91
74
86
96
97
81
69
106
85
95
118
93
86
83
147
100
92
92
101
53
45
75
9f1
120
96
90
90
93
136
77
l4R
244
80
86
1968
100
68
92
94
104
7S
70
86
96
154
93
86
79
93
142
89
97
95
108
55
88
89
116
&6
124
78
88
86
124
136
82
165
272
95
90
( 1970=100) -
1969
101)
98
97
89
]04
83
81
84
99
81J
92
90
95
97
135
94
92
91
113
91
114
72
82
91
227
?7
104
84
93
1?l
11)3
137
192
91J
10C
1970
100
100
100
100
100
11)(')
Ion
100
100
lOG
l()n
100
100
100
100
100
1m
lOr)
100
lon
100
lon
lon
10n
100
loa
100
100
100
FJrl
ICY)
l0C)
100
100
100
1971
114
w)
82
105
102
Bl
12()
104
137
137
64
117
77
107
144
107
112
9R
41
47
87
113
73
11)9
218
13'
93
122
115
117
f37
76
29
107
?l
197?
118
118
86
110
110
90
146
1::>7
147
147
43
70
66
108
151
103
126
101
91
51
lOt')
13::>
123
61
hh7
11,7
123
94
116
14<)
83
71
123
89
110
1973
119
99
19
99
116
99
166
193
181
18
69
71
79
137
157
7CJ
13h
101
141
88
lC)O
11'
106
59
23h
163
150
85
104
H4
59
77
109
69
126
1974
115
56
74
101J
102
73
160
179
223
57
71
108
86
113
153
69
13L
101
73
107
107
76
57
Ifly
213
89
94
57
57
60
112
134
1975/2
116
47
71
102
108
51
167
247
179
75
So
91
77
108
1'54
70
117
107
75
53
66
151.
S3
6.1
243
172
HI)
119
37
64
106
7Ll
101
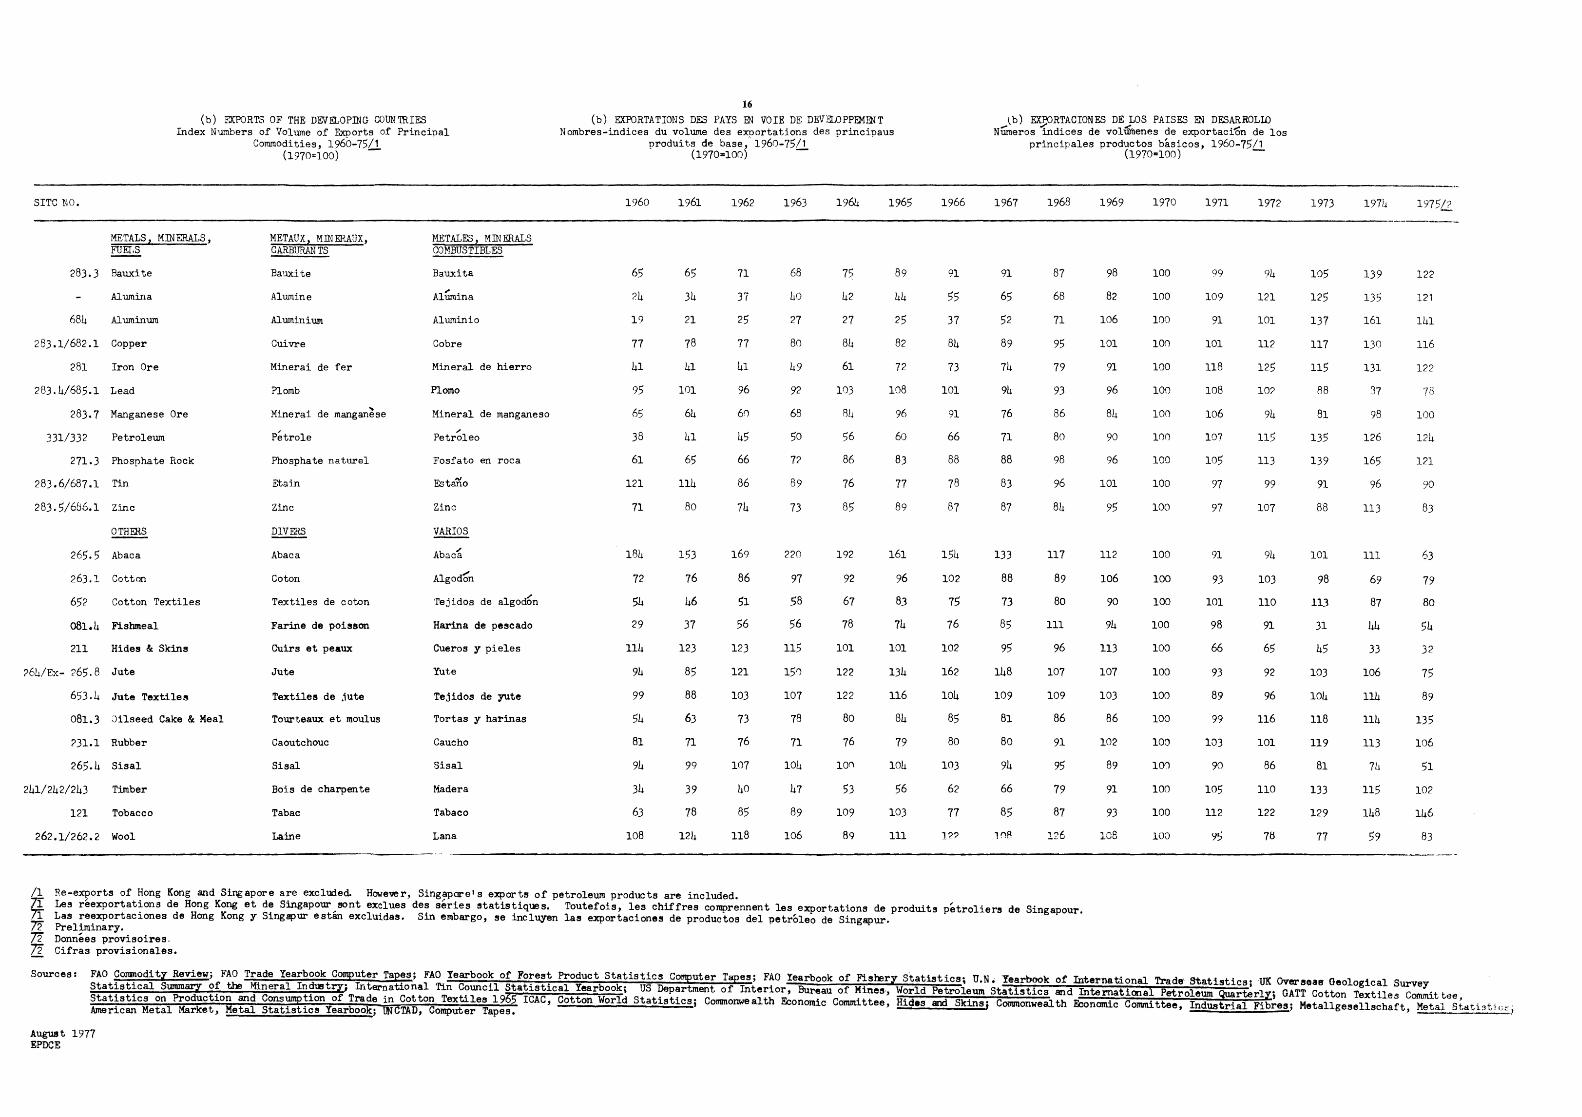
SITe NO.
(b) EXPORTS OF THE DEVELOPWG COUN'lRIES Index NTh~bers of Volume of Exoorts of Principal
Commodities, 196o-75Ll (1970=100)
16
(b) EXPORTATIONS DES PAYS EN VOIE DE DEVELOPPEMENT Nombres-indiees du volume des exportations des principaus
produits de base, 1960-75/1 (1970=100) --
1960 1961 1962 1963 1964 1965 1966
tb) EX~RTACIONES DE LOS PAISES EN DESARROLW Numeros indices de vol~enes de exportaci~n de los
principales productos basicos, 1960-75/1 (1970=100) --
1967 1968 1969 1970 1971 1972 1973 197i-i 1975/?
--------------------------------------------------------------------------------------------------------------------------------------------------------------------------------------------------------------------------------------------METALS, MlNERALS, ~
283.) Bauxite
Alumina
684 Aluminum
28).1/682.1 Copper
281 Iron Ore
283.4/685.1 Lead
283.7 Manganese Ore
331/332 Petroleum
271.) Phosphate Rock
283.6/687.1 Tin
283.5/686.1 Zinc
~
265.5 Abaca
263.1 Cottcm
652 Cotton Textiles
081.4 Fishmeal
211 Hides & Skins
?64/Ex- 265.8 Jute
653.4 Jute Textiles
081.3 Jilseed Cake & Meal
?31.1 Rubber
265.4 Sisal
241/242/243 Timber
121 Tobacco
262.1/262.2 Wool
METAUX, MINERAUX, CARBURANTS
Bauxite
Alumine
Aluminium
Cuivre
Minerai de fer
P10mb
l1inerai de manganese
Petro1e
Phosphate naturel
Etain
Zinc
~
Abaca
Coton
Textiles de eoton
Farine de poisson
Cuirs et peaux
Jute
Textiles de .iute
Tourteaux et moulus
Caoutchouc
Sisal
Bois de charpente
Tabac
Laine
METALES, MIN ERALS COMBUSTIBLES
Bauxita
Al:Gmina
A1uminio
Cobre
Mineral de hierro
Plomo
Mineral de manganeso
Petr~leo
Fosfa to en roea
Esta'Tlo
Zinc
~
Abac~
A1god'G'n
'rejidos de a1god6n
Harina de pescado
Cueros y pie1es
Yute
Tejidos de yute
Tortas y harinas
Caucho
Sisal
Madera
Tabaco
Lana
65
24
19
77
41
95
65
)8
61
121
71
184
72
54
29
114
94
99
54
81
94
34
63
108
65
34
21
78
41
101
64
41
65
114
80
153
76
46
37
123
85
88
63
71
99
39
78
124
71
37
25
77
41
96
60
45
66
86
74
169
86
1)1
56
123
121
103
73
76
107
40
85
118
68
40
27
80
49
92
68
50
72
89
73
220
97
58
56
115
15t)
107
78
71
104
47
89
106
75
42
27
84
61
103
BLi
56
86
76
85
192
92
67
78
101
122
122
80
76
Ion
53
109
89
89
44
25
82
72
108
96
60
83
77
89
161
96
83
74
101
134
116
84
79
104
56
103
111
91
55
37
84
73
101
91
66
88
78
87
154
102
75
76
102
162
100.
85
80
103
62
71
122
91
65
52
89
74
94
76
71
88
83
87
133
88
13
85
95
148
109
81
80
94
66
85
loR
87
68
71
95
79
93
86
80
98
96
84
117
89
80
111
96
107
109
86
91
95
79
87
126
/1 ~e-exports of Hong Kong and Singapore are excluded. However, Singapore! s e:xports of petroleum products are included. 7I Lee reexportations de Hong Kong et de Singapour sont exc1ues des series statistiques. Toutefois, 1es chiffres comprennent 1es exportations de produits petroliers de Singapour. 71 Las reexportaciones de Hong Kong y Singapur estao exc1uidas. Sin embargo, se inc1uyen las exportaciones de productos del petroleo de Singapur. 72 Preliminary. 72 Donnees provisoires-72 Cifras provisionales.
98
82
106
101
91
96
84
90
96
101
95
112
106
90
94
113
107
103
86
102
89
91
93
106
100
100
100
1m
100
100
100
100
100
100
100
100
100
100
100
100
100
100
100
100
100
100
100
100
99
109
91
101
118
108
106
107
105
97
97
91
93
101
98
66
93
89
99
103
90
105
112
95
94
121
101
112
125
10?
94
115
113
99
107
94
103
110
91
65
92
96
116
101
86
110
122
78
105
125
137
117
115
RS
81
135
139
91
88
101
98
113
31
45
103
104
118
119
81
133
129
77
139
135
161
130
131
37
98
126
165
96
113
111
69
81
44
33
106
114
114
113
74
115
148
59
122
121
141
116
122
73
100
124
121
90
83
63
79
80
54
32
75
89
135
106
51
102
146
83
Sources: FAD Commodity Review; FAa Trade Yearbook Computer Tapes; FAO Yearbook of Forest Product Statistics Computer Tapes; FAO Yearbook of Fishery Statistics; U.N. Yearbook of International Trad~Statistic8;UK Oversoas Geological Survey Statistical Summary of the Mineral IndllJtry; IntEll'nationa1 Tin Council Statistical Yearbook; US Department of Interior, Bureau of Mines-, World Petroleum Statistics and International Petroleum Quarterly; GATT Cotton Textiles Commit tee, Statistics on Production and Consumption of Trade in Cotton Textiles 19b$ rCAC, Cotton World Statistics; Commonwealth Economic Committee, Rides and Skins; Commonwealth Economic Committee, Industrial Fibres; Metal1gesellschaft, Metal Stati3tj~) American Metal Market, Metal Statistics Yearbook; UNCTAD, Computer Tapes.
August 1977 EPDCE
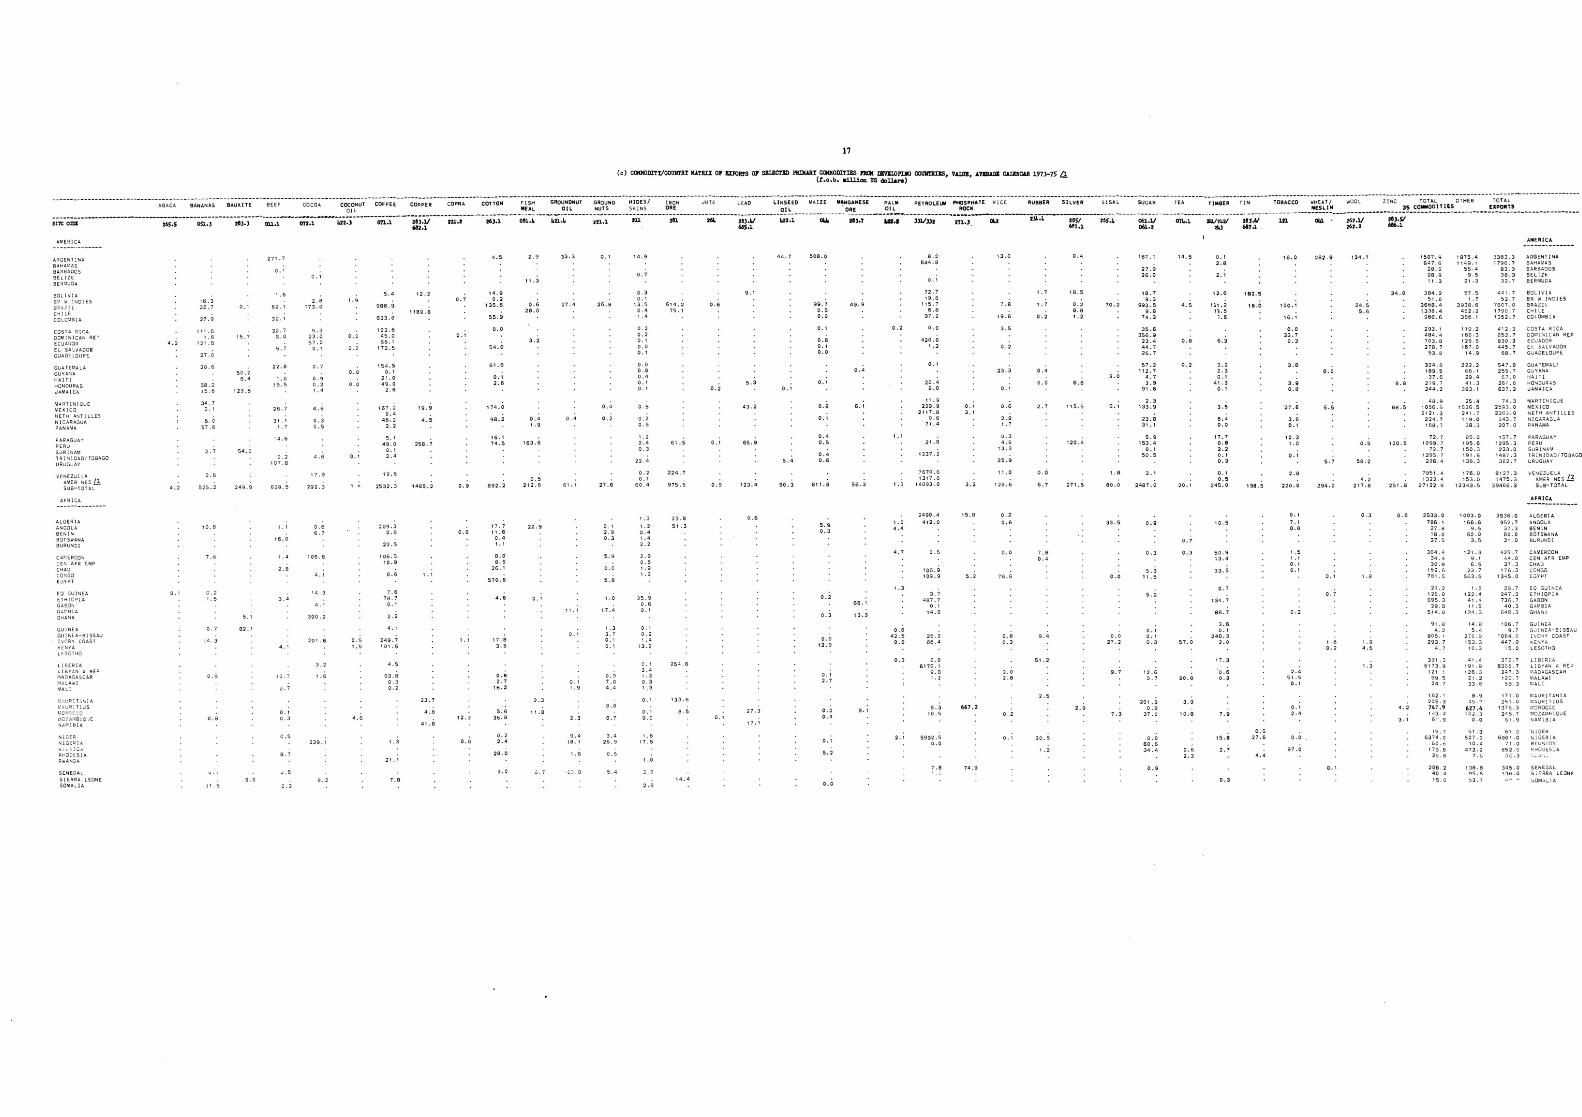
17
(c) COIIIOIlnt/COUNl'RI ILlTRU or IW'ORI'S or s&UCrID HIDWlI CQIIIOIlnIllS JlIQI /JBVIU)I'IJIO comrrans, V4LUI, J.VD!QI CUDIl&J! 1973-75 C!. (r .o.b. 1I1Jll0ll us dollua)
a l l MEAL all NUTS SKINS ORE all ORE Oil ROCK MESLIN 35 CO_OOITIU UPDRTS
;;~-~cmi-----------------z~-:;-----®.~------~8;~;---·;;'~~-·-~;;~--···-b2~:i------on:i----~e;:ii-----;~;---;6).~---- -OO~~b ·---b;;::4 - ----- -;;~.~-- ---- -;u--------~1--------zQ;-- -- ---a;:;;-------;Z:;:----- --;w:-- -- -al;~;---.;:;-·-- ,;;;~----' -;~:; aa 231.1 USI ;;s~---- -~:u- -----~74:~--- --zl.V2~zI----2e;:;; - - - - -~- - - -----;;-~----~-2~;;------;;.Si-----------------------------------------------68Z .1 68S.1 . ~1.1 o6l.·2 111) 68T.J. . 262.2 686.1
AKGENT I ~A BIl.HAM.\S BAR BAoas BE LIZE BE RMUDA
BOL I Vl". E:,0 W :NOI ES U&l lL CHI lE COLOMB I A
COSTA RIr;A DO MIN I CAN RE-' ECUADOR El SA lVA DOQ GUA.D E LOUP E
GUATEMA LA GU YAN A ~ AI T I HONDURAS J AMA I CA
M,.\I=1 T I N1 Qu E t.1[X leo N E TH A!"l T I L LE S NI CARAGU A PANAMA
PA RAG UAY PERU SUR IN AM TR IN IDAD / TOBAGO URUG UAY
VEN EZU ELA AMER NE S 12 SUB - TOTAL
ALeER' tA ANGOLA BE NIN BOTSWANA BURU NDI
C.u·: EROON CEN AFR E.M? CHAD CONGO EGYPT
EO GUI NEA ET HI OP I A GA8 0N G.::.r:B J A
GUIN EA GU I NEA-BiSSAU 1 vQRy CDASf kE N¥~
LES GTHO
LI BERIA LIBY AN A RE P rA ADAGt.SCA R r'.'~L A ·H I M~LI
Mt..t:cn T .... .... I A r/: ~ uQI T I uS r.1( · "· " ,; rf,8 21.Il B IQ'JE. N,Uol!8 IA
NlCER N IGEwlA.
RHODES IA Rw ANDA
S ENEGAL SIERRA L EON E SOMA LI A
16 . 3 22.7
1 1 "6 , .6
12 1.8
27 .0
56 .2 15 , 6
34.7 0.1
57,6
525.2
,0.6
0.2 1.5
0.7
0.9
o. B
0. 1
123.5
249.9
82. ,
271, 7
62.1
32.1
32.7 8 .0
22.B
26.7
3 1.1 1.7
14.6
0 .2 107 .8
639.5
16. 0
13.7
0 .7
O . I
0. 3
0. 5
2.8 173. 0
5.3 23.0 5 7. 0
O. I
0. " 0 .2
4.6
0.3 0. 5
4.6
292.3
0.6 6 . 7
105.B
14 . 3
1.6
239. ,
8.2
0.2
0.5
4.6
5. 4
986.9
633.0
103. 8 45.0 66 .1
17 2 . 5
1 S~ . 5 0. 1
21 . 0 49.0
2. B
167.2 0.4
46.2 2.2
5. I 49. a
0.1 2.4
19. e
2532. 3
209.3 0.6
23.5
106.5 10. 9
0. 6
7. 6 78.7
O. I
2.2
2<9.7 '0' . 6
6 3.8 0 . 3 0.2
21. 1
l1B9 . 8
19. 9
258 . 7
1485 . 2
41 . 8
14 . 9 0 .2
\ 35 .6
55.9
0 . 0
5 4.0
6 1.6
0.1 2.6
174. 0
98.2
16. t 74. 5
692.2
11.6 0.' 1.1
8.0 8. 5
570.6
4 . 6
17. 8 3.5
O.B 2 .7
16.2
36.8
0.2 2.4
3.0
2 .9
11 . 3
16 3.8
0.5 212. 6
0. 1
2.3
v.7
33 .3
0 . 4
0.1
0 . 1 1.9
2.3
9. 4 lS. 1
· C·J . 8
2 6.8
0.2
2 7. 6
0 . 1 2.9 0 .3
1.0
17. 4
1 . 3 3 . 7 O. I
0.1
0." 7.0 4 . 4
3 .• 26 .9
5 . 4
0 .1 1 3 .5 0.4
0.2 0.2 o. I 0.0 0.1
0.0 0.0 0.4 0. 1
0.5
0.2 0.5
1.2 2.4 0.3
0.1 60. 4
1 . 3
0. 4 1.4 2.2
2.9 0 .5 1. 9 1.2
25 . 9 0.6
o. I 0.2 1.4
1 3. 2
1.2 0. 3 1.3
O. I y. C
1 . 6 1 7. S
1 .0
3,0
975 . 5
23.8 5 1 .3
254.6
133.6
8. 5
0 . 6
0 . 2
0 .1
5 .3
43.2
65.9
5 . 4
0 . 6
SO B.O
99.7 0 . 5 0 . 0
O. I
0 . 6 o. I 0 .0
0.1
0 .8
0.1
0.4 0 . 5
0. 4 0.6
5.9 0.3
0 .2
0.3
0.0 12. 9
0. 1 2 .7
O. I
5 .2
0.4
68.1
1 3 . 3
0 . 2
1.~
1.0 4 . 4
42. 5 0 . 0
0.3
72 . 7 19 .6
115.7 6.B
9 7.2
0.0
420.0 1 . 2
20 . 4 8.0
1 1 . 9 229 ."
2 117.8 0.6
71 .4
21.8
1237.2
7 670.6 1317.0
14093.0
4C2.0
106. 9 109.9
3.7 4 87.7
0 .1
2S .2 66.4
0.0 6170.1
9.8 1 .2
5.3 10.5
5992.5 0.0
7. 8
O. I 3. I
3 . 2
15 .8
5 .2
667 . 2
74 .9
3. 5
23.3
2.8 1 . 7
0. 3 4.6
13 . 3
25.9
11 . 0
0 . 2 0. 6
76.6
0.8 0.3
3.0 2 . 8
0 . 2
0 . 4
0 . 0
2 . 7
0.0
6.7
7.8 0.4
51.2
30.5
1.2
0.'
1 B. 5
0 . 2 8 . B
6.6
115.5
2. 9
3. 0
I.B
33.5
0.0
0.0 :27 . 2
9.7
7.3
2 7.9 26.0
lB .7 9.3
993 . 5 9.8
74.3
35. 6 356.9
2 3 . 4 44.7 26.7
57.2 112.7
4.7 3. 9
9 1 . 6
2 .3 133 . 9
23 . 8 31.1
5 .9 153.4
0. 1 5 0. 5
2487.0
0 .9
0.3
5. 3 11.5
O. I 0.1 0. 3
12.6 9. 7
201. 3 o .B
37 .0
0.0 60 . 6 34.4
14 . 5
0 .2
5 7.0
3.9
10 .8
0.6 2 . 3
0 .1 2.8
2.1
12 . 6
1 ~1 . 2 11 . 5 1.6
6 . 3
3.2 2. 3 0. 1
41 . 3 0.1
3. 5
6 . 4 0 . 0
17 .• 7 O. B 2 . 2 0 .1 0 . 3
O. I 0. 5
2 45.0
1 0.5
50.9 13 . 4
33.5
0.7
8B. 7
3.6 0 . 1
2 40. 3 2. 0
17. 3
' 0. 6
7.9
16 . 0
16 . 0
100.1
16.1
0 . 0 33 .7
0. 3
3 .8
3.9 0 .8
2 7. 6
3 .6 O . I
10. J 1.0
22 0.0
O. I
7 .1 O. B
1.1 0.1 0.1
0.2
2.4 51.5 0.1
0. 1 2.4
0.0.
262.9
0 .0
5.5
O. I
0.7
1 . B 0.2
124 .7
24.5 5 .6
58.2
4.2 217.8
0.3
1 .6 4.5
1. 3
34.0
B8 .5
120 . 5
0.6
3.1
1507.9 6 4 7.6
28 .0 28.9 11 . 3
384.2 5 1. 0
366B. 4 , 3 38. 4 966.6
293. , 484. 4 703.8 2 7B.7
5 3. B
3 24.8 lB9. 5
3 7 .6 2 19.7 2Ll.c:l.2
~8 . 9 10 56.5 2121.3
224 . 7 168,7
72.7 1099.7
72. 7 1295 .7
226. 4
795 ' .4 13 22. 4
271 22. 9
2533.0 786 . ,
27 . 8 18.0 27 ,5
34 . 9 30.9
152. 6 7 81.5
24 . 2 125.0 695.3
28. B 514 .0
9, , 8 4 .2
8 0 S . \ 293 . 7
3 31.3 6173.9
12 1 .1 99 . 5 24 .7
162 .1 2 05 .3 747. 9 l o.l 3 . 4
6 ,., 9
lS.7 6~74, 0
60 . 6 1 79 . 8
28 .8
206 .2 40 . ,j
15. 0
1675 . 4 114 9.1
55,4 9 . 5
57 . 5 1.7
3938. 6 452.2 386 . I
, 19.2 ,68 . 3 \ 26, 5 167.0
14.9
222.2 66 . 1 29.4 ~ 1. 3
393 . 1
25.4 153 6 . 5
2 41 . 7 1 \ 9.0 3B.3
85,0 195.6 150 .3 191.6 136 . 3
'53 . 0 1 23"13.5
10 0 3 .0 , 66.6
9 .5 62.0
3.5
9. 1 6.5
23.7 5 5 3.5
14. 8 5.4
2 78.9 153,3
4 1 ."1 19 1 .8 126. 3
2 1 .2 33. 6
45. 7
627 . 4 101. 3
0. 0
3383.3 1796 .7
83 .3 38 . 3 32.7
,( ,j l.7
52,7 7607 . 0 1790 .7 , 3 5 2. 7
AME RICA
ARGENTI NA 8AHAil1A S BARB A- OD S 8ELlZE BERMUCA
SOL I v l A BR W IN DI ES 9RAZIL CHI LE COLOj{,B I A
4 1 2. 3 COS TA RICA 6 5:2.7 OOMl\! I CAN REP 830.3 ECUA DO R 445 . 7 EL SA LVADOR 68,7 GU;.O ELOUP E
54 7.0 255 . 7
67 . 0 26 1.0 637. 3
7 4 . 3 2 593.0 23 53 .0
3 4 3.7 207.0
12 9 5.3 223.0
1487 . 3 362.7
9127 . 3 ' 4 75.3
3 9466.3
3 5 36.0 952.7
37.3 BO .0 31,0
GUAT EM AL/ GUYANA HAl Tl HON DU R!.S JlI.MAIC A
MA R TI NI QU E ME XI CO NE f H AN TlllE S NICARA GUA
PA RAGUAY PE RU SuR1NA ~ TRINI OAO/TOS AGO URUGuAY
VE~~~~ E~~ S 11 SUB-T OT A L
AFRICA --------------~ L GE RIA.
ANGO LA BEN IN BO TSWAN A BL.:RUND:
4 25. 7 CAMEROON 44.0 CEN AFR Er" p 37.3 CHAO
176 . 3 CONGO 13~5. 0 EG.Y j:>T
2 5. 7 247 . 3 736 . 7 40.3
648.3
EO GUI N!:. A ET HI OP IA GABON G;' MB IA
, 06 .7 GU INEA 9 .7 GiJJ NEA- 91 5SA U
10 B4.0 I\iO~Y COAST K ENYA LES OTHO
3 72 ,7 635 5. 7
247.3 1 20.7 sa .3
17 1. 0 251 . 0
1375.3 245.7
61 .9
LIS t " ].\. LI eV AN A REp t(. AD.\.GASCAR MALA' .... ' MAL T
f/;.l.UR j TIUS i/ :JRDCC:J i.l0 ZMiB IQU E NAMlaI A.
5 1. 3 6 , 0 N JGER 527.0 690.0 NIC(HIA
10 .4 7 ,0 R ( UI\I]ON 47 2.2 65. 0 RHOD~5 1A
7 .r. 3 .3
138.8 9S . '::;
34 5 .0 SENEGA L 116.0 5 I F..RRA LEON !:
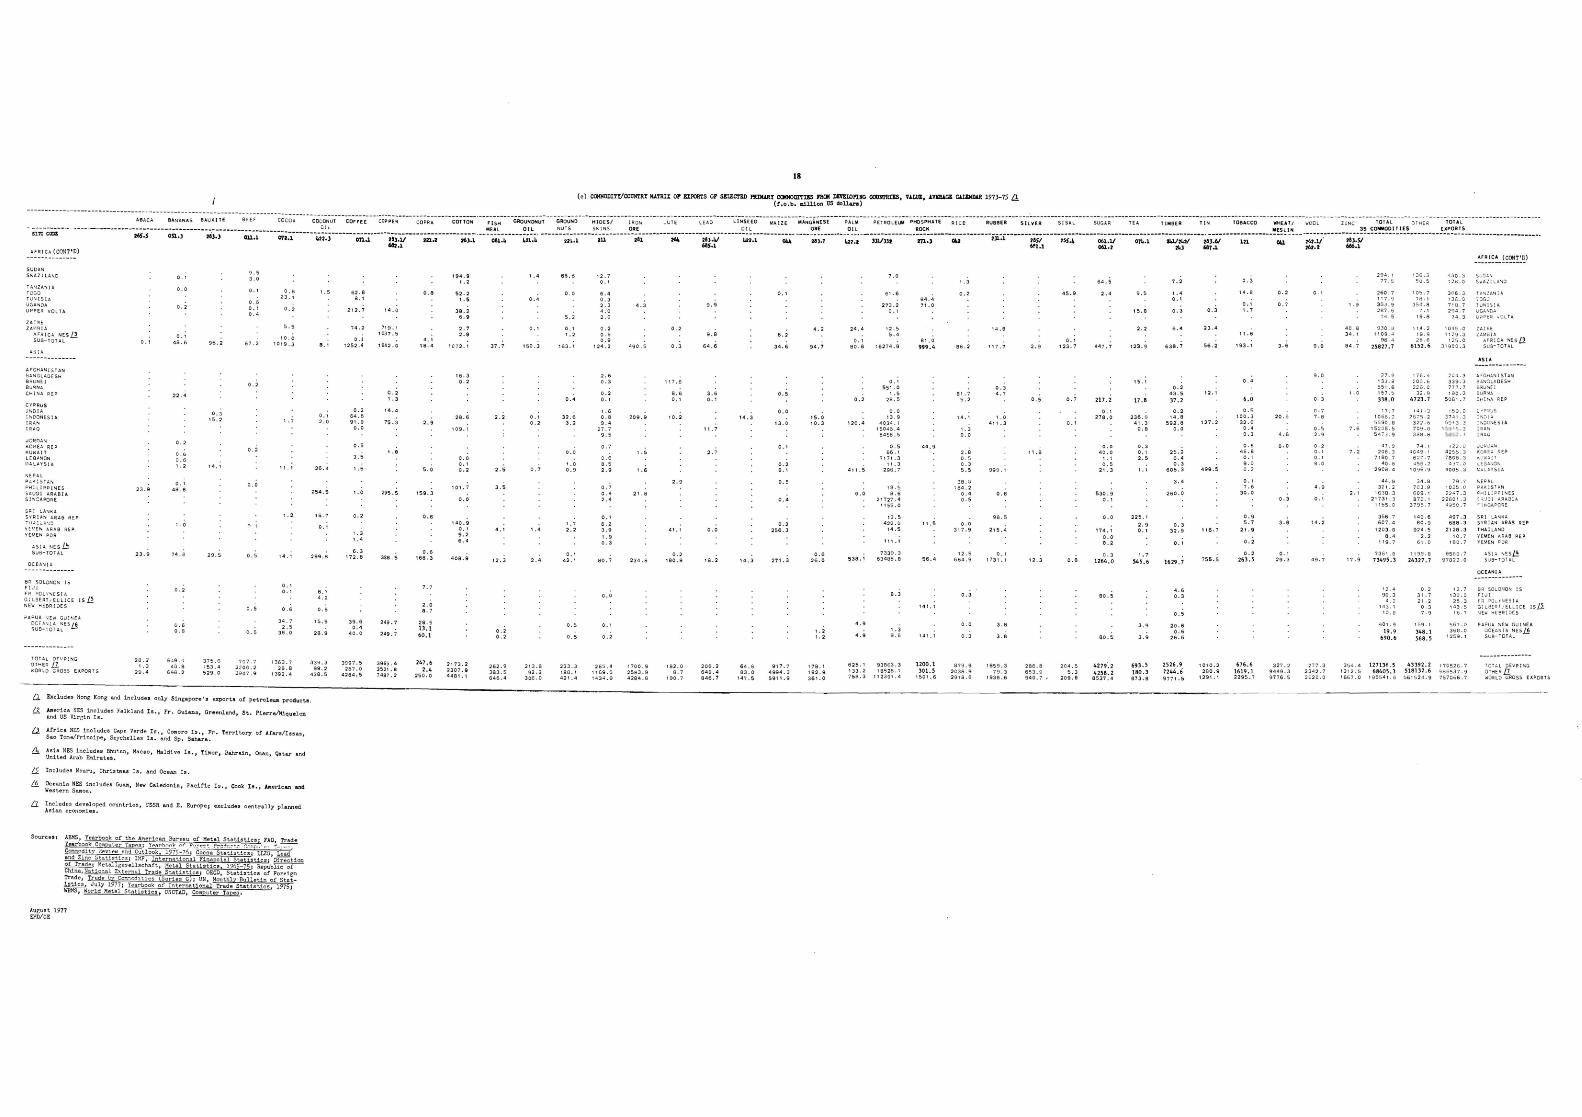
18
( 0 ) COKKODlTI/COtJNTRI IUTRII or EXPORTS or SXLECTBD I'IIIlURI C(JI!IODlTW 1'RQI DlV!IDPING COUlI'I'RIES, VllDl:, .lVJ:II.I.GK CUDll.LR 1973-75 ~ (1'.o.b. million US dol1&r.)
~~~== ~==~~~=~~~==~~~~=~~=~===~~==~~~==~~~=~~=~~~~~~=~~~~==~~==~~==~~=~~=~~~=~~=~=======---• OSl.) 28). ) Dll.l 071.1 ~22.) On.l 21).1/ 221.2 261.1 011.~ ~21.4 .21.1 2U 211 * 21)."" 1.22.1 Oi&& '8).T 1.2'.2 )31/112 m.J 0Ia 2)1.1 21S1 'SS.~ 061.1/ 07~.1 w.J2421 211.61 Ul CI.1 2~2.1/ "1.51
AFRIC. (CONT 'D ) 682.1 68S.1 ~l.l 0&1.2 241 687.1 262.2 686.1
-----_ .. _-----SWAZI lAr\O
T A~JZANI A TOGO TU:-" I SlA UGANDA UPPER VOL TA.
lAIMH A AFRICA NSS / 3 SUS- TOTAL -
A F CH AN [ S TAN BA"I Gl ADE SH BRU NEI BU QMA CH l NA REP
CY P Ru S INDIA 1 Nl' ONES lA IR Ai'll I RAQ
JCRQ," KOR EA RE P KUWAI T LEBANON M.\ l .A YS1 A
NE.PA L p;'K! S rM~
~H I LI PP JNES SA UD I ARABI A SI N:::APOR E
S !: J lA'lI( A SV R !AN AR.\S ~EP ~ H "'; i..!. ": : Y~~:E IIt ARAB REP y t MEN PO R
ASI ~ NE 5 J..!; S US- TOT Al
OCEANIA
B R SOLOMON IS F IJ I f F1: ~OLY~E S [ A
GI LB ERT I E LllCE IS 11 NEW H EaR l DES
PAPUA ~~E''''' GUU iEA ocr AN IA NES /6 SUO-1 0 TAL -
23.9
0.1 48.6
0.6 O.G 1.2
0.1 48 . 9
0.2
0. 6 0.6
96.2
0. 3 15 . 2
9 . S 3 . 0
0. 1 0 . •
0.5
0.6 2 3. 1
0. 2
5 .5
10. 0 '0 19. 3
O. I
0.6
34. 7 2 .5
38.0
0.1 2.0
254. 5
.299.8
8 .', 4 . 2
0 .5
2 8 . 9
62 . 9 S. ,
212. 7
1252.4
0.2 64.8 9 1 .9 0.0
0.5
1.6
1.0
0 . 2
1. 3 1.4
6 . 3 1 72.8
3 9 . 6 0.4
40.0
'4.0
719 .1 1037.5
0. 2 , . 3
75 . 3
295.5
3S8. 5
249 . 1
249.7
To rAl Or V P ! NG OlH ER / 1
2 8. :2'
'.3 2 9 .4
649 .4 40. 8
6G-S. 2
375.6 : 53.4 529 . 0
707.7 3 :.'! OO.2 :3 907. 9
1 ~63. 7 28. 6
1392 . 4
33 9 . 3 3~97 . S 3965. 4 99.2 287.0 3521.8 WORLD GROSS EXP ORT S
438.5 42 64. 5 7497.2
L!. &xc l udes Hong Kong and include , onl y Singapore '!I export" of pet r olE!Wll product e .
/2 Amer ica NES includes Falkland Is . , Fr. Guiana, Gr e enland , St. Pierre.l'K1quelon - ond US Virgi n Is .
D. Arr1ca NFS i nc l udes Cape Ver d e I s. , Comoro I s ., Fto. Territory or Afars/Is~8s , Sao TOMe/Principe, Seychelle:5 Is . and Sp . Sahara.
&. AsiA }lES includes Bhu~QJl, Hacao, Maldive Is . , Timor, Bahrain , Onan , ~at8l' and Uni t.ed Arab Emi r a t es .
Li Include.!! Nauru, Christmas I s . and Ocetm Is.
& OceaniA NES inc l udes Guam, New Caledonia, Pa cific I S. , Cook Ie., Americ an and Wes tern S8Jll.oa.
a Includes devel oped countri es, USSR and E. Eur op e ; excludes centrally p lanned Asinn economies .
Sources t Aa.'iS, Yearbook of t he AMerican Bureau of Metal Statistics' FAO, Trade
~;~~1~-j5:;6~~~~~~a?~~;~~:~i~~:·r'~~;~ J :~ ~ St3tistics' I¥.F , Internnti or.al Flnll.nciE'.l Statis t ics' ~ of Trade; Metal lges ellschaft , lietsl Statistics 1%~-75' Republic of China, llat 0 a1 E.'t"t ern&l Trade Statis t ics ' OEeD, Statis tics of Fore.i.en Tra.de, Tr ad e by CCTTI.' ("j('h.t ies \Sel'ies C ; UN , Monthly BUlletin of Sto.ti ,tics July 1977 ; Y~8rbook of In tf'rnational Trade Sta tistics 1975; WBMS, World Met al Statisti cs , UnC TAD, Compu ter Tapes.
AUGust 1977 EPD/CE
4. ' 1 8 . 4
2 . 9
5 . 0
15 9. 3
0 . 6
0.6 166.3
2.0 8 .7
28. 5 13 . 1 60. 1
19 4 .9 1. 2
5 2 . 2 1. 5
36.2 6 .9
2 .7 2.8
'6.3 0.2
0 . 0 0.' 0.2
10 1 . 7
0.0
,40. 9 0. 1 5 .2 6. 4
40 8 . 9
247. 6 2 1 73.2 2 .4 230 7 . 9
250.0 4481.1
2.5
4 .1
12 .3
0.2 0 . 2
262.9 383 . 5 646.4
1 50. 3
o. I 0.2
0. 7
213.8 9 2.2
306.0
6 8.0
5 . 2
0 . ' 1. 2
0.4
3 2.6 3 .2
1 . 0 0. 9
1 .7 2 .2
0. 1 4:2 . 1
l e B . , 421.4
12.7 O . I
6.4 0.3 2.3 4. 0 2.0
0 . 2 0 .6 0.9
, 24. 2
2 . 6 C .3
0.2
1 .6 0.8 9 .4
27.7 9 .5
0.7
0.6 8 . 5 2 . 9
0 . 7 0.4 2.4
0.1 6.2 3.9 1.9 0. 3
30.7
0.0
209.9
1 .6
234. 8
1700.9 2583.9 428 4 .8
6 . 6 0.1
41. ,
0.2 ' 90 . 8
182.0 8.7
190.7
9.8
64 . 6
3 .6 0.1
18 . 2
206.2 640.4 846. 7
' 4 . 3
6 4 .6 63.0
14 7. 5
0.5
0.2 0. 1
0.2 2 56.3
2 7 1.3
9 1 7. 7 4994 .3 59 1 1 .9
4. 2
94.7
'5 .0 10. 3
0 .6
179.1 18:2 . 9 3 6 1.0
€1.6
273.2 o . I
24.4 12.5 5.4
0. 1 80.8 '62 74.8
0.2
O . I
55 ' . 0 1.5
28.5
0 . 0 13 .9
4034 .1 t50 46. ~ 545€ .5
0.5 66.1
7171.3 11.3
296 .7
16 .5 0.0 8.6
5 39. ,
4 . 9
2 1 727.4 l1SS .0
13.5 4:2 u .CI
14 . 5
7339.3 63485.9
6 . 3
1 . 3 9.6
6 2 5. 1 9386 3. 3 1 3 3_ 2 185 28.1 7 5 8.3 l' 23 91.4
84.4 7' . 0
8 1. 0 999.4
1 1 . 5
56 .4
120 0 . 1 301.5
150 1. 6
86. 2
81. 7 5.2
: .3 0.0
2. 8 0.5 0 .3
38.0 18 4 . 2
0.4 0.5
0.0 31 7 . 9
12.5 664.9
879 . 9 2 038 . 9 2 918 .8
14 . 9
999. 1
2 15.4
1 73L l
185 9 . 3 79 . 3
0 . 5
12.3
45.9
O . I 12 3 .7
0 . 7
0 . 6
286.8 2 04.5 653. 9 5.3 9 40.7 ;" 209 . 8
6 4 .5
2.4
44 7. 7
21 7.2
O. I
27 8 .0
1. 1 0 . 5
2'.3
530.9
0 . 0
114 . 1 0.0 0 . 2
0 .3 1264. 0
BO.5
80 . 5
42 79·. 2 4 258.2 8537.4
1 5.8
2 . 2
12 3 . 9
17 . 8
2 3 6 . 9 4 1.3
O.B
0.1 2. 5
225_ ,
2. 9 0 .1
1.7 :145 .6
3 . 9
0 . 3
63B. 7
0.2 43.5
37.2
14.8 592.B
0.0
0.' 0.3
605 . 3
260 . 0
0. 3 3 2. 9
1629 . 7
4. 6 0.3
0.5
:2 0 .6 0 . 6
26.6
693 . 5 2526.9 180. 3 7244. 6 87 3 .9 9 77 1 . 5
0 . 3
23.4
56.2
' 27. 2
499.5
116 .7
755.5
1010 . 2 280.9
0. 3
o . I 1. 7
11 .6
6 .0
0.5 100.3 32.6 o. , 0.3
0.5 46. 8
O. I 9. 0 0 .2
O. I
7 .6 30.0
0.9 5.7
2 1.9
0. 2
0.2 263. 5
676 . 6 16 19.1 2295.7
3 . 6
0.0
0.3
3.6
O. , 29.3
3 2 7.2 9449.3 3776. 5
9.0
0.3
i. a
0.5 2 ·9
0.2 0.1 0. 1 9 . 0
277. 3 23 4 :2 . 7
4 0 . 8 34 . 1
17 . 9
2 9 ~. 1 77. 5
260 .7 1 1 7 . '3 36.3.9 2 87. 6
9;10.8 11 09.o.l
96.4 258 27. 7
n.9 1 3 3.8 5 51.6 157 . ~ 338. 0
1066. :2 5590.8
152::1 5. 5 54 7 J.9
354 .8 7 .1
1 1 4.2 19. 9 ~8. 6
61 52 . 6
£ 0 5.6 22C.O
32 . 9 4723.7
.?675.2 3 22.6 70 9 _0
47. 9 74., 2 06.3 4049 . 1
7180.7 627.7 40 .8 o.l5 6 . 2
29 08. 4 109 6.9
-~~~~~~- ~~~:::~)
4 30. 3 SJ:)..; t>, 128 . 0 SwAZI:,,;:'\jD
3 G6.3 T AN1M~T A 1 36.0 TQGJ 71 B . 7 ~ UN 151 A. 2 So.l . 7 UGAf\D~
U;::.Pf:R ve LTA
' 0 45.0 ZAl ;:;E 1 1 J9 . 3 It.rA8IA 1~5 .0 ,l, FR!CA NES l1
SUS- TOTA. L
204 .3 A FGHANi STAN 339 .3 Bt..r..:G l AOESH 777.7 BRU!'-IE I ,90 . 3 BU ~ ~A
5061 . 7 CH[t,A R EP
c. .... Pl4;.Js
.17 4 1 .3 IN;)! ;' 5913.3 !fo"OONE SIA
' !1·' .3 IRA.1'f I RA O
12"1. . U .;Ul-Ill;..N 42 5<;' .3 KQRF.:.. REP 780 8 . 3 ,... ~".~· .ur
~.J"i.0 u : e;';>lDf'4 4005 . 3 1: . ..\LAY SI A
44. 9 321.2
1638.3 2 17 3 1.3
1 155.0
34.8 fo"EPA.l
356 . 7 607.4
12 03. 8 6.4
73 61.8 7349 5 .3
12.4 98.3
4 .2 143. 1
10. 8
40 ' .9 19 . 9
690 .6
7C3 . 8 ' 0 250 PA·<lSn .. N 60 9.1 2'4 7.3 PHlL:PPINES 870. , 22601 . 3 ~ ':")DI ;' PAO I I.
3 795.7 c lNGAPO RE
140.6 80· 9
924.5
~ 198 . 8 243 27 . 7
0.2 31.7 21. 2 0.3
1 5 9 . 1
348 . 1 568 . 5
497.3 SR I LA NKA 6 BB.3 SYRIAN ARAB RE P
21 28.3 TH A. I LAND YEMEN ARA9 PE P YEMEN POR
8 5 60 .7 A.S1;. NES~ 97a23.0 SUB-TOTAL
OC EAN IA.
, 2 .7 6R SOLOMON 1 S 130.0 F IJI 25.3 F~ POLY~~ E SlA
143. 5 GllB~HT / ELl!CE 1S L1 18 . 7 N E~' HE9R1 DES
561 _ 0 PA PUA \;£IN GUINEA. 3 6 0.0 OCEA.NIA NES l!
12 59 .1 SUB-TOT AL
354. 4 127136 . 5 43392. 2 17 0 52 6 .7 13 12 .5 6840 5. 3 518132 .6 58653 7.9
195541. 6 ~615 2 ~.9 757066.7
TCT:" L DEV PI /I.;G OT HER ll ·W'I' OR l D GROSS EXPORT S
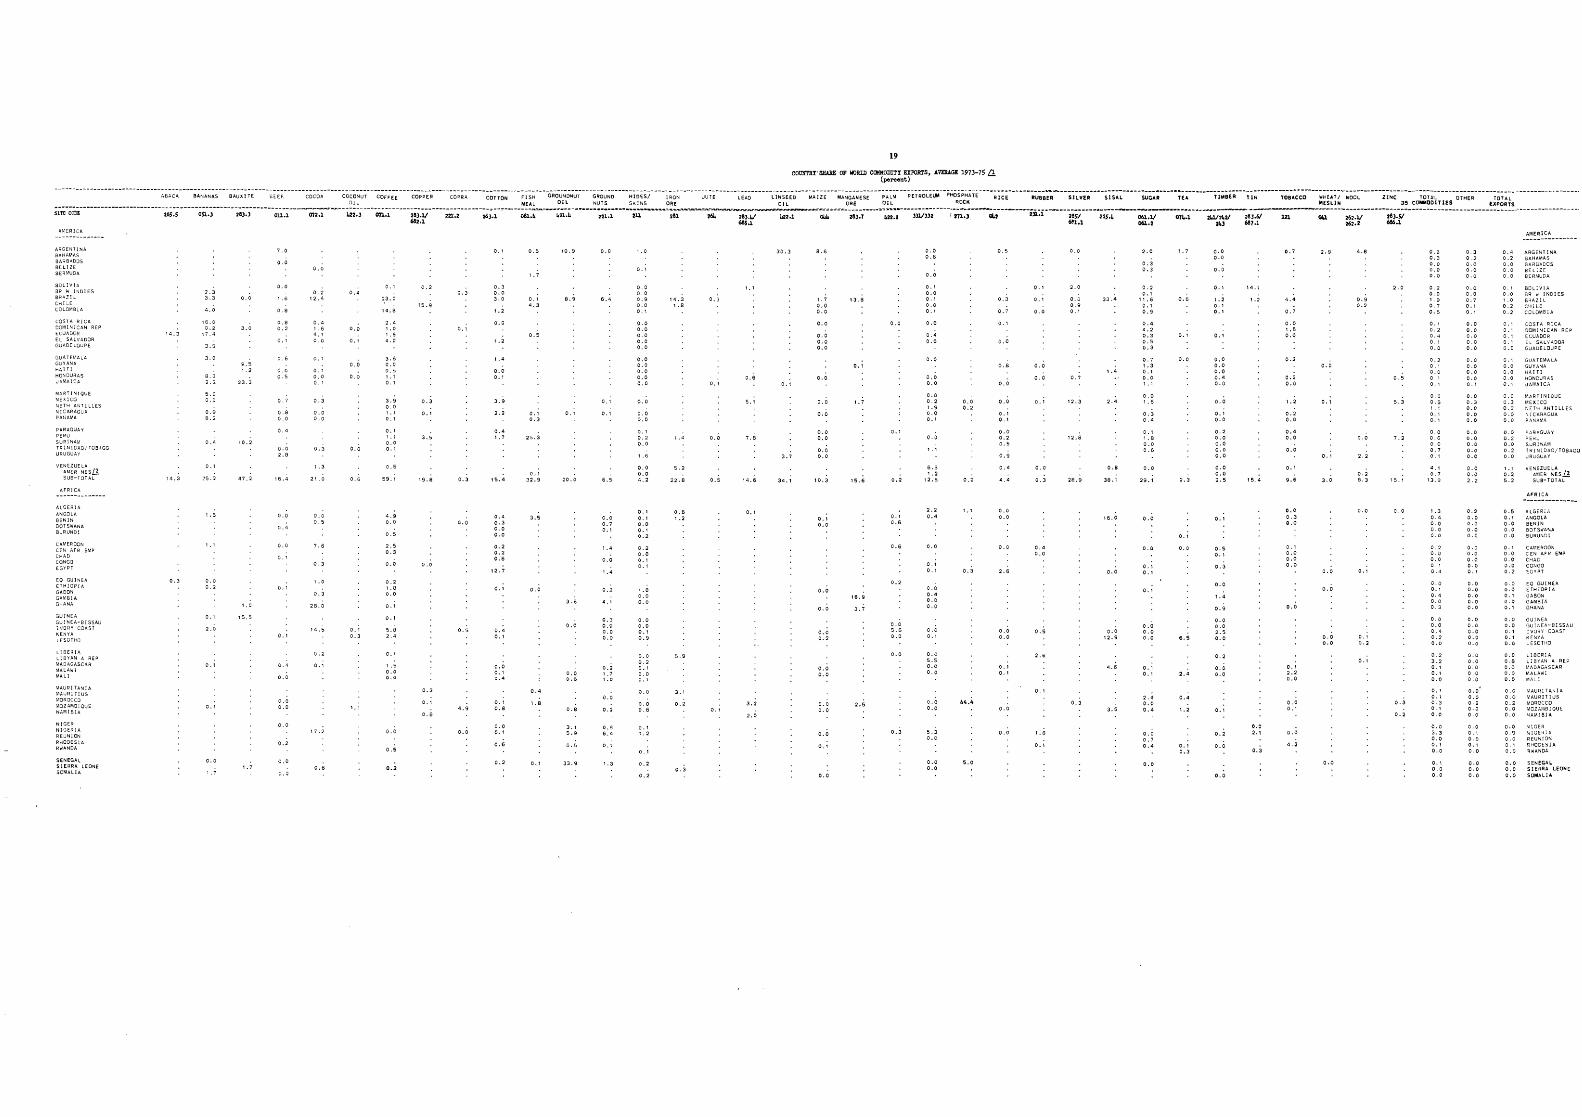
AViERICA
AFRjCA
19
COtnl'l'RY'S!WlE OF l«l1Wl CQIIIO;)[ty EZPOI\'I'S, .l.VEIWlI! 197)-75 Ll (percont)
ABACA BANANAS BAUXITE COFFEE COPPER COPRA COTTON MAIZE MANOANESE PALM SILVER SISAL SUGAR 1£4 TIN rOBACCD WOOL ZINC Toal OTHER ORe OIL 35 COMMDOITl£S
26$.$ OSl.) 28).) on.l 28).1/ 221.2 26).1 ow. 28).1 1In.2 285/ 255.4 06l..1/ 01,..1 2lo1I?ktl 283.61 121 0Iil 262.11 :aM'! 682.1 ~1.1 06l..2 2I"l 681.1 262.2 686.1
14.3
14.3
1.3 3.3
5.0 0.0
0.9
75.2
.5
0.\
0.0
23.3
47.2
15.5
1.7
7.0
0.0
D.O
0.8 0.2
0.8 0.0
0.4
0.0
0.0
0.4
0.0 0.0
0.0
0."
0.0
0.4 1.6 4. I 0.0
O. I 0.0 O. I
0.3
0.0 0.0
21
O.C 0.5
7.6
0.3
0.3
28.0
14. S
0.2
0.4
0.0
0.0
0.0
0.6
0.1 0.3
2.4 \.0 1.5 e.O
3.6 0.0 0.5 \.1 0.1
3.9 0.0 1.\ 0.1
0.\ \.1 0.0 0.1
59. I
4.9 0.0
0.5
2.5 0.3
0.0
0.2 \ .8 0.0
O. I
0.1
5.8 2.4
1.5 0.0
0.5
0.2
0.2
'5.9
0.3
3.5
19.8
0.1
D.6
0.3
0.3
0.0
0.5
0.0
0.3 0.0 3.0
0.0
1.2
0.0 O. I
3.9
2.2
0.4 1.7
15.4
0.4 0.3 0.0 0.0
0.2 0.2 0.6
1:2.7
0.4 O. I
0.0 O. I 0.4
O. I O.B
0.0 O. I
0.6
0.2
0.5
C. I 4.3
0.5
0.1 0.3
25.3
3.5
0.0
0 .•
'0.9
e.9
3.6
0.0
0.0 0 ••
3. I 5.9
33.9
0.0
6.4
0.1
O. I
6.5
0.0 0.7 O. I
, .4
0.2
0.3 0.9 0.0 0.0
0.2 1.7 1.0
0.2
0.8 6.4
O. ,
1.3
1.0
0.0 0.0 0.9 0.0
0.0 0.0 0.0 0.0 0,0
0.0 0.0 0.0 0.0 0.0
0.0 3.0
D.l 0.2 0.0
0.0 0.0 4.2
0, I 0.1 0.0 0.1 0.2
0,2 0.0 0, I O. I
i .8 0,0 0.0
0.0 0.0 0.1 0.9
0.0 0.2 O. I 0.0 0.\
0,0
0.0 0.6
0.1 L:t
0.2
0.2
5.2
22.S
0.6 1.2
5.9
0.2
0.3
0.3
0.1
0.0
0.5
0,6
5.1
7.8
'4.6
0.1
3.2
2.0
30.3
3.7
34.1
a.6
1.7 0.0 0.0
0.0
0,0 0.0 0.0
0.0
0.0
0.0
0.0 0.0
0.0 0.0
10.3
O. I 0.0
0.0
0.0
0.0 0.2
0.0 0.0
0.0 0.0
0.0
13. a
0.1
1.7
15.6
3.7
0.0
0.1
0.2
0.1 0.6
O.ij
0.0 5.5 0.0
0.0
0.3
0.0 0.6
0.0
0.1 0.0 O. I 0.0 0.1
0.0
0.4 0.0
0.0
0.0 0.0
0.0 0.2 1.9 0.0 0.1
2. ::t 0.4
0.0
O. I 0.1
0.0 0,4 0.0 0.0
0.0 5.5 0.0 0.0
0.0 0.0
5.3 0.0
0.0 0.0
0.0 0.2
0.2
0.3
44.4
5.0
C.5
0.3
0.0
0.6
0,0
0.0
0.1 O. I
0.0 0.2
0.9
0.4
0.0 0.0
0.0 0.0
0.1 0.1
0.0
0.0
0.0
0.0
0.0
C.l
0.0
0.3
0.' 0.0
:2.6
0.1
0.1
0.0
2.0
0.0 0.9
':2.6
28.9
0.3
33.4
1.4
2.4
O. e 39. I
16.0
0.0
0.0 12.9
4.6
3.5
0.3 0.3
0.4 •• 2 0.3 0.5 0.3
0.7 \ .3 0.1 0.0 1.\
0.0 1.6
0.3 0.4
1.8 0.0 0.6
~. 0
0.0
0.1 0.1
0.'
0.1 0.1
0.0
0.\
0.0
2.3
O. I
C.O
6.5
2 ••
o. , 0.3
0.0 0.0
0.0
0.1
\.2 O. I O. I
o. ,
0.0 0.0 0.0 0 .• 0.0
0.0
O. I 0.0
0.0 0.0 2.5
0.5 O. I
0.3
0.0
0.9
0.0 0.0 2.5 0.0
0.2
0.0 0.0
0.2
0.0
14.1
15.4
0.0 2. I
0.3
0.7
0.7
C.O 1.5 0.0
0.2
C.2 0.0
1.2
0.2 0.0
D.' 0.0
0.0
0.1
9.6
0.0 0.3 0.0
0.1 0.0 0.0 0.0
0.0
0.1 2.2 0.0
0.0 0.1
0.0
4.2
2.9
0.0
o. ,
3.0
0.0
0.0 0.0
0.0
4.8
0.9 0.2
0.2 9.3
0.0
O. I
0.1 0.2
O. I
2.0
5.3
7.2
0.0
0.3
0.2
0.8 0.3 0.0 0.0 0.0
02 C.O i., 0.7 C. ,
0.1 0.2 0.4 0.1 0.0
0.2 O. I 0.0 0.1
0.0 0.5
I 0.1 O. I
0.0 0.6 0.0 0.7
1.3 0.4 0.0 0.0
0.2 0.0 0.0 0.1 0.4
0.0 O. I 0.4 0.0 0.3
0.2 3.2 0.1 0.1 0.0
O. I 0.1 0.3 0.1 0.0
0.1 0.0 0.0
0.3 0.2 0.0 0.0 0.0
0.0 0.0 0.7 O. , 0.'
0.0 O. ~ 0.0 O.·J 0.0
0.0 0.0 O. ~ O. ~ 0.1
0.0 0.3 0.0 0.0 0.0
0.0 0.0 0.0 0.0 0.0
0.0 0.0 2.2
0.0 0.0 0.0 0.0
0.0 0.0 0·0 0.0 0.1
0.0 0.0 0.0 0.0 0.0
0.0 0.0 0.0 0.0 0.0
0.0 0.0 0.0 0.0 0.0
0.0 D.l 0.0 0.1 0.0
0.0 0.0 0.0
0.4 0.2 0.0 0.0 0.0
o . 0.0 1.0 0.2 0.2
0.1 0.1 O. I 0.1 0.0
o.! 0.0 0.0 0.0
0.0 0.3 0.3 0.0 0.0
0.0 0.2 0.0 0.2 0.0
1.1 0.2 5.2
0.5 0.1 0.0 0.0 0.0
O. I 0.0 o 0 0.0 0.2
0.0 0.0 0.1 0.0
0.0 0.0 0.1 0.1 0.0
0.0 O.S 0.0 0.0 0.0
0.0 0.0 0.2 0.0 0.0
AMERICA
AFRICA
0.0 SENECAL 0.0 SIERRA LEONE 0.0 SOMALIA
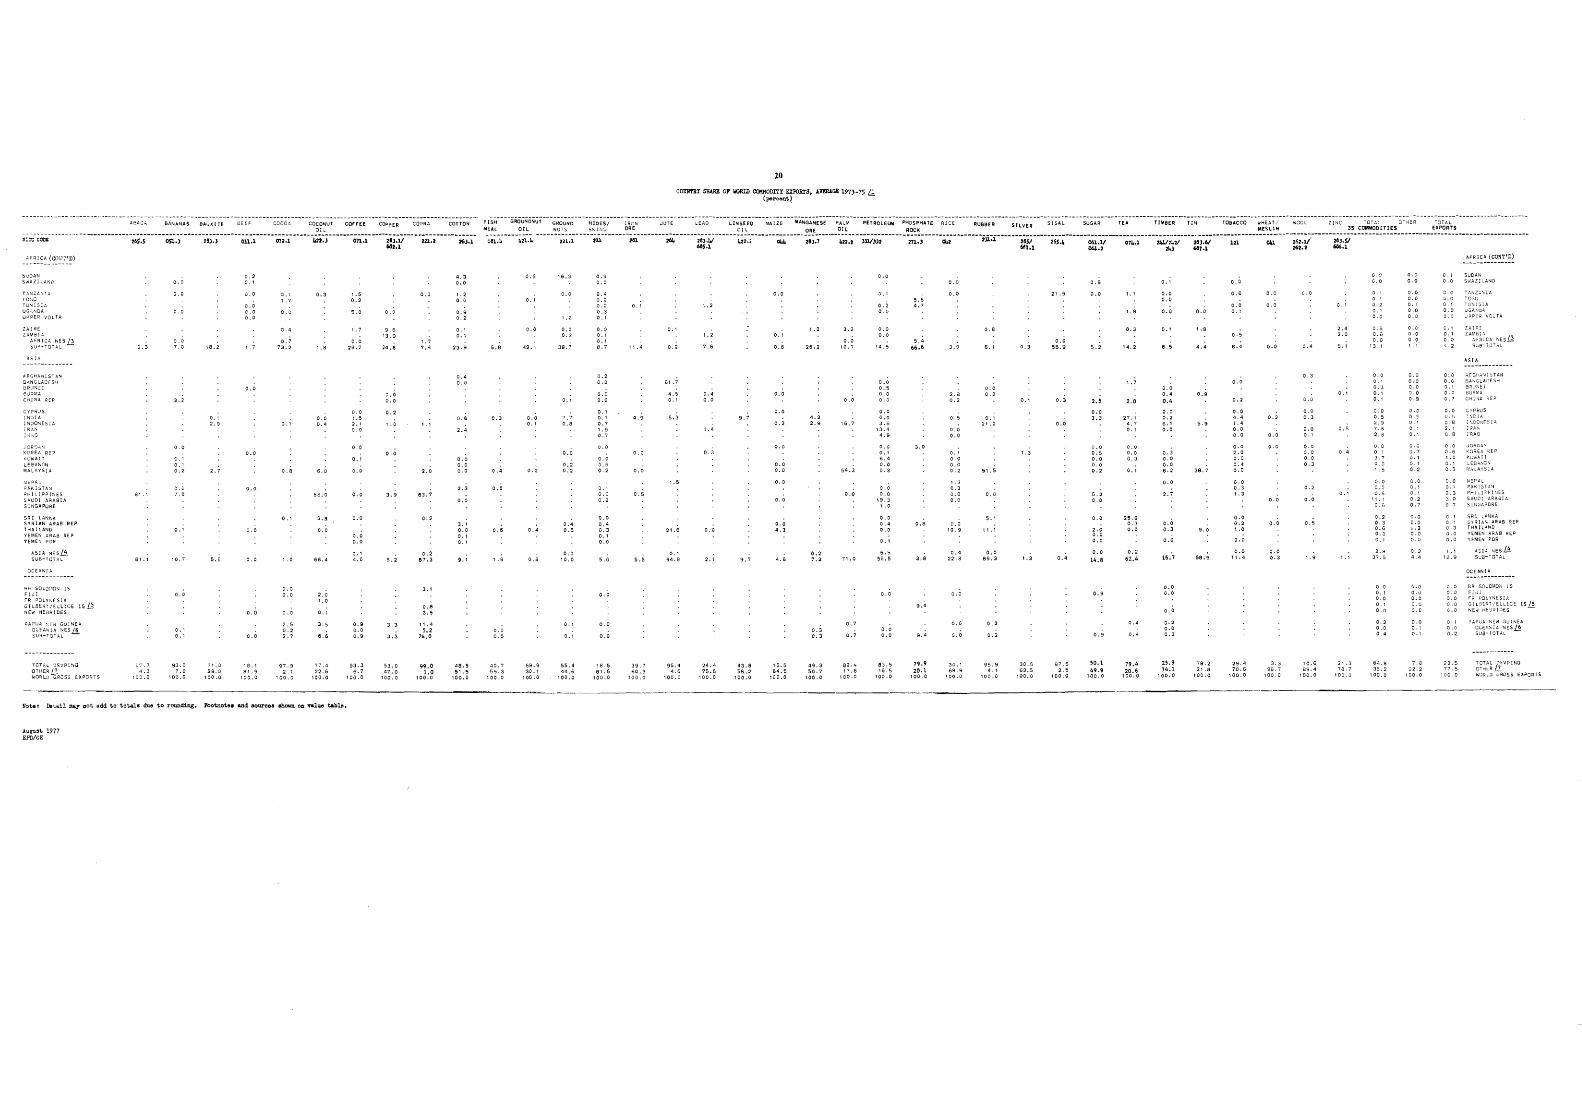
6ANANAS 8AUX( IE COCONUT COfFEE CJPPER COPRA COTTO~ OIL
sirc-~Oi.li:-- ._0_· --------------;6$:;-----~;.;-------2S;~;------~;,,~i------;,;;:1--·----~2:j-------o7i~i----.. 2ej._V-----m:;-·----;;J-.~-6oS,.1
AFR1CA (co:rr'p) -------- ------
0.3
81.1
0.0
0.0
3.2
C.l 0.1 0.2
0.1
10,7
0.1 0.1
18,2
O. I 2.9
5.6
c.2
(] ,0
0.0
0.1
:2 .5 0.2 2.7
0.3
0.0 0.4
58,0
3.8
68.4
2.0 1.0
6.6
No"' llot'ln mal not add to total. due to rounding. Footnote. IIlId sourcas ahcwn 011 nlua tabl ••
1977
1.5 0.2
0.0 ;.5 2.1 0.0
C.l
C.O
0.0
0.0
0.0 0.0
0.1 4.0
0.9 0.0 0.9
9.6 1~. 9
l4.S
0.0
1.0
3.9
5.:2
3.3
3.3
0.3
1.7 7.4
2.0
63.7
0.2
0.8 3.5
99.0 1.0
~ 00 . 0
4.3 0.0
1.2 0.0
0.9 0.2
0.1 0.1
23.9
0.4 0.0
0.0 0,0 0,0
3. I 0.0 0.1 0.1
9. ,
48.5 51.5
100.0
20
U01l!i'!'RY SIIARl! OF 0\)1iLil CC»!!!OlllTY EXlIJRTS, AVl!RAcm 1973-75 L1 (perc<>l&t)
MEAL all. ~~~~ND ~~~~~f ~~~~ VlAIZE MAN~::ESE ~~IL~ PEHtOlEUM P~~~:HATE RiCE RUBBER SILVEIl SUGA~ TEA TU"8ER rtf'.! TOSACCO ~~~~~~ ZINC 35 CCT::Otl
01TIES aT iE~ e~~~\s
-06~:~----i:;l.i -------2;~~;-----;;;-------;;i-------;Q;------;;;:i.i------;;~:---·--;;-----~;~:;---·---~;:;--;;,;;,~--------2;~=;-----~---------i.u:i-------28$i-----;;S:~------;~~U----;7::~-----;wz~;;----~8-l:;-----;;;-------;;;----;;2:;;·------;;.Si---------------.----------------------------------68S.1 ~l.l 06l..2 24) 687.1 ~2.2 686.1
5.8
0.3
C.5
0.6
0.5
49.1
0.0 0.1
16.3
1.2
o. a 0.3
39.7
7.7 O.B
0.0
0.2 0.,
D •• 0.5
0.0 10.0
'J.i
0.9 0.0
0.4 0.0 0.2 0.3 C.l
0.0 0.1 0.1 8.7
0,0 0,0
0,1 0,1 0,7 1.9 O. i
0.0 0.2
0.0 0.' 0.3 0.1 0.0
~.6
0.0
0.0
0.5
5.5
0, ::;
4.5 0.1
5.3
21.0
O. I 94.1:.1
95.' 4.b
100.0
1.2
7·.6
0.4
1.4
0.0
2.1
9. ?
9.7
0.0
0.6
0.0
0.0
0.2
0.0 0.0
0.0
0.0 4.3
15.5 B4.5
100.0
26.2
4.2 2.9
0.2 '7.2
0.3 0.3
0.0
16.7
0,0
0.7
0.0
0,2 0.0
0.0 0.5 0.0 0.0
0.1:/ O. I 6.4 0.0 0.3
0.' 0.0
0.1
6.5 56.5
0.0 0.0
5.6 4.7
5.' 66.6
3.0
0.8
3.a
9.4
79.9 20.1
100.0
2. a 0.2
0.5
0.1 0.0 0.0 0.2
1.3 e.3 0.0 0.0
0.' 2:2.8
0.0
0.0
o.a
0.0 0,2
0.1 21, :2
,5
5.1
0.0 69.3
0.2
0.2
0.3
0.1
1.3
1.3
21,9
0.3
a.'
0 ••
0.0
2.5
0.0
0.0 0.5 0.0 0.0 0.2
0.2 0.0
0.0 2.0 0.0 0.0
0.0
14.8
0.9
0.9
50.1 49.9
100.0
0.3
1.7
2.0
27.1 4.7 0.1
0.0 0.0 0.3
0. I
0.2
62.4
0.4
0.0 0.0
e s
0.0 0.4
0.4
0.0 0.2 6.1 0.0
0.3 0.0 0,0 6,2
0.0
2.7
0.0 0,3
0.0
16.7
0.0 0.0
0.0
0.2 0.0 0.3
0,0
i.e
0.9
9.9
9.0
59.S
79.2 21.8
100,0
C.O
0.6
0.0 0.1
0.5
0.0
0.2
l,O ... 1,4 0.0 0.0
0,0 2.0 0.0 0,4 0.0
0,0 0.3 1.3
0.0 0.2 1.0
0.0
0.0
0.0 0.3
0,0 0.1
0.0 0.0 0.0 0.3
0.0
0.5
2.4 2.0
5. I
0.2 0.0
0.' 0.3 0.1 0.1
O.C 0.5 2,9 7.2· 2.8
0.2 0.3 0.6 0.0
3. H 37.5
0.0 0.1 0.0 0.1 C .0
C',2 0.0 0.4
0.0 0.0
0.0 0.0 0.1 0.0 0.0
C.O 0.0 0.0 0.0
0.0 0.5 0·1 0.1 0.1
0.0 0.1 0.1 0·2 0.7
O. ~ 4.4
0.1 0.'
0.0 0.0 0.1 0.0
0.0 0.1 0.3 :.'1.0 0.7
AFRICA (CONT'D)
S,UDAN S'..JAZ!LAND
OC£:ANIA
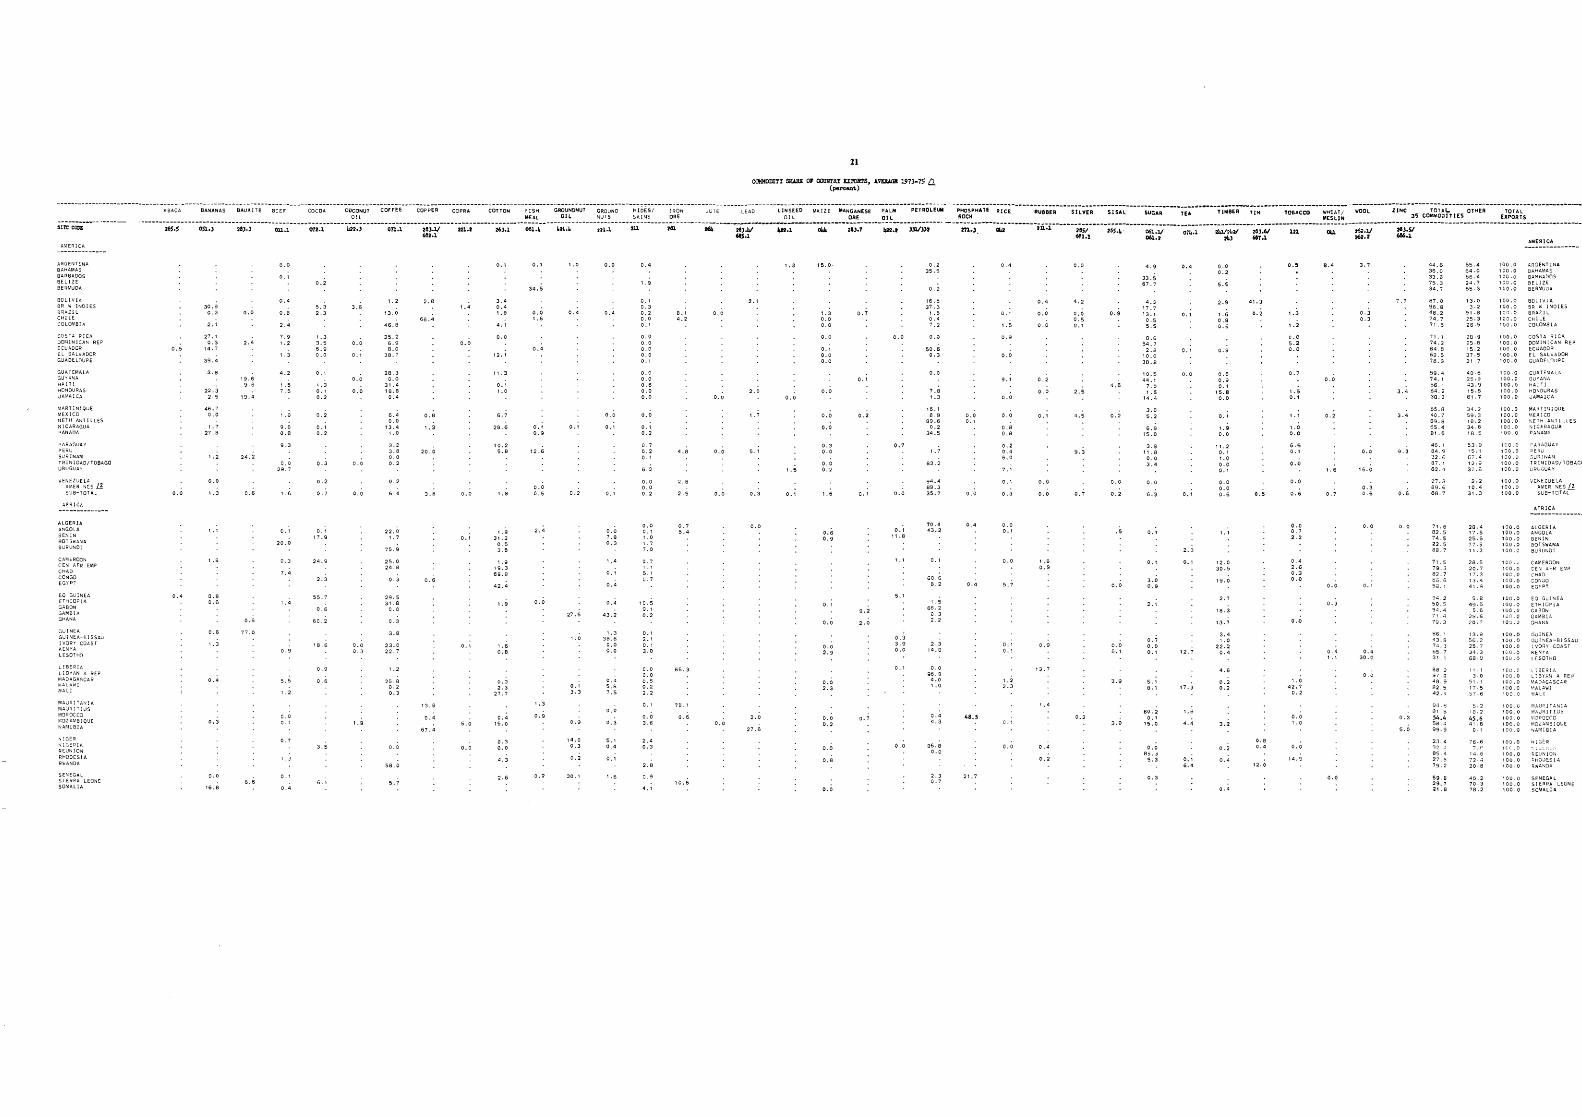
21
CQOIODlTI SiWIE or COO!fl'ltI :l:I:R>RTS, .\ VElWlE 1913-15 a (pel'<!4l>t.)
BANANAS BAUXi TE B:EF COCOA CilCONUT COPRA COTTON FiSH GROUNDNVT GROUND "ON JUTE LEAD MAIZ E "'ANGANESE PAlM PETROLEUM -~~~~;~~T£--;~~;------;~~~;;----s~~;;;----;7~~-----;~~;;----;;;--··---Ti;BE;;~;~-------,_;;A~_;;---:~;:;~---;;~~~------;;~~-----:~~~~i.l--I-E:-~~~~;-----~~;~~--------------OIL MEAL OIL WT5 ORE OIL ORE OIL ROCK MEHIN 35 C MOT UPORTS
~lre-;~--'-- .----- -------26S~i-----~.~-------ae;:;------~~~-----;;:i------42~:;-------on:;:-----;o;:v-----;c:;------;;.;.-----oa~:4----~tl~~-------;;;.;.-----;1l--------28i-------_-____;;:v__;;.-1-----;;------2a);--·---~:;---,ii;;;---· ----~~;~-·--~---------iJl:i-------;s;-----;~:;~-----;~:v-----;7~:~----Wl2~;.;----~8~~U-----~;;-------;;--"·--;.~-;;------;;.Si--------------~------------------------------662.1 66S.1 ~I.l 061.2 2IIJ 617.1 262.2 606.1
0.5
0.4
2.1
3.8
~2. J 2.5
46.7 0.0
0.0
o. S 0.6
0.6
0.4
0.3
0.0
2.4
24.2
C.6
77.0
6.5
0.1
7.9 1.2
1.3
4.2
1.5 7.5
S.O O. B
9,3
!>.5
1.2
0.0 0.1
0.4
0.2
5.3 2.3
1.3 3.5 6.9
0,1
0 •• 0,2
0,2
0.1 0.2
0.3
0.2
24.9
0.6
60.2
0.6
3.5
3.6
0.0
0.0
0.0
u .0
0.0
J.O 0.3
1.9
1.2
'3.0
3,2 3.8 0.0 0.2
0,2
75.9
25,0 24,8
0,3
29.5 31,8
0.0
0.3
3.8
23.0 22,7
1.2
50,0
5.7
2.6 1.4
66.4
0.0
1.3
20,0
0.1
O. tJ
13, e
0, •
67 .•
0.0
3 .• D.· 1.8
12.1
'1.3
0.1 1.0
28.6
10. :2 5.8
42 ••
1.6 O.B
0 •• 15.0
D. OJ
0.0
4.3
2.6
0.1
34.5
0.0 1.6
0.4
0.1 O. ;;
12.6
C.O C .5
2.4
0.0
1.3
0.9
0.2
0.4
0.1
0.2
27',6
0.1 3.3
,4.0 0.3
0.2
30. i
0.0
0.4
0.0
0.1
0.1
0.0 7.8 0.3
, .. 0.1
0." 43.2
0.4 5.B 7.5
0.0
0.3
5.1 0.4
0.1
1.6
0.4
1.9
0.1 0.3 0.2 0,0
0.0 0.0 0.0 0.0 0.1
0.0 0.0 0.6 0.0 0.0
0.1 0.2
0,7 0.2
6.2
0.0 0.0 0.2
0.0 0.1 1,0 1.7 7.0
0,1 2.1 0, ' 3,0
0,0 0,0 0,5 0.2 2,2
0.1
0.0 3.6
2 •• 0.3
2.8
4.1
S.l 4,2
2,5
0,7 5.4
68.3
7e.1
0.6
2.1
0.0
0.0
1.7
0.0
O.C 0.3
0.0
2.0 0.0
27.6
.3
0.0
1.5
0.1
1.3 0,0 0.0
0,1 0.0 0.0
0.0
0.0
0.3 0.0
0.0 0.2
1.6
0.6 0.9
0.0
0.0 2.9
0.0 2.3
0.0 0.2
C.O
0.9
o. ;
0.7
0.1
0.2
0.1
9.2
2.0
0.7
0.7
5.1
0.3 3.9 0.0
0.0
0.2 35.9
0.0
B3.2
70.4 43.2
60.6 8.2
0.4 4.3
86.8 0.0
2.3 0.7
0.0 0.1
0.0
0.4
0,4
48.5
21,7
0.4
1.5
0.0
Q.l
0.0
0.0
0.8 0.8
0.2 0.4 6.0
0.3
0.0 0,1
5.7
0.1 0.1
1.2 2.3
0,0
0.4
0.0
0.0
0,2
0,0
O.C
0.0
1.8 0.9
0.9
13.7
0.2
4.2
2.5
4.5
9.3
0.2
0,9
4.5
.5
0.0
0.0 6.1
3.9
3.0
4.9
B.6 54.7 2.8
10.0 38.8
3.0 5.2
3.8 11.8 0.0 J.4
6.3
2.1
0.7 0.0 0.1
5.1 8.1
60.2 0.1
15.0
0.3
o.
C.l
2.3
12.7
17.3
0.1 6.4
0.0 0.2
5.5
2.9
1.6 0.8 0.6
0.6 0.9 0.1
15.8 0.0
0.1
1.9 0.0
0.0 0.0 0.6
12.0 30.5
19.0
18.3
13.7
4.6
0.2 0.2
3.2
0,2
0.4
41.3
0.2
0.5
0.8 0.4
1:&.0
0.5
1.3
1.2
0.0 5.2 0.0
0.7
1.5 0.1
1.0 0.0
6.5 0.1
0.0
0.0
0.6
0.0 0,7 2.2
0.0
0.0 1.0
0.0
8.4
0.2
1.6
0.7
0.0
0.3
0,4 1,1
0,0
0.3 0.3
0.0
16.0
0.3 0.6
0,0
3.4
3.4
9.3
0.6
0.3
44.6 36.0 33.6 75.3 34.7
59,4 74,1 56,1 84. ::2 3a,3
59, B 29.7 21. B
40.2 70.3 78.2
AMERICA
AFRICA
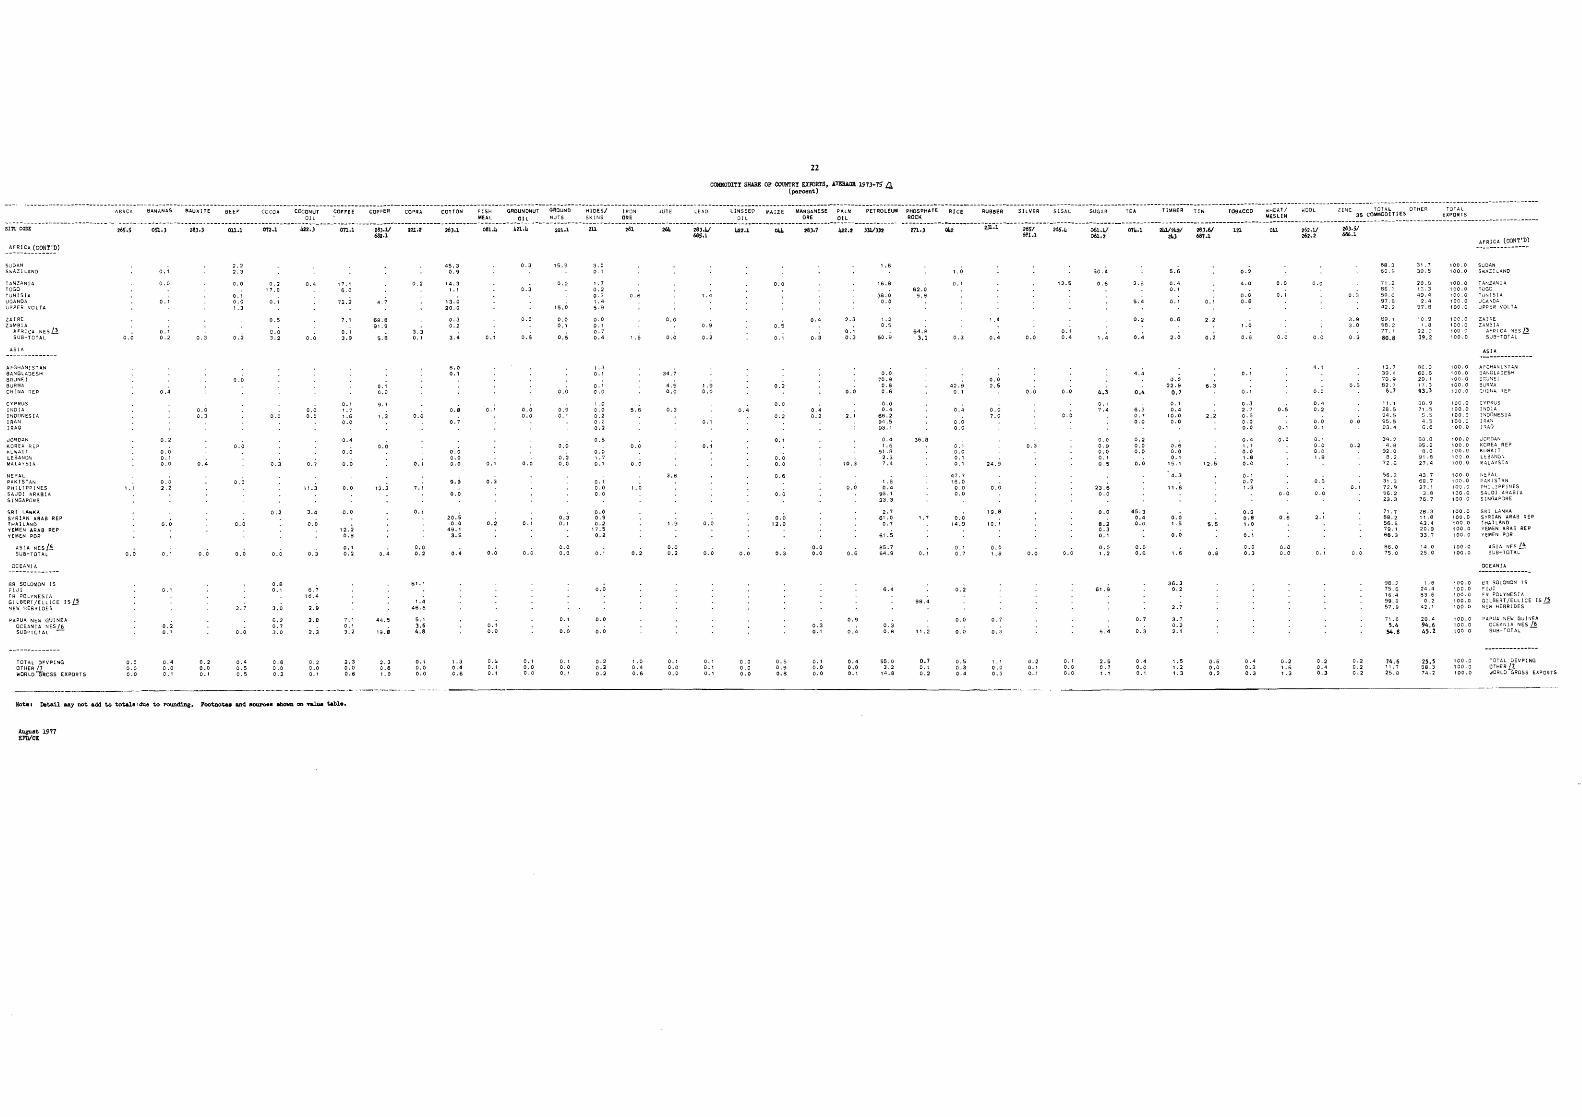
22
COMKODll'! SHARE OF OOUIITR! EIFORTS, J.Vl!:IW:lI 197J-7S L! (percont)
ABACA 8A~ANAS BAUXlTE 8EE~ COCOA COCg~~T :-O .. £E CO'., COTTON ~~~~ GRO~~~NUT DrL MAIZE MA~~~NESE ~~~M PETROLEUM RICE RUBBER SILVER srSH SUGAR TEA TIMBER TIN T08ACCO ~~~~i' lINC 35 (;o~~;3hlES E;~~:~S _________ .... _____________________ ~ ____________ ... ~. __ ...... _____ ... _ ................ ___ .. __ .. _'" _ ...... ___ ... _~ __ .... __ ...... ___________________________ ....... ______________ .... _____ ... _ .... ___ ....... , .... ___ .... _____________ ................ __ .......... __ ....... _________ ... ___ .. ___ .... __ ....... _______ ... _________ ... ______ ... ____ w _________ ... ____ .............. ... .... ___ ... ___________ .---- _:'".:: _~ ... _________________ .... ________ .... ______ ... ___________ ... _ •• ______ .... ______ ------ ... -------- ....... ---- ....... - ... -- ...... -- -- - .. -------- -- ........... - -- ...... -_ .... -- ... -- --- .... --
SITt com;
_~~~'::~_(_C.?~E?)
SUDAN SWAZI LAND
ASIA
SRI LA~KA Syj:HAN .6.RAa REI' THA t LANO YEMEN ARAB REP YEMEN POR
OCgAN! A
TOTAL ::lfVPINO OTHER /7 WORLO'1rROSS EXPORTS
265.5
0.0
0,0
0,0 0,0 0.0
OSl.)
0.1
0.0
O ••
o .. 0.2
0.4
0,2
0.0 O. j
0.0
O. J 2.2
0.0
0.1
0,2 0.1
0,4 0.0 0.1
28).)
0,0 0,3
0.2 0.0 0.1
011.1
2.2 2.3
0.1 0.0 1.3
0.2
0.0
0.0
O.C
2.7
0.0
0.' 0.5 0.5
on.l
0.2 17.0
8.0 3.2
0.3
0.2
0.8 0.1
3.0
6.2 0.7 3.0
0.8 0.0 0.2
1122.)
0.0 0.0
0.7
11 .3
3.4
0.0
0.3
2.9
2.S
2.3
0,2: 0.0 0.1
on.l
17,1 6.0
72.2
0.1 3.9
0.1 1.7 1.6 0.0
0.4
0.0
0.0
0.0
0.0
0.1 0.2
7.1 0.1 3.2
2.3 0.0 O.t;
lIote I Ilot .. U .... y not add to total., due to rounding. Footnote. and source. _ on valWl table.
A1IgU.at 1977 El'Il/CE
m.lI 682.1
4.7
68.8 91.9
5.6
0.1 0.0
9.1
1.3
13.2
0.4
44, S
19.B
221.2
0.2
3.3 0.1
0.0
0.1
7.1
0.1
0.0 0.2
1.4 46.6
S. I
3.6 4.5
0.1 0.0 0.0
26).1
45.3 0.9
14.3 1.1
0.3 0.2
3.4
8.0 0.1
0.8
0.7
9.9
0.0
0.4
1.3 0.4 0.6
081.4
0.1
0.1
0.2
0.0
0.1 0.0
O.!'.t. 0.1 0.1
421.4
0.5
0.0 0.0
0.0
0.1
0.0
0.1 0.0 0.0
221.1
"5. ~
0.0
15.0
0.0 0.1
0.5
0.0
0.9 0.1
0.0
0.2 0.0
0.3 0.1
0.0 0.0
0.1
0.1 0.0 0.1
,11
3.0
1.7 0.2 0.3 1.4 5. 9
0.0 0.1 0.7 0.4
1.3 0.1
O. I 0.0
1.0 0.0 0.2 0.2
0.' 0.5
0.0 1,7
0.1
J.l 0,0 0.0
0.0
0.0
0.0
0.2 0.2 0.2
231
.5
5.5
0.0
0.0
1.0
0.2
0.4 0.6
26Ii
0.0
34.7
4.5 0.0
3.6
1.9
0.0 0.2
O. , 0.0 0.0
28)J.V 68$.1
1.4
0.2
1.9 0.0
0.1
0.0
0.0
O. I 0.1 0.1
!,22.1
0.4
0.0 0.0 0.0
DI.l.
0.0
0.5
O. I
0.2
0.2
0.1
0.0 0.0
O.S
0.0
0.3
28).7
0.4
0.3
0.4 0.2
0.0 0.0
0.3 0.1
0.1 0.0 0.0
1122.2 )ll./»)2
O. I 0.3
0.0
10.3
0.0
0.6
0.9
0.4
0.4 0.0 0.1
1.6
lS.8
36.0 0.0
1.2 0.5
50.9
0.0 0.4
68.2 9·'.5 93.1
61.5
gS.7 64.9
6.4
0.3 0.8
171.)
62.0 9.9
64.8 3.1
36.8
1.7
0.1
11.2
0.7 0.1 0.2
!lb.
1.0
42.9
0.0 0.0
0.1 0.0 0,1 0,1
O. :2
0.0
0.0
0.5 0.3 0.4
1.4
0.4
0.0 2.5
0.0 7.0
24.9
0.0
'9.8
0.0
0.7
0.3
1.1 0.0 0.3
23S1 ~1.1
0.0
0.0
0.3
0.0
0.2 O. I 0.1
2~S.4
12.5
0.1 0.4
0.0
0.0
0.0
0.1 0.0 0.0
50.4
0.6
1.4
4.3
0.1 7.4
23.6 0.0
0.0
8.2 0.3 O. I
0.0 1.2
6.4
2.5 0.7
011..1
2.6
5.4
0.2
0.4
4.4
0.4
6.3 0.7 0.0
0.2 0.0 0.0
0.0
0.0 0.6
0.7
0.3
0.4 0.0 0.1
24l/2421 281.61 24) 681.l
5.6
0.4 0.1
0.1
0.6
2.0
0.0 22.9
0.7
0.6 0.0 O. I
" 4.3
0.0 1.5
0.0
1.6
36.3 0.2
2.7
3.1 0.2 2.1
1.5 1.2 1.3
0.1
2.2
0.2
6.3
2.2
12.5
5.5
0.8
0.6 0.0 0.2
12l.
0.2
1.0
0.6
0.1
0,1
0.3 2.7 0.6 0.0 0.0
1.1 0.0 1.6 0.0
0.1 0.7 1.3
O. I
0.0 0.3
041
0.0
0.1
0.5
C.l
c .0
0.0
0.6
0.0 0.0
2>2.11 262.2
0.0
0.4 0.2
0.0 0.1
0.1 0.0 0·0 1.8
0, ~
0.0
2. ;
0.2 0.4 0.3
26).,/ 686.1
3.9 3.0
O. J
0.5
0.0
0.2
0.2 0.2 0.2
68.3 60" 5
80.8
A6.0 75.0
71.6 5.4
54.8
14.0 25.0
28.4 94.6 45.2
~~~~:~-~~~-:.'~:
100. 0 S~DAN
100,0 SI'JAZl"ANO
, 00.0 ,00,0
ASlA
~CEANIA
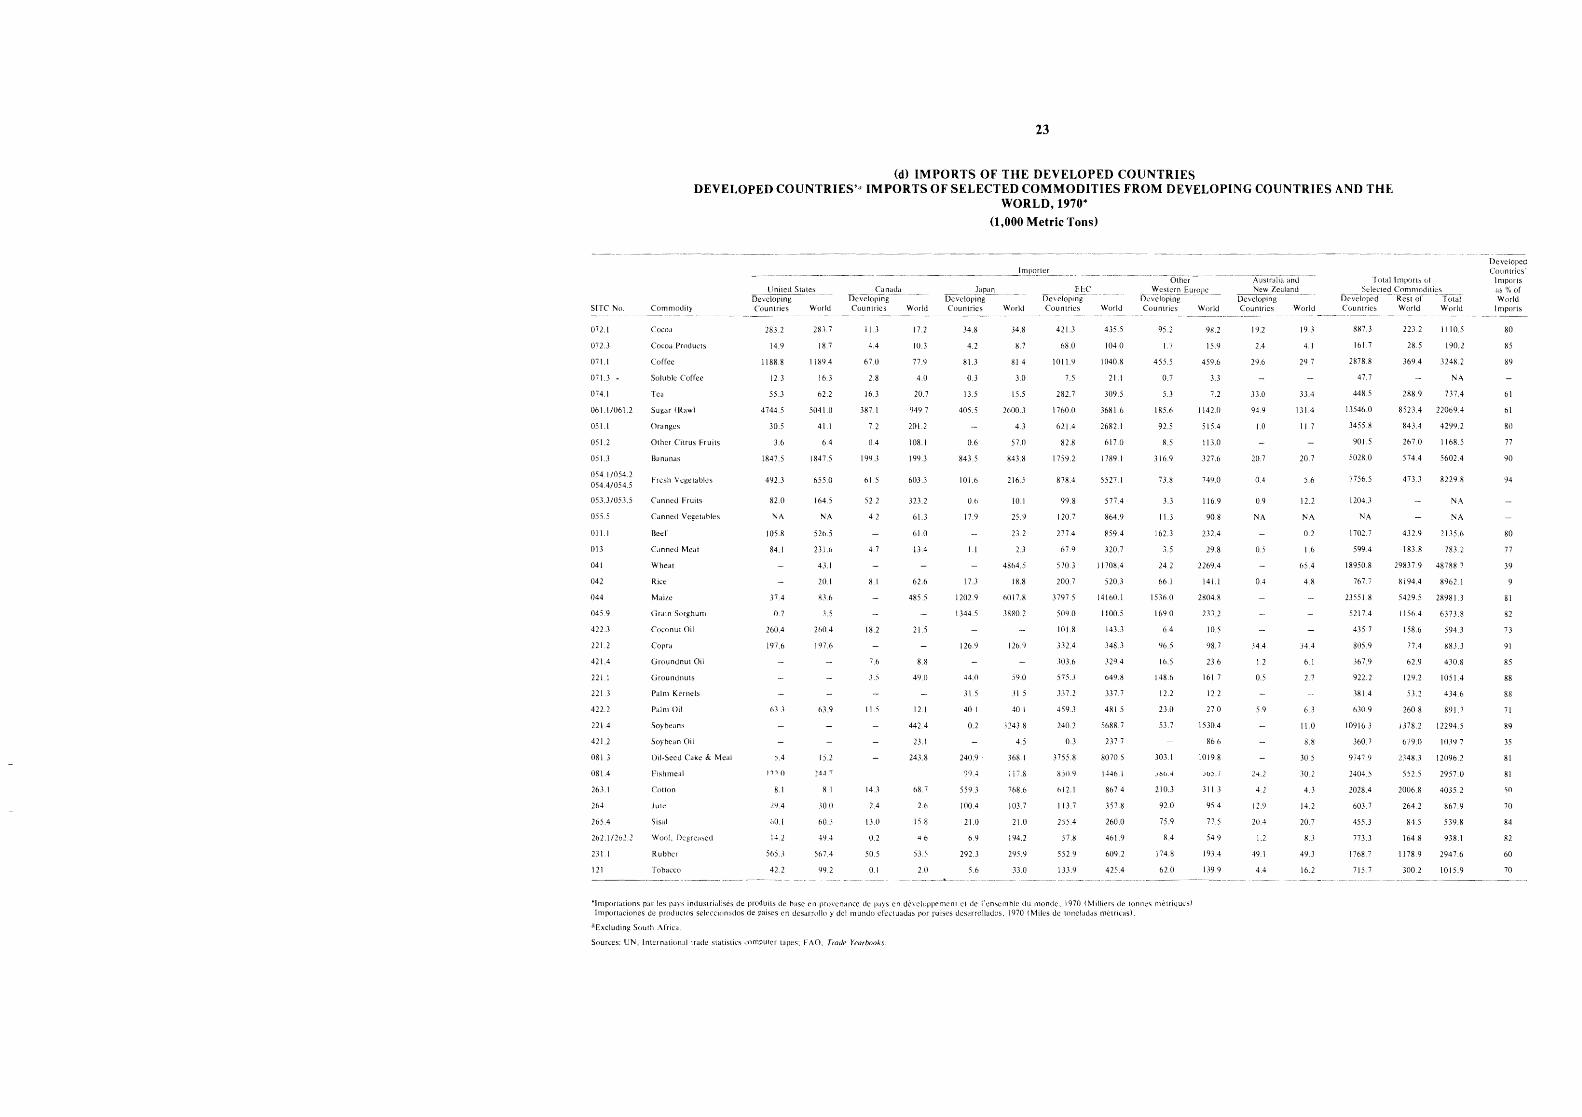
23
(d) IMPORTS OF THE DEVELOPED COUNTRIES DEVELOPED COUNTRIES'a IMPORTS OF SELECTED COMMODITIES FROM DEVELOPING COUNTRIES AND THE
WORLD, 1970*
SITe No.
0721
072.3
071.1
07U.
074.1
06 1.1 /061.2
051.1
051.2
OSU
054.1/054.2 054.41054.5
053.3/053.5
055.5
011.1
013
041
042
044
045.9
422.3
2212
421.4
221. :
2213
4222
221.4
421.2
0813
081.4
263.1
26-+
265.4
262.112622
231
121
'Importations 1111 portdciones
Commodity
Cocoa
Cocoa Pro(lucls
Coffee
Soluble Coffee
Tea
Sugar (Raw)
Oranges
Other Citrus Fruits
Bananas
Fresh Vegetables
Canned Fruits
Canned Vegetables
Beer
Canned Meat
Wheat
Rice
Maize
Grain Sr,rghum
Coconut Oil
Copra
Groundnut Oil
GroununulS
Palm Kernels
Palm Oil
Soybeans
Soybean Oil
Oil-Seed Cake & Meal
Fishmeal
Cotton
Jute
Sisal
Wool, O:::gredsed
Rubber
Tobacco
les (lJ}"S indllstrialises de productos seicccionados
aExciliding 5utlth Africa
283.2
14.9
188.8
123
55.)
4744.5
30.5
3.6
1847.5
492.3
82.0
NA
105.8
84.1
37.4
0.7
260.4
197.6
6.U
).4
)110
8.1
1'1.4
60.1
14,2
565.3
42.2
paise~
2Wi.7
18.7
11\9.4
16.3
62.2
5041.0
41.1
6.4
1847.5
655.0
164.5
NA
526.5
231.6
4.1.1
20.1
83.6
260.4
197.6
63.9
)).2
~,iJ ~
8.1
.10.0
60.3
-19.4
567A
99.2
11 3
4.4
67.0
2.8
16.3
387 1
7.2
0.4
199.3
61.5
52.2
4)
4.7
8.1
18.2
76
~.5
IS
14.3
2.4
13.0
0.2
)05
ptovenancc dc
Sources: UN, International trade statistics ,'ompulcr tapes; rAO, Trade Ycurbooks.
17.2
10.3
77.9
4.0
20.7
949
2012
108.1
1<)9.3
6033
323.2
61.3
61.0
13.4
62.6
485.5
215
II 8
49.0
12.1
442.4
23.1
243)\
68.7
H
15.8
4 b
53.5
2.0
34.8
4.2
81.3
0.3
13.5
405.5
0.6
843.5
101.6
0.0
17.9
I.l
17.3
1202.9
1344.5
126.9
44.0
315
40.1
0.2
240.9
559.3
100.4
21.0
6.9
292.3
5.6
(1,000 Metric Tons)
-
__ ---'rn.P0!le~ ..
34.8
8.7
3.0
15.5
2600.3
4.3
57.0
843.8
216.5
10.1
25.9
23.2
2J
4864.5
18.8
6017.8
3880.2
126.9
59.0
J1.5
40.1
3243.8
4.5
368.1
17.8
768.6
103.7
21.0
194.2
2':1".')
330
421.1
68.0
1011.9
282.7
1760.0
62l.4
82.8
1759.2
878.4
9').8
120.7
277.4
67.9
5703
200.7
3797.5
509.0
10LR
332.4
303.t1
575.3
337.2
459..1
240.2
0.3
3755.11
8:'0.9
612.1
ILU
255.4
57.8
)52
13.1.9
435.5
104.0
1040.8
21.1
.109.5
3681.6
2682.1
617.0
1789.1
5527.1
577.4
864.<)
859.4
320.7
117084
520.3
14160.1
1005
143.3
.148.3
049.8
337.7
481.5
5688.7
237.7
1l070)
1../46.1
867.4
357.8
260.0
461.9
60<).2
425.4
<)5.2
1.7
455.5
0.7
5.3
185.6
92.5
8.5
316.9
73.8
3.3
1l.3
162.3
3.5
24.2
66.1
1536.0
169.0
6.4
96.5
16.5
14l!.o
12.2
230
53.7
303.1
.IM,.4
210.3
92.0
75.9
8.4
174.S
62.0
dcveioppemcnt el de l'en~C:ll1ble du monee. 1970 IMillier, de lonn"" :llctriquc,} por paises desarrellados, 1970 (Miles de tnneladas metricasl.
98.2
15.9
459.6
JJ
72
142.0
515.4
1130
327.6
749.0
116.9
908
232.4
29.8
2269.4
141.1
2804.8
23J2
10.5
98.7
236
161 7
12.2
270
15304
86.6
1019.8
JU).!
311 3
954
77.5
549
193.4
139.9
19.2
2.4
29.6
330
94q
1.0
20.7
0.4
Oq
NA
0.5
0 ...
34.4
~ 2
0.5
5<)
2 ... 2
4.1
12.~
20A
1.2
49.1
4.4
19.3
4.1
2tJ.7
33.4
131.4
IU
20.7
5.6
12.2
NA
0.2
1.6
65.4
4.8
34.4
6. !
2.7
6.3
11.0
8.8
30
30.2
4.3
14.2
20.7
8.3
49.3
16.2
887.3
161.7
2878.8
47.7
448.5
13546.0
3455Ji
901.5
5028.0
7756.5
1204.)
NA
1702.7
599.4
18950.8
767.7
23551.8
5217.4
435.7
31j).9
.;679
922.2
381.4
11.10.9
10916.3
360.7
9747
2404)
2028.4
603.7
455.3
773.3
1168
715 7
22.12
285
369.4
1110.5
190.2
3248.2
NA
288.9 737.4
8523.4 22069.4
843.4
267.0
574.4
473.3
432.9
183.8
4299.2
1168.5
5602.4
8229.8
Nil
NA
2135.6
783.2
19837 9 48788 7
8194.4 8962.1
5429.5 28981J
]56.4
158.6
77.4
62.9
129.2
53.2
260 S
6373.8
594.3
883.3
430.8
1051.4
434.6
R9] 7
l378.2 12294.5
67<).0 IO.N7
2348.3 12096.2
552.5
2006.8
264.2
84.5
164.8
1178.'1
300.2
2957.0
4035.2
867.9
539.8
938.1
2947.6
]015.9
Ill1porl~
80
85
89
61
61
80
71
90
94
80
77
39
81
82
73
91
85
88
88
71
8<)
35
ill
81
'in
70
84
82
60
70
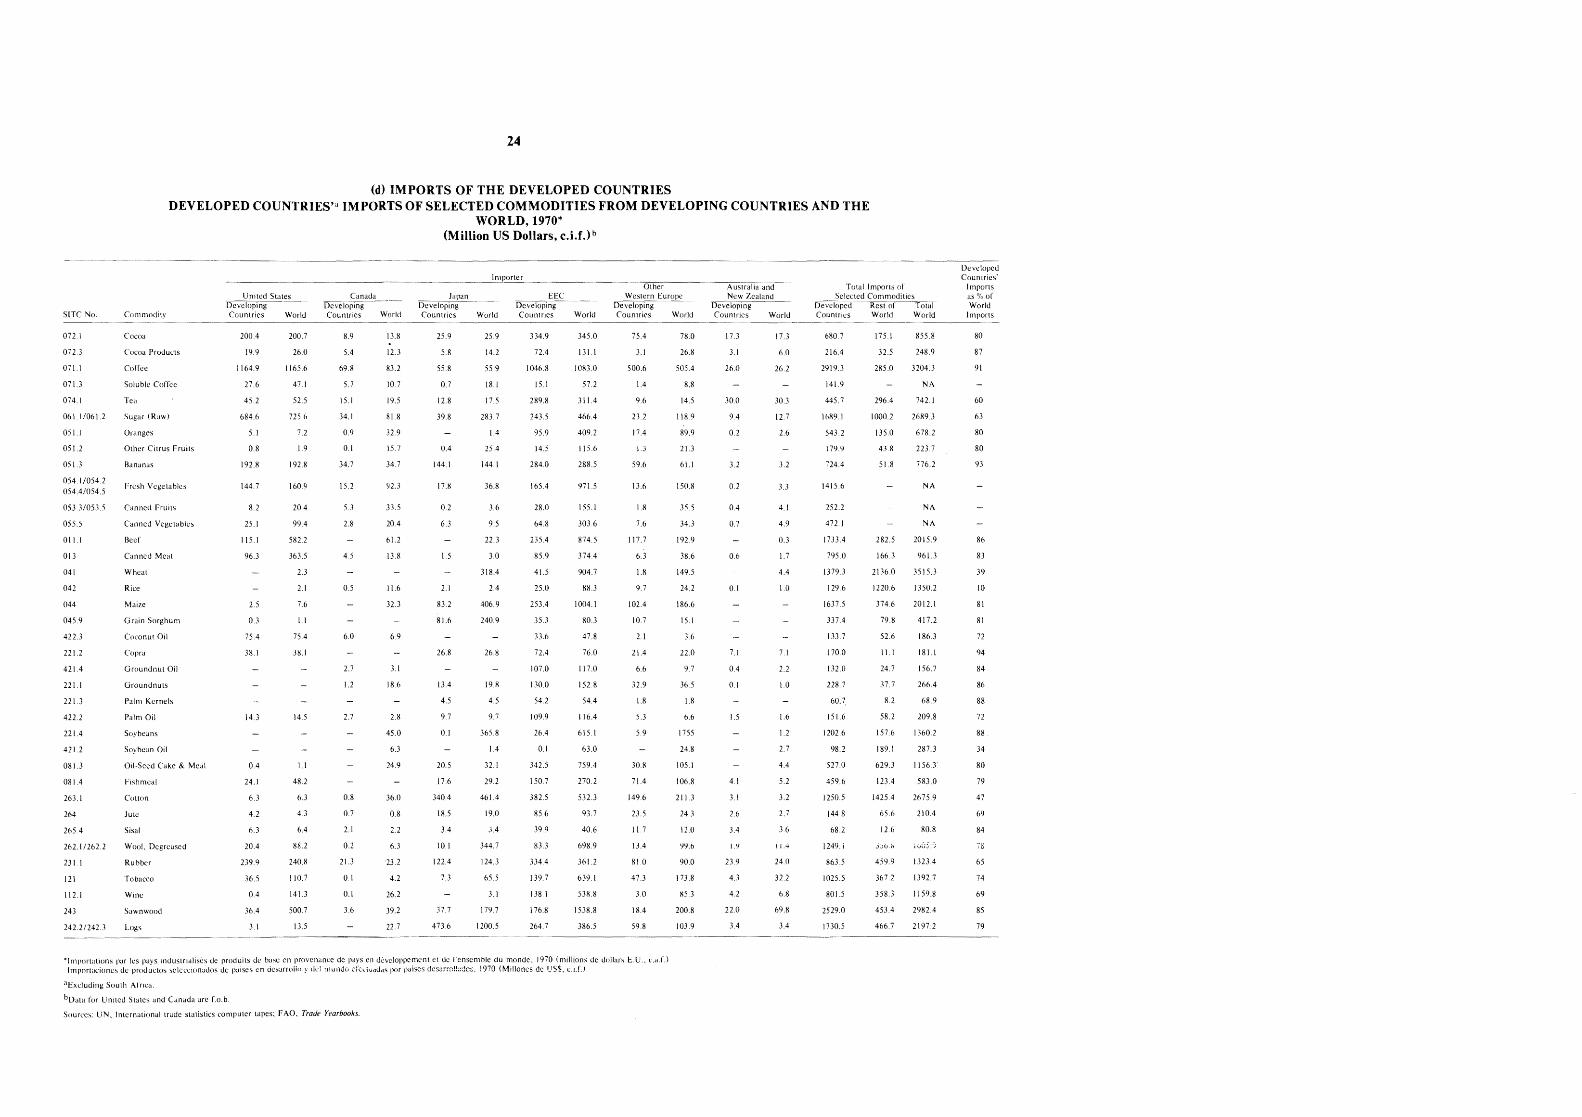
24
(d) IMPORTS OF THE DEVELOPED COUNTRIES DEVELOPED COUNTRIES'a IMPORTS OF SELECTED COMMODITIES FROM DEVEI,OPING COUNTRIES AND THE
WORLD. 1970* (Million US Dollars, c.i.f.)b
__ ~~ __ ~lorler Total Imports 01
SITC No.
072.1
0723
071.1
071.3
074.1
06 I .1/061.2
051.1
051.2
051.3
054.1/054.2 054.4/054.5
OS33J05J.5
055.5
01
013
041
042
044
045.9
422.3
221.2
421.4
221.1
221.3
422.2
221.4
421.2
081.3
081.4
263.1
264
265.4
262.11262,2
231
121
Ill.1
243
242.2/242.3
Commodity
Cocoa
Cocoa Prouucls
Coffee
Soluble Coffee
Tea
Sugar (Raw)
Oranges
Olher Citrus Fruils
Bananas
Fresh Vegelables
Canned Fruils
Canned Vegelables
Beef
Canned Meal
Wheal
Rice
Maize
Grain Sorghum
Coconut 011
Copra
Groundnut Oil
Groundnuis
Palm Kernels
!'alm Oil
Soybeans
Soybean Oil
Oil-Seed Cake & Meal
F,shmeal
Colton
Jute
Sisal
Wool, Dcgrcascd
Rubber
Tobacco
Wine
Sawnwood
Logs
200.4
19.9
1164.9
27.6
45.2
684.6
5.1
0.8
192.8
144.7
!U
25.1
115.1
963
2.5
OJ
75.4
38.1
14.3
0.4
24.1
6.3
4.2
6.3
20.4
239,9
36.5
0.4
36.4
3.1
*lmportalJons par pays industriuliscs de produits de tlase ImpOrlacioncs de produclos sclcccionauos ur palses cn
aExcluding Soulh Africa
bDala for Unite(1 Slates and Canada arc Lo,b.
200.7
26.0
1165.6
47.1
52,5
715.6
7.2
1.9
192.8
160,S
20.4
99.4
582.2
363.5
2.3
2.1
7.6
1.1
75.4
38.1
14.5
U
48.2
6.3
4.3
6.4
88,2
240.8
110.7
141.3
500.7
13,5
8.9
5.4
69.8
5.7
15.1
0,9
0.1
34.7
15.2
5.3
2,8
4.5
0.5
6.0
2.7
1.2
2,7
0.8
0.7
2.1
02
21.3
0.1
0,1
3.6
de
Source,,: UN, Inlernational trade statistics computer lapes; FAO, Trade Yearbooks.
13.8
12.3
83.2
10.7
19.5
X I.!!
32.9
15.7
34.7
92.3
33.5
20.4
61.2
13.8
11.6
323
6.9
3.1
18.6
2.8
45,0
6.3
24.9
36.0
O.X
2.2
6,3
23.2
4.2
26,2
39.2
22.7
25.9
5.8
55.8
0.7
12,8
39.R
0.4
144.1
17,8
0.2
6,3
15
2.1
83.2
81.6
26.8
13.4
4.5
9.7
0.1
20.5
17,6
340.4
18.5
3.4
101
122.4
7.3
473.6
World
25.9
14.2
55.9
18.1
17,5
283.7
1.4
25.4
144.1
36,8
3.6
9.5
22.3
3.0
318.4
2.4
406.9
140.9
26,8
19.8
4.5
9.7
365.8
14
32 I
29.2
461.4
190
J.4
344.7
124.3
65.S
3.1
179.7
1200.5
334.9
72.4
1046.8
15.1
289.8
243.5
95.9
14.5
284.0
165.4
28.0
64.8
235.4
85,9
41.5
25.0
253.4
35.3
33.6
72.4
107.0
130.0
542
109,9
26.4
0.1
342.5
150.7
382.5
85.6
39.9
83.3
334.4
139.7
138.1
176.R
264.7
World
345.0
1083.0
57.2
311.4
466.4
409.2
115.6
288.5
971.5
155.1
303.6
874,5
374.4
904.7
88.3
1004.1
80.3
47.8
76.0
117.0
152.8
54.4
16.4
615.1
63.0
759.4
270,2
532.3
93.7
40,6
698.9
361.2
639,1
531\.8
1538.8
386.5
75.4
3.1
500.6
1.4
9.6
23.2
17.4
J.J
59.6
13.6
1.8
7.6
117.7
6.3
1.8
9.7
1024
2.1
21.4
6.6
32.9
1.8
5.3
5.9
30.8
71.4
149.6
23.5
1.7
\3.4
81.0
47.3
3.0
18.4
59.8
en dcvcloppcmc£1l et ur I ensemble au monde, 1970 (millions de dollars E.U" l',aJ.) pm puise:; dcsurro!!ados, !970 (Mi!!ones de US$. c.i.f.)
78.0
26.8
505.4
g,8
14.5
118.9
89.9
21.3
61.1
151),8
j~5
34.3
192.9
38.6
149.5
24.2
186.6
15.1
3.6
22.0
9.7
36.5
1.8
6.6
1755
24.8
105.1
106,8
21 J.3
24.3
12,0
'J'J.o
90.0
J 73.8
853
200.8
1039
17.3
3.1
26.0
30.0
9.4
0.2
3.2
0.2
0.4
0,7
0.6
0.1
7.1
0.4
0.1
1.5
3. !
2.6
3.4
I.Y
23.9
4.3
4.2
220
3.4
17.3
6.0
26.2
30.3
12.7
2.6
3.2
3.3
4.1
4,9
0,3
1.7
4.4
1.0
7.1
2.2
1.0
1.6
1.2
2,7
4.4
5,2
3.2
2.7
3.6
1.4
24.0
32.2
6.8
69.8
3.4
680,7
216.4
2919.3
141.9
445,7
1689.1
543.2
179.9
724.4
1415.6
152.2
472.1
J733.4
795.0
13793
129.6
1637.5
337.4
133.7
170.0
132.0
228.7
60.7
151.6
1202.6
98,2
527.0
459,6
12505
144.8
68.2
124'1 i
863.5
10255
801.5
25290
17305
\75.1
32.5
285.0
296,4
1000.2
135.0
438
51.8
282,5
166.3
2136.0
1220,6
374.6
79.8
52.6
l.l
24,7
37.7
8.2
58,2
157.6
189.1
629.3
123.4
1425.4
65.6
12,6
J)u.o
459.9
367,2
358.3
453.4
466,7
855.8
248,9
3204.3
NA
742.1
2689.3
678.2
223.7
776.2
NA
NA
NA
2015.9
961.3
3515.3
1350.2
2012.1
417.2
186.3
181.J
156,7
266.4
liR.9
209,8
1360.2
287.3
1156,3
583.0
2675.9
210.4
80.8
lV\jj.";
1323.4
1392.7
1159.8
21.}82.4
2197.2
Imports
80
87
91
60
63
80
80
93
86
83
39
10
81
81
72
94
84
86
88
72
88
34
80
79
47
61.}
84
65
74
69
85
79
25
III. PRICE AND FREIGHT RATE INDICES
III. Indices des prix et des taux de fret
III. Indices de precios y de fietes
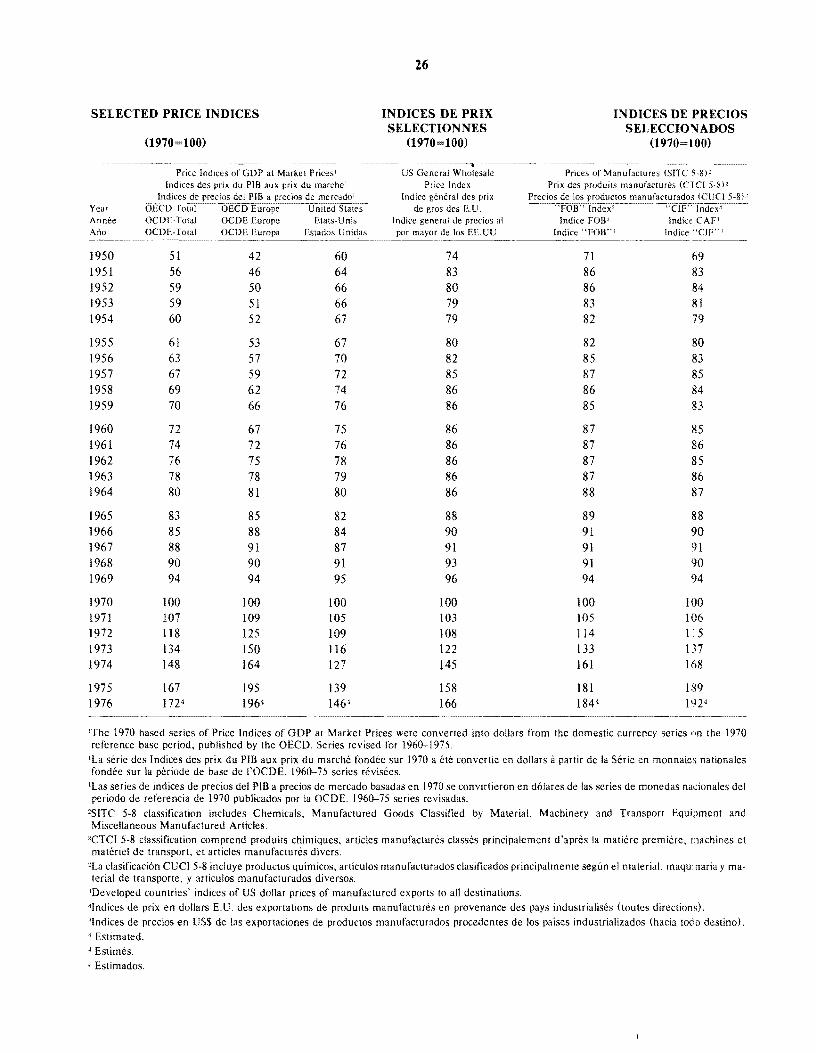
26
SELECTED PRICE INDICES INDICES DE PRIX INDICES DE PRECIOS SELECTIONNES SELECCIO"IADOS
(1970=100) (1970=100) (1970=100) ... -~-.--. . ..... _--_ ..... ..... _---.- .. _--_ ..... _---,_ .....
Price Indices of GDP at Market Prices' US General Wholesale Prices of Manufactures (SITC 5-8)" Price Index Prix des rroduits manufactures (CTCI 5·8)'
Indice general des prix manuracturado, (CUel 5-8)' Year de gros des E. U . Annee OCDE-Total OCDE Europe Etats-Unis Indice general de precios al Indice FOB" Indice CAP Mia OCDE-Total OCDE Europa ESlados por mayor de los EE.UU. Indice "FOB"; Indice "CIF'"
.... ----
1950 51 42 60 74 71 69 1951 56 46 64 83 86 83 1952 59 50 66 80 86 84 1953 59 51 66 79 83 81 1954 60 52 67 79 82 79
1955 61 53 67 80 82 80 1956 63 57 70 82 85 83 1957 67 59 72 85 87 85 1958 69 62 74 86 86 84 1959 70 66 76 86 85 83
1960 72 67 75 86 87 85 1961 74 72 76 86 87 86 1962 76 75 78 86 87 85 1963 78 78 79 86 87 86 1964 80 81 80 86 88 87
1965 83 85 82 88 89 88 1966 85 88 84 90 91 90 1967 88 91 87 91 91 91 1968 90 90 91 93 91 90 1969 94 94 95 96 94 94
1970 100 100 100 100 100 100 1971 107 109 105 103 105 106 1972 118 125 109 108 114 115 1973 134 150 116 122 133 137 1974 148 164 127 145 161 168
1975 167 195 139 158 181 189 1976 1724 1964 1464 166 1844 1924
'The 1970 based series of Price Indices of GDP at Market Prices were converted into dollars from the domestic currency series nn the 1970 reference base period, published by the OECD. Series revised far 1960-1975.
'La serie des Indices des prix du PIB aux prix du marche fondee sur 1970 a ete convertie en dollars a partir de la Serie en monnaie'i nationaJes fondee sur Ja periode de base de I'OCDE. L960-75 series revisees.
'Las series de indices de precios del PIB a precios de mercado basad as en 1970 se convirtieron en d61ares de las series de monedas na,:ionales del periodo de referencia de 1970 publicados par la OCDE. 1960-75 series revisadas.
'SITC 5·8 classification includes Chemicals, Manufactured Goods Classified by Material, Machinery and Transport Equipment and Miscellaneous Manufactured Articles.
"CTCI 5·8 classification comprend produits chimiques, articles manufactures classes principaiement d'apres La matiere premiere, nachines et materiel de transport, et articles manufactures divers.
"La clasificaci6n CUCI 5-8 incluye productos quimicos, articuJos manufacturados clasificados principalmente segun el material, maqu naria y material de transporte, y articulos manufacturados diversos. 'Developed countries' indices of US dollar prices of manufactured exports to all destinations. 'Indices de prix en dollars E.U. des exportations de produits manufactures en provenance des pays industrialises (toutes direction,). "Indices de precios en US$ de las exportaciones de productos manufacturados procedentes de los paises industrializados (hacia todo destino). 4 Estimated. 4 Estimes. 4 Estimados.
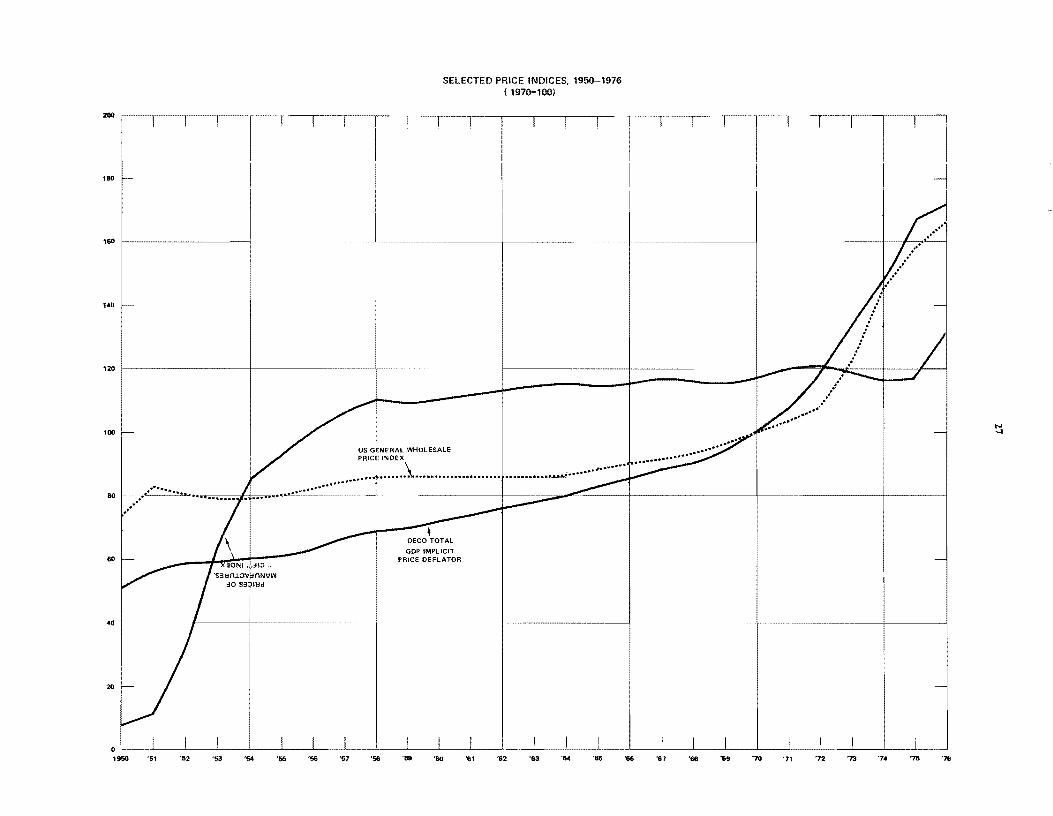
200
180
160
140
120
SELECTED PRICE INDICES, 1950-1976 ( 1970=100)
" .'
"
1:-1 100 /" AP' ---l ....
80 ••••• " .............. • ............. ~l .••••
"
60
40
20
o 1950
...
'51 '52 '53 '54 '156 '56 '57
us GENERAL WHOLESALE PRICE INDEX \ l .............. .
••••••• '- ............................... " ••• ........e.
'56
oeco TOTAL
GOP IMPLICIT PRICE DEFLATOR
'59 '60 '61 '62 '83 '64 '65 '66 '67 '66 '69 '10 '71 '12 '73 '7. '75 ''''
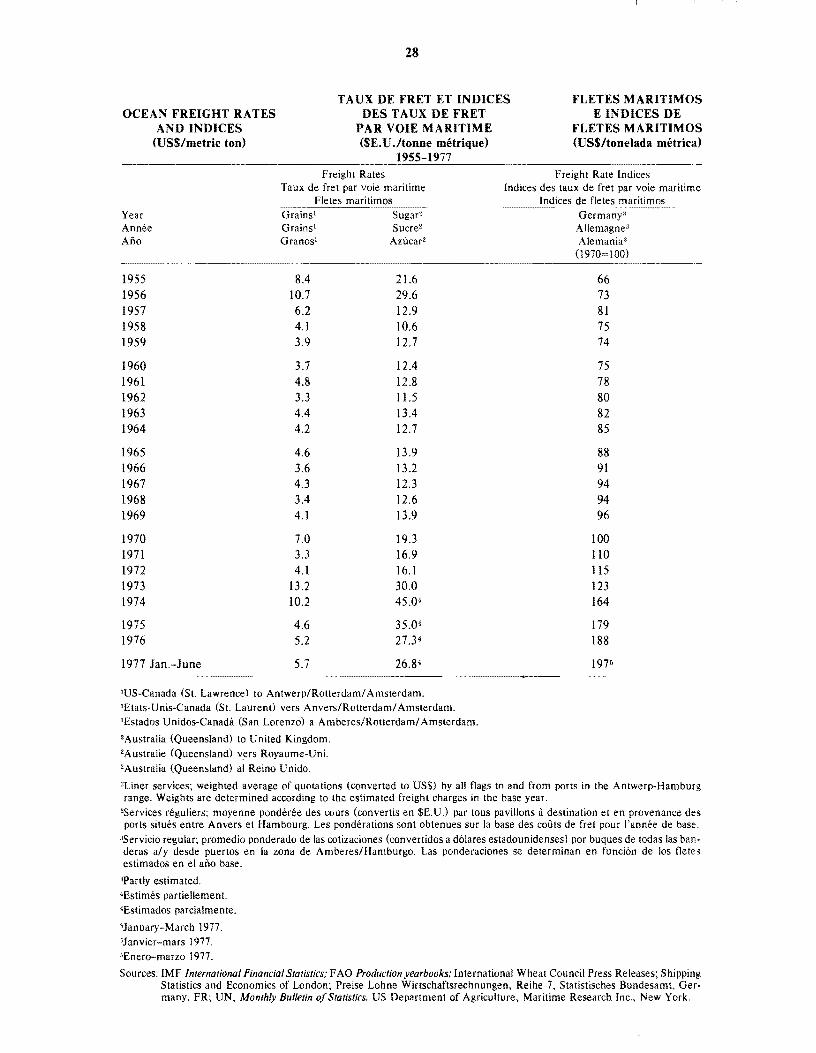
OCEAN FREIGHT RATES AND INDICES
(uS$/metric ton)
28
TAUX DE FRET ET INDICES DES T AUX DE FRET
PAR VOlE MARITIME ($E.U./tonne mHrique)
1955-1977 -------_ ........... _-------_ ........... __ ..... _--------Freight Rates
FLETES MARITIMOS E INDICES DE
FLETES MARITIMOS <US$/tonelada metrical
--------_ ......... _-_.-Freight Rate Indices
Taux de fret par voie maritime Indices des taux de fret par voie maritime Fletes maritimos
Year Grains' Sugar' Annee Grains' Sucre' Ano Granos' Azucar2
1955 8.4 21.6 1956 10.7 29.6 1957 6.2 12.9 1958 4.1 10.6 1959 3.9 12.7
1960 3.7 12.4 1961 4.8 12.8 1962 3.3 1l.5 1963 4.4 13.4 1964 4.2 12.7
1965 4.6 13.9 1966 3.6 13.2 1967 4.3 12.3 1968 3.4 12.6 1969 4.1 13.9
1970 7.0 19.3 1971 3.3 16.9 1972 4.1 16.1 1973 13.2 30.0 1974 10.2 45.04
1975 4.6 35.04
1976 5.2 27.3 4
1977 Jan.-June 5.7 26.84
'US-Canada (St. Lawrence) to Antwerp!Rotterdam! Amsterdam. 'Etats-Unis-Canada (St. Laurent) vers Anvers!Rotterdam! Amsterdam. 'Estados Unidos-Canada (San Lorenzo) a Amberes/Rotterdaml Amsterdam.
2Australia (Queensland) to United Kingdom. 2Australie (Queensland) vers Royaume-Uni. 'Australia (Queensland) al Reino Unido.
Indices de f1etes maritimos Germany" Allemagne" Alemania"
(1970=100) -.------
66 73 81 75 74
75 78 80 82 85
88 91 94 94 96
100 110 115 123 164
179 188
197.1
"Liner services; weighted average of quotations (converted to US$) by all flags to and from ports in the Antwerp-Hamburg range. Weights are determined according to the estimated freight charges in the base year.
"Services reguliers; moyenne ponderee des cours (convertis en SE.UJ par tous pavilions it destination et en provenance des ports situes entre Anvers et Hambourg. Les ponderations sont obtenues sur la base des couts de fret pour I'annee de base.
;lServicio regular; promedio ponderado de las cotizaciones (convertidos a d6lares estadounidensesl por buques de todas las banderas a/y desde puertos en la zona de Amberes/Hamburgo. Las ponderaciones se determinan en funci6n de los f1etes estimados en el ano base.
'Partly estimated. 4Estimes partiellement. 4Estimados parcialmente.
5 January-March 1977. 5Janvier-mars 1977. 5Enero-marzo 1977.
Sources: IMF International Financial Statistics; F AO Production yearbooks; International Wheat Council Press Releases; Shipping Statistics and Economics of London; Preise Lohne Wirtschaftsrechnungen, Reihe 7, Statistisches Bundesamt, Germany, FR; UN, Monthly Bulletin of StatistiCS. US Department of Agriculture, Maritime Research Inc., New York.

29
IV. PRICES
IV. Prix
IV. Precios
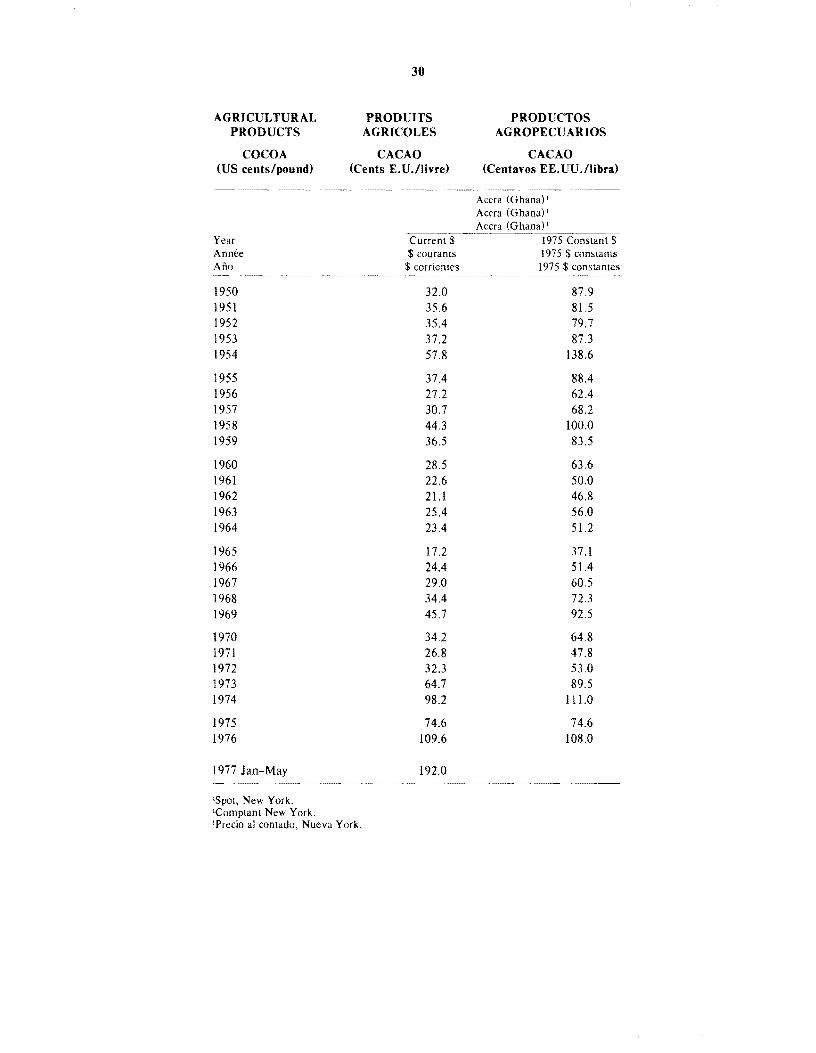
AGRICULTURAL PRODUCTS
COCOA (US cents/pound)
Year Annee Ano
1950 1951 1952 1953 1954
1955 1956 1957 1958 1959
1960 1961 1962 1963 1964
1965 1966 1967 1968 1969
1970 1971 1972 1973 1974
1975 1976
1977 Jan-May
lSpot, New York. IComptanl New York.
30
PRODUITS AGRICOLES
CACAO (Cents E. U.llivre)
Current $ courants
$ corrientes
32.0 35.6 35.4 37.2 57.8
37.4 27.2 30.7 44.3 36.5
28.5 22.6 21.1 25.4 23.4
17.2 24.4 29.0 34.4 45.7
34.2 26.8 32.3 64.7 98.2
74.6 109.6
192.0
IPrecio al contado, Nueva York.
PRODUCTOS AGROPECUARIOS
CACAO (Centavos EE. UU .llibra)
Accra (Ghana)l Accra (Ghana) t Accra (Ghana) t
87.9 81.5 79.7 87.3
138.6
88.4 62.4 68.2
100.0 83.5
63.6 50.0 46.8 56.0 51.2
37.1 51.4 60.5 72.3 92.5
64.8 47.8 53.0 89.5
111.0
74.6 108.0
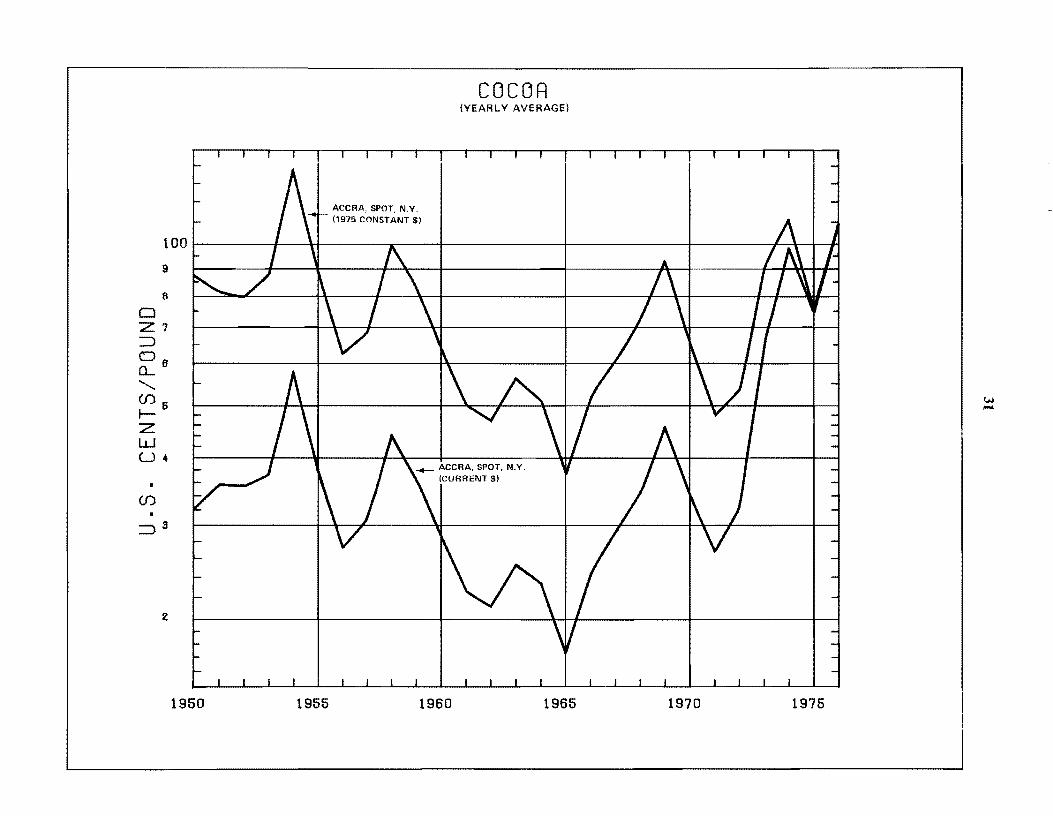
tOO I § \ I
9
8
o Z 7 ::J
°6 (L
" (j)S IZ W U.
(j)
::J3
2
1950 1955
ACCRA, SPOT. N.Y (1975 CONSTANT $)
..
COCOA (YEARLY AVERAGE)
_ ACCRA, SPOT, N.Y.
(CURRENT $1
1960 1965
.' - \ I II
1970 1975
w .....
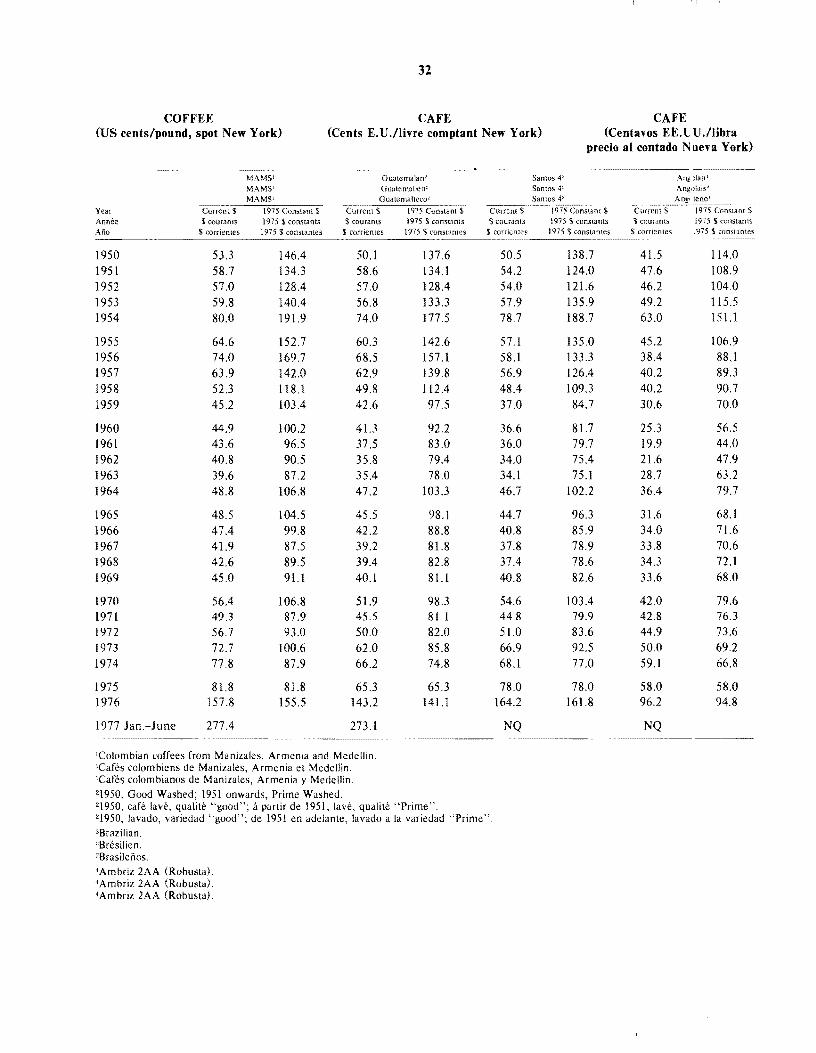
32
COFFEE CAFE CAFE (US cents/pound, spot New York) (Cents E.U./Jivre comptant New York) (Centavos EE.lU./Ubra
MAMS' Guatemalan:.! MAMS' Guatem3Hen~
MAMS' Guatemaltcco2
Year Current $: 1975 Constant $ Current $ 1975 Constant $ Annee $ courants 1975 $ mnstants $ (DUrants
Ano $: corrienles 1975 $ consiantes $ corrienles
1950 533 146A 50.1 1951 58.7 1343 58.6 1952 57.0 128A 57.0 1953 59.8 140A 56.8 1954 80.0 191.9 74.0
1955 64.6 152.7 60.3 1956 74.0 169.7 68.5 1957 63.9 142.0 62.9 1958 523 118.1 49.8 1959 45.2 103A 42.6
1960 44.9 100.2 41.3 1961 43.6 96.5 37j 1962 40.8 90.5 35.8 1963 39.6 87.2 35A 1964 48.8 106.8 47.2
1965 48.5 104.5 45.5 1966 47A 99.8 42.2 1967 41.9 87.5 39.2 1968 42.6 89.5 39A 1969 45.0 91.1 40.1
1970 56A 106.8 51.9 1971 49.3 87.9 45.5 1972 56.7 93.0 50.0 1973 72.7 100.6 62.0 1974 77.8 87.9 66.2
1975 81.8 81.8 653 1976 157.8 155.5 143.2
1977 Jan.-June 277A 273.1
tColombian coffees from Manizales, Armenia and Medellin. tCafes colombiens de Manizales, Armenia et Medellin. tCafes colombianos de Manizaies, Armenia y Medellin. '1950, Good Washed; 1951 onwards, Prime Washed.
1975 $ constants 1975 $ constumes
137.6 134.1 128A 133.3 177.5
142.6 157.1 139.8 112A 97.5
92.2 83.0 79A 78.0
1033
98.1 88.8 81.8 82.8 81.1
983 81.1 82.0 85.8 74.8
65.3 141.1
'1950, cafe lave, qualite "good"; a partir de 1951, lave, qualite "Prime".
Current $:
$ courants $ corrientes
50j 54.2 54.0 57.9 78.7
57.1 58.1 56.9 48A 37.0
36.6 36.0 34.0 34.1 46.7
44.7 40.8 37.8 37A 40.8
54.6 44.8 51.0 66.9 68.1
78.0 164.2
NQ
'1950, lavado, variedad "good"; de 1951 en adelante, lavado a la variedad "Prime", "Brazilian. "Bresilien. "Brasilenos. 'Ambriz 2AA (Robusta). <Ambriz 2AA (Robusta), 'Ambriz 2AA (Robusta).
precio al contado Nueva York)
Santos 4'; Ang )lan t
Santos 4' Ang'l,lais4 Santos 4.1 leno~
1975 Co~~i;;;;t$ ---_ .... 1975 Constant $
1975 $ constants $ couranlS 1975 $ constants 1975 $ constantes $ corrienles 1975 $ conSlantes
138.7 41.5 114.0 124.0 47.6 108.9 121.6 46.2 104.0 135.9 49.2 115.5 188.7 63.0 151.1
135.0 45.2 106.9 1333 38A 88.1 126A 40.2 893 109.3 40.2 90.7 84.7 30.6 70.0
81.7 25.3 56.5 79.7 19.9 44.0 75A 2l.6 47.9 75.1 28.7 63.2
102.2 36A 79.7
963 31.6 68.1 85.9 34.0 71.6 78.9 33.8 70.6 78.6 34.3 72.1 82.6 33.6 68.0
103A 42.0 79.6 79.9 42.8 76.3 83.6 44.9 73.6 92.5 50.0 69.2 77.0 59.1 66.8
78.0 58.0 58.0 161.8 96.2 94.8
NQ
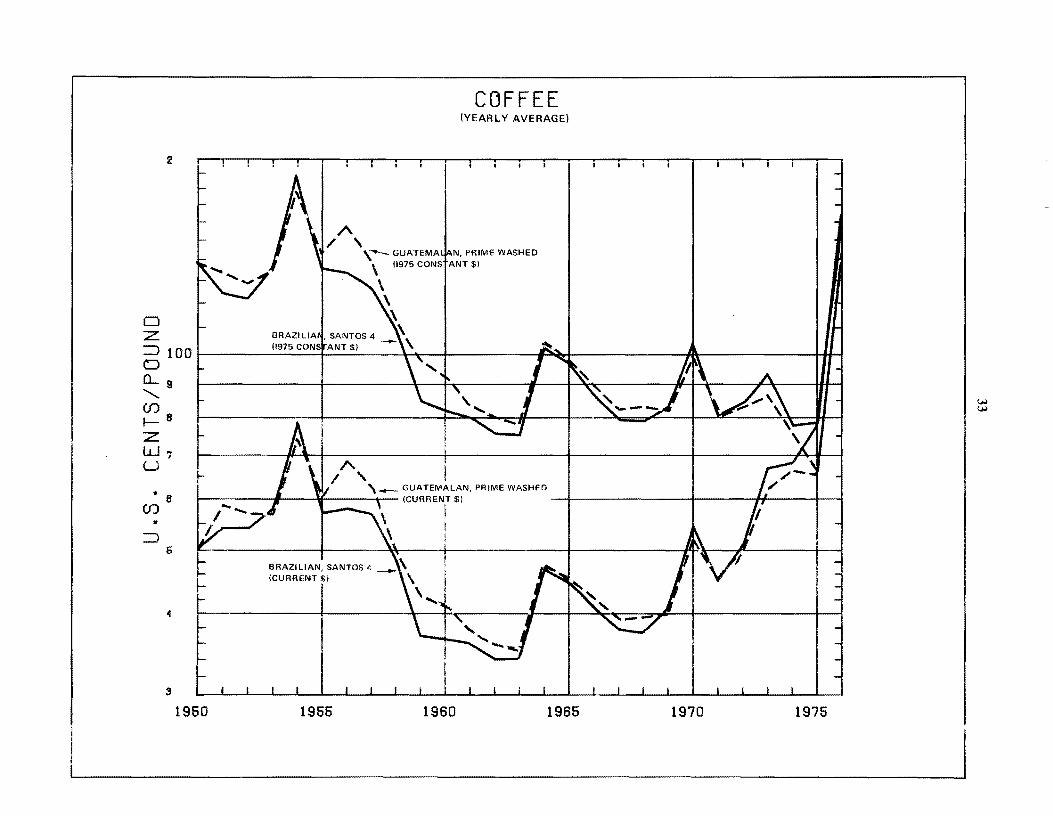
COFFEE (YEARLY AVERAGE)
2 '--1 -::--r--'--~---r--'---r---r--'--~---r--;---~--r--'--~---r--'---~--r-~r--.---r--l
0 Z :::J 100 a 0... 9 ""-(/)8 I--Z W., U
~ I
• 8 (/)
• :::J
6
~ 4
3
1950
/\ / ,
, __ GUATEMALjAN, PRIME WASHED
\ H975 CONStANT $)
" / ,
\ ~ ~
\_ GUATEMALAN, PRIME WASHED I V \ (CURRENT $) 1/
1955
r !
1960 1965 1970
~
1975
w w
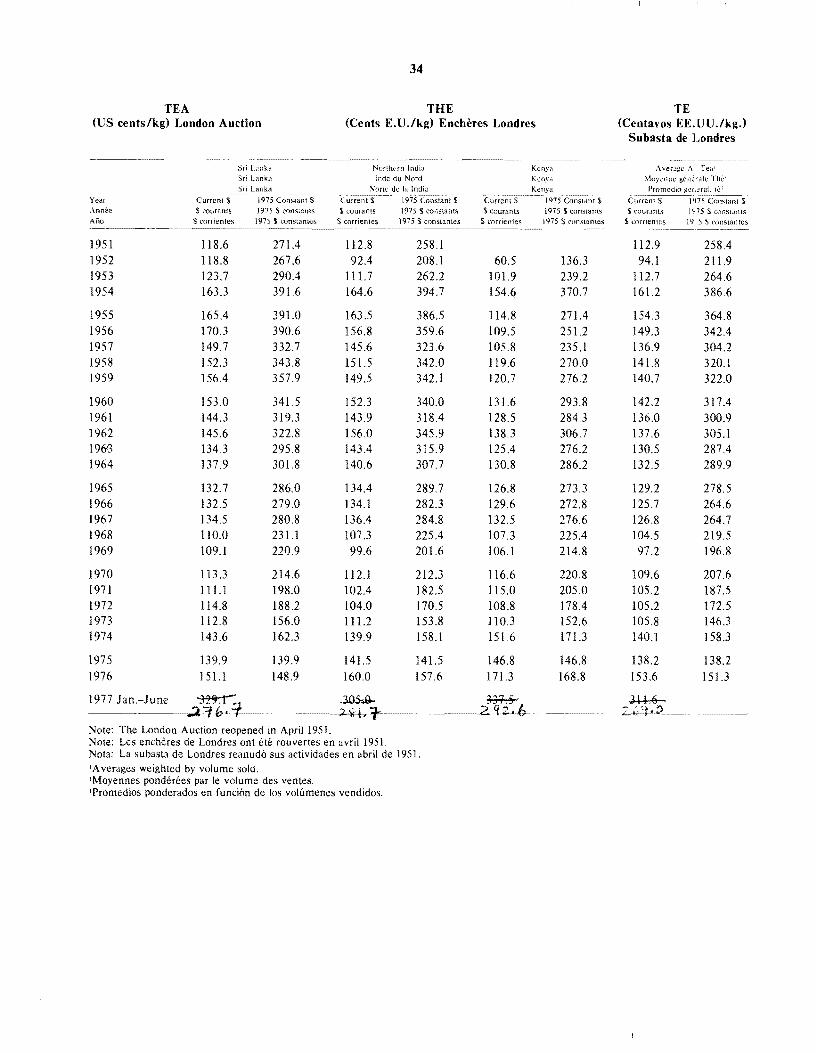
TEA (US cents/kg) London Auction
Sri Lanka
Sri Lmka Sri Lanka
Curren' "$- 1975 C;'nstant$
34
THE (Cents E.U.!kg) Encheres Londres
Northern India
IEde du Nord !\"onc dc IH Indiu
C~ur~re~nt~$ ...... ~- 1975~Co~n~sta~nt~$
Kenya Kenya
II
TE (Centavos EE. UU./kg.)
Subasta de Londres
Year
Annee Ano
$ courant:; 1975 S constants $ courants 1975 S cor:slants S courants 1975 $ constants $ courants J,;>75 $ COnSI3I1tS
$ corrienles 1975 $ constantcs $ corrientes )975 $ conslanles $ corrientes 1975 $ conSlilmes $ cOfflcnles 19"5 S conSlllntes
1951 1952 1953 1954
1955 1956 1957 1955 1959
1960 1961 1962 1963 1964
1965 1966 1967 1965 1969
1970 1971 1972 1973 1974
1975 1976
11S.6 11S.S 123.7 163.3
165.4 170.3 149.7 152.3 156.4
153.0 144.3 145.6 134.3 137.9
132.7 132.5 134.5 110.0 109.1
113.3 111.1 114.S 112.S 143.6
139.9 151.1
271.4 267.6 290.4 391.6
391.0 390.6 332.7 343.S 357.9
341.5 319.3 322.S 295.8 301.S
286.0 279.0 280.8 231.1 220.9
214.6 198.0 188.2 156.0 162.3
139.9 148.9
112.S 92.4
111.7 164.6
163.5 156.S 145.6 151.5 149.5
152.3 143.9 156.0 143.4 140.6
134.4 134.1 136.4 107.3 99.6
112.1 102.4 104.0 111.2 139.9
141.5 160.0
.3.(}S;ij.. --_ ...... {¥!."t .. .
Note: The London Auction reopened in April 1951. Note: Les encMres de Londres ont ete rouvertes en avril 1951.
258.1 20S.1 262.2 394.7
386.5 359.6 323.6 342.0 342.1
340.0 318.4 345.9 315.9 307.7
289.7 282.3 284.8 225.4 201.6
212.3 IS2.5 170.5 153.8 158.1
141.5 157.6
Nota: La subasta de Londres reanud6 sus actividades en abril de 1951. 'Averages weighted by volume sold. IMoyennes ponderees par Ie volume des ventes. IPromedios ponderados en funci6n de los volumenes vendidos.
60.5 101.9 154.6
114.8 109.5 105.8 119.6 120.7
131.6 128.5 138.3 125.4 130.8
126.8 129.6 132.5 107.3 106.1
116.6 115.0 10S.S 110.3 151.6
146.8 171.3
~ 2 q?·b
136.3 239.2 370.7
271.4 251.2 235.1 270.0 276.2
293.8 284.3 306.7 276.2 286.2
273.3 272.8 276.6 225.4 214.8
220.S 205.0 178.4 152.6 171.3
146.8 168.S
112.9 94.1
112.7 161.2
154.3 149.3 136.9 141.8 140.7
142.2 136.0 137.6 130.5 132.5
129.2 125.7 126.8 104.5 97.2
109.6 105.2 105.2 105.S 140.1
138.2 153.6
~
258.4 211.9 264.6 386.6
364.8 342.4 304.2 320.1 322.0
317.4 300.9 305.1 287.4 289.9
27S.5 264.6 264.7 219.5 196.8
207.6 IS7.5 172.5 146.3 158.3
138.2 151.3
..... -~ ~------2..-.' "i' !L__ ...... ~-~~-~
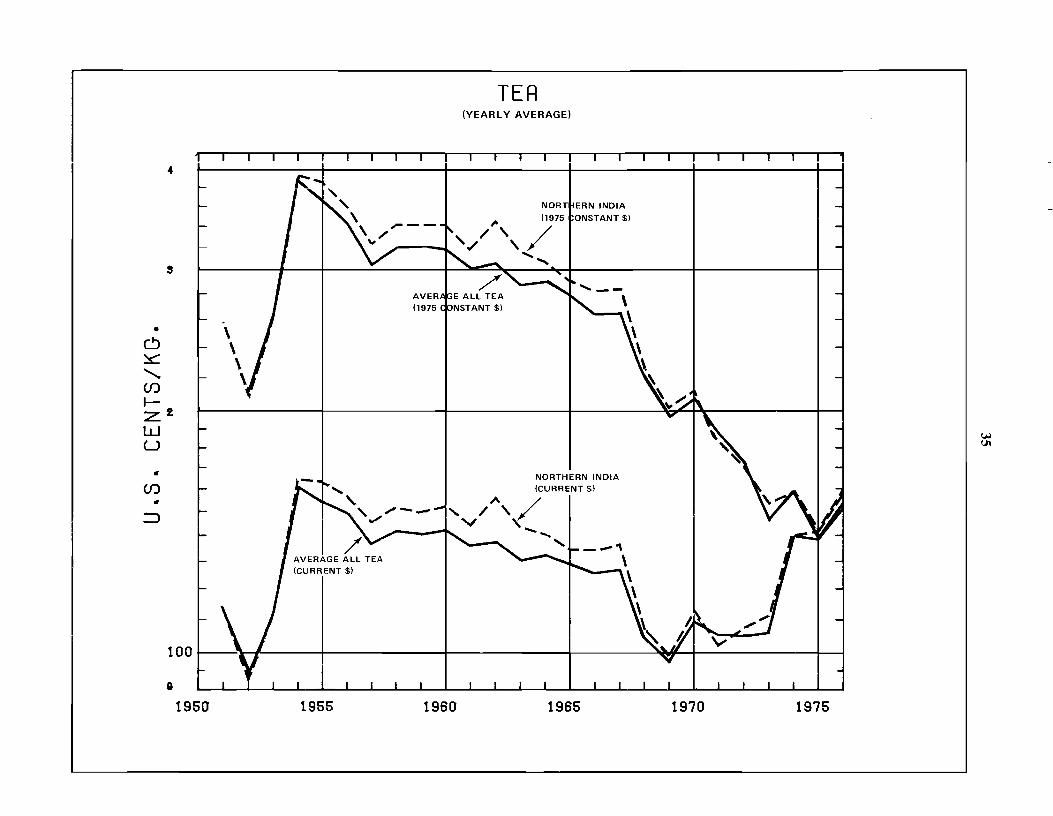
• C> ~
"(f)
4
s
I:z.2 W U
• (f)
• =>
TEA (YEARLY AVERAGE)
1 1
" , ~ \ '--1 /' / \ / ,;, '" ., .....
.; .....
"' " NORTHERN INDIA (CURRENT $)
, ;"'--./
, //'\ / V '"
AVERAGE ALL TEA (CURRENT $)
~.......,...". -.... ,
100 1-----'lI ~ I
8
1950 1955 1960 1965 1970 1975
Yol Ul
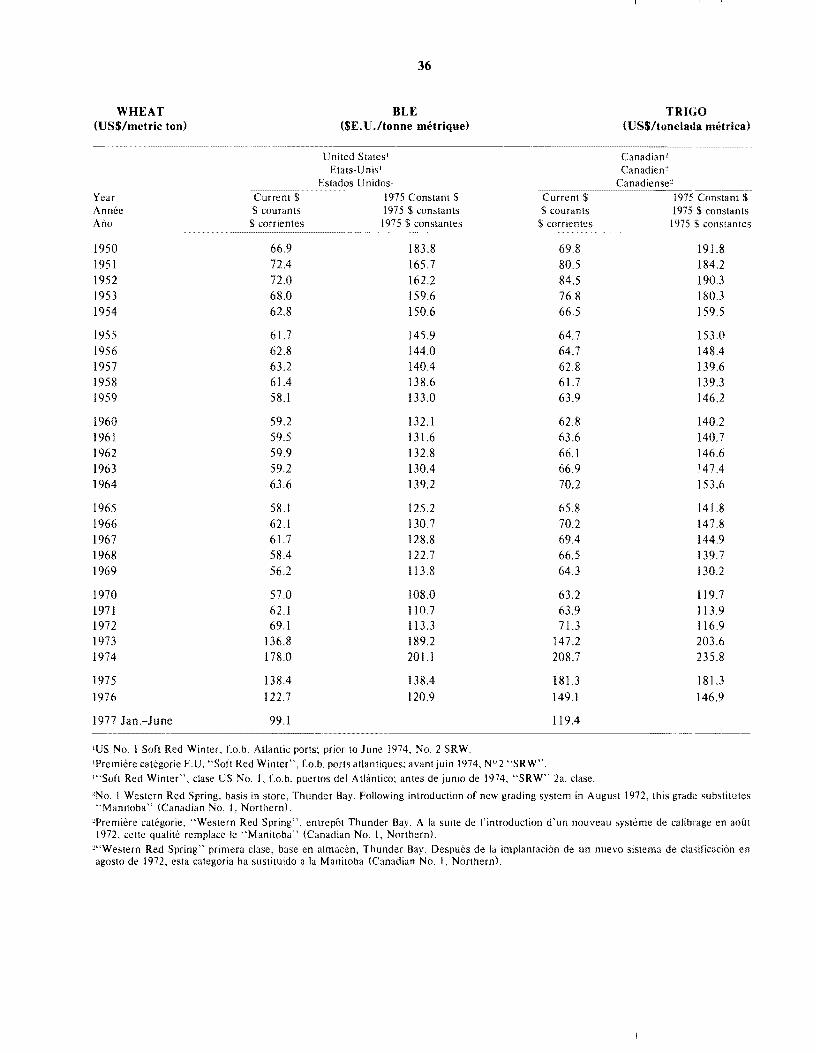
WHEAT (US$/metric ton)
Year Annee AnD
1950 1951 1952 1953 1954
1955 1956 1957 1958 1959
1960 1961 1962 1963 1964
1965 1966 1967 1968 1969
1970 1971 1972 1973 1974
1975
1976
1977 Jan.-June
--_ ...... Current $ S courants
$ corrientes
66.9 72.4 72.0 68.0 62.8
61.7 62.8 63.2 61.4 58.1
59.2 59.5 59.9 59.2 63.6
58.1 62.1 61.7 58.4 56.2
57.0 62.1 69.1
136.8 178.0
138.4 122.7
99.1
36
BLE ($E. U .Itonne metrique)
United States' Etats-Unis'
Estados Unidos' 1975 Constant $ 1975 $ constants
1975 $ constantes
183.8 165.7 162.2 159.6 150.6
145.9 144.0 140.4 138.6 133.0
132.1 131.6 132.8 130.4 139.2
125.2 130.7 128.8 122.7 113.8
108.0 110.7 113.3 189.2 201.1
138.4 120.9
'US No.1 Sort Red Winter, Lo.b. Atlantic ports: prior to June 1974, No.2 SRW.
$ courants $ corrientes
69.8 80.5 84.5 76.8 66.5
64.7 64.7 62.8 61.7 63.9
62.8 63.6 66.1 66.9 70.2
65.8 70.2 69.4 66.5 64.3
63.2 63.9 71.3
147.2 208.7
181.3 149.1
119.4
'Premiere categorie E.U. "Sort Red Winter", Lo.b. ports atlantiques: avantjuin 1974, N° 2 "SRW".
'''Sort Red Winter", clase US No.1, Lo.b. puertos del Atlimtico; antes de junio de 1974, "SRW" 2a. clase.
TRWO (US$/tonelada metrica)
Canadian" Canadien"
Canadiense" 1975 Constant $ 1975 $ constants
1975 $ constantes
191.8 184.2 190.3 180.3 159.5
153.0 148.4 139.6 139.3 146.2
140.2 140.7 146.6 147.4 153.6
141.8 147.8 144.9 139.7 130.2
119.7 113.9 116.9 203.6 235.8
181.3 146.9
'No. I Western Red Spring, basis in store, Thunder Bay. Following introduction of new grading system in August 1972, this grade substitutes "Manitoba" (Canadian No. I, Northern).
"Premiere categorie, "Western Red Spring". entrepot Thunder Bay. A la suite de I'introduction d'un nouveau systeme de ca\ibrage en aout 1972, celte qualite remplace Ie "Manitoba" (Canadian No. I, Northern).
'''Western Red Spring" primera clase, base en almacen, Thunder Bay. Despues de la implantaci6n de un nuevo sistema de cla'iificaci6n en agosto de 1972, esta categoria ha sustituido a la Manitoba (Canadian No.1, Northernl.
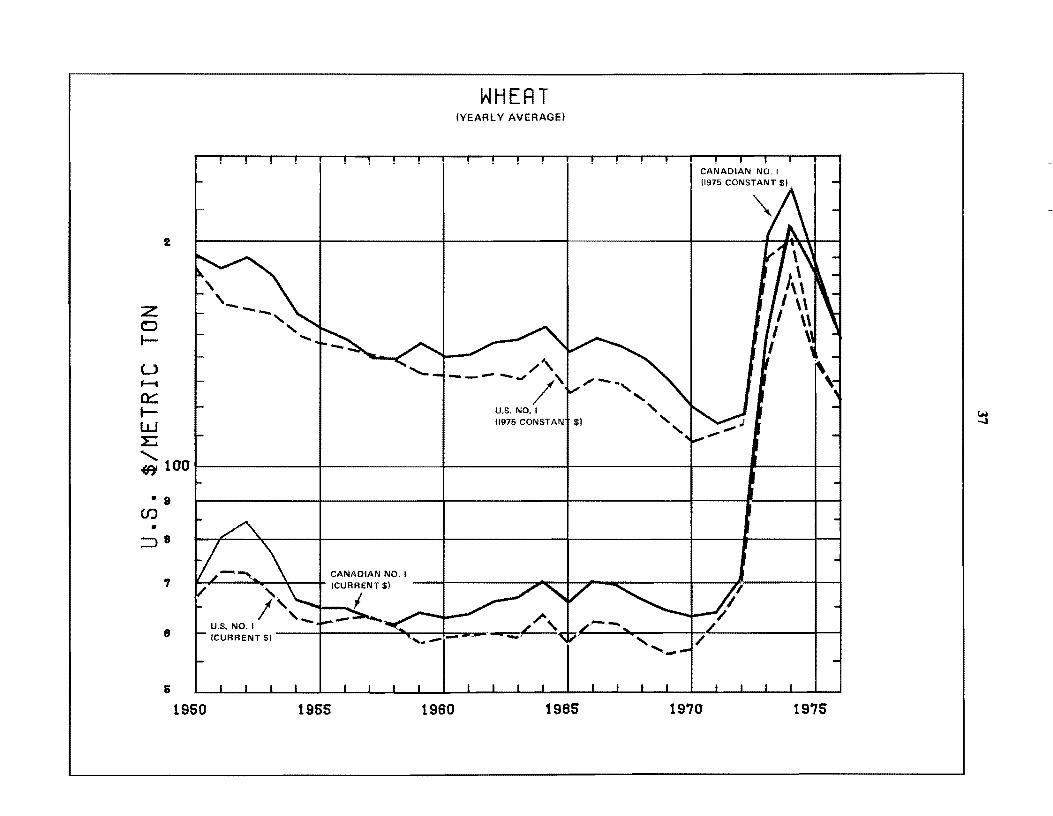
z o I-
U f--i
a::: IW E
2
\ \_--" .....
WHEAT (VEARL v AVERAGE)
,/\ .... _-- ....... ..", , /
u.s. NO.1 (1975 CONSTANt $)
/- .. , "
"
CANADIAN NO. I 11975 CONSTANT $)
" ¥11001--~ -t--- • • 8
(J)
• :::>8
,
8
5
r ~ » '\:::!.So, .. NO. , • • ." (CUR?NT $) .......... , ==<: h
I ,_
1950
U.S. NO.1 (CURRENT $)
1955
... --'--
1960
-....,1 ' ...... -
1965 1970 1975
(N ......
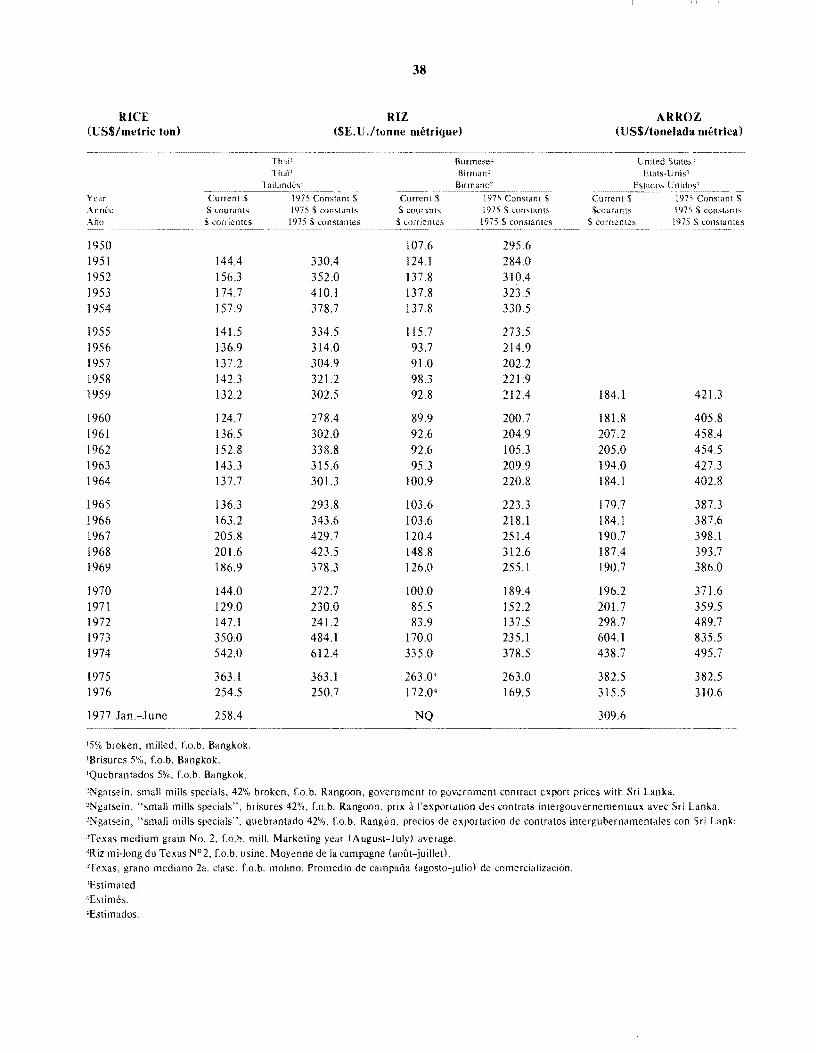
RICE (USS/metric ton)
Year Annce
Aiio
1950 1951 1952 1953 1954
1955 1956 1957 1958 1959
1960 1961 1962 1963 1964
1965 1966 1967 1968 1969
1970 1971 1972 1973 1974
1975 1976
1977 Jan.-June
Current $ courants S corrienles
144.4 156.3 174.7 157.9
141.5 136.9 137.2 142.3 132.2
124.7 136.5 152.8 143.3 137.7
136.3 163.2 205.8 201.6 186.9
144.0 129.0 147.1 350.0 542.0
363.1 254.5
258.4
15% broken, milled, Co.b. Bangkok.
lBrisures 5%, r.o.b. Bangkok.
lQuebrantados 5%, CO.b. Bangkok.
38
RIZ (SE. U ./tonne metrique)
Thai' Burmese! Tha'i' Birman'
Birmano~
Constant $ CurrentS 1975 Constant $ 1975 S constants $ courants 1975 $ constants
1975 $ canstantes $ corrientes 1975 $ constantes
107.6 295.6 330.4 124.1 284.0 352.0 137.8 310.4 410.1 137.8 323.5 378.7 137.8 330.5
334.5 115.7 273.5 314.0 93.7 214.9 304.9 91.0 202.2 321.2 98.3 221.9 302.5 92.8 212.4
278.4 89.9 200.7 302.0 92.6 204.9 338.8 92.6 105.3 315.6 95.3 209.9 301.3 100.9 220.8
293.8 103.6 223.3 343.6 103.6 218.1 429.7 120.4 251.4 423.5 148.8 312.6 378.3 126.0 255.1
272.7 100.0 189.4 230.0 85.5 152.2 241.2 83.9 137.5 484.1 170.0 235.1 612.4 335.0 378.5
363.1 263.0" 263.0 250.7 172.04 169.5
NQ
ARROZ (uSS/tonelada metrical
United States" Etats-Cnis'l
Estados Un idos"
Current 197.' Constant $courants 1975 $ constants
S (orrieo tes 1975 $ constantes ..... -~--
184.1 421.3
181.8 405.8 207.2 458.4 205.0 454.5 194.0 427.3 184.1 402.8
179.7 387.3 184.1 387.6 190.7 398.1 187.4 393.7 190.7 386.0
196.2 371.6 201.7 359.5 298.7 489.7 604.1 835.5 438.7 495.7
382.5 382.5 315.5 310.6
309.6 .. -------_._- -----.... -~
"Ngatsein, small mills specials, 42% hroken, Co.b. Rangoon, government to government contract export prices with Sri Lanka.
"Ngatsein, "small mills specials", brisures 42%, Lo.b. Rangoon, prix a I'exportation des conlrals intergouvernementaux avec Sri Lanka. 'Ngatsein, "small mills specials", quebrantado 42%, f.o.b. Rangun, precios de exportacion de contratos intergubernamentales can Sri Lank:
"Texas medium grain No.2, Lo.b. mill. Marketing year (August-July) average.
'Riz mi-Iong du Texas N° 2, Lo.b. usine. Moyenne de la campagne (aout-juillet). "Texas, grano mediano 2a. clase, Lo.b. molino. Promedio de campana (agosto-julio) de comercializaci6n.
'Estimated.
'Estimes.
'Estimados.
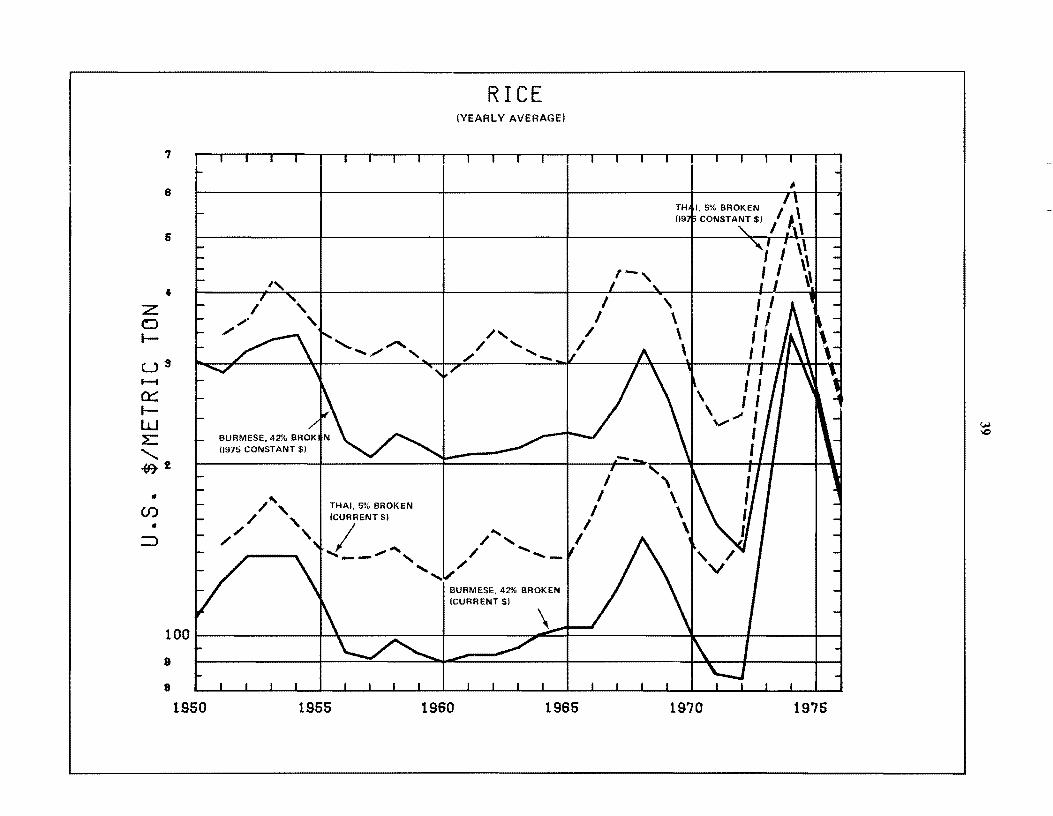
Z D I-
7
8
5
...
U' I--t
a:::: IW ~
"'-(f.T2
• (J)
• =>
I ,.' , ,
/'
/
/', / " / ,
RICE (YEARLY AVERAGE)
1-'-1 r I! T I ----.- r
THAI, 5% BROKEN (CURRENT $)
/ ~~ -- , .......... 1
/, / .....
/ ..... -
/ .... / "
/ ' BURMESE,42% BROKEN (CURRENT $)
I
I I
I I
1-,
;
TH,.I,5% BROKEN I \ 0971; CONSTANT $) I J.
. \ \
, \ \ \
\\ \\ \\
1001 I \. ~ l I I I 8
8
1950 1955 1960 1965 1970 1975
f"H \C
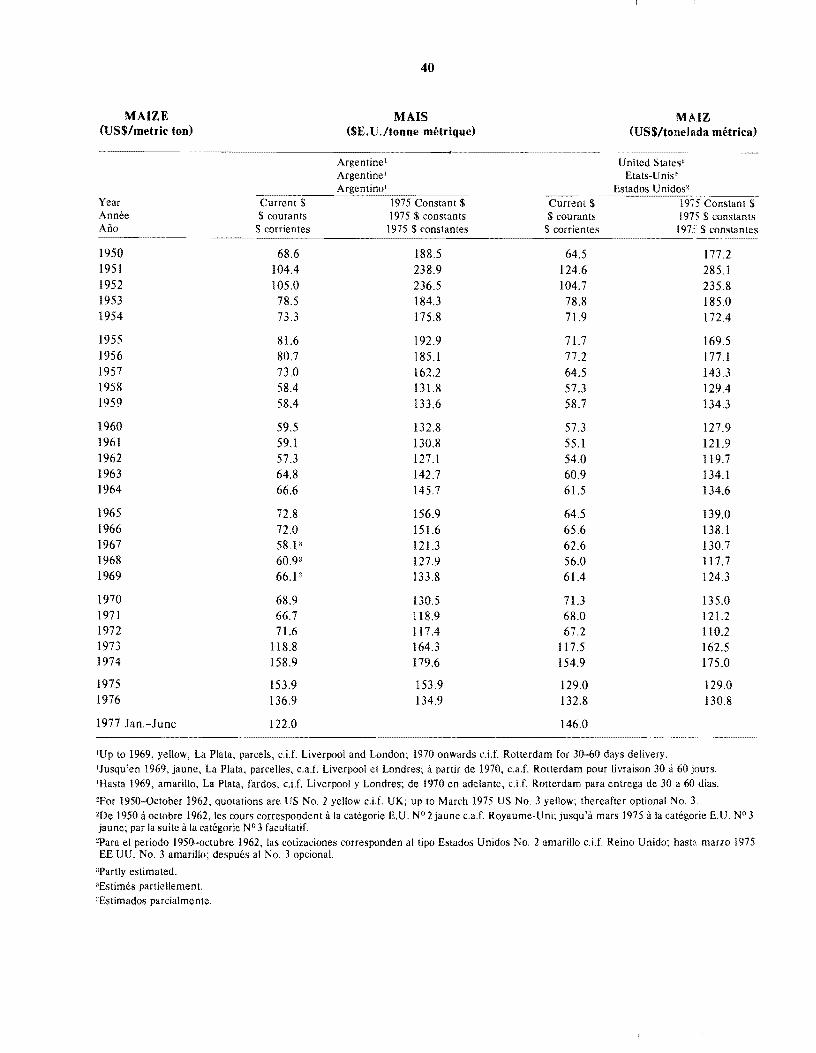
MAIZE (USS/metric ton)
Year Annee Ano
1950 1951 1952 1953 1954
1955 1956 1957 1958 1959
1960 1961 1962 1963 1964
1965 1966 1967 1968 1969
1970 1971 1972 1973 1974
1975 1976
1977 Jan.-June
Current $ $ courants
$ corrientes
68.6 104.4 105.0 78.5 73.3
81.6 80.7 73.0 58.4 58.4
59.5 59.1 57.3 64.8 66.6
72.8 72.0 58.13 60.93
66.1"
68.9 66.7 71.6
118.8 158.9
153.9 136.9
122.0
40
MAIS (SE. U .Ito nne metrique)
Argentine' Argentine' Argentino'
1975 Constant $ 1975 $ constants
1975 $ constantes
188.5 238.9 236.5 184.3 175.8
192.9 185.1 162.2 131.8 133.6
132.8 130.8 127.1 142.7 145.7
156.9 151.6 121.3 127.9 133.8
130.5 118.9 117.4 164.3 179.6
153.9 134.9
MAIZ (USS/toneJada metrical
------United States'
Etats-U nis2
Estados Unidos' ~--------
Current $ 1975 Constant $ $ courants 1975 $ constan ts
$ corrientes 197." $ constantes -----
64.5 177.2 124.6 285.1 104.7 235.8 78.8 185.0 71.9 172.4
71.7 169.5 77.2 177.1 64.5 143.3 57.3 129.4 58.7 134.3
57.3 127.9 55.1 121.9 54.0 119.7 60.9 134.1 61.5 134.6
64.5 139.0 65.6 138.1 62.6 130.7 56.0 117.7 61.4 124.3
71.3 135.0 68.0 121.2 67.2 110.2
117.5 162.5 154.9 175.0
129.0 129.0 132.8 130.8
146.0
'Up to 1969, yellow, La Plata, parcels, c.i.f. Liverpool and London; 1970 onwards d.[ Rotterdam for 30-60 days delivery. 'Jusqu'en 1969, jaune, La Plata, parcelles, c.aJ. Liverpool et Londres; it partir de 1970, c.aJ. Rotterdam pour Iivraison 30 a 60 jours. 'Hasta 1969, amarillo, La Plata, [ardos, c.iJ. Liverpool y Londres; de 1970 en adelante, c.iJ. Rotterdam para entrega de 30 a 60 dias.
'For 1950-0ctober 1962, quotations are US No.2 yellow cH. UK; up to March 1975 US No.3 yellow; thereafter optional No.3 zDe 1950 a octobre 1962, les cours correspondent it la categorie E.U. N° 2jaune c.aJ. Royaume-Uni; jusqu'a mars 1975 it la categorie E.U. N° 3 jaune; par la suite it la categorie N° 3 facultatif.
"Para el periodo 1950-octubre 1962, las cotizaciones corresponden al tipo Estados Unidos No.2 amarillo c.i.f. Reino Unido; hasta marzo 1975 EE.UU. NO.3 amarillo; despues al No.3 opcional.
'Partly estimated. "Estimes partiellement. 3Estimados parcialmente.
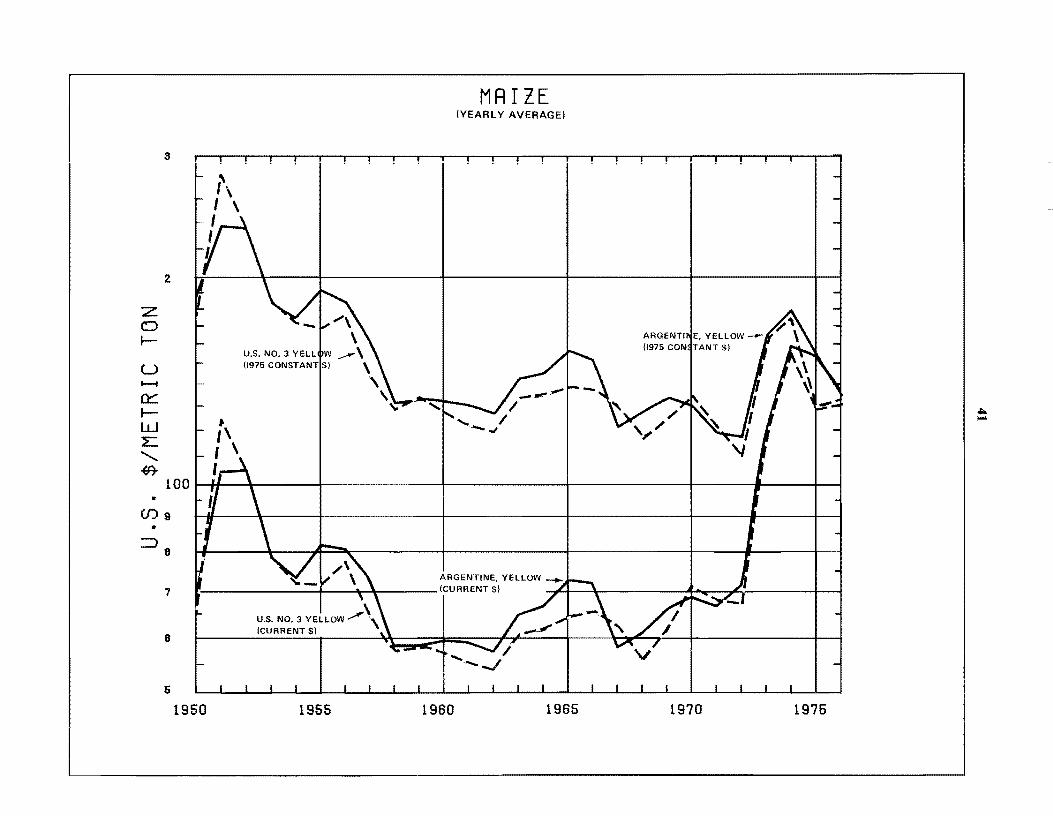
MRIZE (YEARLY AVERAGE)
s
6
1950 1955 1960 1965 1970 1975
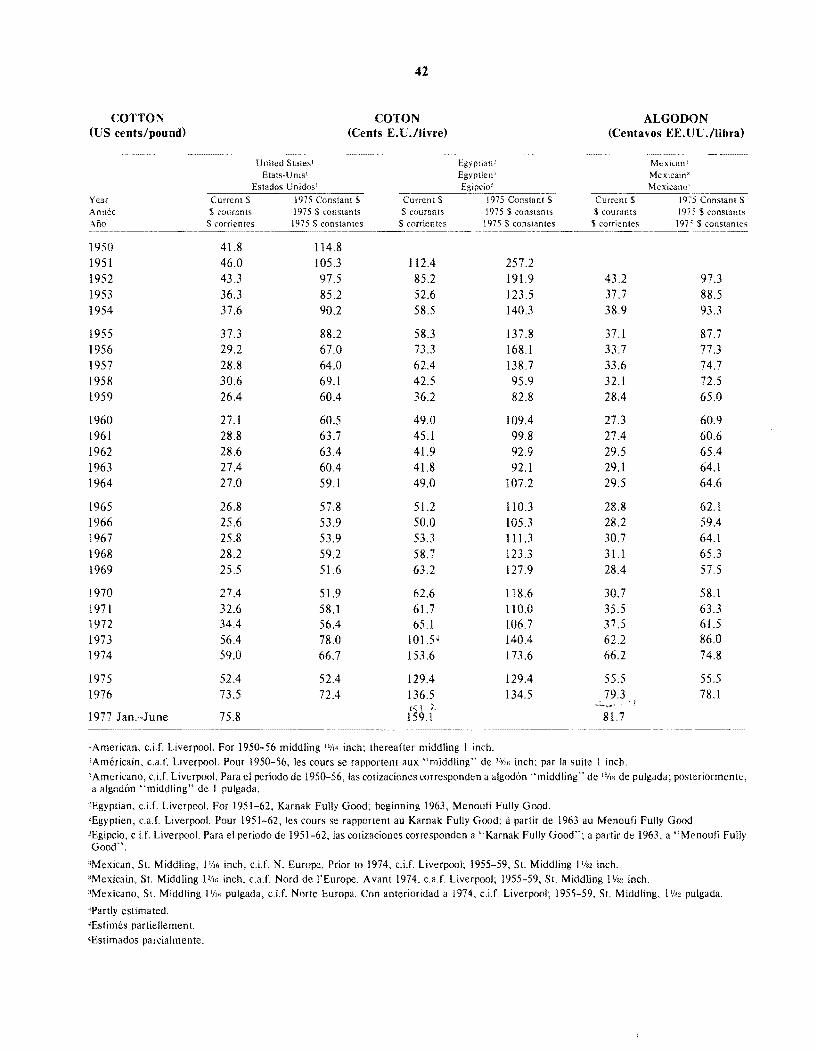
COTTON ({;S cents/pound)
Year Annee Ano
1950 1951 1952 1953 1954
1955 1956 1957 1958 1959
1960 1961 1962 1963 1964
1965 1966 1967 1968 1969
1970 1971 1972 1973 1974
1975 1976
1977 Jan.-June
United States! Etats-Unis1
42
COTON (Cents EX.llivre)
Egyptian' Egyptien'
Estados Unidos' _----::--_Eg;pcio'-=-c;:c--_ Current S 1975 Constant S Current S 1975 Constant $ $ courants 1975 $ constants $ courants 1975 $ constants
$ corrientes 1975 $ constantes $ corrientes 1975 $ constantes
41.8 114.8 46.0 105.3 112.4 257.2 43.3 97.5 85.2 191.9 36.3 85.2 52.6 J 23.5 37.6 90.2 58.5 140.3
37.3 88.2 58.3 137.8 29.2 67.0 73.3 168.1 28.8 64.0 62.4 138.7 30.6 69.1 42.5 95.9 26.4 60.4 36.2 82.8
27.1 60.5 49.0 109.4 28.8 63.7 45.1 99.8 28.6 63.4 41.9 92.9 27.4 60.4 41.8 92.1 27.0 59.1 49.0 107.2
26.8 57.8 51.2 110.3 25.6 53.9 50.0 105.3 25.8 53.9 53.3 111.3 28.2 59.2 58.7 123.3 25.5 51.6 63.2 127.9
27.4 51.9 62.6 118.6 32.6 58.1 61.7 110.0 34.4 56.4 65.1 106.7 56.4 78.0 101.5 4 140.4 59.0 66.7 153.6 173.6
52.4 52.4 129.4 129.4 73.5 72.4 136.5 134.5
75.8 15 11 1 9.1
!American. c.i.f. Liverpool. For 1950-56 middling 15/lh inch; thereafter middling 1 inch.
ALGODON (Centavos EE. UU .llibra)
Mexican·' Mexicain·' Mexicano
Current $ 1975 Constant $ $ courants 19; 5 $ constants
$ corrientes 197 ': $ constames
43.2 97.3 37.7 88.5 38.9 93.3
37.1 87.7 33.7 77.3 33.6 74.7 32.1 72.5 28.4 65.0
27.3 60.9 27.4 60.6 29.5 65.4 29.1 64.1 29.5 64.6
28.8 62.1 28.2 59.4 30.7 64.1 31.1 65,3 28.4 57.5
30.7 58.1 35.5 63.3 37.5 61.5 62.2 86.0 66.2 74.8
55.5 55.5 79,3 78.1
-'--" ,
81.7 " ..... --- -----,-
IAmericain. c.a.f. Liverpool. Pour 1950-56, les cours se rapportent aux "middling" de ICV" inch; par la suite 1 inch.
IAmericano. c.i.f. Liverpool. Para el periodo de 1950-56, las cotizaciones corresponden a algodon "middling" de 15116 de pulgada; posteriormente, a algodon "middling" de 1 pulgada.
2Egyptian, c.i.f. Liverpool. For 1951-62, Karnak Fully Good; beginning 1963, Menoufi Fully Good.
'Egyptien, c.a.r. Liverpool. Pour 1951-62, les cours se rapportent au Karnak Fully Good; a partir de 1963 au Menoufi Fully Good "Egipcio, c.i.f. Liverpool. Para el periodo de 1951-62, las cotizaciones corresponden a "Karnak Fully Good"; a partir de 1963, a "Menoufi Fully Good".
"Mexican, SI. Middling. 1'/'6 inch, c.i.1". N. Europe. Prior to 1974, c.i.f. Liverpool; 1955-59, SI. Middling JIAJ2 inch.
3Mexicain, SI. Middling 1'/16 inch, c.aJ. Nord de rEurope. Avant 1974, c.a.f. Liverpool; 1955-59, St. Middling 1'/'~2 inch. :;Mexicano, SI. Middling 1'/,. pulgada, c.i.f. Norte Europa. Con anterioridad a 1974, c.i.f. Liverpool; 1955-59, St. Middling, 1'1:12 pulgada.
'Partly estimated. 4Estimes partiellemenl.
'Estimados parcial mente.
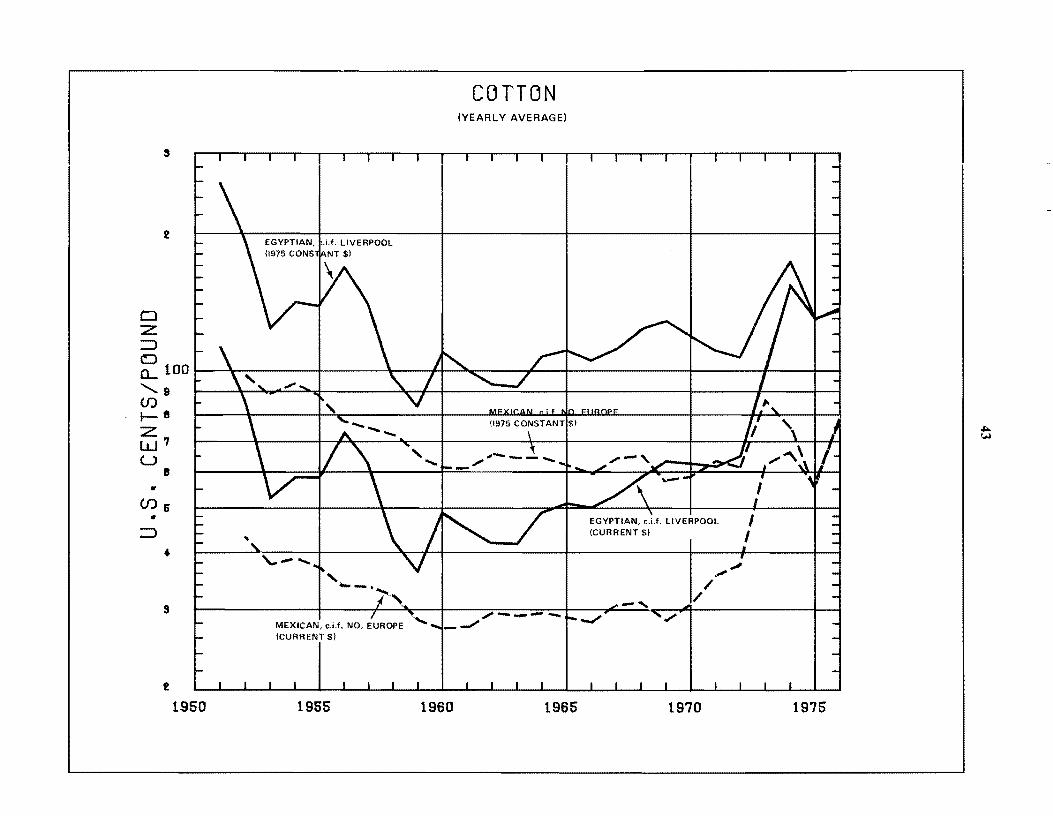
corrON (YEARLY AVERAGE)
s
2
0 Z :::J D (L 100
'8 r \ ' .... ..... (/) 1-- 8
'I .. ----- -; .. , Z W' U
8
• (/)6
• ::J I- ..
4
s
2
1950 1955 1960 1965
...-
/
~ ./
...../ V
1970
I -L I I
-I-..,,;
1975
"" W
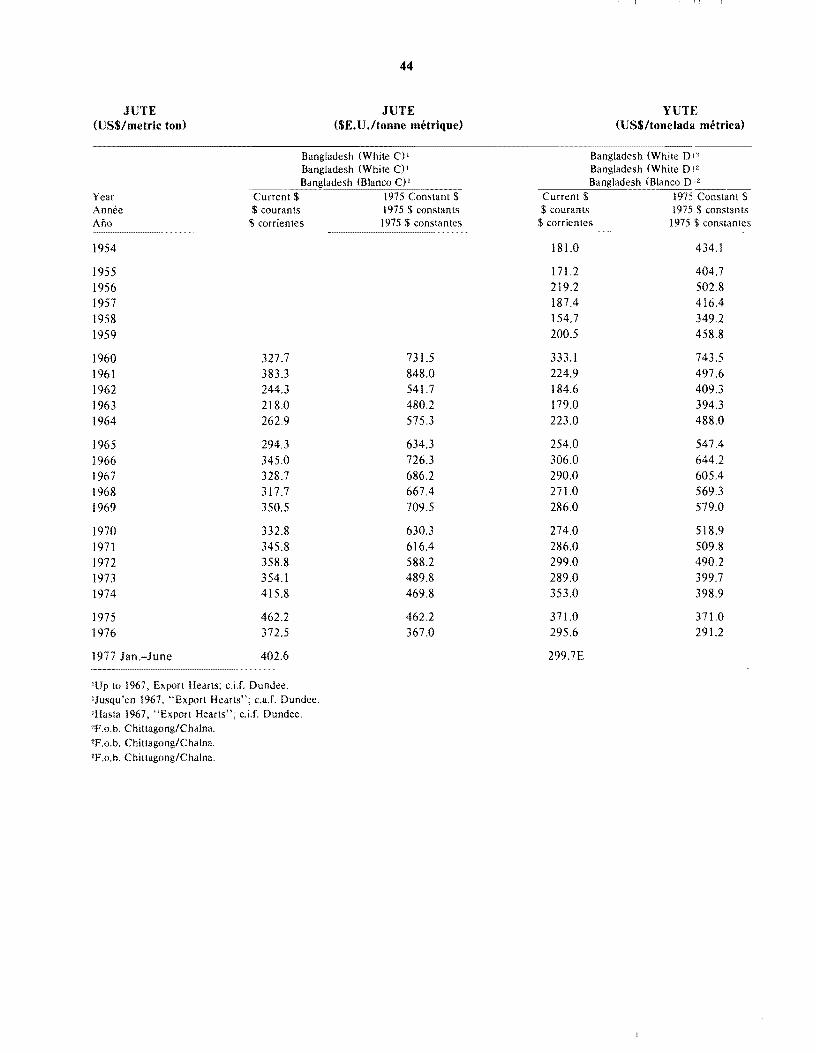
JUTE (US$/metric ton)
44
JUTE ($E. U .Itonne metrique)
Bangladesh (White C)l Bangladesh (White C) I
Year Annee Ano
1954
1955 1956 1957 1958 1959
1960 1961 1962 1963 1964
1965 1966 1967 1968 1969
1970 1971 1972 1973 1974
1975 1976
1977 Jan.-June
Current $ $ courants
$ corrientes
327.7 383.3 244.3 218.0 262.9
294.3 345.0 328.7 317.7 350.5
332.8 345.8 358.8 354.1 415.8
462.2 372.5
402.6
'Up to 1967, Export Hearts; c.iJ. Dundee. 'Jusqu'en 1967, "Export Hearts"; c.a.f. Dundee. IHasla 1967, "Export Hearts"; c.i.f. Dundee. 2F.o.b. Chittagong/Chalna. 2F.o.b. Chiltagong/Chalna.
2F.o.b. Chittagong/Chalna.
(Blanco C)l
1975 $ constantes
731.5 848.0 541.7 480.2 575.3
634.3 726.3 686.2 667.4 709.5
630.3 616.4 588.2 489.8 469.8
462.2 367.0
YUTE (US$/tonelada metrical
Bangladesh (White D I' Bangladesh (White D 12
Bangladesh (Blanco D Current $ 1975-C-o-ns--ta-n-t c-
$ courants 1975 $ constants $ corrienles 1975 $ constantes
.......................... -
181.0 434.1
171.2 404.7 219.2 502.8 187.4 416.4 154.7 349.2 200.5 458.8
333.1 743.5 224.9 497.6 184.6 409.3 179.0 394.3 223.0 488.0
254.0 547.4 306.0 644.2 290.0 605.4 271.0 569.3 286.0 579.0
274.0 518.9 286.0 509.8 299.0 490.2 289.0 399.7 353.0 398.9
371.0 371.0 295.6 291.2
299.7E
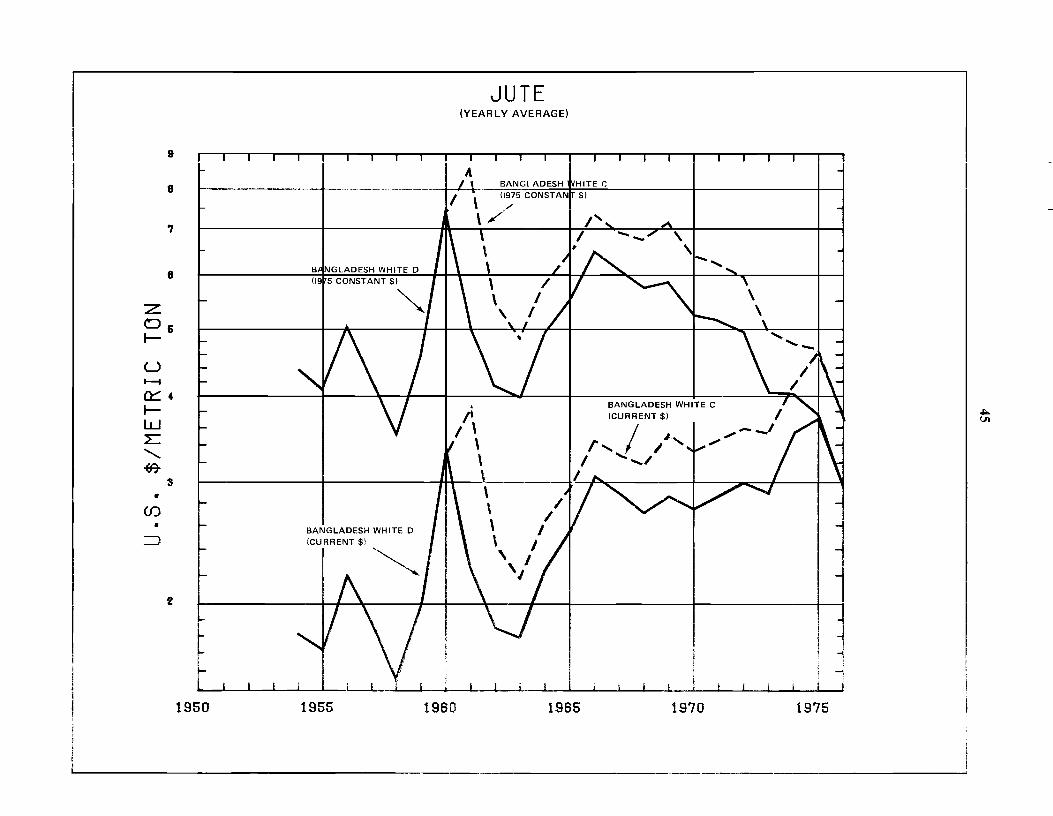
JUTE (YEARLY AVERAGE)
: t J~-' -~~"~-~--J .~ I, / , \ /'
?
8 B NGLADESH WHITE D (19 5 CONSTANT $)
Z ~ 0& I--
U
BANGLADESH WHITE C (CURRENT $)
i ...... I /'''I ',/
~
Q::: 4
I-W L: ........ ~
3 ~----------~~-----------HII+\--~---------4ll .~ ~ I ~ •
(f)
• BANGLADESH WHITE D =:J (CURRENT $)
2
I i . I . ! I .,
L 1 I f
1950 1955 1960 1965 1970 1975
"'" til
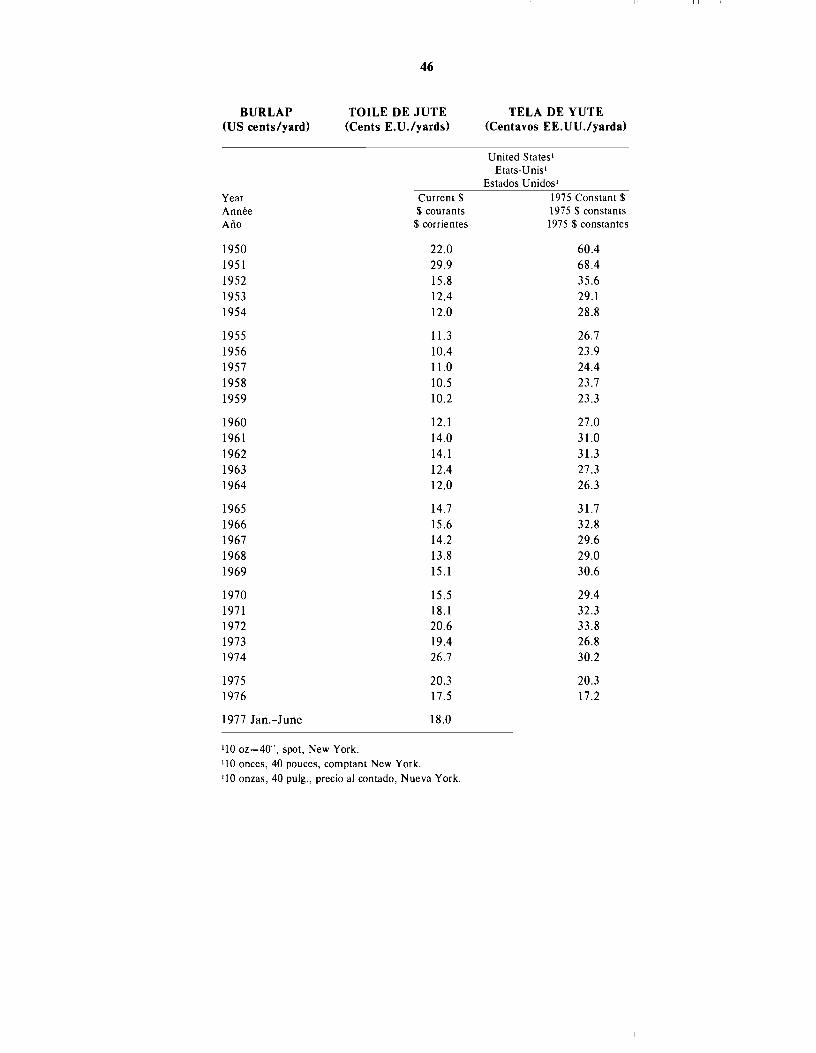
46
BURLAP TOILE DE JUTE TELA DE YUTE (US cents/yard) (Cents E. U ./yards) (Centavos EE.UU'/yarda)
United States l
Etats-U nisl Estados Unidos '
Year Current $ 1975 Constant $ Annee $ courants 1975 $ constants Ano $ corrie n tes 1975 $ constantes
1950 22.0 60.4 1951 29.9 68.4 1952 15.8 35.6 1953 12.4 29.1 1954 12.0 28.8
1955 11.3 26.7 1956 10.4 23.9 1957 11.0 24.4 1958 10.5 23.7 1959 10.2 23.3
1960 12.1 27.0 1961 14.0 31.0 1962 14.1 31.3 1963 12.4 27.3 1964 12.0 26.3
1965 14.7 31.7 1966 15.6 32.8 1967 14.2 29.6 1968 13.8 29.0 1969 15.1 30.6
1970 15.5 29.4 1971 18.1 32.3 1972 20.6 33.8 1973 19.4 26.8 1974 26.7 30.2
1975 20.3 20.3 1976 17.5 17.2
1977 Jan.-June 18.0
'10 oz-40", spot, New York. '10 onces, 40 pouces, comptant New York. '10 onzas, 40 pulg., precio al contado, Nueva York.
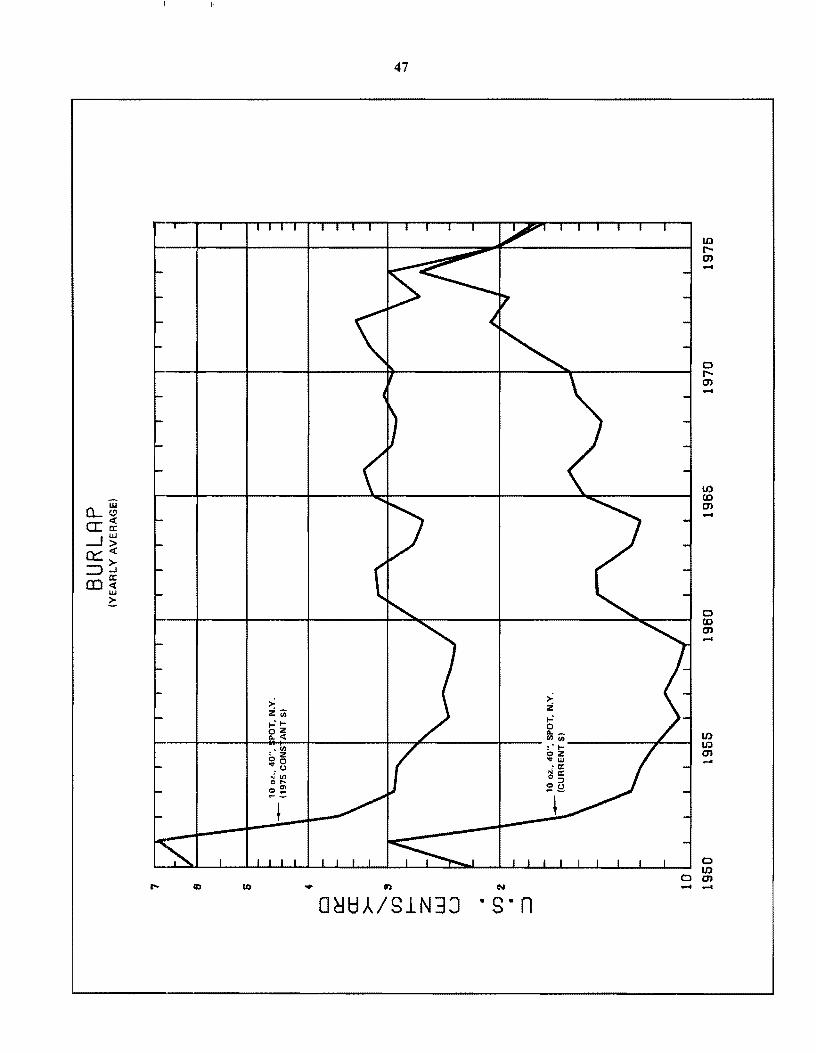
iii 0- CJ
a:: ~ a: ---1 w
> 0::: ~ > => ..J
(l) a: ~ w C
>= iii;
b'~ "-
"~ ~o
.CJ Nill 0 ....
~;
t
47
> i 1-' 0 "--(I)~
" I-~iii , a:
Na: 0:;,
~2.
O~H::JA/S1N3:J ·s-n
If.) r"m .....
o r"m .....
If.) (0 m .....
0 (0 m .....
If.) If.) m .....
o If.)
o m ........
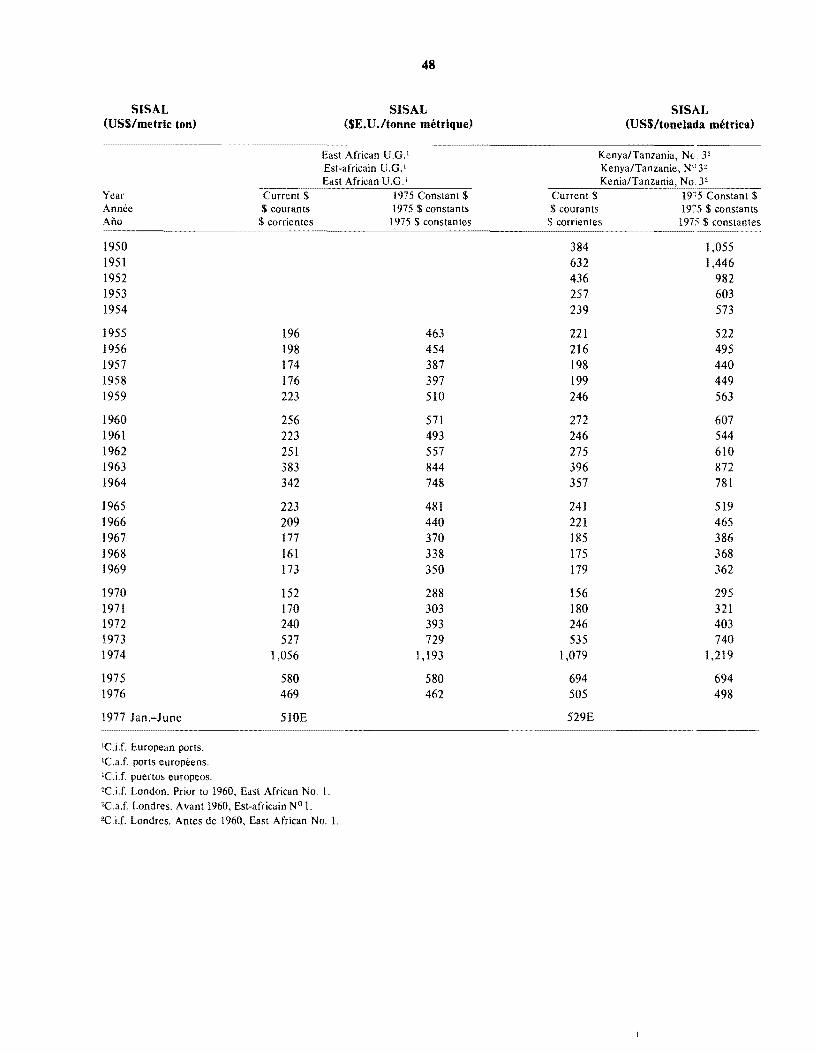
SISAL (USS/metric ton)
Year Annee Ano
1950 1951 1952 1953 1954
1955 1956 1957 1958 1959
1960 1961 1962 1963 1964
1965 1966 1967 1968 1969
1970 1971 1972 1973 1974
1975 1976
1977 Jan.-June
'C.iJ. European ports. 'C.aJ. ports europeens. 'C.i.f. puertos europeos.
48
SISAL (SE. U .Itonne metrique)
East African U.G.' Est-africain U.G.' East African U.GI
$ 1975 Constant $ courants
$ corrientes
196 198 174 176 223
256 223 251 383 342
223 209 177 161 173
152 170 240 527
1,056
580 469
5 WE
1975 $ constants 1975 $ constantes
463 454 387 397 510
571 493 557 844 748
481 440 370 338 350
288 303 393 729
1,193
580 462
2C.iJ. London. Prior to 1960, East African No. 1. 2C.aJ. Londres. Avant 1960, Est-africain N° 1. 2C.iJ. Londres. Antes de 1960, East African No. l.
SISAL (USS/tonelada metrica)
Kenya/Tanzania, Nc. 32
Kenya/Tanzanie, N° 32
Kenia/Tanzania, No 32
Current $ 19i~5 ~C~on~s~ta-n-t $=-
$ courants 1975 $ constants $ corrientes 1975 $ constantes
384 1,055 632 1,446 436 982 257 603 239 573
221 522 216 495 198 440 199 449 246 563
272 607 246 544 275 610 396 872 357 781
241 519 221 465 185 386 175 368 179 362
156 295 180 321 246 403 535 740
1,079 1,219
694 694 505 498
529E
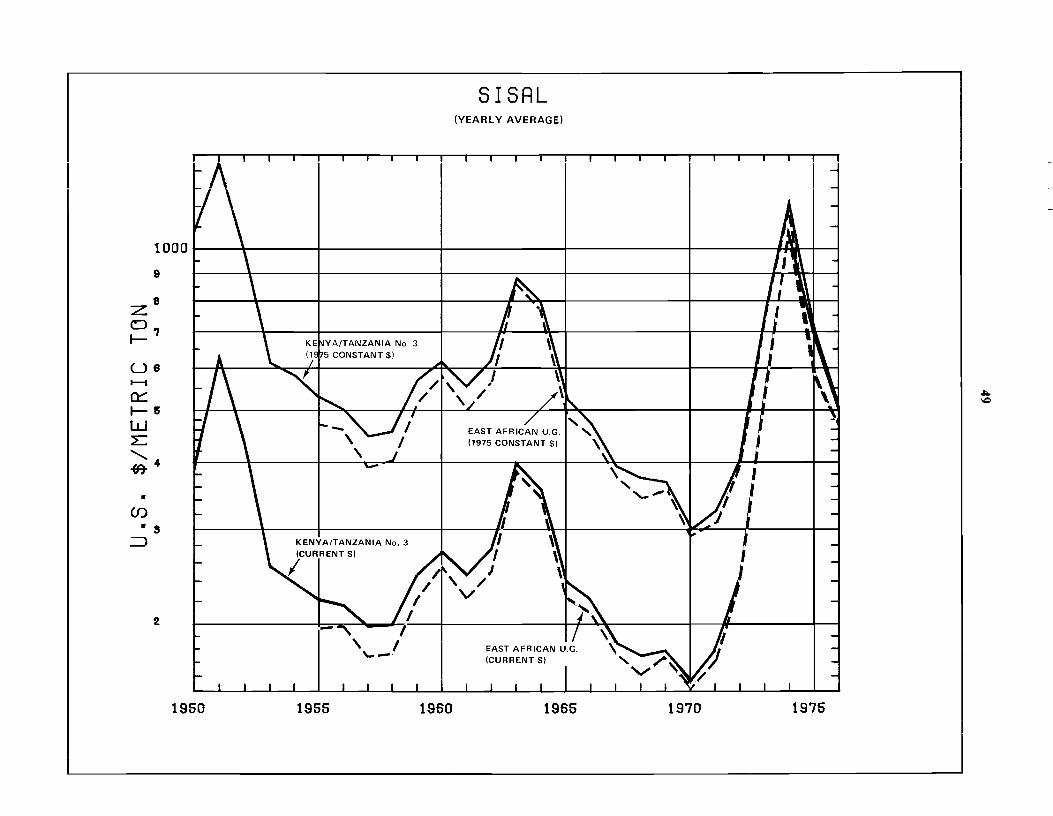
SISRL (YEARLY AVERAGE)
1000 I ,. lilA I
9
29
o 1-'
U8 I--t
a:::: 1-& W L:
" ~4 •
(f)
• S ~
2
1950
KENYA/TANZANIA No.3 (CURRENT $)
I
1955 1960 1965 1970 1975
~ I.e
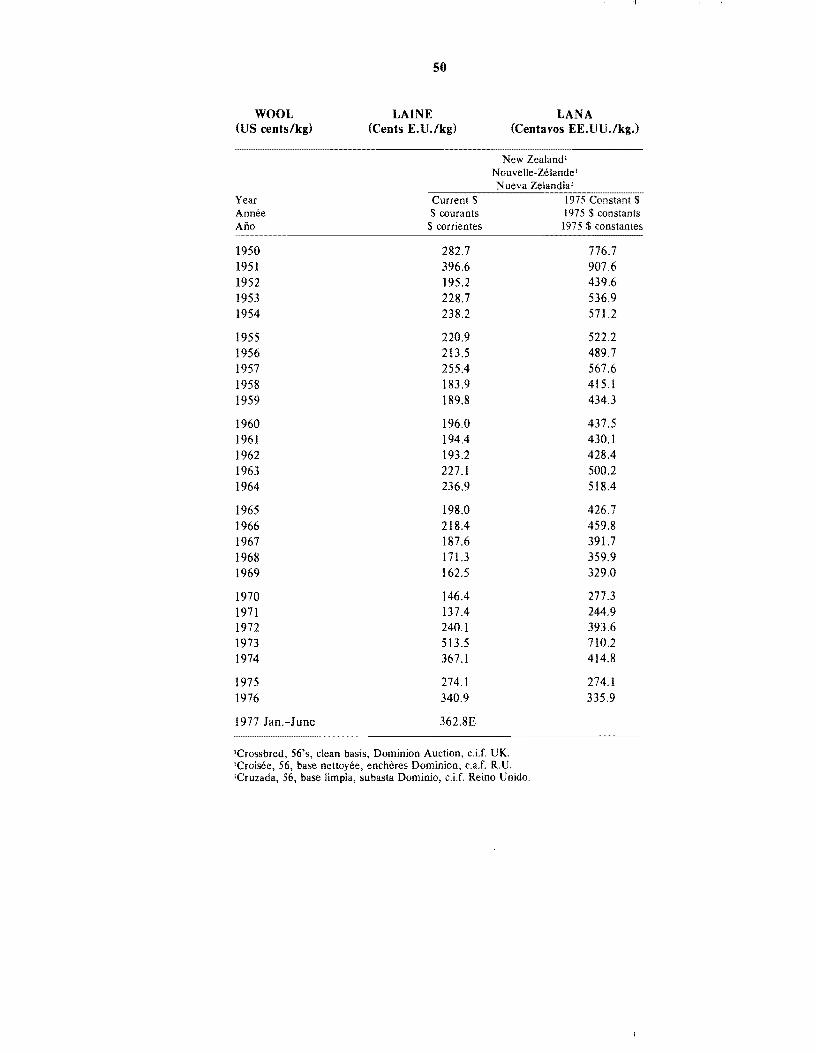
WOOL (US cents/kg)
Year Annee AilO
1950 1951 1952 1953 1954
1955 1956 1957 1958 1959
1960 1961 1962 1963 1964
1965 1966 1967 1968 1969
1970 1971 1972 1973 1974
1975 1976
1977 Jan.-J une
50
LAINE (Cents E.U.lkg)
Current $ courants
$ corrientes
282.7 396.6 195.2 228.7 238.2
220.9 213.5 255.4 183.9 189.8
196.0 194.4 193.2 227.1 236.9
198.0 218.4 187.6 171.3 162.5
146.4 137.4 240.1 513.5 367.1
274.1 340.9
362.8E
LANA (Centavos EE.UU.lkg.)
New Zealand l
Nouvelle-Ulande 1
Nueva Zelandia 1
1975 $ constants 1975 $ constantes
776.7 907.6 439.6 536.9 571.2
522.2 489.7 567.6 415.1 434.3
437.5 430.1 428.4 500.2 518.4
426.7 459.8 391.7 359.9 329.0
277.3 244.9 393.6 710.2 414.8
274.1 335.9
'Crossbred, 56's, clean basis, Dominion Auction, c.Lf UK. 'Croisee, 56, base nettoyee, enchCres Dominion, c.aJ. R.U. lCruzada, 56, base 1impia, subasta Dominio, c.Lf. Reino Unido.
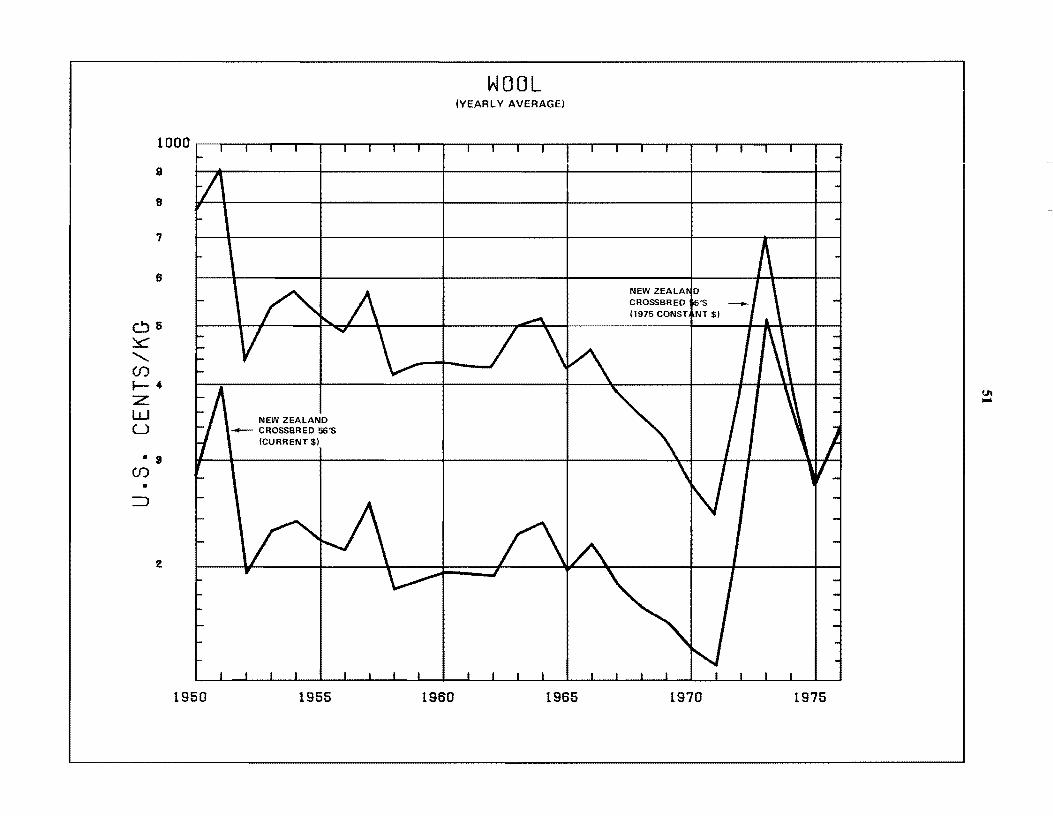
WOOL (VEARL V AVERAGE)
1000r~-.-r-r~-'-'-'-'-'IIr-r-.-.-.-.-.-.-.-~~~~--~~--. ~ 9 .
8
7
8
0 5
~
'(j) J-4 :z: W U
• 8 (j)
• =>
2
1950
NEW ZEALAND - CROSSBRED 56'S
(CURRENT $)
1955 1960 1965 1970 1975
U1 ....
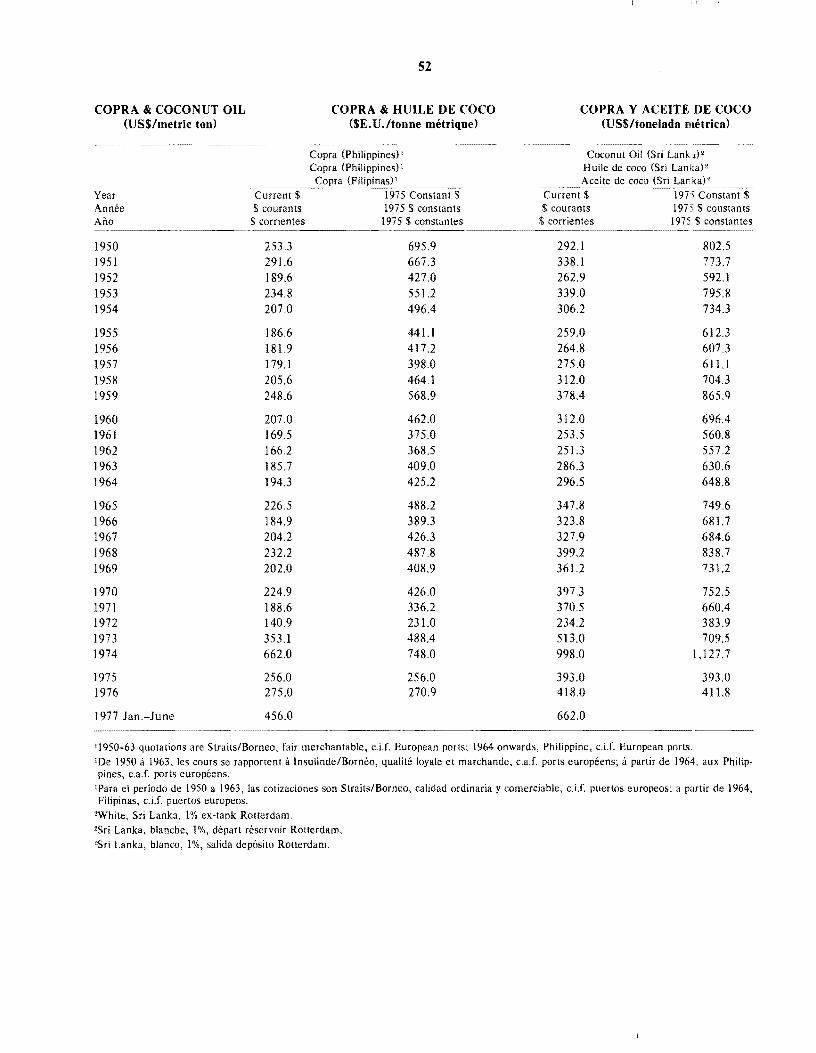
COPRA & COCONUT OIL (USS/metric ton)
52
COPRA & HUILE DE COCO (SE. U.ltonne metrique)
COPRA Y ACEITE DE COCO (USS/tonelada metrica)
---_ ...... _--_ ...... _---
Year Annee Ano
1950 1951 1952 1953 1954
1955 1956 1957 1958 1959
1960 1961 1962 1963 1964
1965 1966 1967 1968 1969
1970 1971 1972 1973 1974
1975 1976
1977 Jan.-June
$ courants $ corrientes
253.3 291.6 189.6 234.8 207.0
186.6 181.9 179.1 205.6 248.6
207.0 169.5 166.2 185.7 194.3
226.5 184.9 204.2 232.2 202.0
224.9 188.6 140.9 353.1 662.0
256.0 275.0
456.0 ..... ---~.-~-.....
Copra (Philippines) 1
Copra (Philippines) 1
695.9 667.3 427.0 551.2 496.4
441.1 417.2 398.0 464.1 568.9
462.0 375.0 368.5 409.0 425.2
488.2 389.3 426.3 487.8 408.9
426.0 336.2 231.0 488.4 748.0
256.0 270.9
Coconut Oil (Sri Lanb)' H uile de coco (Sri Lan kal 2
Aceite de coco (Sri Lar .k.cacc)~' ........ __ Current $ courants
$ corrientes
292.1 338.1 262.9 339.0 306.2
259.0 264.8 275.0 312.0 378.4
312.0 253.5 251.3 286.3 296.5
347.8 323.8 327.9 399.2 361.2
397.3 370.5 234.2 513.0 998.0
393.0 418.0
662.0
802.5 773.7 592.1 795.8 734.3
612.3 607.3 611.1 704.3 865.9
696.4 560.8 557.2 630.6 648.8
749.6 681.7 684.6 838.7 731.2
752.5 660.4 383.9 709.5
1,127.7
393.0 411.8
11950-63 quotations are Straits/Borneo, fair merchantable, c.i.f. European ports; 1964 onwards, Philippine, c.i.f. European ports. IDe 1950 a 1963, les cours se rapportent a Insulinde/Borneo, qualite loyale et marchande, c.a.f. ports europeens; it partir de 1964. aux Philippines, c.a.f. ports europeens.
IPara el periodo de 1950 a 1963, las cotizaciones son Straits/Borneo, calidad ordinaria y comerciable, c.iJ. puertos europeos; a partir de 1964, Filipinas, c.i.f. puertos europeos.
2White, Sri Lanka, 1% ex-tank Rotterdam. 'Sri Lanka, blanche, 1%, depart reservoir Rotterdam. 'Sri Lanka, blanco, 1%, salida deposito Rotterdam.
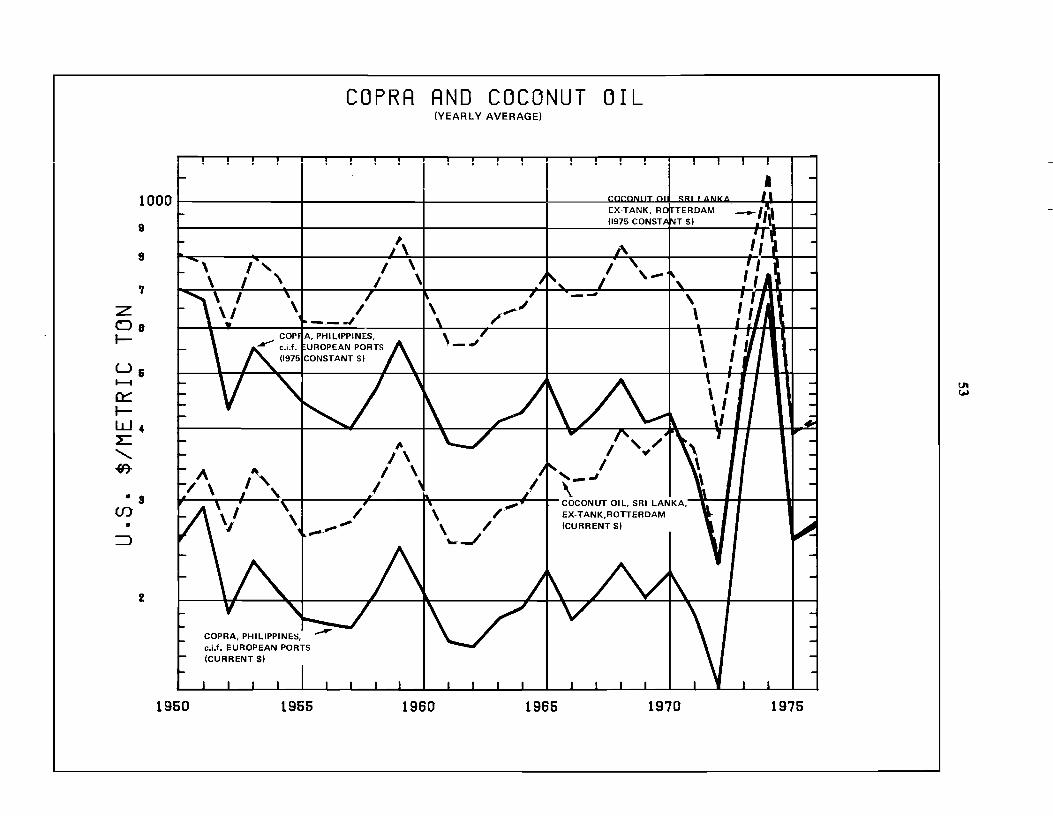
1000
9
9 I
\ I 7
Z De .........
U& 1--1
0:::: ......... W4 L: ""-~
• s (f)
• :::J
2
1950 1955
COPRA AND COCONUT OIL (YEARLY AVERAGE)
\ /~ \ / ~J
1960 1965
COCONUT OIL, SRI LANKA, EX-TANK,ROTTERDAM (CURRENT $1
1970
I
1975
til ~
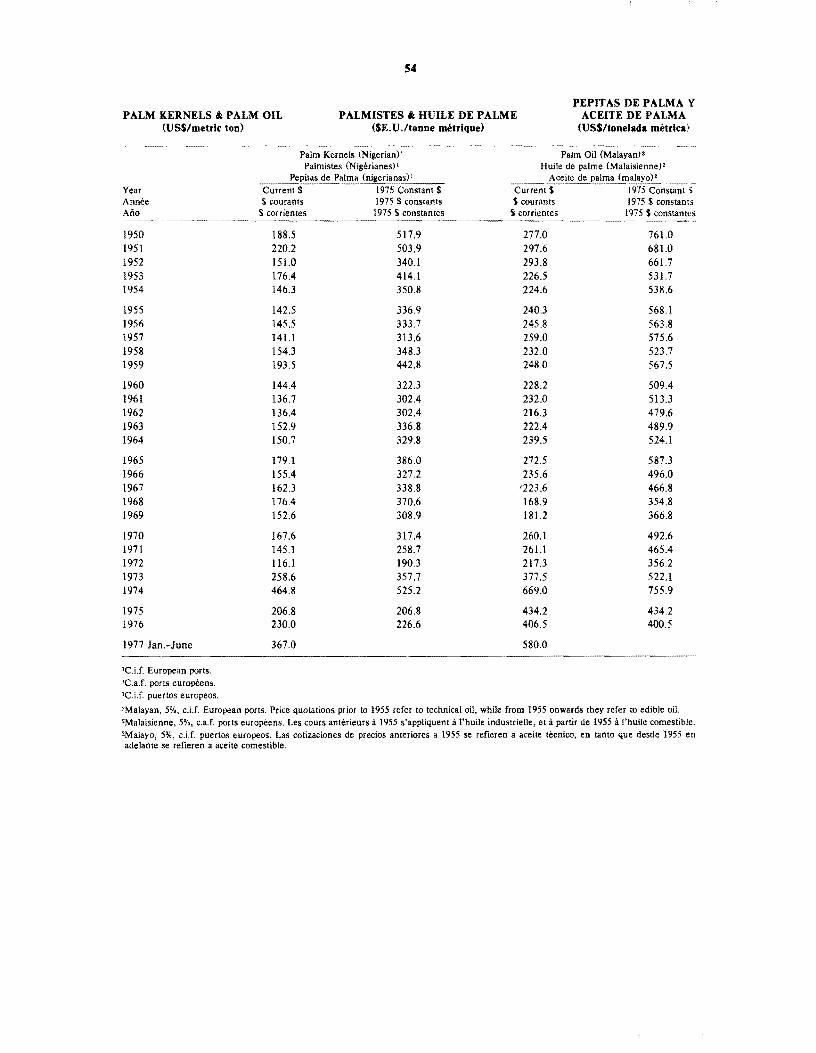
54
PALM KERNELS &. PALM OIL (US$/metric ton)
PALMISTES" RUILE DE PALME ($E. U .Ito nne metrique)
PEPITAS DE PALMA V ACEITE DE PALMA
(US$/tonelada metrical
Palm Kernels (Nigerian)' Palm Oil (Malayan» Palmistes (Nigerianes)i Huile de palme (Malaisienne)'
Pepitas de Palma (nigerianas)' Aceite de palma (malayo)' Year Current $ 1975 Constant $ Current $ 1975 Constant S Annee $ courants 1975 $ constants $ courants 1975 $ constant:, Ano $ corrientes 1975 $ constantes $ corrientes 1975 $ constantcs
1950 188.5 517.9 277.0 761.0 1951 220.2 503.9 297.6 681.0 1952 151.0 340.1 293.8 661.7 1953 176.4 414.1 226.5 531.7 1954 146.3 350.8 224.6 538.6
1955 142.5 336.9 240.3 568.1 1956 145.5 333.7 245.8 563.8 1957 141.1 313.6 259.0 575.6 1958 154.3 348.3 232.0 523.7 1959 193.5 442.8 248.0 567.5
1960 144.4 322.3 228.2 509.4 1961 136.7 302.4 232.0 513.3 1962 136.4 302.4 216.3 479.6 1963 152.9 336.8 222.4 489.9 1964 150.7 329.8 239.5 524.1
1965 179.1 386.0 272.5 587.3 1966 155.4 327.2 235.6 496.0 1967 162.3 338.8 '223.6 466.8 1968 176.4 370.6 168.9 354.8 1969 152.6 308.9 181.2 366.8
1970 167.6 317.4 260.1 492.6 1971 145.1 258.7 261.1 465.4 1972 116.1 190.3 217.3 356.2 1973 258.6 357.7 377.5 522.1 1974 464.8 525.2 669.0 755.9
1975 206.8 206.8 434.2 434.2 1976 230.0 226.6 406.5 400.5
1977 Jan.-June 367.0 580.0
'C.i.f. European ports. 'c.aJ. ports europi!ens. 'C.i.f. puertos europeos.
'Malayan, 5%, c.Lf. European ports. Price quotations prior to 1955 refer to technical oil, while from 1955 onwards they refer to edible oiL 'Malaisienne, 5%, c.a.f. ports europeens. Les cours anterieurs i 1955 s'appliquent i l'huile industrieIle, et i partir de 1955 a I'huile comestible. 'Malaya, 5%, c.iJ. puertos europeos. Las cotizaciones de precios anteriores a 1955 se refieren a aceite tecnico, en tanto que desde '1955 en adelante se refieren a aceite comestible,
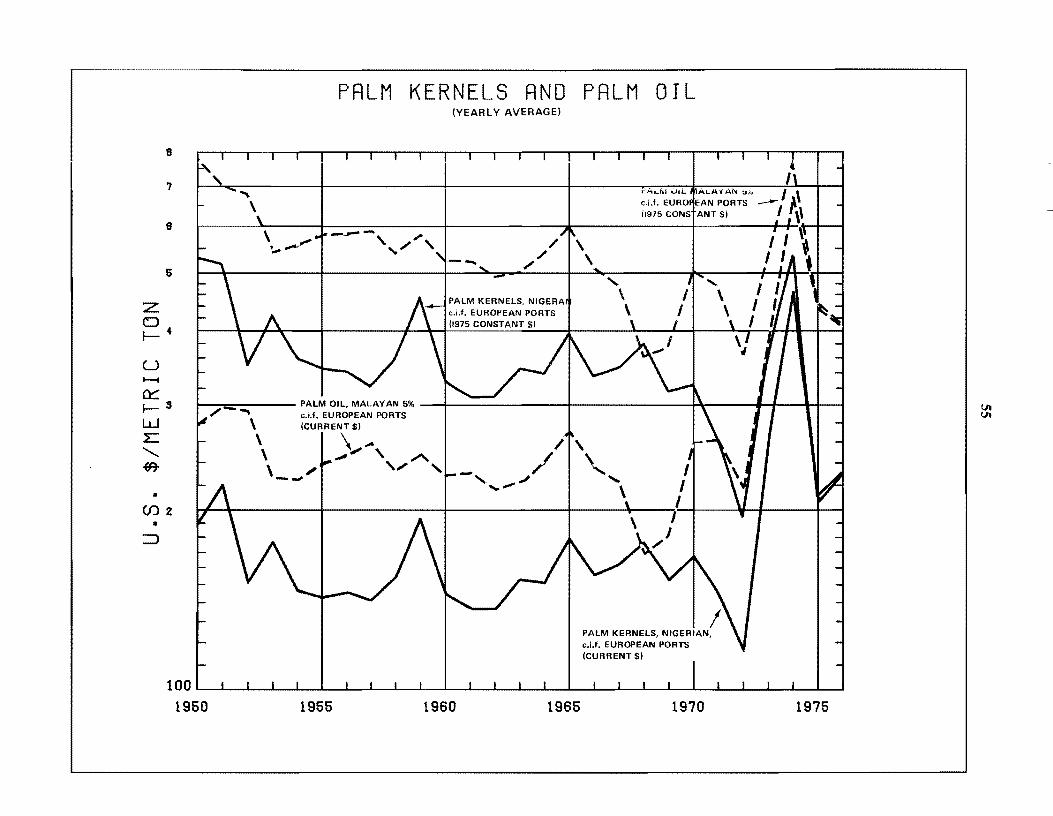
8
7
8
5
z o 1-4
U ....... a:::: 1- 3
W :.E "~
• (J) 2
• :::::>
PALM KERNELS AND PALM OIL
" \
(YEARLY AVERAGE)
/ /
,/
PALM KERNELS, NIGERA c.Lf. EUROPEAN PORTS (1975 CONSTANT $1
\ \
~,:. ... i", ..:.o,L fALAYAN a7a I \ c.i.f. EURO EAN PORTS -, ~ (1975 CONS ANT $1 _ \\
1---.=----- PALM OIL. MALAYAN 5% 1\ • I I I ,/- ~ c.i.f. EUROPEAN PORTS
\ (CURRENT $)
\ I )".-., A \"r ,,,, --/
-, ,,/ .... ""-
PALM KERNELS. NIGERIAN, c.i.f. EUROPEAN PORTS (CURRENT $)
100~1~ __ ~~~~ __ ~~~~ __ ~~~~ __ ~~~~ __ ~~~~ __ ~~~~~
1950 1955 1960 1965 1970 1975
Ul Ul
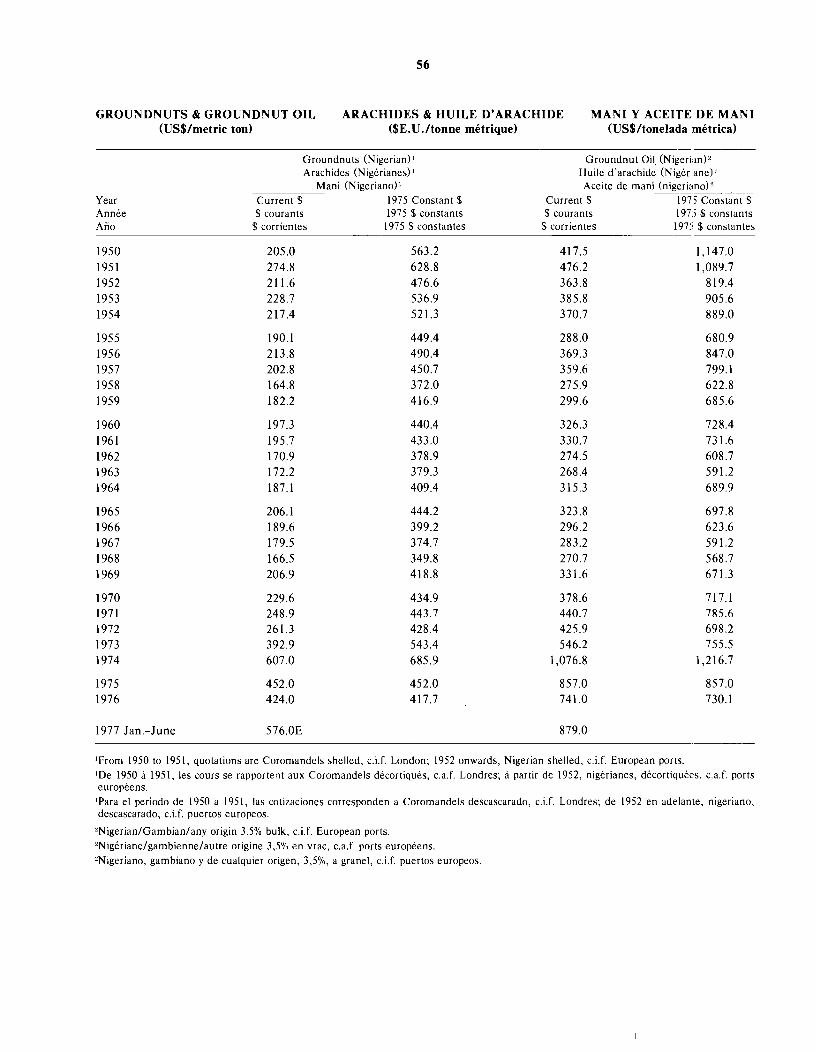
56
GROUND NUTS & GROUND NUT OIL (US$/metric ton)
ARACHIDES & HUILE D' ARACHIDE ($E. U ./tonne metrique)
MANI Y ACEITE DE MAN I (US$/tonelada metrical
~-----
Groundnuts (Nigerian) I Groundnut Oil. (Nigerian)2 Arachides (Nigerianes) I Huile d'arachide (Niger ane) 2
Mani (Nigeriano) I Aceite de mani (nigeriano)'
Year Current $ 1975 Constant $ Current $ 1975 Constant $ Annee $ courants 1975 $ constants $ courants 197:; $ constants Ario $ corrien tes 1975 $ constantes $ corrientes 197:; $ constantes
~--~-
1950 205.0 563.2 417.5 1,147.0 1951 274.8 628.8 476.2 1,089.7 1952 211.6 476.6 363.8 819.4 1953 228.7 536.9 385.8 905.6 1954 217.4 521.3 370.7 889.0
1955 190.1 449.4 288.0 680.9 1956 213.8 490.4 369.3 847.0 1957 202.8 450.7 359.6 799.1 1958 164.8 372.0 275.9 622.8 1959 182.2 416.9 299.6 685.6
1960 197.3 440.4 326.3 728.4 1961 195.7 433.0 330.7 731.6 1962 170.9 378.9 274.5 608.7 1963 172.2 379.3 268.4 591.2 1964 187.1 409.4 315.3 689.9
1965 206.1 444.2 323.8 697.8 1966 189.6 399.2 296.2 623.6 1967 179.5 374.7 283.2 591.2 1968 166.5 349.8 270.7 568.7 1969 206.9 418.8 331.6 671.3
1970 229.6 434.9 378.6 717.1 1971 248.9 443.7 440.7 785.6 1972 261.3 428.4 425.9 698.2 1973 392.9 543.4 546.2 755.5 1974 607.0 685.9 1,076.8 1,216.7
1975 452.0 452.0 857.0 857.0 1976 424.0 417.7 741.0 730.1
1977 Jan.-June 576.0E 879.0
IFrom 1950 to 1951, quotations are Coromandels shelled, c.i.r. London; 1952 onwards, Nigerian shelled, c.i.r. European ports.
IDe 1950 Ii 1951, les caurs se rapportent aux Coromandels decartiques, c.a.f. Londres; Ii partir de 1952, nigerianes, decortiquees, c.a.r. ports europeens.
IPara el periodo de 1950 a 1951, las cotizaciones corresponden a Coromandels descascarado, c.i.f. Londres; de 1952 en adelante, nigeriano, descascarado, c.i.r. puertos europeos.
'Nigerian/Gambian/any origin 3.5% bulk, c.i.f. European ports.
'Nigeriane/gambienne/autre origine 3,5% en vrac, c.a.f. ports europeens.
'Nigeriano, gambiano y de cualquier origen, 3,5%, a granei, c.i.f. puertos europeos.
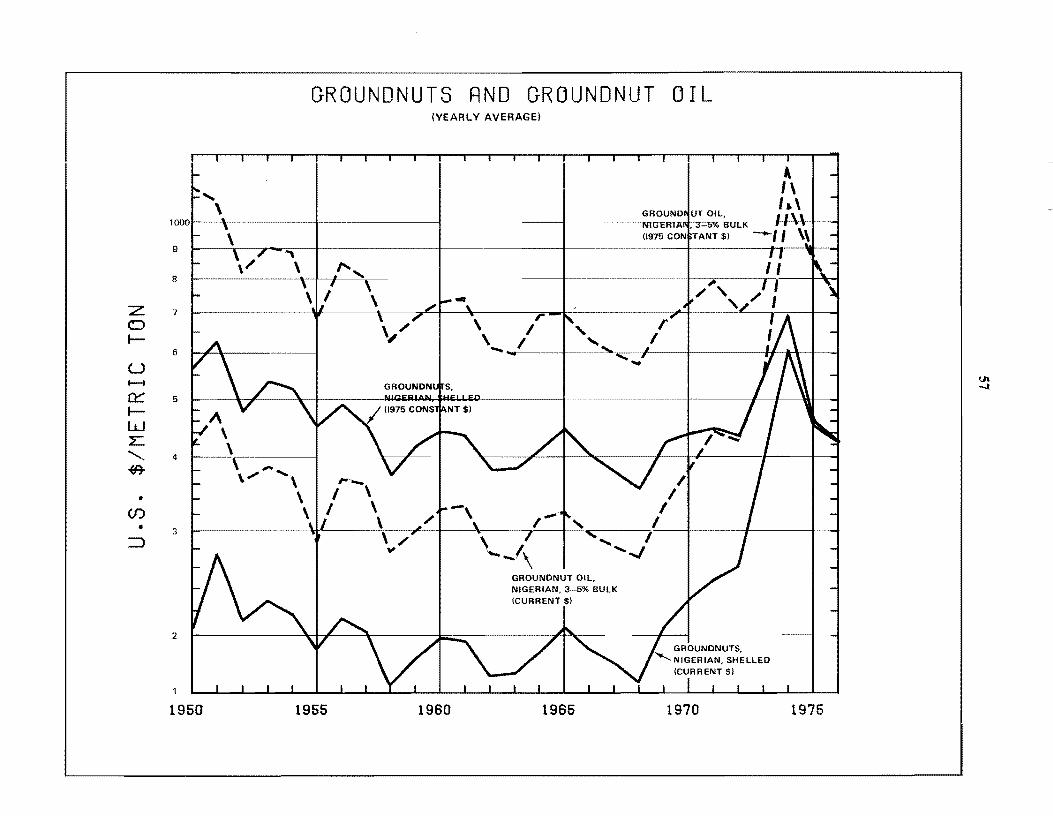
z (:)
I-
u 1--1
a:::: IW L.
" ~ •
(f)
• :::::>
4
3
2
1950
GROUNDNUTS RND GROUNDNUT OIL (YEARLY AVERAGE)
A 1\ 1.\
\~/ \...~/ I ', .... ~ / I I'D. I j ...
\ ......... '\ ,..-- "" I \ I \ I
I \ - . I \ \ / \ ,- " I ~nn7 " I
\,/ \"'_1\ "..J
1955 1960
GROUNDNUT OIL, NIGERIAN, 3-5% BULK (CURRENT $1
1965 1970 1975
til ....
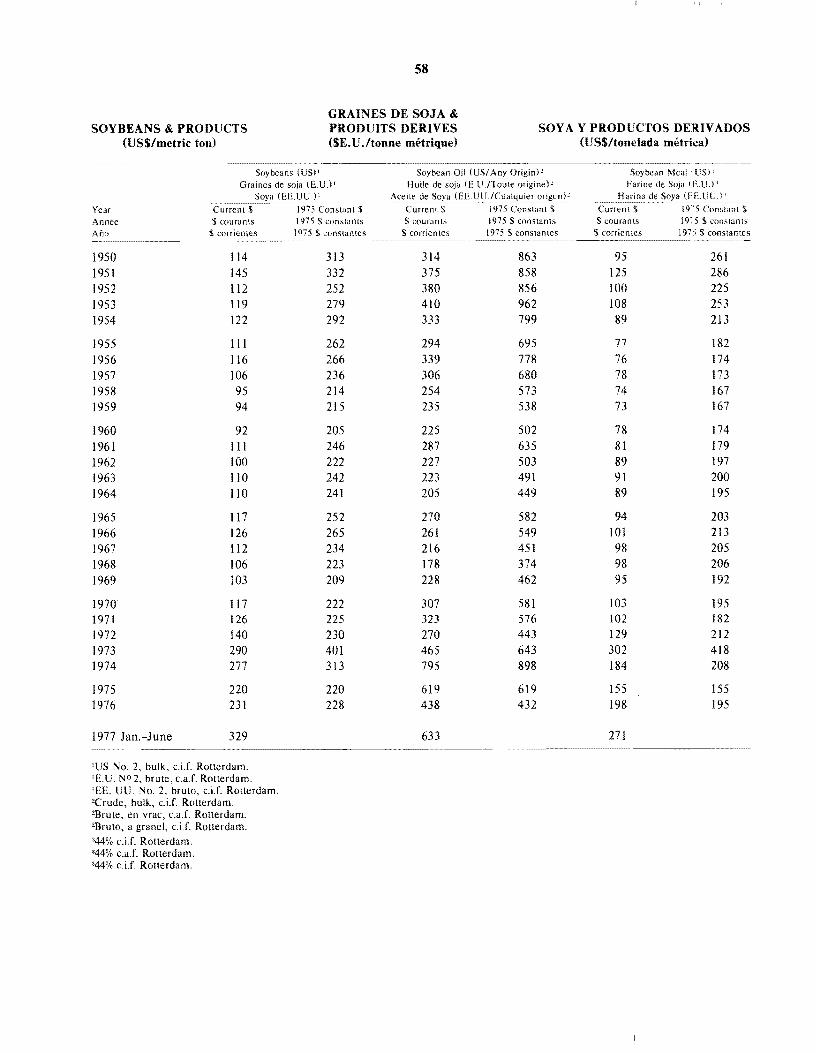
SOYBEANS & PRODUCTS (US$/metric ton)
Year Currenl Annee $ courants
58
GRAINES DE SOJA & PRODUITS DERIVES ($E.U./tonne metrique)
SOY A Y PRODUCTOS DERIVADOS (US$/tonelada metrical
Soybean Oil (US! Any Origin)' Huile de soja (E.U.lToute originel'
Aceite d~~oya (EE.UU.!Cualquier origcnl'
Soybean Meal' US), Farine de Soja (/:.U') I
__ .!:Iarina~eSoya (EE.UU.l~' _ Current $ 1975 Constant S Current $ 19"5 Constant $
1975 $ constants $ courants 1975 $ constants $ courants 19"5 $ constants
_~ __________ ........... ~_~ .......... 1 ... 9 ... 7_5_$_c_on_s_ta_nt_es ___ $_co_r_rie_·n_te_s_ .......... ~_1_9_75~ .. $._c_o_ns_la_n_le_s_~_$c ... o .... r ... r .. i .. e .... n_te_s~~_197~()I1_sta_nt:: Ana $ corricnlcs
1950 114 1951 145 1952 112 1953 119 1954 122
1955 111 1956 116 1957 106 1958 95 1959 94
1960 92 1961 III 1962 100 1963 110 1964 1I0
1965 II7 1966 126 1967 Il2 1968 106 1969 103
1970 II7 1971 126 1972 140 1973 290 1974 277
1975 220 1976 231
1977 Jan,-June 329
313 332 252 279 292
262 266 236 214 215
205 246 222 242 241
252 265 234 223 209
222 225 230 401 313
220 228
314 375 380 410 333
294 339 306 254 235
225 287 227 223 205
270 261 216 178 228
307 323 270 465 795
619 438
633 -~~- .. --'" .-~~~~~~----...... --.. .
'us No.2, bulk, c,i.f. Rotterdam. 'E.V. NO 2, brute, c.aJ. Rotterdam. 'EE. UU. No.2, bruto, c.Lf. Rotterdam. "Crude, bulk, c.i.f. Rotterdam. "Brute, en vrac, c.aJ. Rotterdam. ZBruto, a granel, c.i.f. Rotterdam. "44% c.iJ, Rotterdam. ;144% c.aJ. Rotterdam. "44% c.iJ. ROllerdam.
863 858 856 962 799
695 778 680 573 538
502 635 503 491 449
582 549 451 374 462
581 576 443 643 898
619 432
95 125 100 108 89
77 76 78 74 73
78 81 89 91 89
94 101 98 98 95
103 102 129 302 184
155 198
271
261 286 225 253 213
182 174 173 167 167
174 179 197 200 195
203 213 205 206 192
195 182 212 418 208
155 195
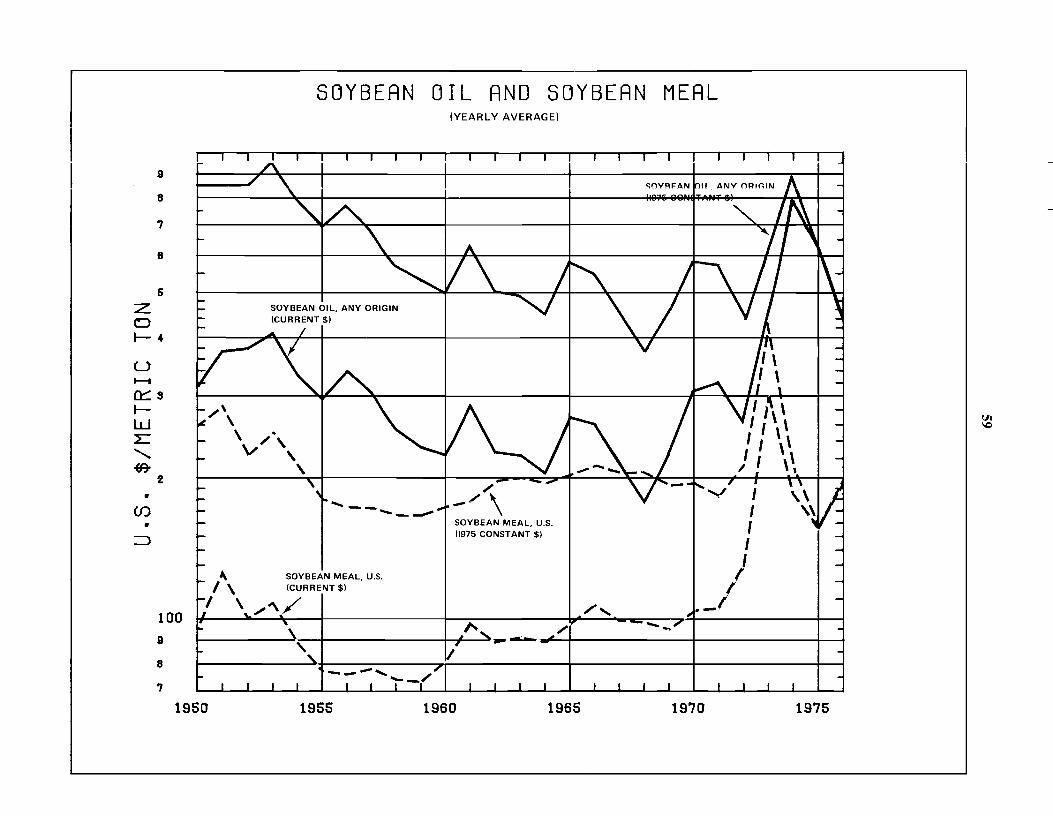
9
8
7
8
5
:z o I-- 4
u ~
0::::: s I-W L
" .(It
• (f)
• :::J
2
SOYBEAN OIL AND SOYBEAN MEAL
/\ \ .
\ / '\ V '\
'\
" SOYBEAN MEAL, U.S. I \ (CURRENT $)
(YEARLY AVERAGE)
SOYBEAN MEAL, U.S. 11975 CONSTANT $)
I I I I
100 9
I \ /"\/ /, _/
--,~-t----------------~~~ , / " _ .-.-. -w,.,'--r---------------+----------------Lj 8 ---'-_/ 7
1950 1955 1960 1965 1970 1975
\II IC
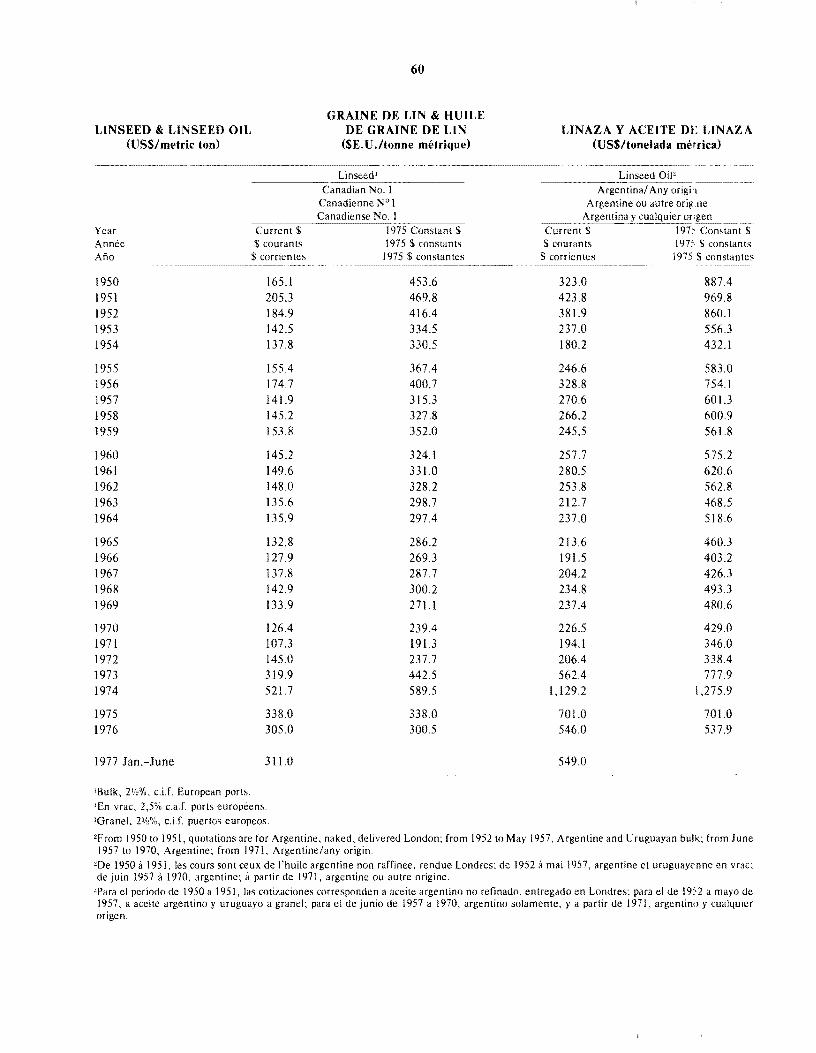
LINSEED & LINSEED OIL (US$/metric ton)
60
GRAINE DE LIN & HUILE DE GRAINE DE LIN
($E. U ./tonne metrique)
Linseed' ~~~~-:--.--~ ......... ~~--
Canadian No.1 Canadienne N° 1 Canadiense No.1
Year Annee Ano
Current $ 1975 Constant $
1950 1951 1952 1953 1954
1955 1956 1957 1958 1959
1960 1961 1962 1963 1964
1965 1966 1967 1968 1969
1970 1971 1972 1973 1974
1975 1976
1977 lan.-lune
'Bulk, 2'12%, d.L European ports.
$ courants $ corrientes ..... ___ ~_"_O_~ ___ ~_
165.1 205.3 184.9 142.5 137.8
155.4 174.7 141.9 145.2 153.8
145.2 149.6 148.0 135.6 135.9
132.8 127.9 137.8 142.9 133.9
126.4 107.3 145.0 319.9 521.7
338.0 305.0
311.0
'En vrac, 2,5% c.aJ. ports europeens.
'Oranel, 2'12%, c.iJ. puertos europeos.
1975 $ constants 1975 $ constantes
............ ~---
453.6 469.8 416.4 334.5 330.5
367.4 400.7 315.3 327.8 352.0
324.1 331.0 328.2 298.7 297.4
286.2 269.3 287.7 300.2 271.1
239.4 191.3 237.7 442.5 589.5
338.0 300.5
LINAZA Y ACEITE m: LINAZA (US$/tonelada metrical
Linseed Oi12 Argentina! Any origh
Argentine ou autre origne i\rgentina y_~ualquier oflgen ~_. __
Current $ 197:' Com.tant $ $ courants 197:: $ constants
$ corrientes 1975 $ constantes ... _ ..... _--_._._--
323.0 887.4 423.8 969.8 381.9 860.1 237.0 556.3 180.2 432.1
246.6 583.0 328.8 754.1 270.6 601.3 266.2 600.9 245.5 561.8
257.7 575.2 280.5 620.6 253.8 562.8 212.7 468.5 237.0 518.6
213.6 460.3 191.5 403.2 204.2 426.3 234.8 493.3 237.4 480.6
226.5 429.0 194.1 346.0 206.4 338.4 562.4 777.9
1,129.2 l,275.9
701.0 701.0 546.0 537.9
549.0
"From 1950 to 1951, quotations are for Argentine. naked, delivered London; from 1952 to May 1957, Argentine and Uruguayan bulk; from June 1957 to 1970, Argentine; from 1971. Argentine/any origin.
"De 1950 it 1951. les cours sont ceux de I'huile argentine non rarrinee, rendue Londres; de 1952 a mai 1957, argentine et uruguaycnne en vrac; de juin 1957 it 1970, argentine; a partir de 1971, argentine ou autre origine.
2Para el periodo de 1950 a 1951, las cotizaciones corresponden a aceite argentino no refinado, entregado en Londres; para el de 1952 a mayo de 1957, a aceite argentino y uruguayo a granel; para el de junio de 1957 a 1970, argentino solamente, y a partir de 1971, argentino y cualquier origen.
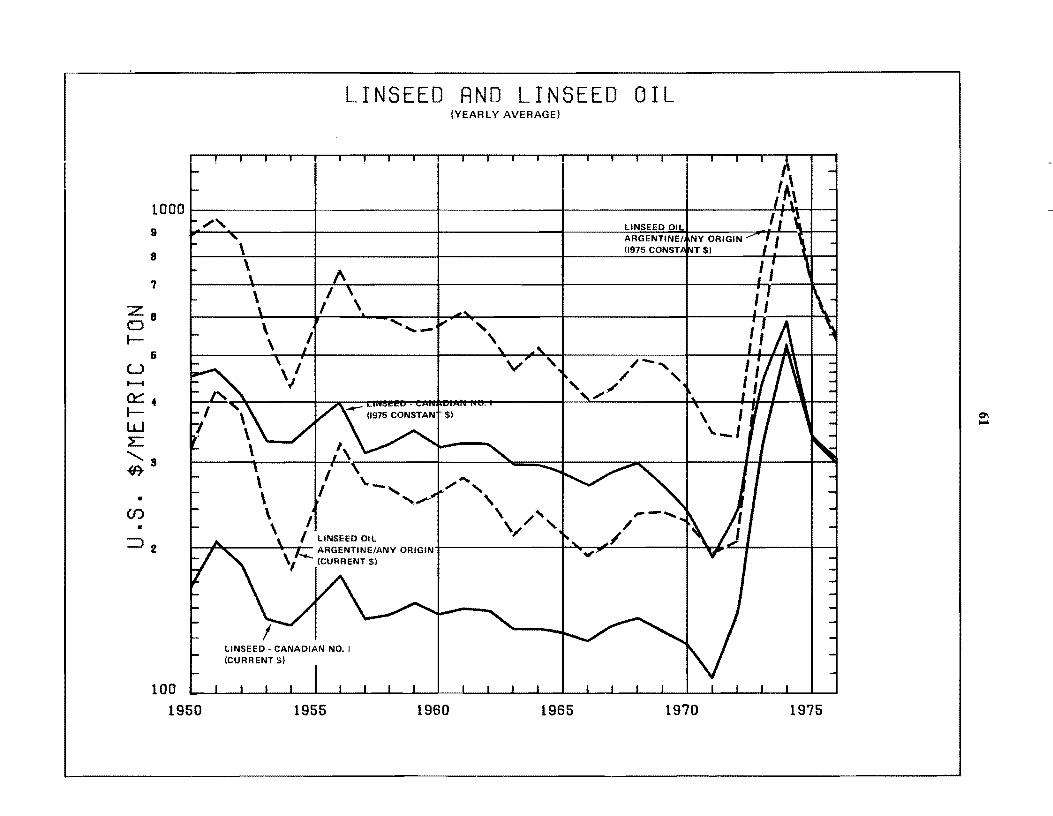
INSEED AND LINSEED OIL (YEARLY AVERAGE)
-,- ,- , -------,- II ----T----. •
1000~1----------_4------------r_
9
8
'1
28 D r-
6 U ....... 0::::. rw L
'8 .fit
• (J)
•
\ \
\ I I ,
I ',- ,
'\
LINSEED OIL
v 'I 1-" (1975 CONSTANT $)
..... ",. "
\ /", \/
/ , , / ",.
=>2 I LINSEED OIL I"'""" I V C I L ~ 'J ARGENTINE/ANY ORIGIN I • 'WI''' " ........ (CURRENT $)
100 1950 1955 1960 1965 1970
I'. I,.' ,\
1975
0"1 ...
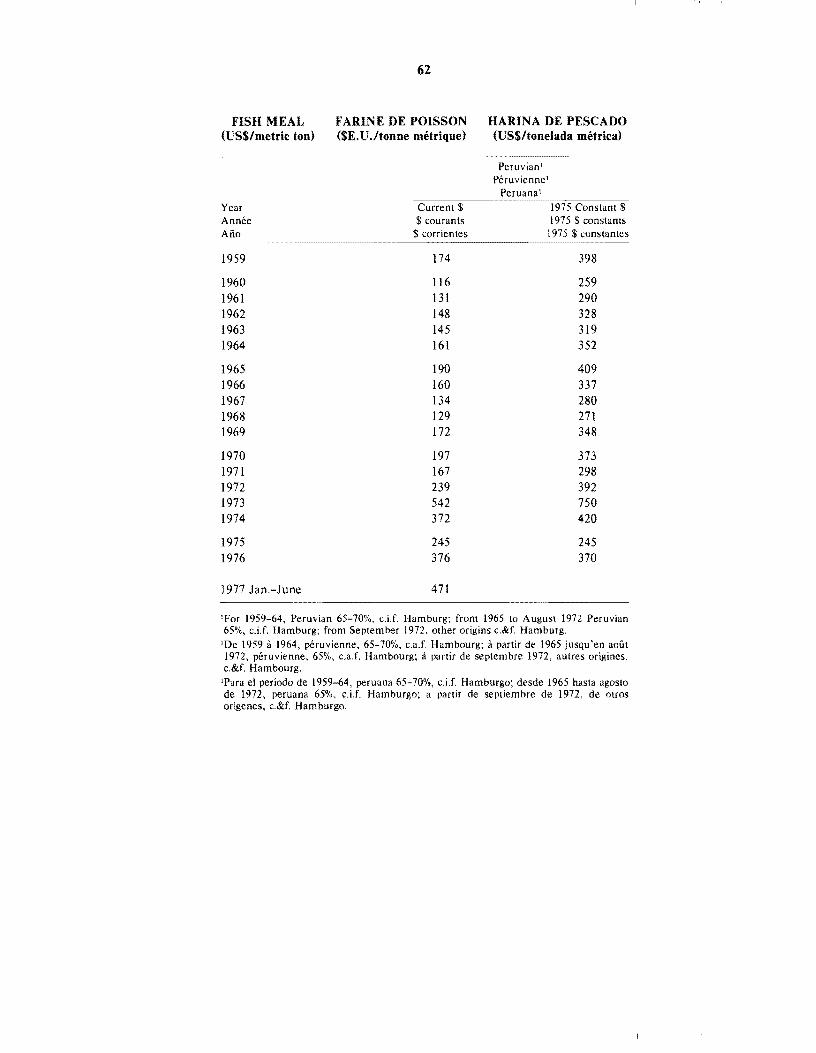
62
FISH MEAL FARINE DE POISSON HARINA DE PESCADO (US$/metric ton) ($E.U.ltonne met rique) (US$/tonelada metrical
Peruvian! Peruvienne'
Peruana l
Year Current Annee $ courants ArlO $ corrientes 1975 $ constantes
1959 174 398
1960 116 259 1961 131 290 1962 148 328 1963 145 319 1964 161 352
1965 190 409 1966 160 337 1967 134 280 1968 129 271 1969 172 348
1970 197 373 1971 167 298 1972 239 392 1973 542 750 1974 372 420
1975 245 245 1976 376 370
1977 Jan.-June 471
'For 1959-64, Peruvian 65-70%, c.i.f. Hamburg; from 1965 to August 1972 Peruvian 65%, c.Lf. Hamburg; from September 1972, other origins c.&f. Hamburg. IDe 1959 II 1964, peruvienne, 65-70%, c.a.f. Hambourg; it partir de 1965 jusqu'en aotit 1972, peruvienne, 65%, c.a.f. Hambourg; a partir de septembre 1972, autres origines, c.&f. Hambourg.
!Para el periodo de 1959-64, peruana 65-70%, c.i.f. Hamburgo; desde 1965 hasta agosto de 1972, peruana 65%, c.i.f. Hamburgo; a partir de septiembre de 1972, de otros origenes, c.&f. Hamburgo.
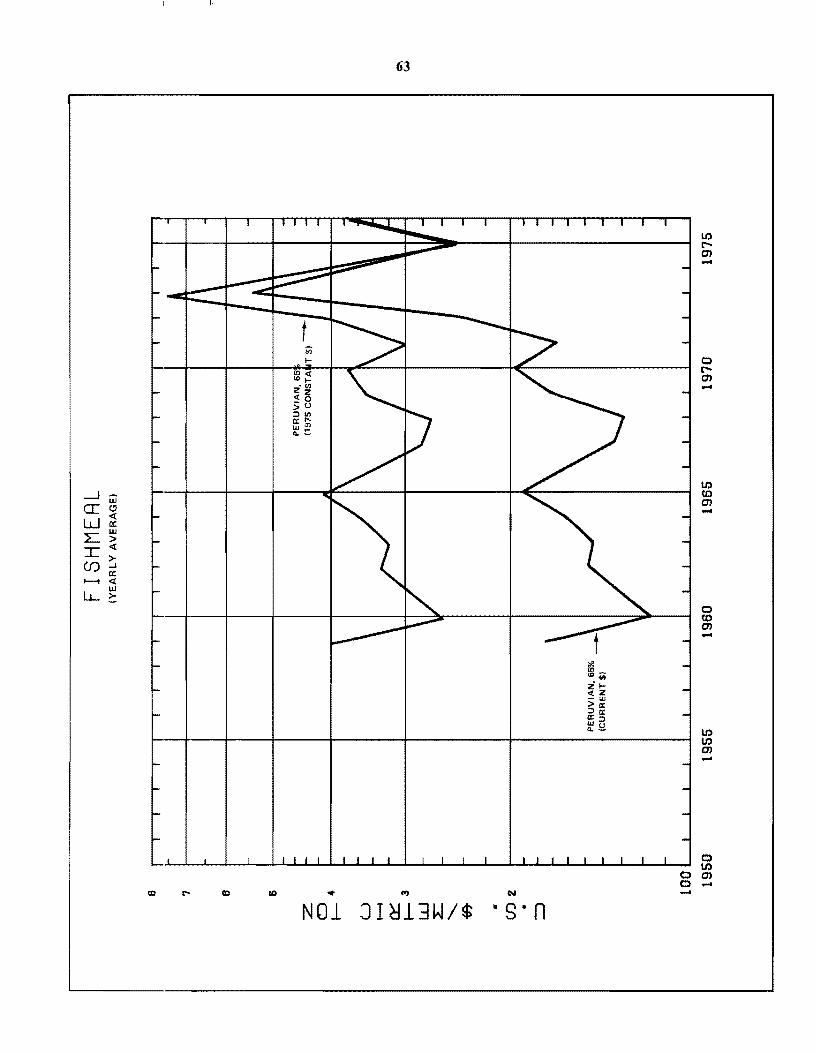
63
t i4 r-
Ul<C <Dr--.., Zz <Co .>u ::;!Ul 0:'" w'" 0.=
---i iiJ a: c:;J «
W 0:
L: UJ >
I « >
(f) ..I 0:
I--t « LL
UJ >
NOl JItl13W/$
&!i "'iii z'r-«z -w >IX ::;!o: IX::;! wu 0.._
N
·s-n
It) r-(1) -
0 r--(1) .....
It) (0 (1) -
0 (0 (1) -
It) It) (1) -
o It)
o (1)
o --
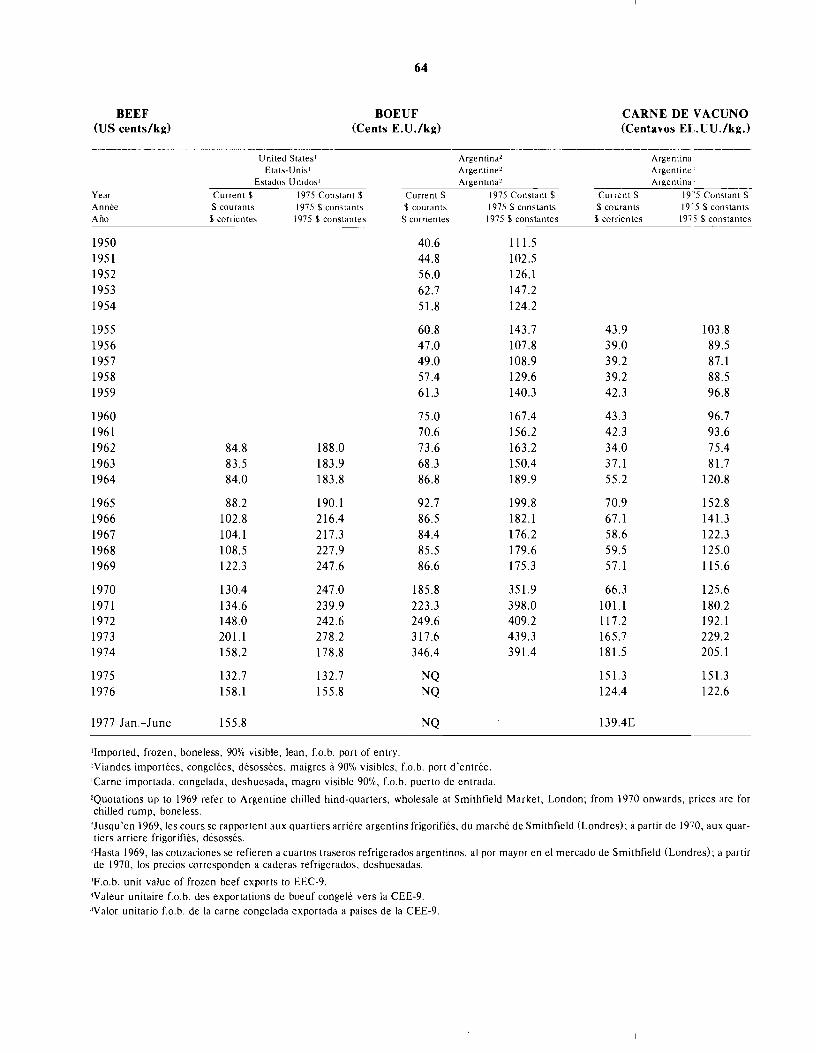
BEEF (US cents/kg)
Year Annee Ai'io
1950 1951 1952 1953 1954
1955 1956 1957 1958 1959
1960 1961 1962 1963 1964
1965 1966 1967 1968 1969
1970 1971 1972 1973 1974
1975 1976
1977 Jan.-June
64
BOEUF (Cents E.U.lkg)
United States l
Etats-Unis ' Estados Unidos l
Current $ 1975 Constant $ Current $ $ courants 1975 $ constants $ courants
$ corrientes 1975 $ constantes $ corrientes
40,6 44,8 56.0 62.7 51.8
60,8 47,0 49.0 57.4 61.3
75.0 70,6
84,8 188.0 73.6 83.5 183,9 68.3 84.0 183.8 86.8
88.2 190.1 92.7 102.8 2l6.4 86.5 104.1 217.3 84.4 108,5 227.9 85.5 122.3 247.6 86.6
130.4 247.0 185.8 134.6 239.9 223.3 148.0 242.6 249.6 201.1 278.2 317.6 158.2 178.8 346.4
132.7 132.7 NQ 158.1 155.8 NQ
155.8 NQ
IImported, frozen, boneless, 90% visible, lean, LO.b. port of entry.
Argentina2
Argentine' Argentina'
1975 Constant $ 1975 $ constants 1975 $ const"ntes
111.5 102.5 126,1 147.2 124.2
143.7 107.8 108.9 129.6 140.3
167.4 156.2 163.2 150.4 189.9
199.8 182.1 176.2 179.6 175.3
351.9 398.0 409.2 439.3 39l.4
IViandes importees, conge lees, desossees, maigres II 90% visibles, LO.b. port d'entree.
ICarne importada, congelada, deshuesada, magro visible 90%, Lo.b. puerto de entrada.
CARNE DE V ACUNO (Centavos El .. UU.lkg.)
---------Argentina Argentine Argentin"
-------Current $ 19"5 Const"nt $ $ courants 19" 5 $ constants
$ corrientes 197 i $ constantes
43.9 103.8 39.0 89,5 39.2 87.1 39.2 88.5 42.3 96.8
43.3 96.7 42.3 93.6 34.0 75.4 37.1 81.7 55.2 l20.8
70.9 152.8 67.1 141.3 58.6 122,3 59.5 125.0 57.1 115.6
66.3 125.6 101.1 180,2 117.2 192.1 165.7 229.2 181.5 205.1
151.3 151.3 124.4 122.6
139.4E
'Quotations up to 1969 refer to Argentine chilled hind-quarters, wholesale at Smithfield Market, London; from 1970 onwards, prices are for chilled rump, boneless.
2Jusqu'en 1969, les cours se rapportent aux quartiers arriere argentins frigorifies, du marche de Smithfield (Londres); II partir de 1970, aux quartiers arriere frigorifies, desosses.
2Hasta 1969, las cotizaciones se refieren a cuartos traseros refrigerados argentinos, al por mayor en el mercado de Smithfield (Londres); a partir de 1970, los precios corresponden a caderas refrigerados, deshuesadas.
"F.o.b. unit value of frozen beef exports to EEC-9. :<Valeur unitaire Lo.b. des exportations de boeuf conge Ie vers la CEE-9. :<Valor unitario Lo.b. de la carne congelada exportada a paises de la CEE-9.
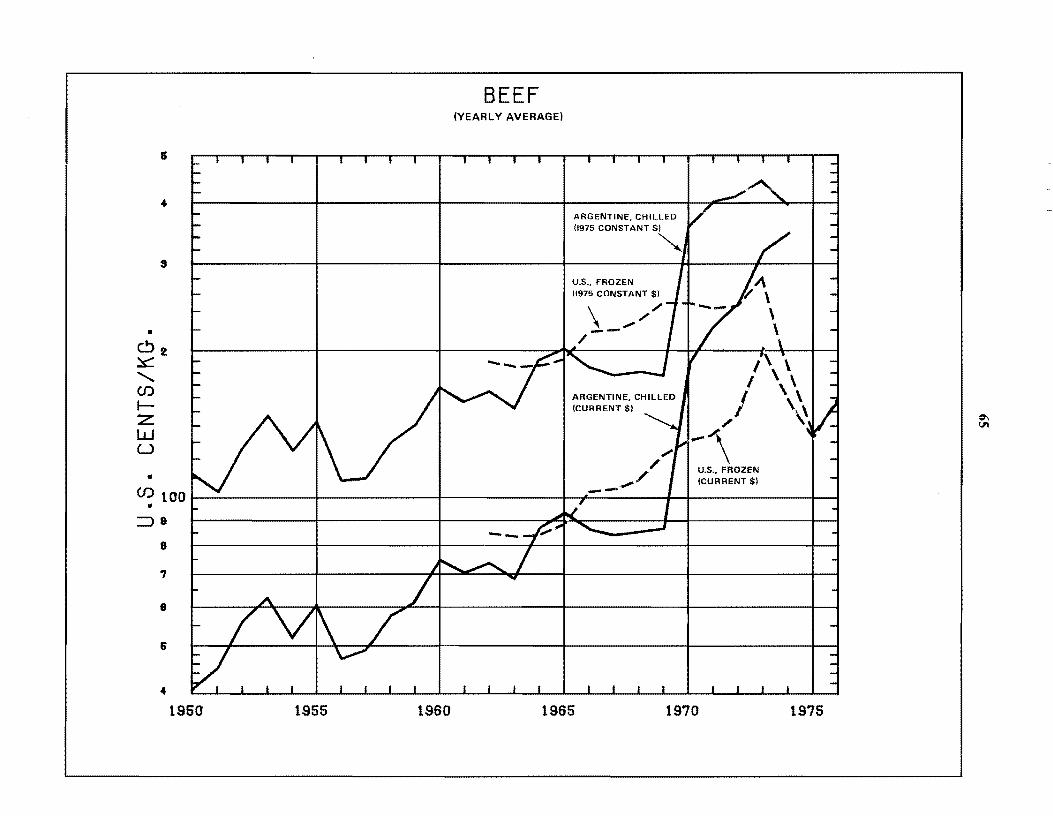
Ii
...
8
• C>2 ~
"-(f)
I--Z W U
• (J) 100
• :::J9
8
., 8
Ii
... 1950 1955 1960
BEEF (YEARLY AVERAGE)
ARGENTINE, CHILLED 11975 CONSTANT $'
~
U.S., FROZEN 11975 CONSTANT $)
\ ,..// --
ARGENTINE, CHILLED tCURRENT $1
/' .... ./ ---
1\ \ I \ \
/ \ \ ,/ \\
... \ 1\ U.S., FROZEN (CURRENT $1
1965 1970 1975
<:1\ til
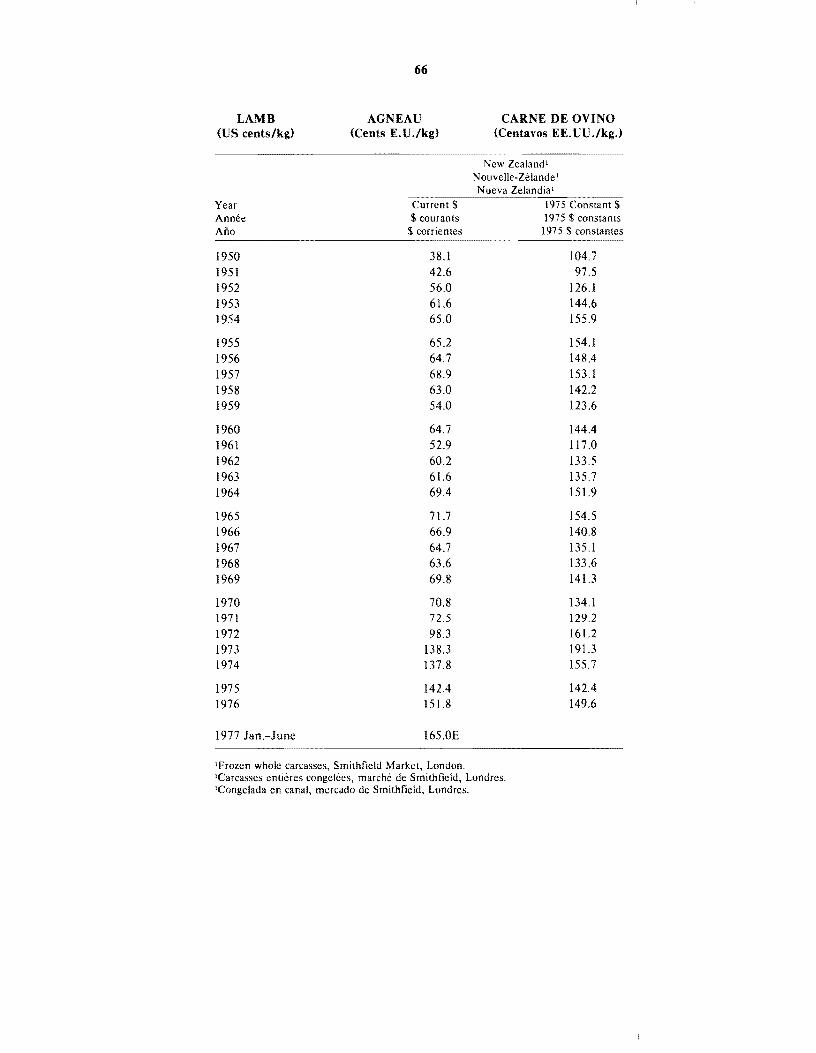
66
LAMB (US cents/kg)
AGNEAU (Cents E.U./kg)
CARNE DE OVINO (Centavos E E. UU ./kg.)
Year Annee Ano
1950 1951 1952 1953 1954
1955 1956 1957 1958 1959
1960 1961 1962 1963 1964
1965 1966 1967 1968 1969
1970 1971 1972 1973 1974
1975 1976
1977 Jan.-June
New Zealand l
N ouvelle-Zelande 1
Nueva Zelandia l
Current $ courants
$ corrientes
38.1 42.6 56.0 61.6 65.0
65.2 64.7 68.9 63.0 54.0
64.7 52.9 60.2 61.6 69.4
71.7 66.9 64.7 63.6 69.8
70.8 72.5 98.3
138.3 137.8
142.4 151.8
165.0E
lFrozen whole carcasses, Smithfield Market, London. lCarcasses entieres congelees, marche de Smithfield, Londres. lCongelada en canal, mercado de Smithfield, Londres.
104.7 97.5
126.1 144.6 155.9
154.1 148.4 153.1 142.2 123.6
144.4 117.0 133.5 135.7 151.9
154.5 140.8 135.1 133.6 141.3
134.1 129.2 161.2 191.3 155.7
142.4 149.6
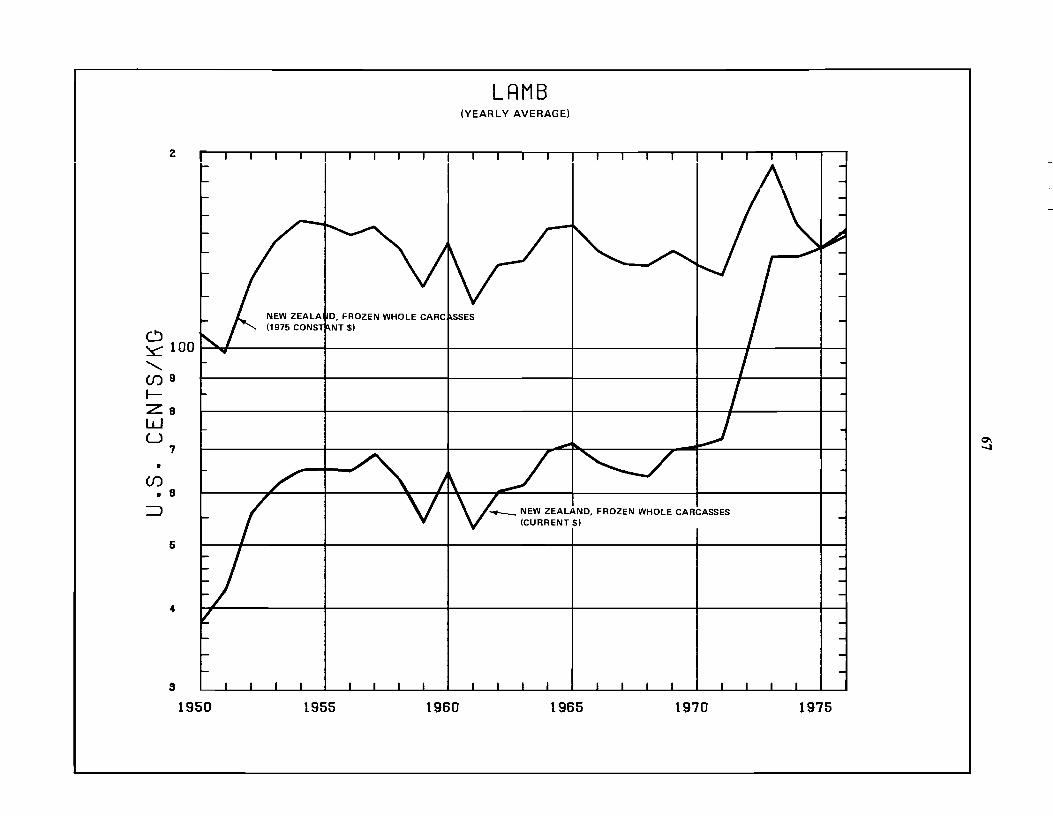
2
NEW ZEALAI\ID, FROZEN WHOLE CARC (1975 CONSTkNT $1
LRMB (YEARLY AVERAGE)
o ~100r--~'-------......... ~ (1)9
~
~8 T/--~ I
U 7
• (I)
• 8
=>
6
4
s 1950 1955 1960
_ NEW ZEALAND, FROZEN WHOLE CARCASSES (CURRENT $1
1965 1970 1975
~ .....:J
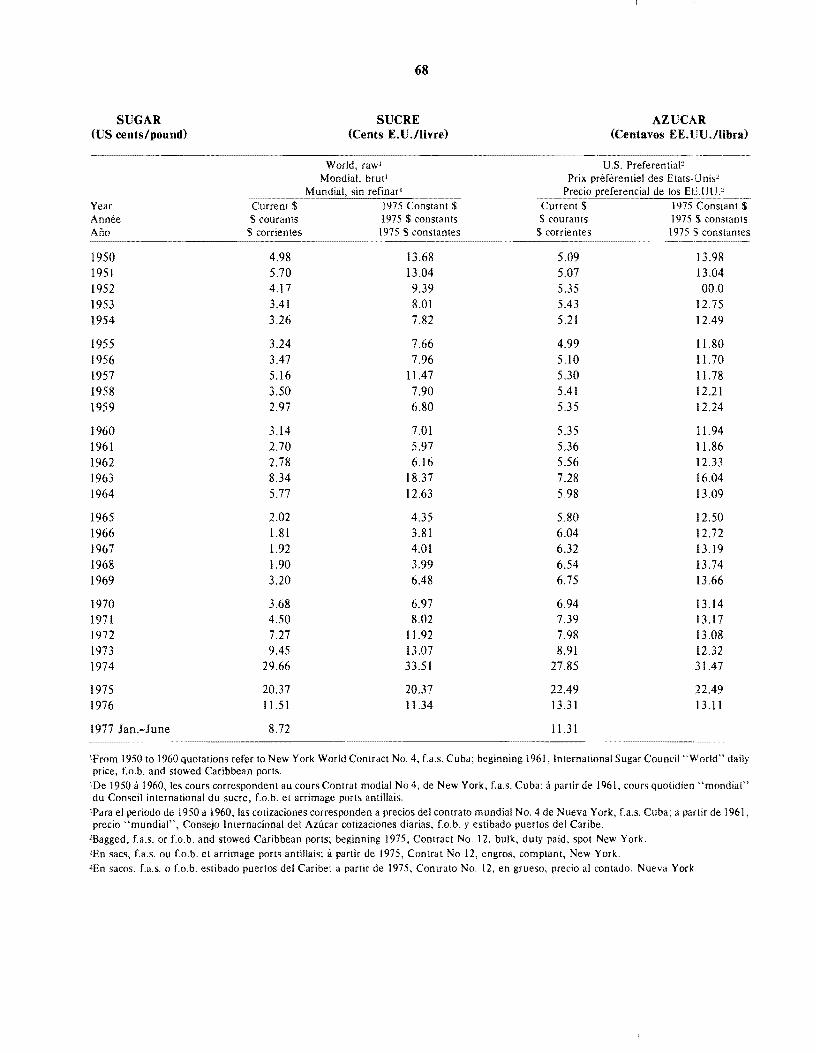
SUGAR (US cents/pound)
Year Annee Ano
1950 1951 1952 1953 1954
1955 1956 1957 1958 1959
1960 1961 1962 1963 1964
1965 1966 1967 1968 1969
1970 1971 1972 1973 1974
1975 1976
1977 Jan.-June
Current S courants
$ corrientes
4.98 5.70 4.17 3.41 3.26
3.24 3.47 5.16 3.50 2.97
3.14 2.70 2.78 8.34 5.77
2.02 1.81 1.92
1.90 3.20
3.68 4.50 7.27 9.45
29.66
20.37 11.51
8.72
68
SUCRE (Cents E.U./livre)
World, raw l
Mondial, brut' sin refinar'
1975 Constant $ 1975 $ constants 1975 $ eonstantes
13.68 13.04 9.39 8.01 7.82
7.66 7.96
11.47 7.90 6.80
7.01 5.97 6.16
18.37 12.63
4.35 3.81 4.01 3.99 6.48
6.97 8.02
11.92 13.07 33.51
20.37 11.34
AZUCAR (Centavos EE.UU./libra)
---_ ......
U.S. Preferential" Prix preferentiel des Etats-Unis'
Precio de los EE.UU.' Current $ 1975 Constant $ $ courants 1975 $ constants
$ corrientes 1975 S cons tan tes
5.09 13.98 5.07 13.04 5.35 00.0
5.43 12.75 5.21 12.49
4.99 11.80 5.10 11.70 5.30 11.78 5.41 12.21 5.35 12.24
5.35 11.94 5.36 11.86 5.56 12.33 7.28 16.04 5.98 13.09
5.80 12.50 6.04 12.72 6.32 13.19 6.54 13.74 6.75 13.66
6.94 13.14 7.39 13.17 7.98 13.08 8.91 12.32
27.85 31.47
22.49 12.49 13.31 \3.11
11.31
'From 1950 to 1960 quotations refer to New York World Contract No.4, f.a.s. Cuba; beginning 1961, International Sugar Council "World" daily price, f.o.b. and stowed Caribbean ports.
'De 1950 a 1960, les cours correspondent au cours Contrat modial No 4, de New York, f.a.s. Cuba; a partir de 1961, cours quotidien "mondial" du Consei1 international du sucre, f.o.b. et arrimage ports antillais. 'Para el periodo de 1950 a 1960, las cotizaciones corresponden a precios del contrato mundial No.4 de Nueva York, La.s. Cuba; a partir de 1961, precio "mundial", Consejo Internacional del Azucar cotizaciones diarias, f.o.b. y estibado puertos del Caribe.
ZBagged, f.a.s. or f.o.b. and stowed Caribbean ports; beginning 1975, Contract No. 12, bulk, duty paid, spot New York. ZEn sacs, La.s. ou Lo.b. et arrirnage ports antillais; a partir de 1975, Contrat No 12, engros, comptant, New York. ZEn sacos, f.a.s. 0 f.o.b. estibado puertos del Caribe; a partir de 1975, Contralo No. 12, en grueso, precio al eonlado, Nueva York
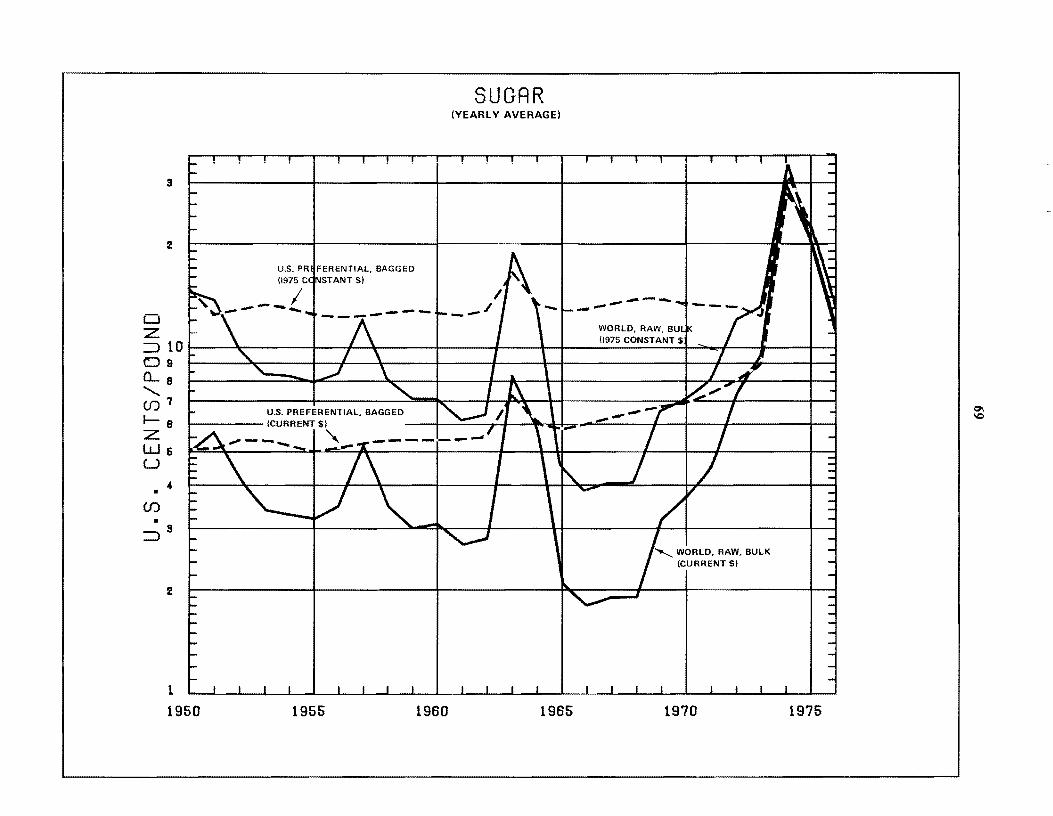
LJ Z
3
2
:::::> 10 D9 0.- 8 "'(j)7
1-8 Z W& U
. .. (j)
• :::::>3
2
1
1950
U.S. PR FERENTtAL, BAGGED STANT $!
U.S. PREFERENTIAL, BAGGED (CURRENTS!
'"
1955
SUGAR (YEARLY AVERAGE)
~
, WORLD, RAW, BULK {CURRENTS!
1960 1965 1970 1975
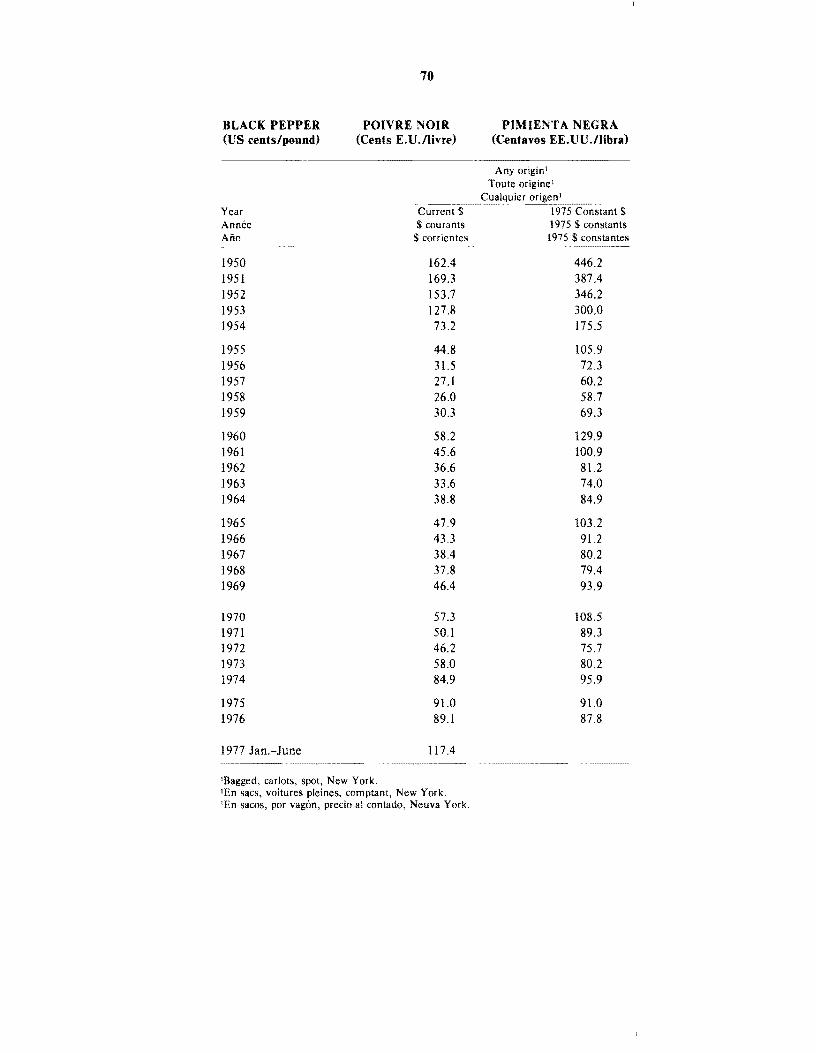
70
BLACK PEPPER POIVRE NOIR PIMIENT A NEGRA (US cents/pound) (Cents E.U.llivre) (Centavos EE.UU.!Jibra)
Any origin! Toute origine l
Cualquier origenl Year Current $ 1975 Constant $ Annee $ courants 1975 $ constants Ailo $ corrientes 1975 $ constantes
1950 162.4 446.2 1951 169.3 387.4 1952 153.7 346.2 1953 127.8 300.0 1954 73.2 175.5
1955 44.8 105.9 1956 31.5 72.3 1957 27.1 60.2 1958 26.0 58.7 1959 30.3 69.3
1960 58.2 129.9 1961 45.6 100.9 1962 36.6 81.2 1963 33.6 74.0 1964 38.8 84.9
1965 47.9 103.2 1966 43.3 91.2 1967 38.4 80.2 1968 37.8 79.4 1969 46.4 93.9
1970 57.3 108.5 1971 50.1 89.3 1972 46.2 75.7 1973 58.0 80.2 1974 84.9 95.9
1975 91.0 91.0 1976 89.1 87.8
1977 Jan.-June 117.4
IBagged, carJots, spot, New York. lEn sacs, voitures pJeines, comptant, New York. lEn sacos, por vagon, precio al contado, Neuva York.
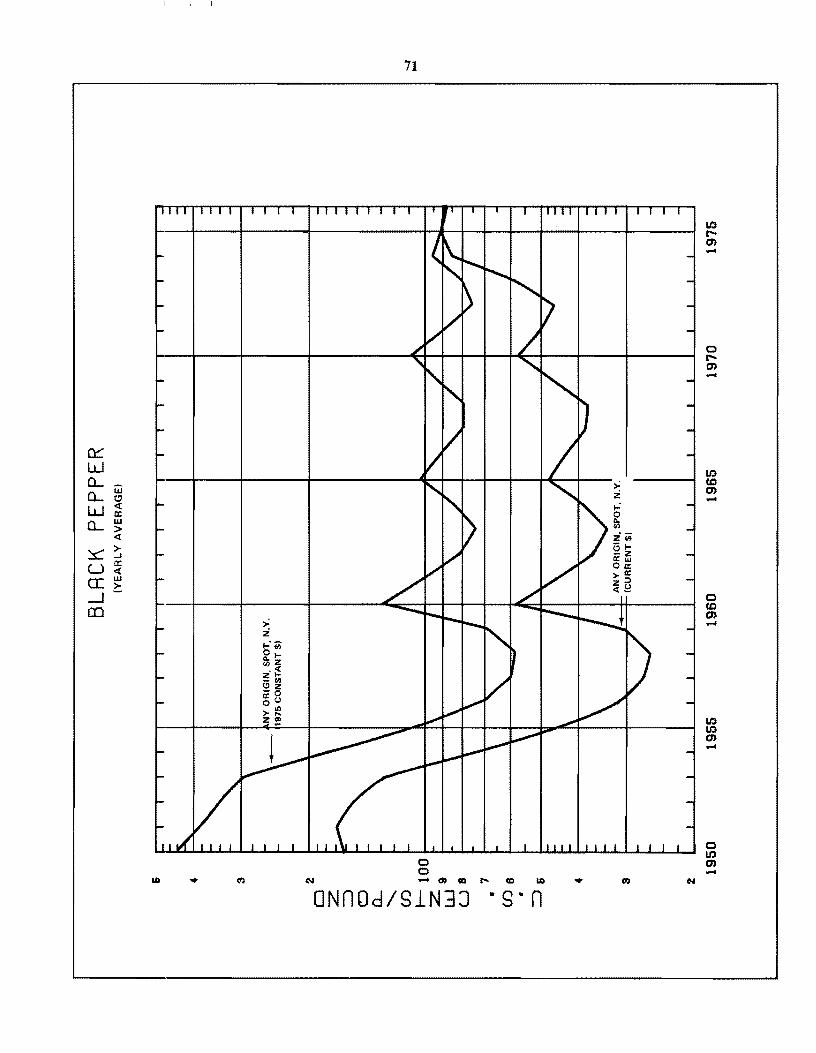
a:::: w 0.... 0....
w (.!)
W <t a:
0.... w > <t
~ > ...J
U a: <t
a: w ~
---l CO
> Z ... : (ii 01-o.z (/.I.. < ZI--C/l (,:lz -0 ~(J > I!! Z!!!
....
71
o o
ONnOd/S1N3J · S· n
> z
LO r-Q) -
o r-Q) -
LO U) Q) -
0 U) Q) -
LO LO Q) -
o LO Q) -
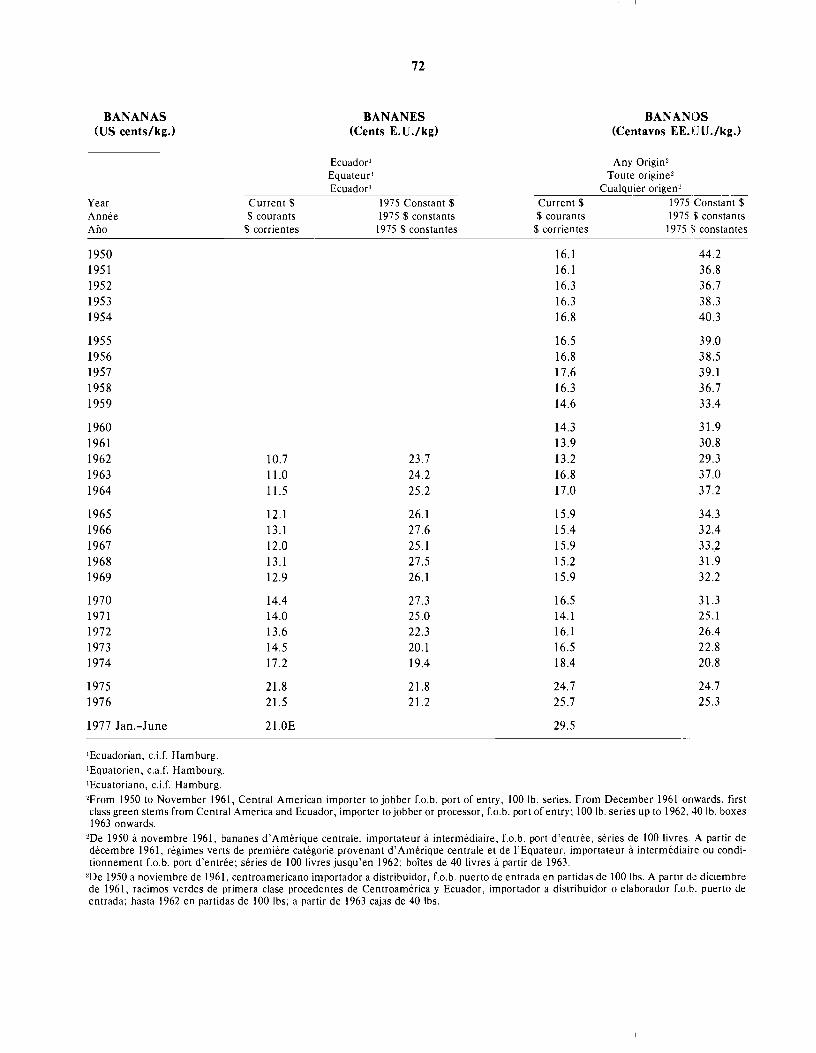
BANANAS (US cents/kg.)
Year Annee Ano
1950
1951
1952
1953
1954
1955
1956
1957
1958
1959
1960
1961
1962
1963
1964
1965
1966
1967
1968
1969
1970
1971
1972
1973
1974
1975
1976
1977 Jan.-June
IEcuadorian, c.i.f. Hamburg. IEquatorien, c.aJ. Hambourg. 'Ecuatoriano, c.iJ. Hamburg.
Current $ $ courants
$ corrientes
10.7
11.0
11.5
12.1
13.1
12.0
13.1
12.9
14.4 14.0
13.6
14.5
17.2
21.8
21.5
21.0E
72
BANANES (Cents E.U'/kg)
Ecuador l
Equateur l
Ecuador l
1975 Constant $ 1975 $ constants 1975 $ constantes
23.7
24.2
25.2
26.1
27.6
25.1
27.5
26.1
27.3
25.0
22.3
20.1
19.4
21.8
21.2
BANANOS (Centavos EE. UU ./kg.)
~----
Any Origin' Toute origine'
Cualquier origen' Current $ 1975 Constant $ $ courants 1975 $ constants
$ corrientes 1975 S constantes
16.1 44.2
16.1 36.8
16.3 36.7
16.3 38.3
16.8 40.3
16.5 39.0
16.8 38.5
17.6 39.1
16.3 36.7
14.6 33.4
14.3 31.9
13.9 30.8
13.2 29.3
16.8 37.0
17.0 37.2
15.9 34.3
15.4 32.4
15.9 33.2
15.2 31.9
15.9 32.2
16.5 31.3
14.1 25.1
16.1 26.4
16.5 22.8
18.4 20.8
24.7 24.7
25.7 25.3
29.5 ---
'From 1950 to November 1961, Central American importer to jobber Co.b. port of entry, 100 lb. series. From December 1961 onwards, first class green stems from Central America and Ecuador, importer to jobber or processor, f.o.b. port of entry; 100 lb. series up to 1962, 40 lb. boxes 1963 onwards.
'De 1950 it novembre 1961, bananes d'Amerique centrale, importateur it intermediaire, Co.b. port d'entree, series de 100 livres. A partir de decembre 1961, regimes verts de premiere categorie provenant d' Amerique centrale et de l'Equateur, importateur it intermediaire ou conditionnement Co.b. port d'entree; series de 100 livres jusqu'en 1962; boites de 40 livres a partir de 1963.
'De 1950 a noviembre de 1961, centroamericano importador a distribuidor, Co.b. puerto de entrada en partidas de 100 lbs. A partir de diciembre de 1961, racimos verdes de primera clase procedentes de Centroamerica y Ecuador, importador a distribuidor 0 elaborador Co.h. puerto de entrada; hasta 1962 en partidas de 100 Ibs; a partir de 1963 cajas de 40 Ibs.
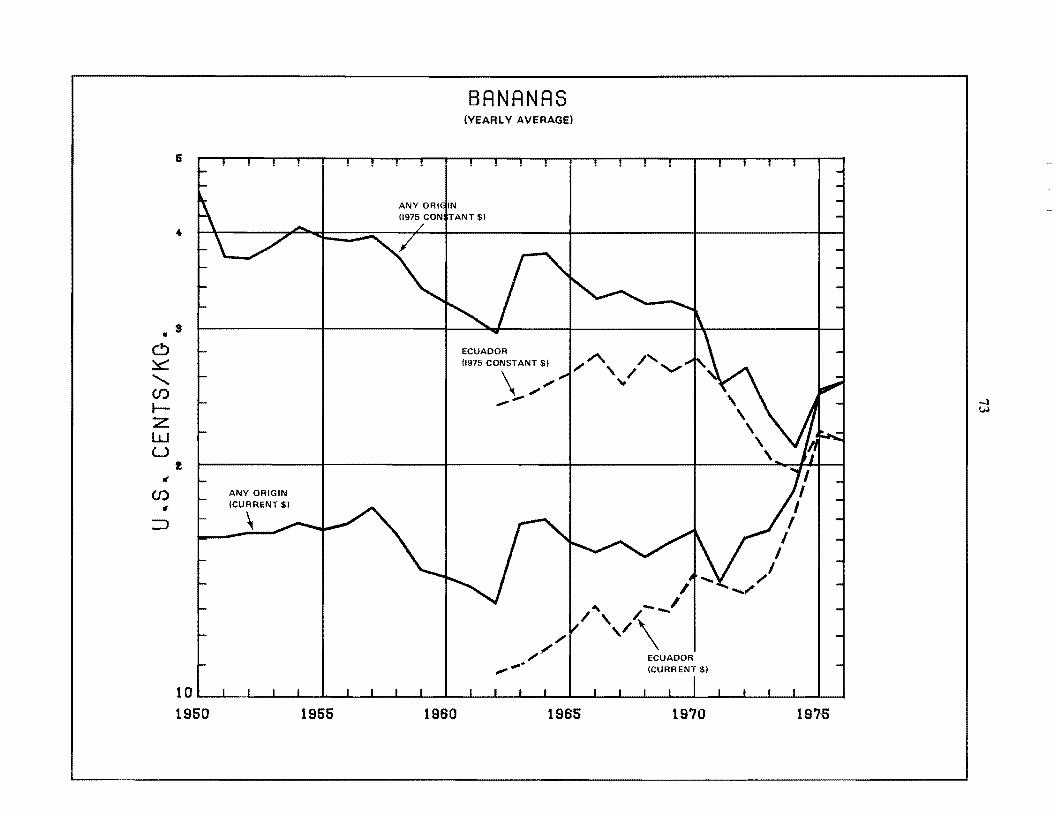
&
4
• 3 C!) :::.c::
" (f)
IZ W U
" (f)
rf
::>
Ie
ANY ORIGIN (CURRENT $)
\
BANANAS (YEARLY AVERAGE)
ANY ORtqlN 0975 CONiTANT $)
ECUADOR {l975 CONSTANT $1
\ .;.; --
-"." /"
/\ r-. ........... " '/ '"
--/'.\ /\ ,/
, , ECUADOR (CURRENT $)
10~1~ __ ~~-L-J __ ~~~~ __ ~~~-J __ ~~-L-J __ ~~-L-J __ ~~~~--4
1950 1955 1960 1965 1970 1975
-.J ~
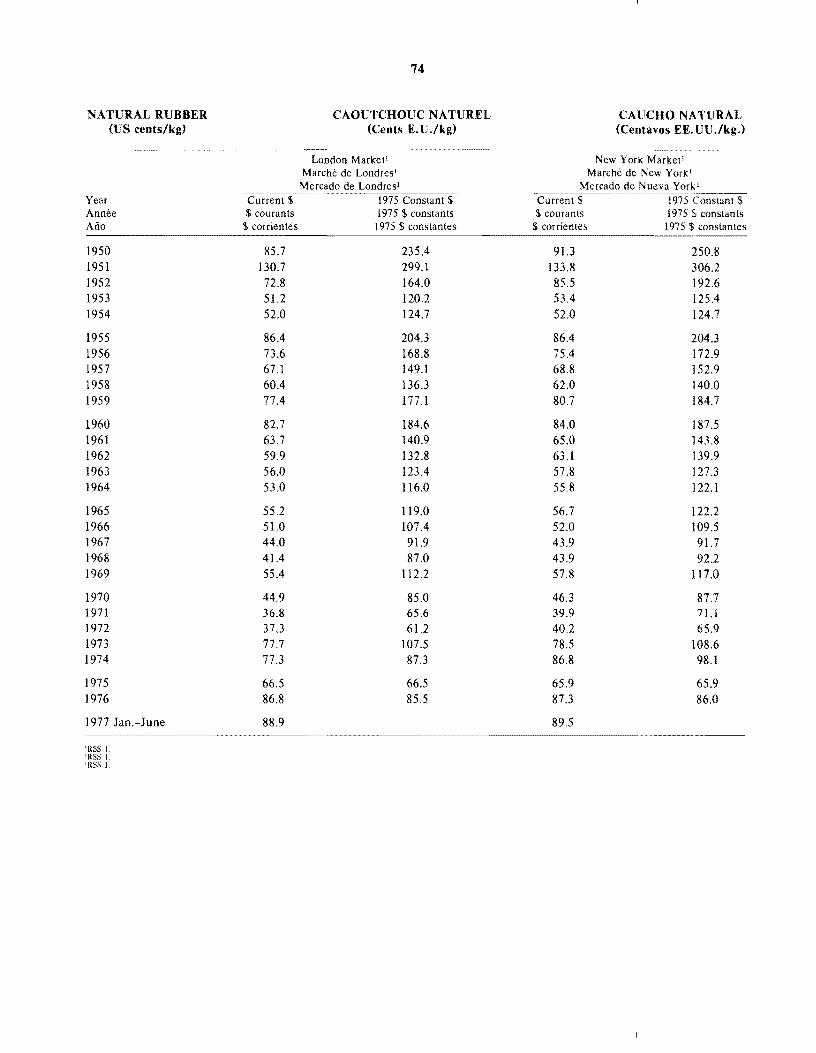
74
NATURAL RUBBER CAOUTCHOUC NATUREL CAUCHO NA TURAL (US cents/kg) (Cents E.U.lkg) (Centavos EE. UU.lkg.)
London Market' New York Market' Marche de Londres' Marche de New York'
Mercado de Londres' Year Current $ 1975 Constant $ Annee $ courants 197 5 $ constan ts $ courants 1975 S constants Ano $ corrientes 1975 $ constantes $ corrientes 1975 $ constantes
1950 85.7 235.4 91.3 250.8 1951 130.7 299.1 133.8 306.2 1952 72.8 164.0 85.5 192.6 1953 51.2 120.2 53.4 125.4 1954 52.0 124.7 52.0 124.7
1955 86.4 204.3 86.4 204.3 1956 73.6 168.8 75.4 172.9 1957 67.1 149.1 68.8 152.9 1958 60.4 136.3 62.0 140.0 1959 77.4 177.1 80.7 184.7
1960 82.7 184.6 84.0 187.5 1961 63.7 140.9 65.0 143.8 1962 59.9 132.8 63.1 139.9 1963 56.0 123.4 57.8 127.3 1964 53.0 116.0 55.8 122.1
1965 55.2 119.0 56.7 122.2 1966 51.0 107.4 52.0 109.5 1967 44.0 91.9 43.9 91.7 1968 41.4 87.0 43.9 92.2 1969 55.4 112.2 57.8 117.0
1970 44.9 85.0 46.3 87.7 1971 36.8 65.6 39.9 71.1 1972 37.3 61.2 40.2 65.9 1973 77.7 107.5 78.5 108.6 1974 77.3 87.3 86.8 98.1
1975 66.5 66.5 65.9 65.9 1976 86.8 85.5 87.3 86.0
1977 Jan.-June 88.9 89.5
'RSS I. 'RSS l. 'RSS L
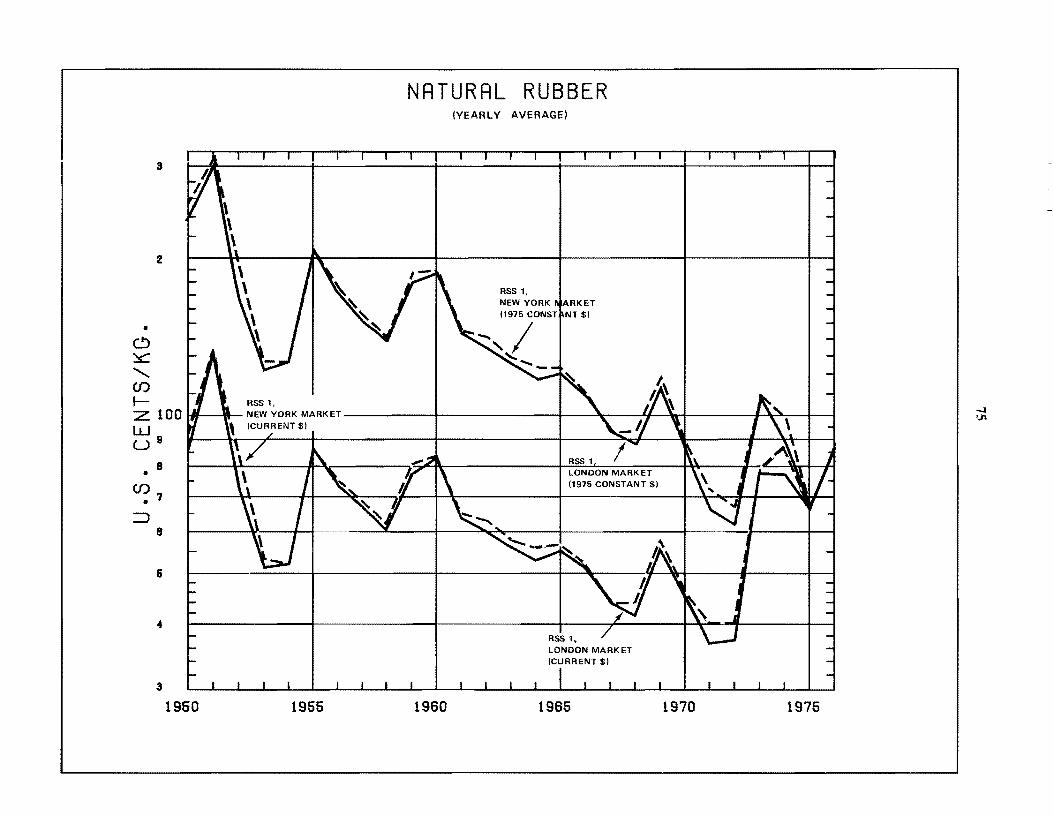
• C> :x::: "'U)
I--
3
2
:z 100 III \1 W U 9
8 • U),
• :::::>
8
5
4
3
1960 1955
NATURAL RUBBER
1960
(YEARLY AVERAGE)
LONDON MARKET (1975 CONSTANT $)
RSS 1, LONDON MARKET (CURRENT $)
1965 1970 1975
-I 0'1
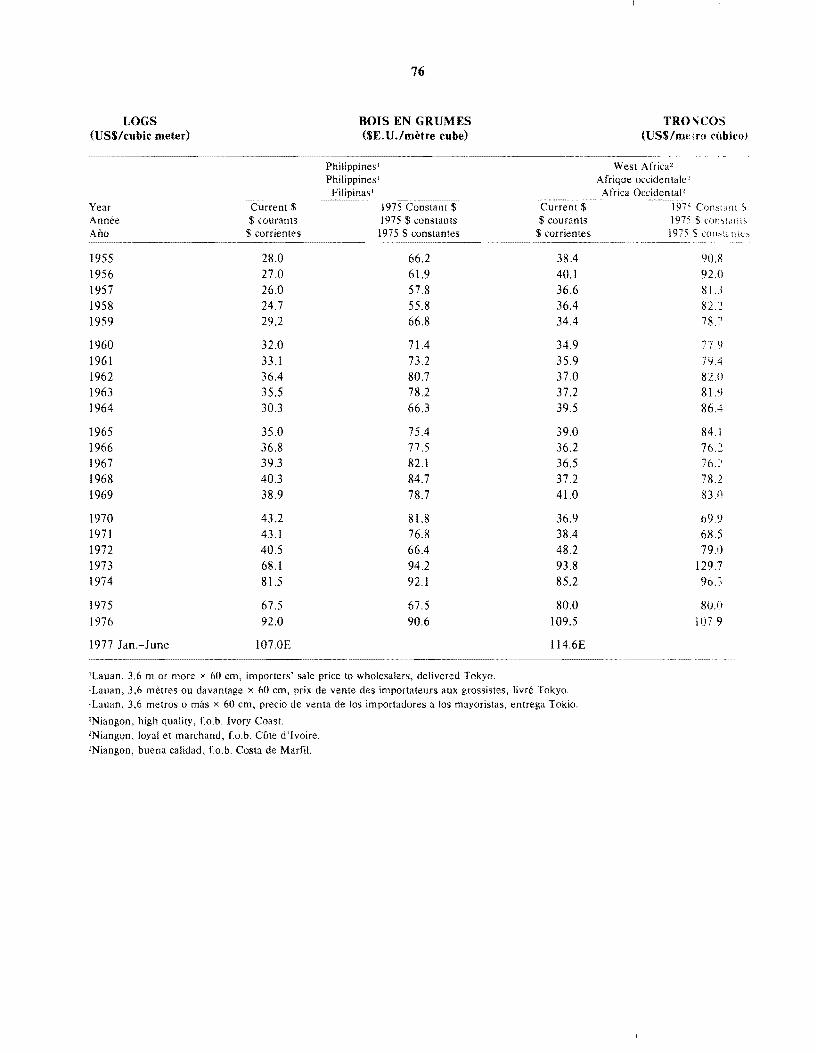
LOGS (US$/cubic meter)
76
BOIS EN GRUMES ($E.U.lmetre cube)
Philippinesl
Philippines'
TRO'lCOS (US$/metro cllbico)
West Africa" Afrique occidentale' Africa Occidental'
Year Annee Ano
Current 1975 Constant 1975 $ constants 1975 $ constantes
-.:: •.. ---........ ~-----.. ---.... :c:c: - _. Con~iJnt S
1955 1956 1957 1958 1959
1960 1961 1962 1963 1964
1965 1966 1967 1968 1969
1970 1971 1972 1973 1974
1975 1976
1977 Jan,-June
$ courants $ corrientes
28.0 no 26,0 24,7 29.2
32.0 33.1 36.4 35.5 30.3
35.0 36.8 39.3 40.3 38.9
43.2 43.1 40.5 68.1 81.5
67.5 92.0
1070E
66.2 61.9 57.8 55.8 66.8
71.4 73.2 80.7 78.2 66.3
75.4 77.5 82.1 84.7 78.7
81.8 76.8 66.4 94.2 92.1
67.5 90.6
lLauan, 3.6 m or more x 60 cm, importers' sale price to wholesalers, delivered Tokyo.
$ courants $ corrientes
38.4 40.1 36.6 36.4 34.4
34.9 35.9 37.0 37.2 39.5
39.0 36.2 36.5 37.2 41.0
36.9 38.4 48.2 93,8 85.2
80.0 109.5
114.6E
lLauan, 3,6 metres ou davantage x 60 em, prix de vente des importateurs aux grossistes, livre Tokyo. lLauan, 3,6 metros 0 mas x 60 em, precio de venta de los importadores a los mayoristas, entrega Tokio.
2Niangon, high quality, Lo.b. Ivory Coast. 2Niangon, loyal et marchand, f.o.b. Cote d'Ivoire.
2Niangon, buena calidad, Lo.b. Costa de Marfil.
197.' $ con.,liHH;'
1975 S ';:Oll~d~'dllt:""
90.8 92.0 8].3
8U 78. ~'
779 NA 82.0 81.9 86.4
84.1 76.2 70.:' 78.2 83.0
69.9 68.5 79.0
129.7 96.:;
80.0 107.9
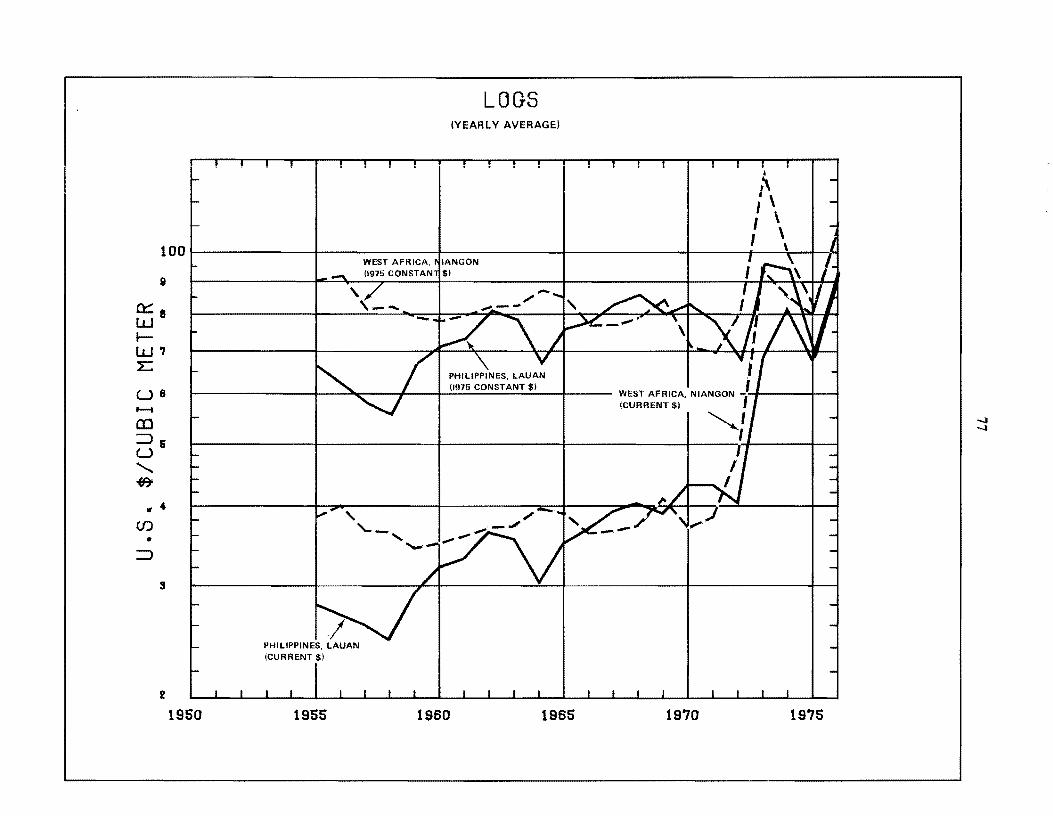
100
8
0:::: 8 W I-W., L:
US ....... CO I ::J& U
" 4TJ-
• 4 (J)
• ::J
s
2
1960
PHILIPPINES, LAUAN (CURRENT $1
1966
LOGS (YEARLY AVERAGE)
I ~!I I 1 -..J -..J
1960 1966 1970 1976
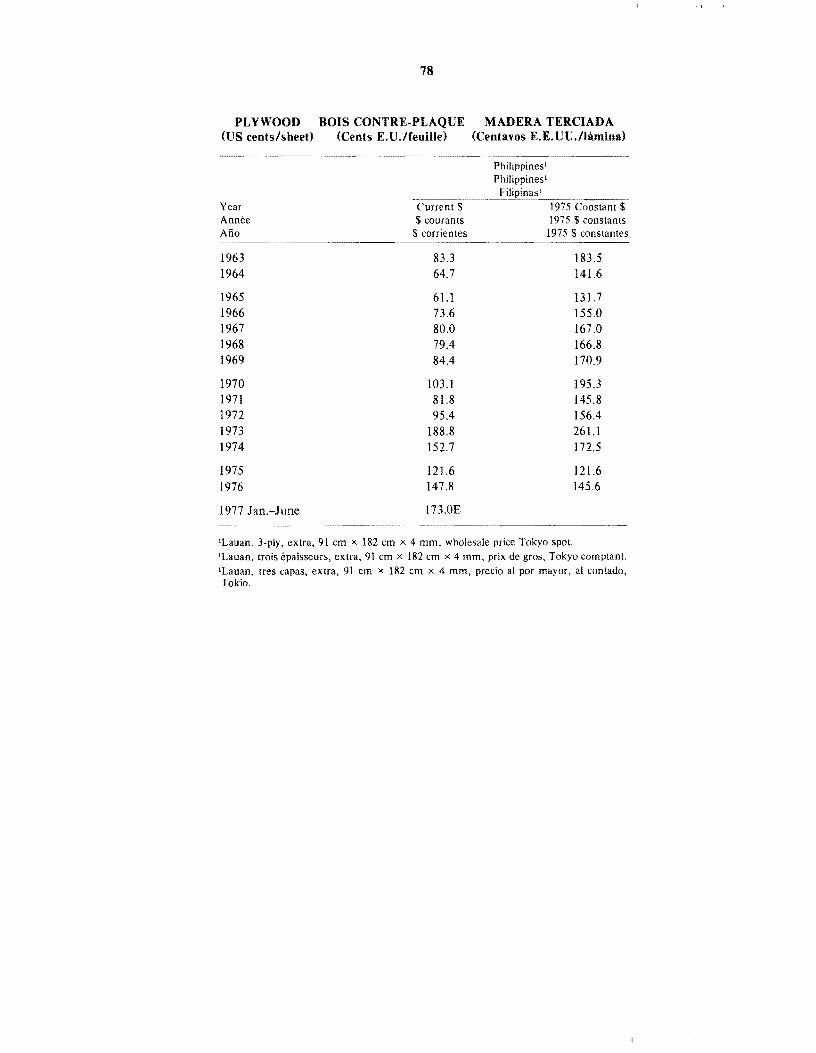
78
PLYWOOD BOIS CONTRE-PLAQUE MADERA TERCIADA (US cents/sheet) (Cents E.U.lfeuille) (Centavos E.E.UU.lhimina)
Year Current Annee $ courants Ano $ corrientes
1963 83.3 1964 64.7
1965 61.1 1966 73.6 1967 80.0 1968 79.4 1969 84.4
1970 103.1 1971 81.8 1972 95.4 1973 188.8 1974 152.7
1975 121.6 1976 147.8
1977 Jan.-June 173.0E
Philippines' Philippines'
1975 $ constants 1975 $ constantes
183.5 141.6
131.7 155.0 167.0 166.8 170.9
195.3 145.8 156.4 261.1 172.5
121.6 145.6
'Lauan, 3-ply, extra, 91 cm x 182 cm x 4 mm, wholesale price Tokyo spot. 'Lauan, trois epaisseurs, extra, 91 cm x 182 em x 4 mm, prix de gros, Tokyo eomptant. 'Lauan, tres capas, extra, 91 em x 182 em x 4 mm, preeio al por mayor, at contado, Tokio.
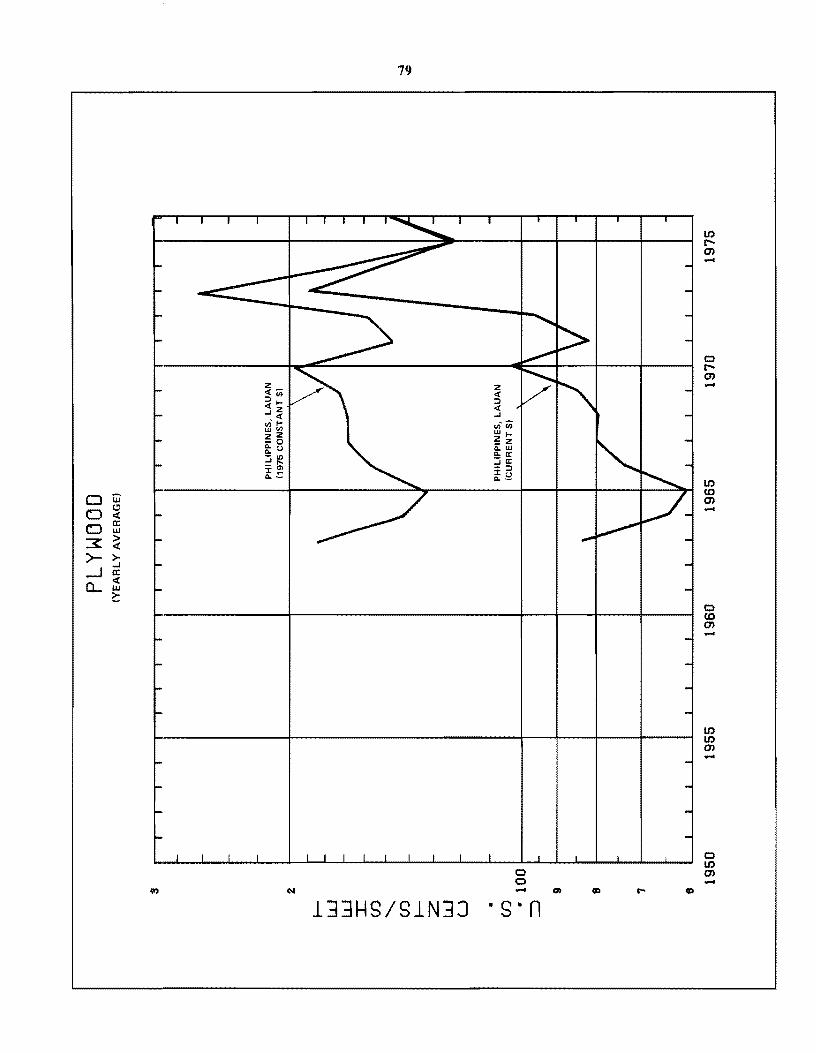
79
1:33HS/SIN3J
o o .....
· S· n
IJ) E"'m .....
IJ) IJ) m .....
o IJ) m .....
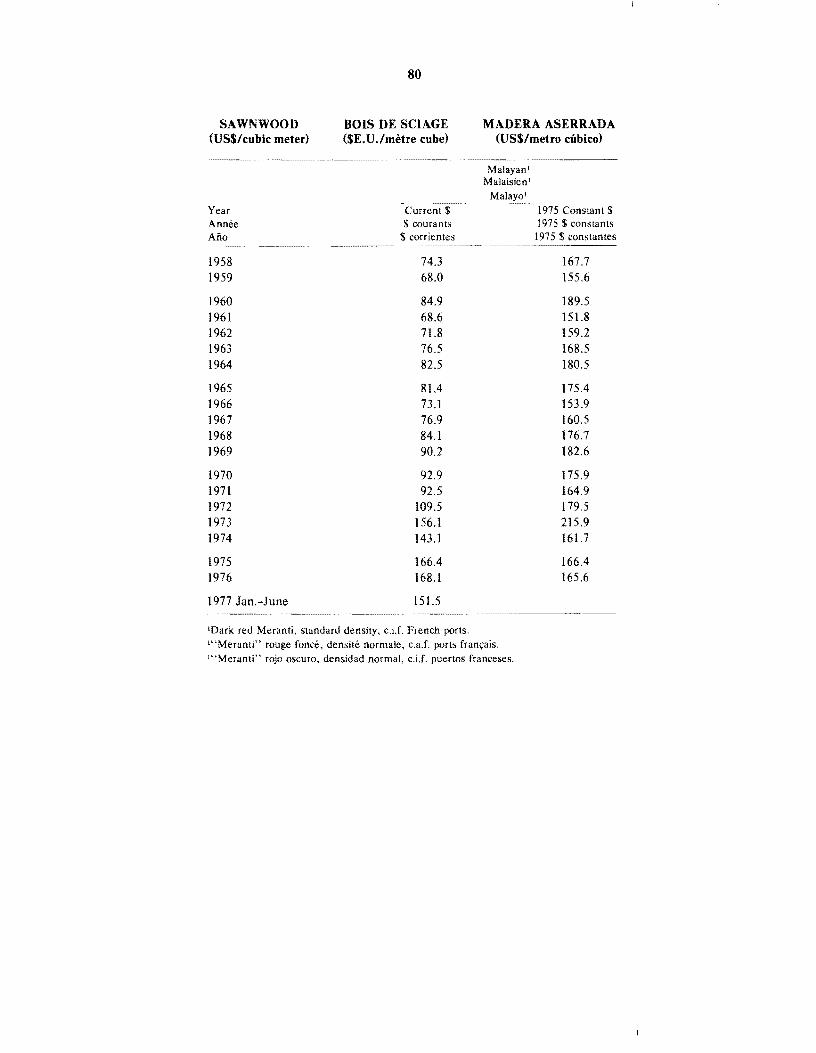
80
SAWN WOOD (US$/cubic meter)
BOIS DE SCIAGE ($E.U./metre cube)
MADERA ASERRADA (USS/metro ciibico)
Year Annee Ano
1958 1959
1960 1961 1962 1963 1964
1965 1966 1967 1968 1969
1970 1971 1972 1973 1974
1975 1976
1977 Jan.-June
Current $ $ courants
$ corrientes
74.3 68.0
84.9 68.6 71.8 76.5 82.5
81.4 73.1 76.9 84.1 90.2
92.9 92.5
109.5 156.1 143.1
166.4 168.1
151.5
Malayan! Malaisien'
'Dark red Meranti, standard density, c.i.f. French ports. '''Meranti'' rouge fonce, densite normale, c.a.f. ports fran9ais. I "Mcranti" rojo oscuro, densidad normal, c.i.f. puertos franccses.
1975 Constant $ 1975 $ constants 197 5 $ constantes
167.7 155.6
189.5 151.8 159.2 168.5 180.5
175.4 153.9 160.5 176.7 182.6
175.9 164.9 179.5 215.9 161.7
166.4 165.6
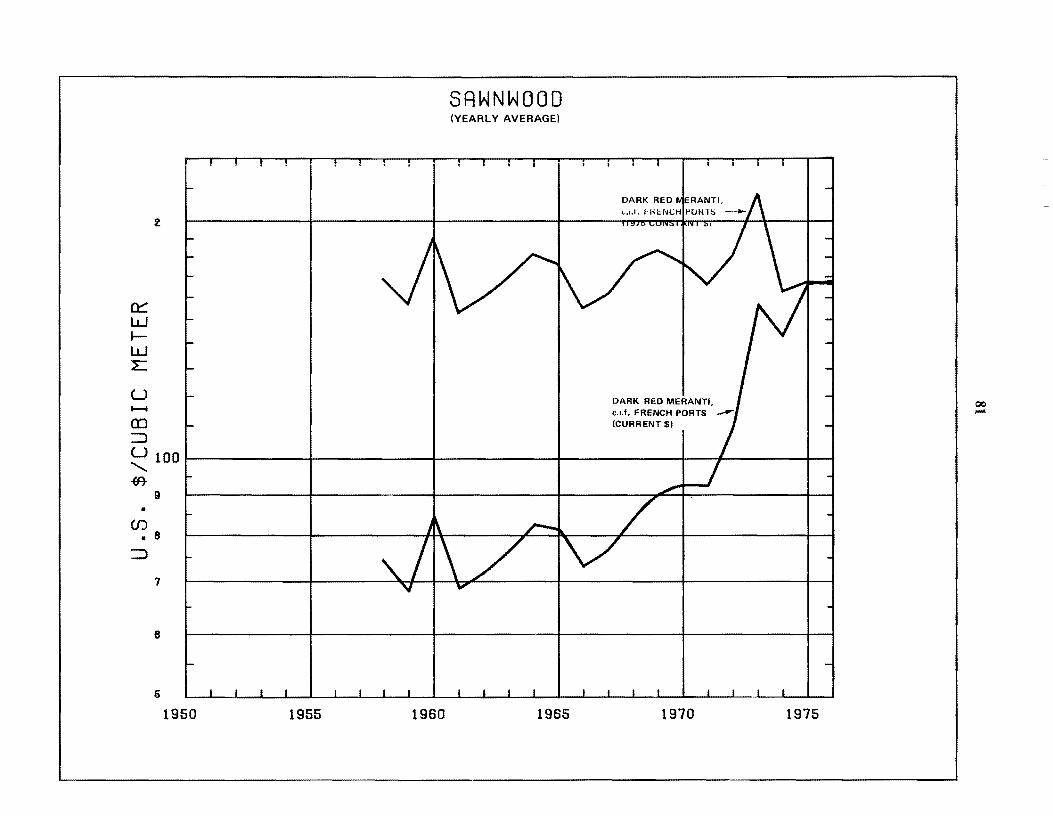
0:::: W IW L:
u ........ CD ::::J
2
U 1001 "{It
9 •
(j) • 8
::::J
1
8
&
1950 1955 1960
SRWNWOOD (YEARLY AVERAGE)
1965
DARK REO MERANTI. c.i.f. FRENCH PORTS (CURRENT $1
1970
l' ,
1975
ClC ......
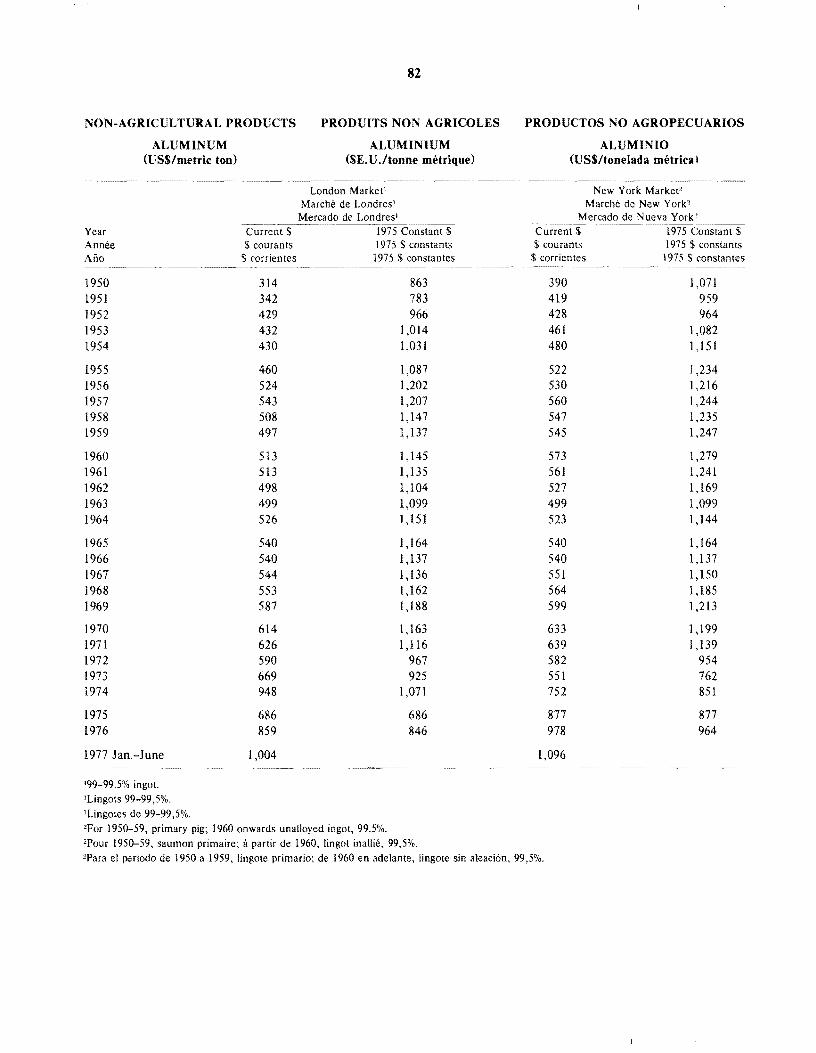
NON-AGRICULTURAL PRODUCTS
ALUMINUM (US$/metric ton)
82
PRODUITS NON AGRICOLES
ALUMINIUM ($E.U.ltonne metrique)
London Market l
Marchi: de Londres l
Mercado de Londres'
Year Annee Ano
Current Constant $ $ courants 1975 S constants
$ corrientes 1975 $ constantes
1950 1951 1952 1953 1954
1955 1956 1957 1958 1959
1960 1961 1962 1963 1964
1965 1966 1967 1968 1969
1970 1971 1972 1973 1974
1975 1976
1977 Jan,-June
314 342 429 432 430
460 524 543 508 497
513 513 498 499 526
540 540 544 553 587
614 626 590 669 948
686 859
1,004 ----~ ... --~ .... --~ .... -.-.- .... --~ .... --...
'99-99,5% ingot.
'Lingots 99-99,5%,
'Lingotes de 99-99,5%. 2For 1950-59, primary pig; 1960 onwards unalloyed ingot, 99.5%.
863 783 966
1,014 1,031
1,087 1,202 1,207 1,147 1,137
1,145 1,135 1,104 1,099 1,151
1,164 1,137 1,136 1,162 1,188
1,163 1,116
967 925
1,071
686 846
2Pour 1950-59, saumon primaire; it partir de 1960, lingot inaUie, 99,5%,
...--~-...
PRODUCTOS NO AGROPECUARIOS
ALUMINIO (uS$/tonelada metrical
New York Market2
Marche de New York' Mercado de Nueva York'
Current 1975 (:~o~ns"'t'-a~n~t S=-
$ courants 1975 $ constants $ corrientes \975 $ constantes
390 1,071 419 959 428 964 461 1,082 480 1,151
522 J ,234 530 1,216 560 1,244 547 1,235 545 1,247
573 1,279 561 1,241 527 1,169 499 1,099 523 1,144
540 1,164 540 1,137 551 1,150 564 1,185 599 1,213
633 1,199 639 1,139 582 954 551 762 752 851
877 877 978 964
1,096
'Para el periodo de 1950 a 1959, lingote primario; de 1960 en adelante, lingote sin aleaci6n, 99,5%.
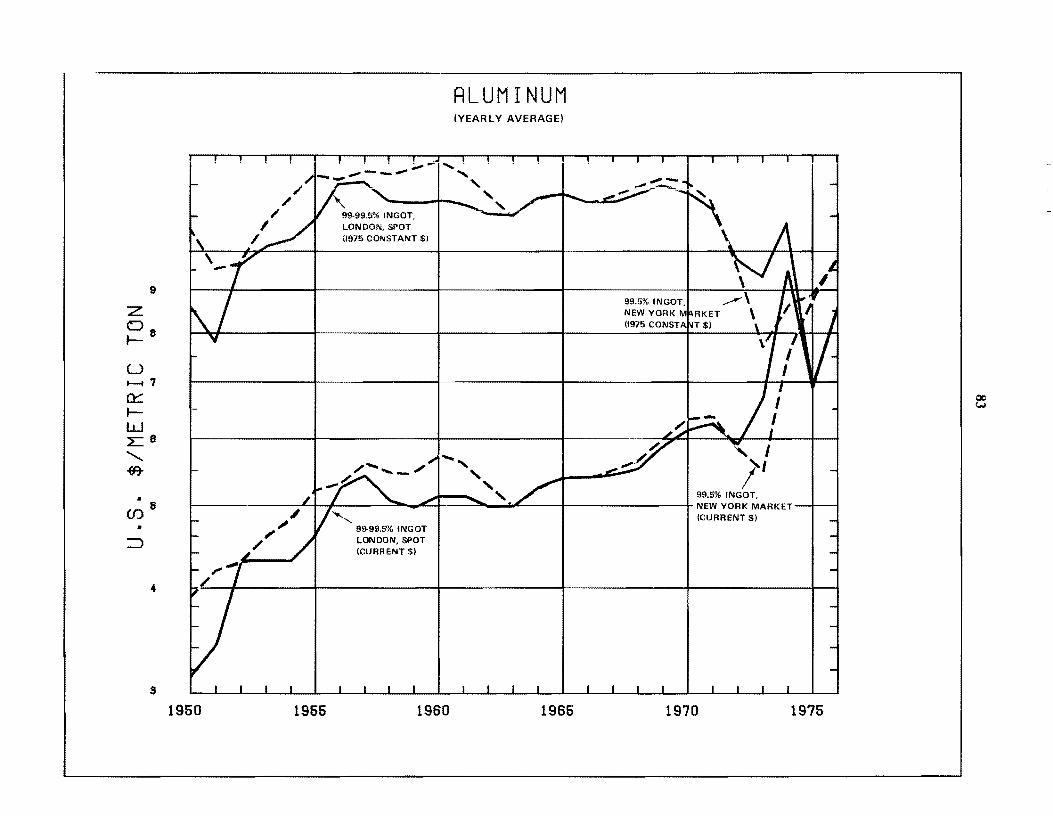
9
z C) f-8
U ........ 7
0:::: fW La
" -(f7
• enS •
::J
4
3
1950
99-99.5% INGOT, LONDON, SPOT 11975 CONSTANT $)
ALUMINUM (YEARLY AVERAGE)
..... , , , 99.5% INGOT, ~ '-." f """"'- ........... , -=""'" ." NEWYORKMARKET--I---I
"
1955
99-99.5% INGOT LONDON, SPOT (CURRENT $1
1960
(CURRENT $1
1966 1970 1975
QC (.N
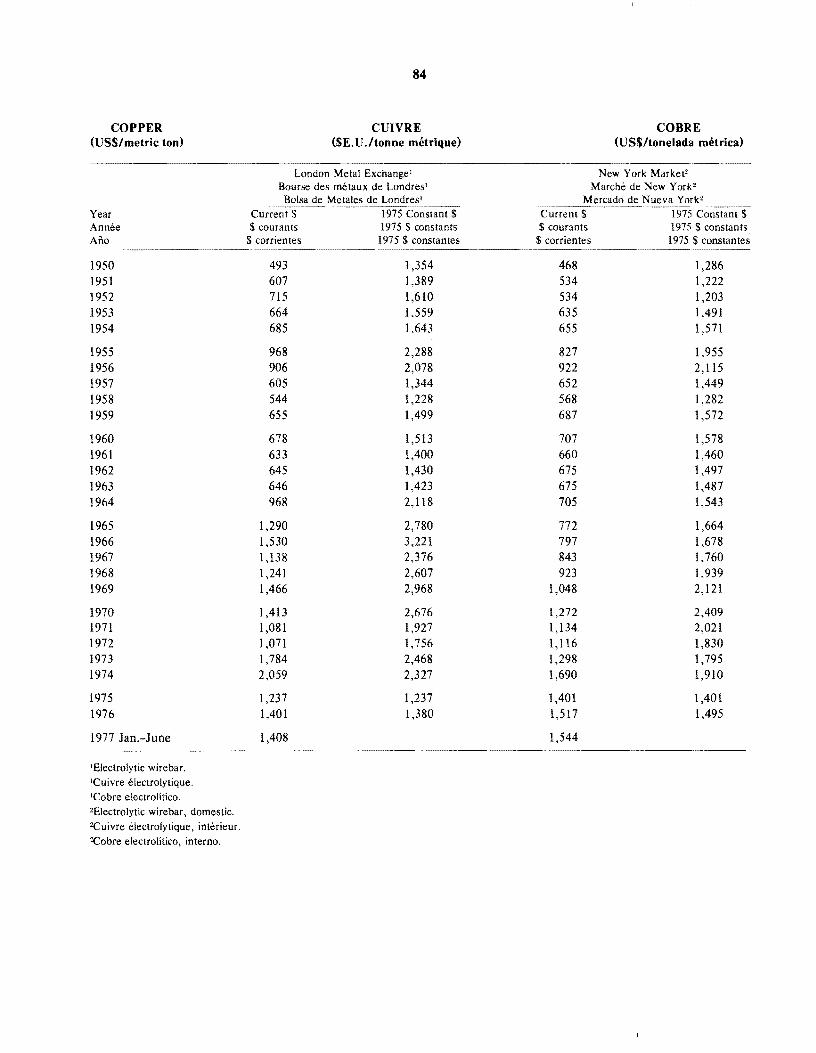
COPPER (US$/metric ton)
Year Annee Ano
1950 1951 1952 1953 1954
1955 1956 1957 1958 1959
1960 1961 1962 1963 1964
1965 1966 1967 1968 1969
1970 1971 1972 1973 1974
1975 1976
1977 Jan.-June
'Electrolytic wirebar. lCuivre electrolytique. lCobre electrolitico. 2Electrolytic wirebar, domestic. 2Cuivre electrolytique, interieur. ::Cobre electrolitico, interno.
84
CUIVRE ($E. U .Itonne metrique)
London Metal Exchange ' Bourse des metaux de Londres l
Bolsa de Metales de Londres l
Current $ 1975 Constant $ $ courants 1975 $ constants
$ corrientes 1975 $ constantes
493 1,354 607 1,389 715 1,610 664 1,559 685 1,643
968 2,288 906 2,078 605 1,344 544 1,228 655 1,499
678 1,513 633 1,400 645 1,430 646 1,423 968 2,118
1,290 2,780 1,530 3,221 1,138 2,376 1,241 2,607 1,466 2,968
1,413 2,676 1,081 1,927 1,071 1,756 1,784 2,468 2,059 2,327
1,237 1,237 1,401 1,380
1,408
COBRE (US$ltonelada metrica)
New York Market2
Marche de New York" Mercado de Nueva York"
Current $ 1975 Constant $ $ courants 1975 $ constants
$ corrientes 1975 $ constantes
468 1,286 534 1,222 534 1,203 635 1,491 655 1,571
827 1,955 922 2,115 652 1,449 568 1,282 687 1,572
707 1,578 660 1,460 675 1,497 675 1,487 705 1,543
772 1,664 797 1,678 843 1,760 923 1,939
1,048 2,121
1,272 2,409 1,134 2,021 1,116 1,830 1,298 1,795 1,690 1,910
1,401 1,401 1,517 1,495
1,544
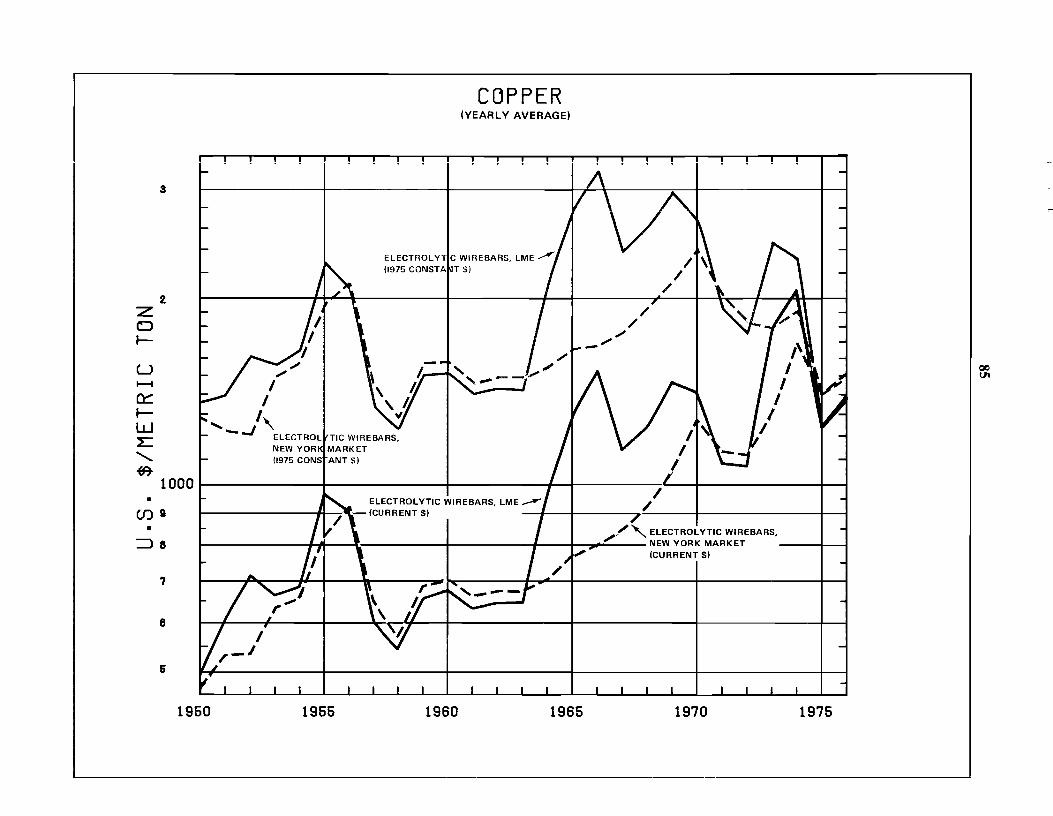
3
2 Z o ~
U I--t
a:::: ~ w L: .......... ~
COPPER (YEARLY AVERAGE)
ELECTROLYTIC WIREBARS, LME""""(1975 CONSTAIliT $)
...... " - J ELECTRO~TIC WIREBARS.
NEW YOR MARKET (1975 CONS ANT $)
"
" , , I
• 1000 /'
ELECTROLYTIC WIREBARS, LME ~ /
Cf)S ~--------------~/I~.1t--(CURRENT$) --~--4-------~,~----~----------------;---;
• ~8
.,/" '" ELECTROLYTIC WI REBARS, l-----------j/I-liRI-----'t / _ NEW YORK MARKET -_-+_-1
• -- (CURRENT $)
7
8
&
1950 1955 1960 1965 1970 1975
00 U1
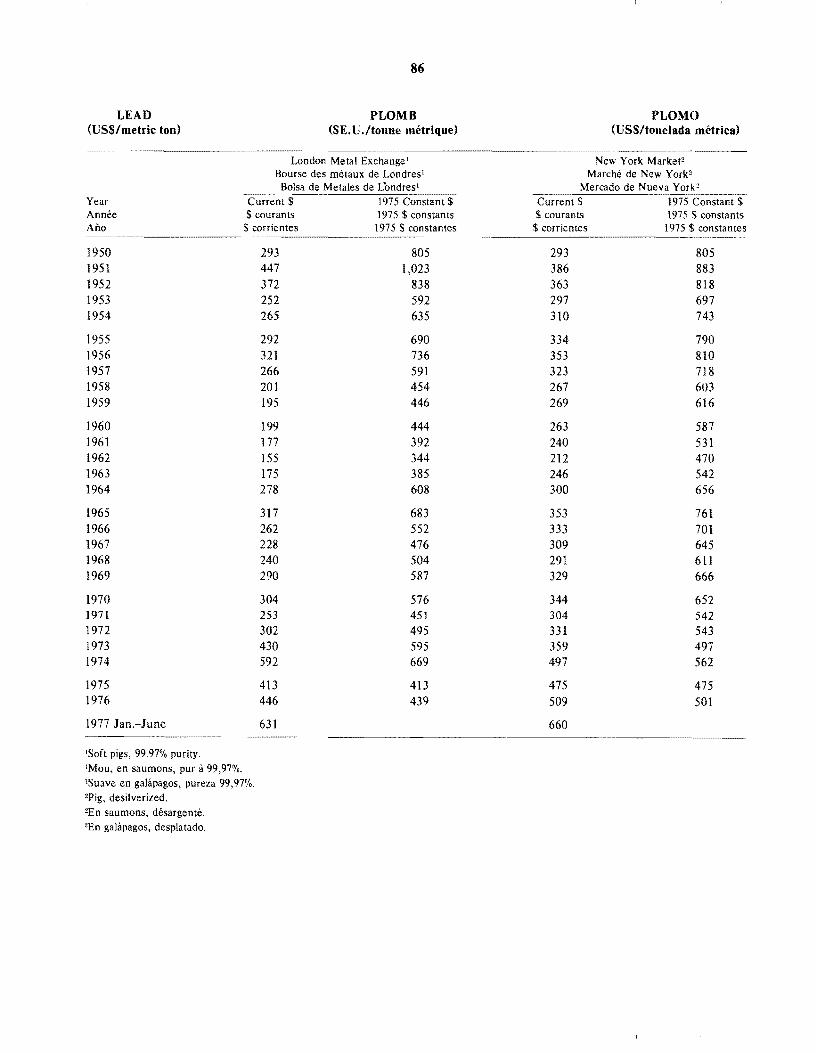
LEAD (US$/metric ton)
86
PLOMB ($E. U ./tonne metrique)
PLOMO (US$/tonelada metrical
---.. ~ ------------------------------London Metal Exchange'
Bourse des metaux de Londres' Bolsa de Metales de Lbndres l
1975 Year Annee Ano
$ courants 1975 $ constants $ corrientes
1950 1951 1952 1953 1954
1955 1956 1957 1958 1959
1960 1961 1962 1963 1964
1965 1966 1967 1968 1969
1970 1971 1972 1973 1974
1975 1976
1977 Jan.-June
IS oft pigs, 99.97% purity. IMou, en saumons, pur a 99,97%. 'Suave en galapagos, pureza 99,97%. 2pig, desilverized. 2En saumons, desargente. 'En galapagos, desplatado.
293 447 372 252 265
292 321 266 201 195
199 177 155 175 278
317 262 228 240 290
304 253 302 430 592
413 446
631
1975 $ constantes
805 1,023
838 592 635
690 736 591 454 446
444 392 344 385 608
683 552 476 504 587
576 451 495 595 669
413 439
New York Market! Marche de New York2
Mercado de Nueva York' 1975 Constant
$ courants 1975 S constants $ corrientes 1975 $ constantes
293 805 386 883 363 818 297 697 310 743
334 790 353 810 323 718 267 603 269 616
263 587 240 531 212 470 246 542 300 656
353 761 333 701 309 645 291 611 329 666
344 652 304 542 331 543 359 497 497 562
475 475 509 501
660
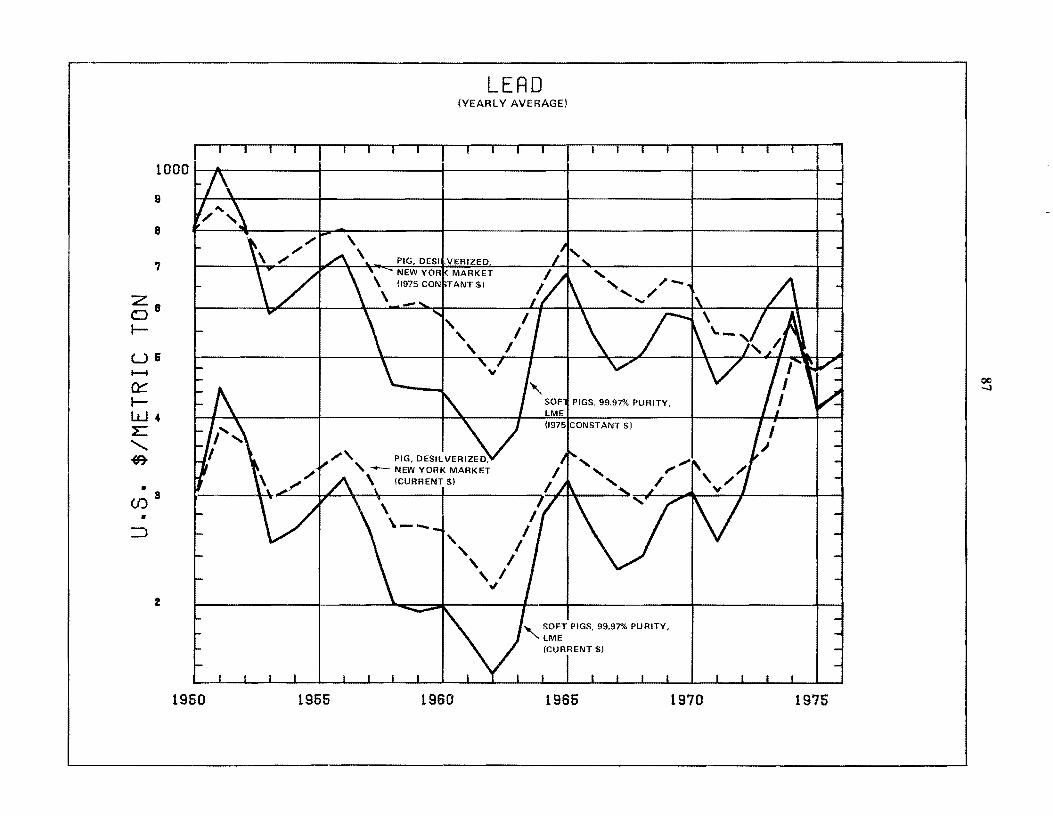
LEAD (YEARLY AVERAGE)
I r -1 n II .-. '1 10001 A I
9
8
'1
:z: 0 8
I-
us ~
a::: Iw. L
"" ~ •
(f)3
• :J
2
1950 1955
PIG, DESllVERIZED NEW YORI< MARKET (1975 CONi>TANT $,
,.., PIG, DESllVERIZED, , -- NEW YORK MARKET
\ (CURRENT $)
SOF1 PIGS, 99.97"10 PURITY, lME (l975IcONSTANT $)
I , I
, I , I
, I
"
1960
"'- SOFT PIGS, 99.97% PURITY,
" lME (CURRENT $)
1965 1970 1975
QC -.I
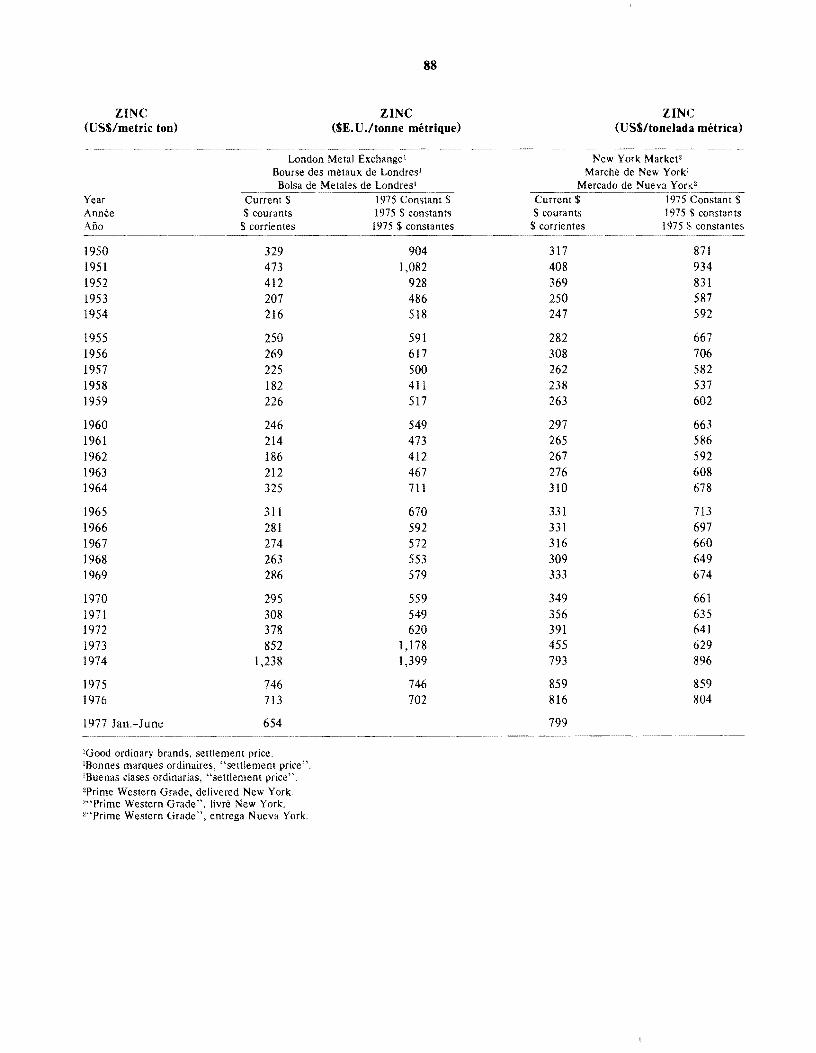
ZINC (US$/metric ton)
88
ZINC ($E. U ./tonne metrique)
London Metal Exchange' Bourse des metaux de Londresl
Bolsa de Metales de Londres' Year Annee Ano
$ $ courants
$ corrientes ~ .. --.. --.. ~.-~ .. ~ .. -~.---.. -~ ... --.. --... --...
1950 329 1951 473 1952 412 1953 207 1954 216
1955 250 1956 269 1957 225 1958 182 1959 226
1960 246 1961 214 1962 186 1963 212 1964 325
1965 311 1966 281 1967 274 1968 263 1969 286
1970 295 1971 308 1972 378 1973 852 1974 1,238
1975 746 1976 713
1977 Jan.-June 654
lGood ordinary brands, settlement price. lBonnes marques ordinaires, "settlement price". 'Buenas clases ordinarias, "settlement price". 2Prime Western Grade, delivered New York. 2"Prime Western Grade", livre New York. ""Prime Western Grade", entrega Nueva York.
904 1,082
928 486 518
591 617 500 411 517
549 473 412 467 711
670 592 572 553 579
559 549 620
1,178 1,399
746 702
ZINC (US$/tonelada metrical
New York Market" Marche de New York:
Mercado de Nueva York' -----------~-"--- .. ----Current $ 1975 Constant $ $ courants 1975 $ constants
$ corrientes 1975 S constantes .. --~----.----
317 871 408 934 369 831 250 587 247 592
282 667 308 706 262 582 238 537 263 602
297 663 265 586 267 592 276 608 310 678
331 713 331 697 316 660 309 649 333 674
349 661 356 635 391 641 455 629 793 896
859 859 816 804
799
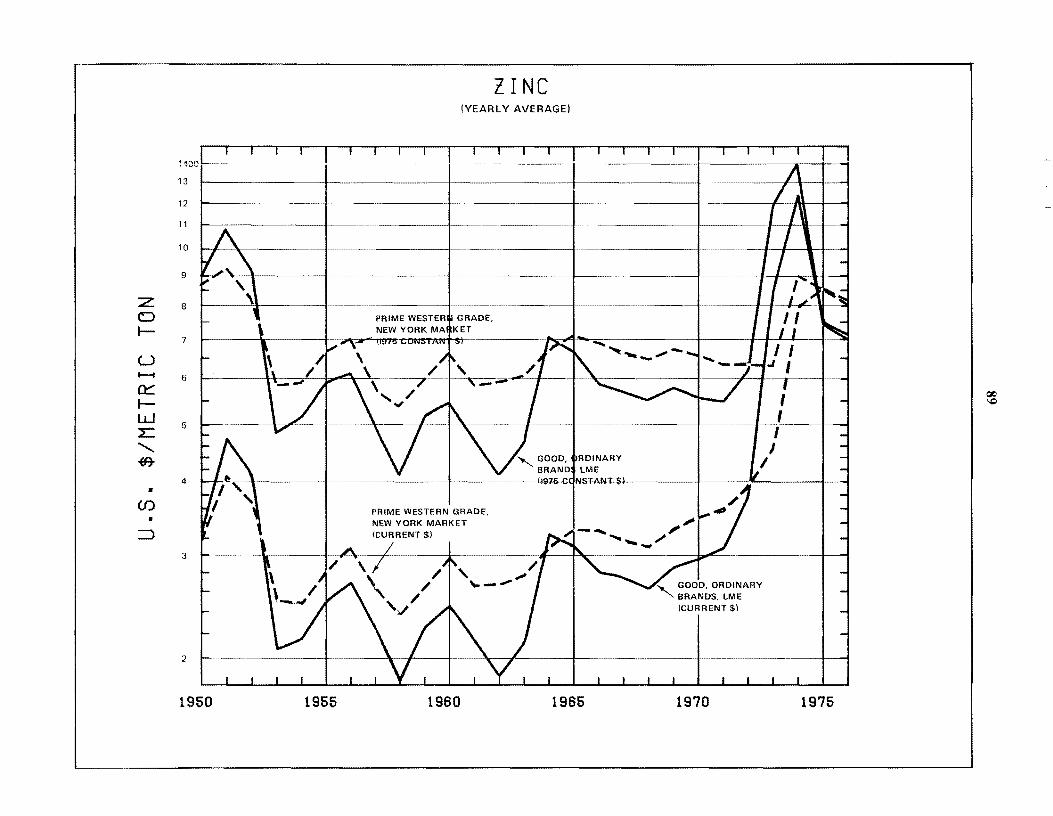
z o .--u
1400
13
12
11
10
9
8
7
~ 6
a::: .-W L ...........
~
• CD
• ::J
5
4
3
2
1950
ZINC (YEARLY AVERAGE)
I
PRIME WESTER~ GRADE, NEW YORK MAiKET
PRIME WESTERN GRADE, NEW YORK MARKET (CURRENT $1
-I. I-A-J / \/
\ / ',//
1955 1960
RDINARY lME
0979 CQNST-AN+-$I ~. -f
1965
"'" GOOD, ORDINARY " BRANDS, lME
(CURRENT $1
1970 1975
QIC) \C
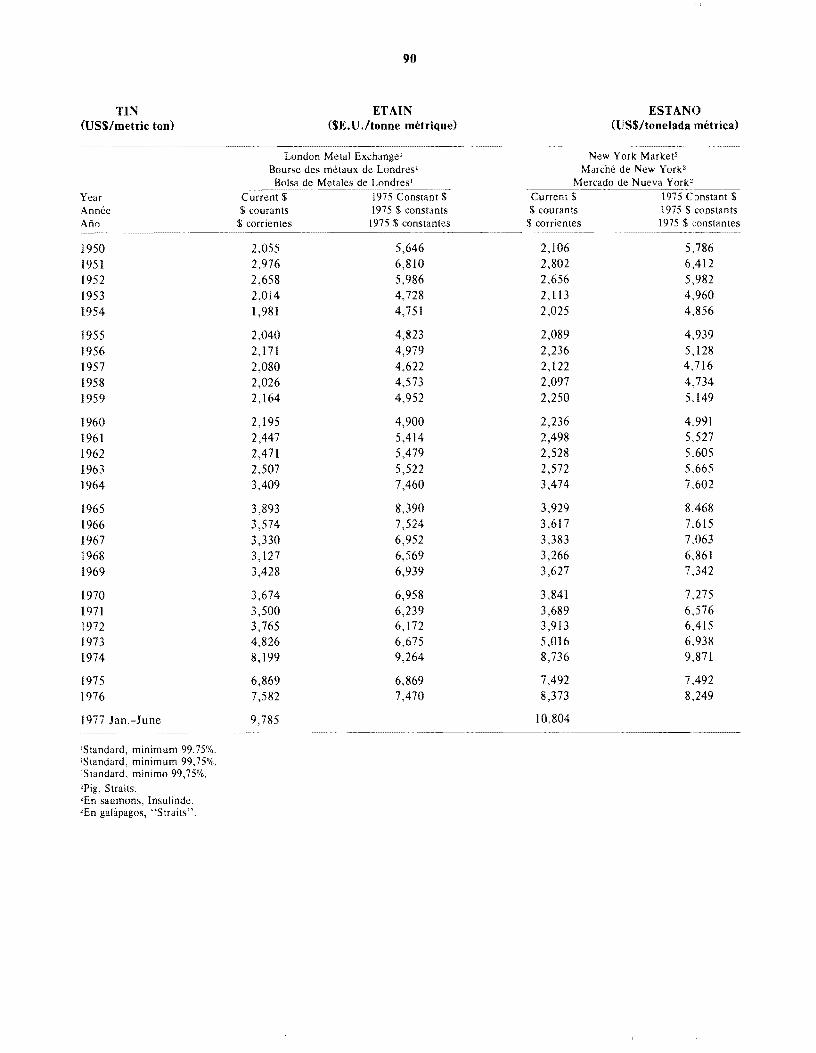
TIN (US$/metric ton)
Year Annee Ano
1950 1951 1952 1953 1954
1955 1956 1957 1958 1959
1960 1961 1962 1963 1964
1965 1966 1967 1968 1969
1970 1971 1972 1973 1974
1975 1976
1977 Jan.-J une
IStandard, minimum 99.75%. IStandard, minimum 99,75%. IStandard, minimo 99,75%. 'Pig, Straits. 'En saumons, Insulinde. "En galapagos, "Straits".
90
ETAIN ($E. U .Itonne met rique)
London Metal Exchange l
Bourse des metaux de Londres l
Bolsa de Metales de Londres l
Current $ 1975 Constant $ courants 1975 $ constanls
$ corrientes 1975 $ constantes
2,055 5,646 2,976 6,810 2,658 5,986 2,014 4,728 1,981 4,751
2,040 4,823 2,171 4,979 2,080 4,622 2,026 4,573 2,164 4,952
2,195 4,900 2,447 5,414 2,471 5,479 2,507 5,522 3,409 7,460
3,893 8,390 3,574 7,524 3,330 6,952 3,127 6,569 3,428 6,939
3,674 6,958 3,500 6,239 3,765 6.172 4,826 6,675 8,199 9,264
6,869 6,869 7,582 7,470
9,785 ....... _._---
ESTANO (US$/tonelada metrica)
New York Market' Marche de New York"
Mercado de Nueva York' ...... _----
Current $ 1975 C )nstanl $ $ couranls 1975 $ constants
$ corrientes 1975 $ constantes
2,106 5,786 2,802 6,412 2,656 5,982 2,113 4,960 2,025 4,856
2,089 4,939 2,236 5,128 2,122 4,716 2,097 4,734 2,250 5,149
2,236 4,991 2,498 5.527 2,528 5.605 2,572 5.665 3,474 7.602
3,929 8.468 3,617 7,615 3,383 7,063 3,266 6,861 3,627 7,342
3,841 7,275 3,689 6,576 3,913 6,415 5,016 6,938 8,736 9,871
7,492 7,492 8,373 8,249
10,804 .... _----.....
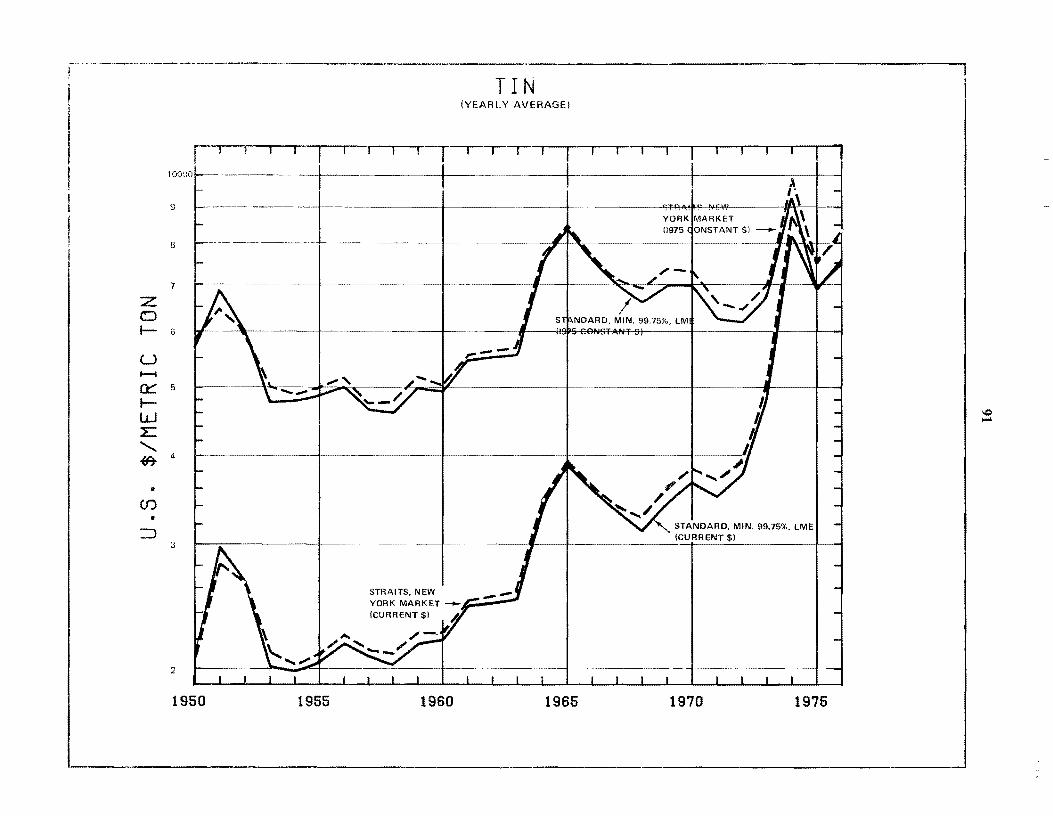
... "---,,~-------.---"-----.
TIN (YEARLY AVERAGE)
r--'--I I I I --, IOO()O~-·--"--··-t~---" ----\--
9
8
7
z o I- 6
U I-i
a:::: 5
IW E ......... -117- 4
• (J)
• =>
3
2
1950
STRAITS, NEW YORK MARKET _,&: - -(CURRENT $)
1955 1960 1965
STANDARD, MIN. 99.75%. LME (CURRENT $)
1970 1975
I.e::> ...
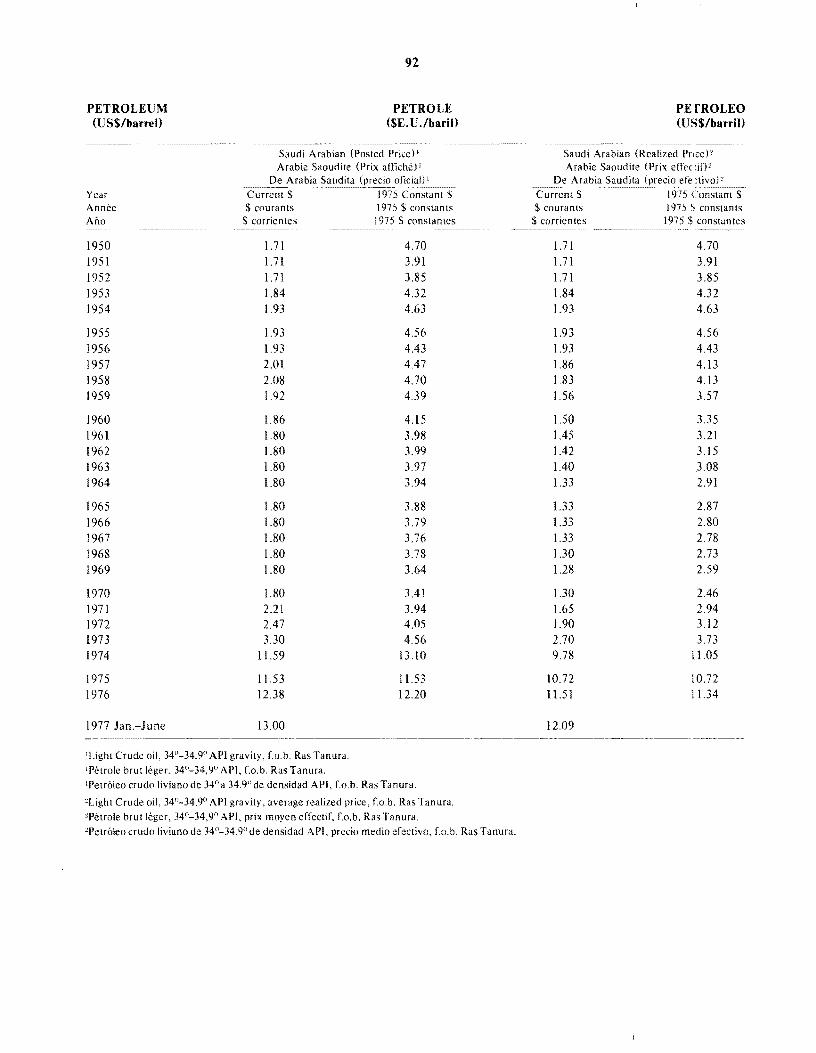
PETROLEUM (US$/barrel)
92
PETROLE ($E.U.lbaril)
PETROLEO (US$/barriJ)
--~~-- -- ....... -~--- .-. --- ....... --~ .. ----,-- ......... ~-~~. ---~ ......... ---~ .. , ... --- ........ ----.. ~-- ..... ----.-~-.... .
Year Annee Aiio
1950 1951 1952 1953 1954
1955 1956 1957 1958 1959
1960 1961 1962 1963 1964
1965 1966 1967 1968 1969
1970 1971 1972 1973 1974
1975 1976
1977 Jan.-June
Saudi Arabian (Posted Pricel f Arabie Saoudite (Prix arfiche)l
De Arabia Saudita oliciall [ Current $ Constant $ $ courants 1975 $ constants
$ corrie nte s 1975 $ constantes
1.71 4.70 1.71 3.91 1.71 3.85 1.84 4.32 1.93 4.63
1.93 4,56 1.93 4.43 2.01 4.47 2,08 4.70 1.92 4,39
1.86 4,15
1.80 3,98 1.80 3.99 1.80 3.97 1.80 3.94
1.80 3,88 1.80 3,79 1.80 3,76 1.80 3.78 1.80 3.64
1.80 3.41 2.21 3.94 2.47 4,05 3,30 4.56
11.59 13.10
11.53 11.53 12.38 12,20
13.00
'Light Crude oil, 34"-34.9° API gravity, Lo,b. Ras Tanura,
IPetrole brut leger, 34°-34,9° API, Co.b. Ras Tanura, IPetr61eo crudo liviano de 34° a 34.9°de densidad API, f,o,b. Ras Tanura,
"Light Crude oil, 34°-34,9° API gravity, average realized price, Co,b. Ras Tanura.
"Petrole brut leger, 34°-34,9° API, prix moyen effectif, f,o.b. Ras Tanura,
'Petr6leo crudo liviano de 34°-34.9° de densidad API, precio medio efectivo, Lo,b, Ras Tanura.
Saudi Arabian (Realized pf[ce)~ Arabie Saoudite (Prix effeciO'
De Arabia Saudita (precio efe,:tivo)" ...... -~~~--~
Current $ 1975 Constant $ $ courants 1975 S constants S corrientes \975 S constantes
1.71 4.70 1.71 3.91 1.71 3.85 1.84 4.32 1.93 4.63
1.93 4.56 1.93 4.43 1.86 4.13 1.83 4.13 1.56 3.57
1.50 3.35 1.45 3.21 1.42 3.15 1.40 3.08 1.33 2.91
1.33 2,87 1.33 2.80 1.33 2.78 1.30 2,73 1.28 2.59
1.30 2.46 1.65 2,94 1.90 3.12 2.70 3.73 9,78 11.05
10.72 10.72 11.51 11.34
12.09 ~~------....
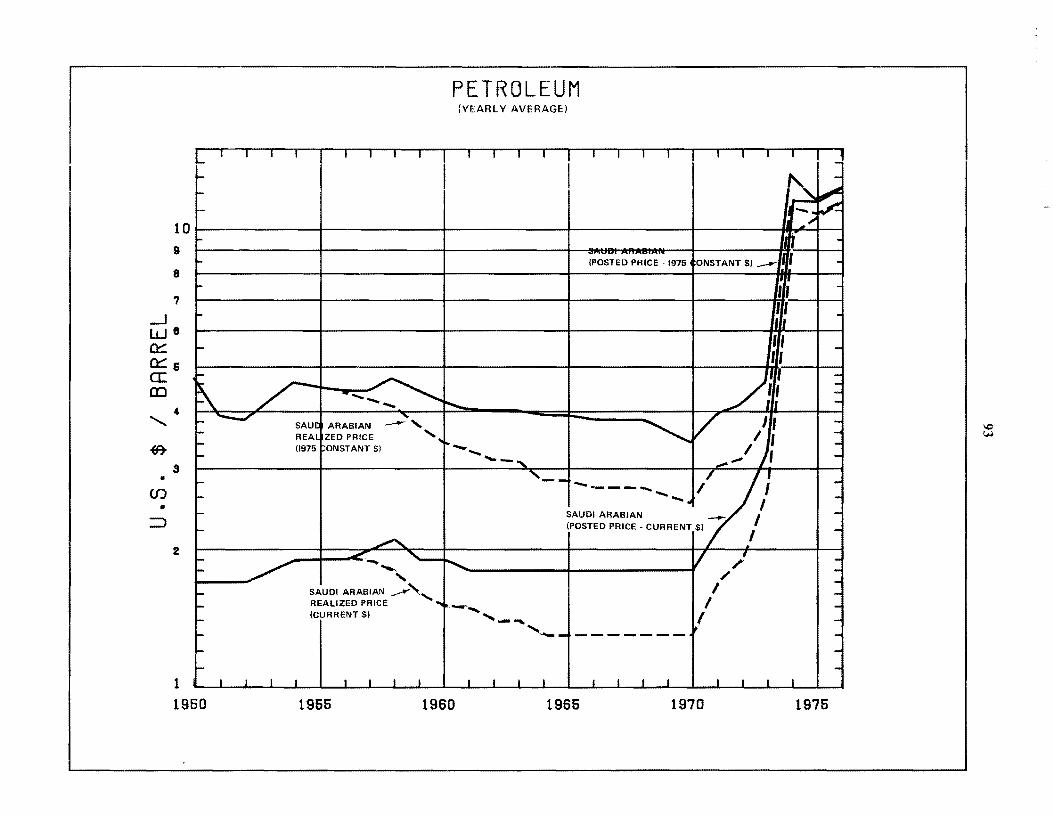
PETROLEUM (YEARLY AVERAGE)
[T ]
I I I 10 9
8
7
--1 We 0::: 0:::& cc CD
l-
~
I-
r I-
l-
l-
~
~ ,. I- ""'--'"
~
• (f)
• :::>
I-
I-I-
s r r-:-....
2 r-r-
... ... r-... ... -
1 1960
I I
/ --~ - ....... SAU[ ARABIAN ...-.:-, REAL ZED PRICE ' .. 11975 ONSTANT $) .. _-
...... _,
~ .- '---" ......... ,
SAUDI ARABIAN ,..........' ..... REALIZED PRICE .... --...... (CURRENT $) ...... - .....
I I I I I I I I I
1966 1960
~ -
~ ",' ) -
(POSTED PRICE 1975 ONSTANT $) __ n -II -
" -I II -" I -
/," ---
"" V I, -, , -
__ I ), --'__/;,' -------_, I -.. I -
SAUDI ARABIAN _ -(POSTED PRICE - CURRENT $) / -
I ,/ --/ -i I I -
( -"'-- ------- -I I I I I I I I I ,
1966 1970 1975
I,Q w
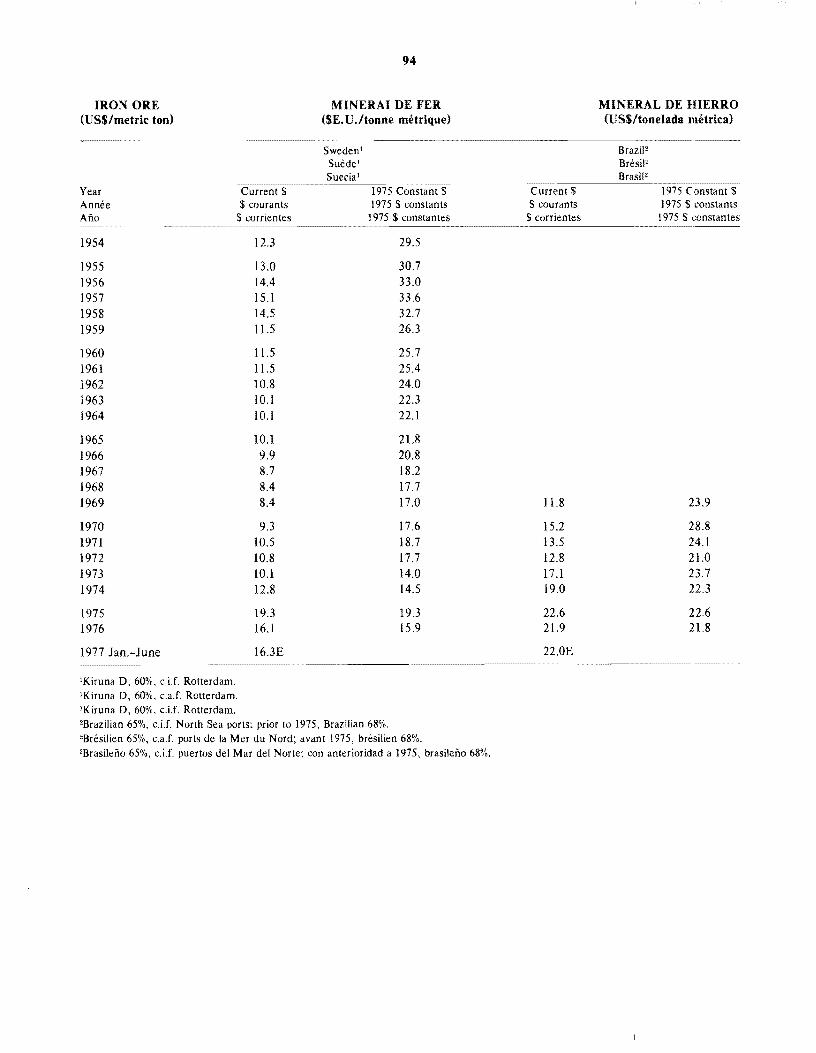
IRON ORE (US$/metric ton)
Year Annee
Current $ $ courants
Ano $ corrientes
1954 12.3
1955 13.0 1956 14.4 1957 15.1 1958 14.5 1959 ll.5
1960 11.5 1961 n.5 1962 10.8 1963 10.1 1964 10.1
1965 10.1 1966 9.9 1967 8.7 1968 8.4 1969 8.4
1970 9.3 1971 10.5 1972 10.8 1973 10.1 1974 12.8
1975 19.3 1976 16.1
1977 Jan.-June 16.3E
'Kiruna D, 60%, c.i.f. Rotterdam. !Kiruna D, 60%, c.a.f. Rotterdam. 'Kiruna D, 60%, c.iJ. Rotterdam.
94
MINERAI DE FER ($E. U .Itonne metrique)
Sweden! Suede' Suecia'
1975 Constant 1975 $ constants
1975 $ constantes
29.5
30.7 33.0 33.6 32.7 26.3
25.7 25.4 24.0 22.3 22.1
21.8 20.8 18.2 17.7 17.0
17.6 18.7 17.7 14.0 14.5
19.3 15.9
2Brazilian 65%, c,i.f. North Sea ports; prior to 1975, Brazilian 68%. "Bresilien 65%, c.a.f. ports de la Mer du Nord; avant 1975, bresilien 68%. 2Brasileiio 65%, c.i.f. puertos del Mar del Norte; con anterioridad a 1975, brasileiio 68%.
Current $ $ courants
$ corrientes
n.8
15.2 13.5 12.8 17.1 19.0
22.6 21.9
22.0E
MINERAL DE HIERRO mS$/tonelada metric a)
Brazil2
Bresil" Brasil2
Constant $ 1975 S constants
1975 S Gonstantes
23.9
28.8 24.1 21.0 23.7 22.3
22.6 21.8
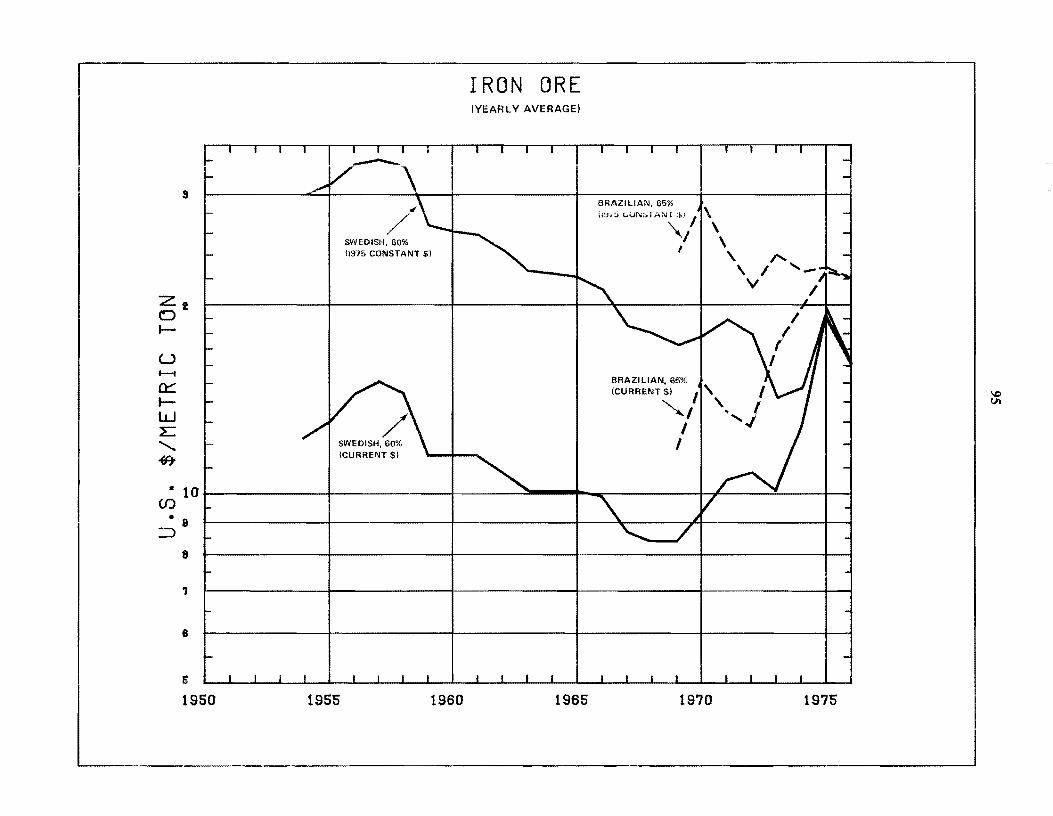
3
22 o I-
u ....... 0:::: IW L: "'~
" /' SWEDISH, 60% (1975 CONSTANT $)
SWEDISH,60% (CURRENT $)
IRON ORE (YEARLY AVERAGE)
BRAZILIAN, 65%
\1~/t> (..0[\;:;'1 AN~~/1\ \ I \
\ /' \ I '
V
BRAZILIAN, 65% l' I (CURRENT $) I , j
~I ", I
I
• 101 ", U') - I ~L 'V
• a ::::> 8
'1
8
Ii
1960 1965 1960 1965 19'70 1975
I,C VI
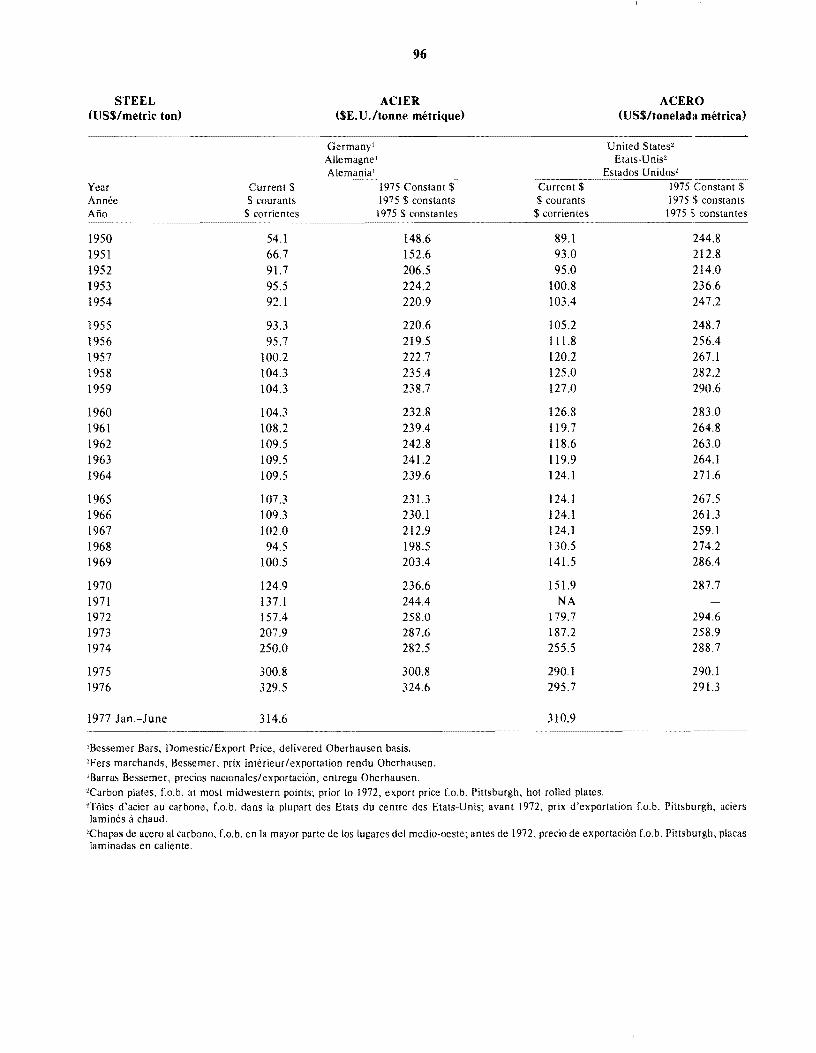
STEEL (US$/metric too)
Year Annee Ano
1950 1951 1952 1953 1954
1955 1956 1957 1958 1959
1960 1961 1962 1963 1964
1965 1966 1967 1968 1969
1970 1971 1972 1973 1974
1975 1976
1977 Jan.-June
Current $ $ courants
$ corrientes
54.1 66.7 91.7 95.5 92.1
93.3 95.7
100.2 104.3 104.3
104.3 108.2 109.5 109.5 109.5
107.3 109.3 102.0 94.5
100.5
124.9 137.1 157.4 207.9 250.0
300.8 329.5
314.6
96
ACIER ($E. U. Itoooe met rique)
Germany! Allemagne! Alemania!
1975 Constant $ 1975 $ constants 1975 $ constantes
148.6 152.6 206.5 224.2 220.9
220.6 219.5 222.7 235.4 238.7
232.8 239.4 242.8 241.2 239.6
231.3 230.1 212.9 198.5 203.4
236.6 244.4 258.0 287.6 282.5
300.8 324.6
'Bessemer Bars, Domestic/Export Price, delivered Oberhausen basis. lFers marchands, Bessemer, prix interieur/exportation rendu Oberhausen. !Barras Bessemer, precios nacionales/exportacion, entrega Oberhausen.
Current $ $ courants $ corrientes
89.1 93.0 95.0
100.8 103.4
105.2 111.8 120.2 125.0 127.0
126.8 119.7 118.6 119.9 124.1
124.1 124.1 124.1 130.5 141.5
151.9 NA
179.7 187.2 255.5
290.1 295.7
310.9
'Carbon plates, Lo.b. at most midwestern points; prior to 1972, export price Lo.b. Pittsburgh, hot rolled plates.
ACERO (US$/tooelada metrica)
--~
United States" Etats-Unis2
$ 1975 $ constants
1975 S constantes
244.8 212.8 214.0 236.6 247.2
248.7 256.4 267.1 282.2 290.6
283.0 264.8 263.0 264.1 271.6
267.5 261.3 259.1 274.2 286.4
287.7
294.6 258.9 288.7
290.1 291.3
2T6les d'acier au carbone, Lo.b. dans la plupart des Etats du centre des Etats-Unis; avant 1972, prix d'exportation Lo.b. Pittsburgh, aciers lamines Ii chaud.
:!Chapas de acero al carbono, Lo.b. en 1a mayor parte de los lugares del medio-oeste; antes de 1972, precio de exportacion Lo.b. Pittsburgh, placas laminadas en caliente.
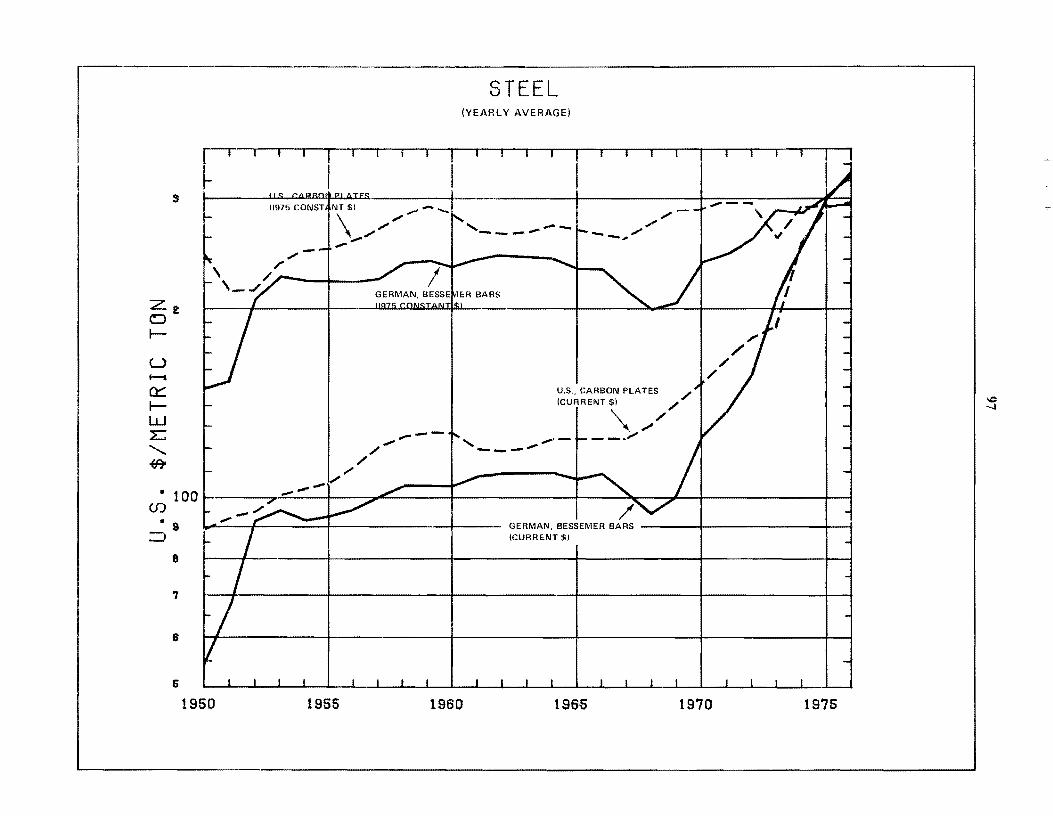
3
Zt o I-
U ...... 0::: IW E "'.f:FI
STEEL (YEARLY AVERAGE)
[ r I ~ ~
11975 CONST.(NT 8) .,.,.. ..........
~.,;".,;".,;" ---
u.s., CARBON PLATES / (CURRENT $) / '" ;'/ ..... -,---_ . .,;" .......... ~"... ---/."..
",/
• 100 I- ,... '- « (J) >:;rt c: >
• a ::J
8
.,
8
(;
1950 1955 1960
GERMAN, BESSEMER BARS (CURREcNT $)
196~ 1970 1975
'..c> -..J
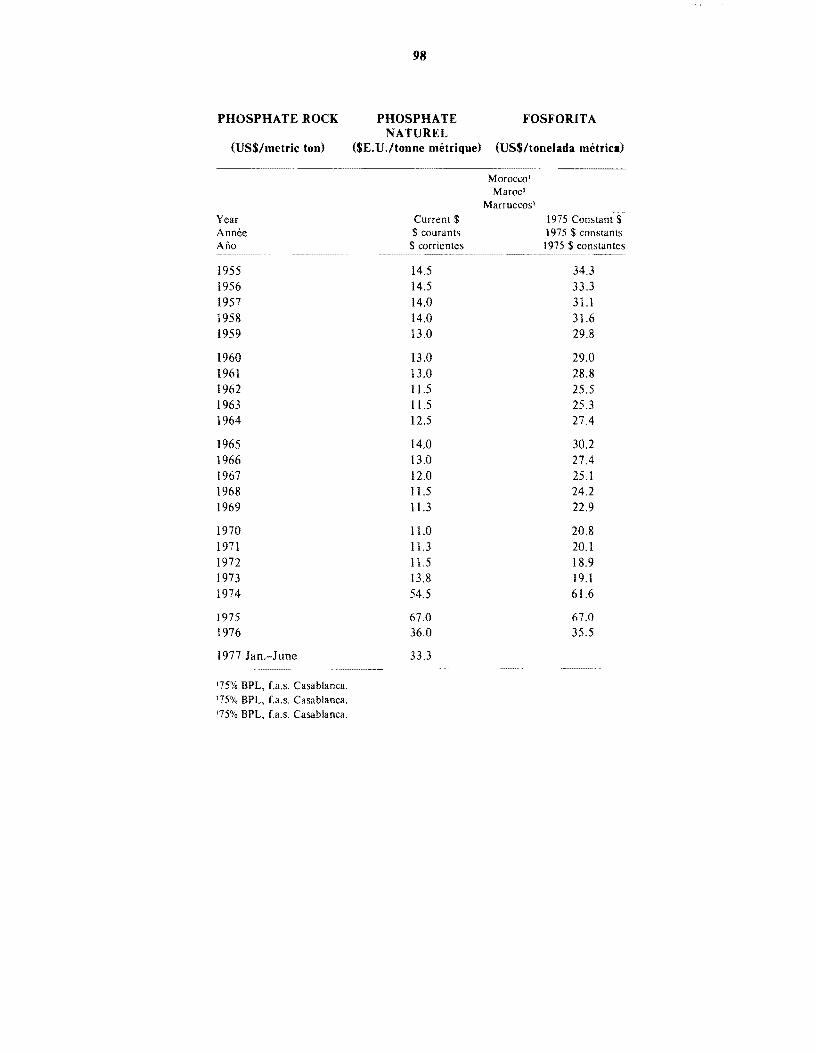
PHOSPHATE ROCK
98
PHOSPHATE NATUREL
FOSFORITA
(USS/metric ton) ($E.U./tonne mtHrique) (US$/tonelada metrical -- ........ --.~-- ..... -----
Morocco I Maroc l
Marruecos l
Year Current $ 1975 Constant Annee $ courants 1975 $ constants Aiio $ corrientes 1975 $ constantes
1955 14.5 34.3 1956 14.5 33.3 1957 14.0 31.1 1958 14.0 31.6 1959 13.0 29.8
1960 13.0 29.0 1961 13.0 28.8 1962 11.5 25.5 1963 ll.5 25.3 1964 12.5 27.4
1965 14.0 30.2 1966 13.0 27.4 1967 12.0 25.l 1968 11.5 24.2 1969 11.3 22.9
1970 11.0 20.8 1971 11.3 20.1 1972 ll.5 18.9 1973 13.8 19.1 1974 54.5 61.6
1975 67.0 67.0 1976 36.0 35.5
1977 Jan.-June 33.3 ---...... _-_._---....
]75% BPL, La.s. Casablanca. 175% BPL, La.s. Casablanca. '75% BPL, La.s. Casablanca.
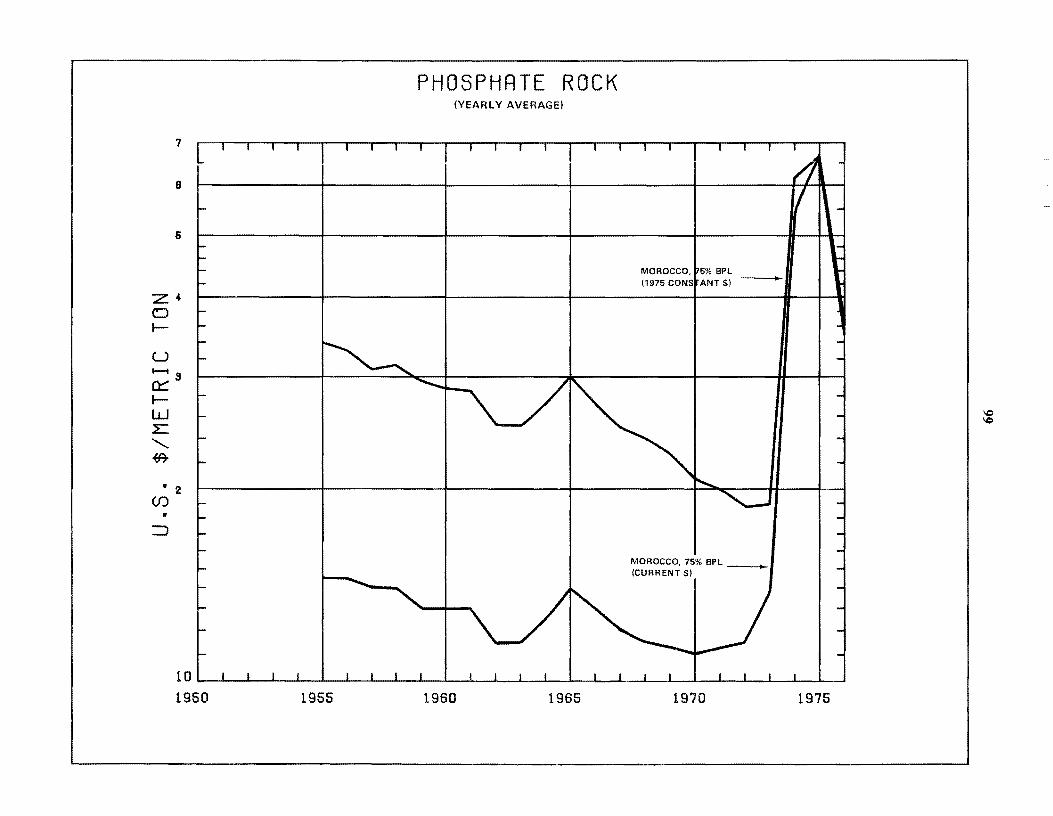
PHOSPHRTE ROCK (YEARLY AVERAGE)
7
8
Ii
~ MOROCCO, f5% BPL (1975 CONS ANT $) -
Z· 0 J--
U )-is 0::: J--W ~ , /' "\... " I -i I,C)
I,C)
E "-~
• 2 (j)
• :::J
~ MOROCCO, 75% BPL __ (CURRENT $)
10~' __ ~~~~~~ __ ~~ __ ~~~ __ ~~ __ ~~ __ ~-L~L_~~ __ ~~ __ ~~ __ ~-L~
1950 1955 1960 1965 1970 1975
L
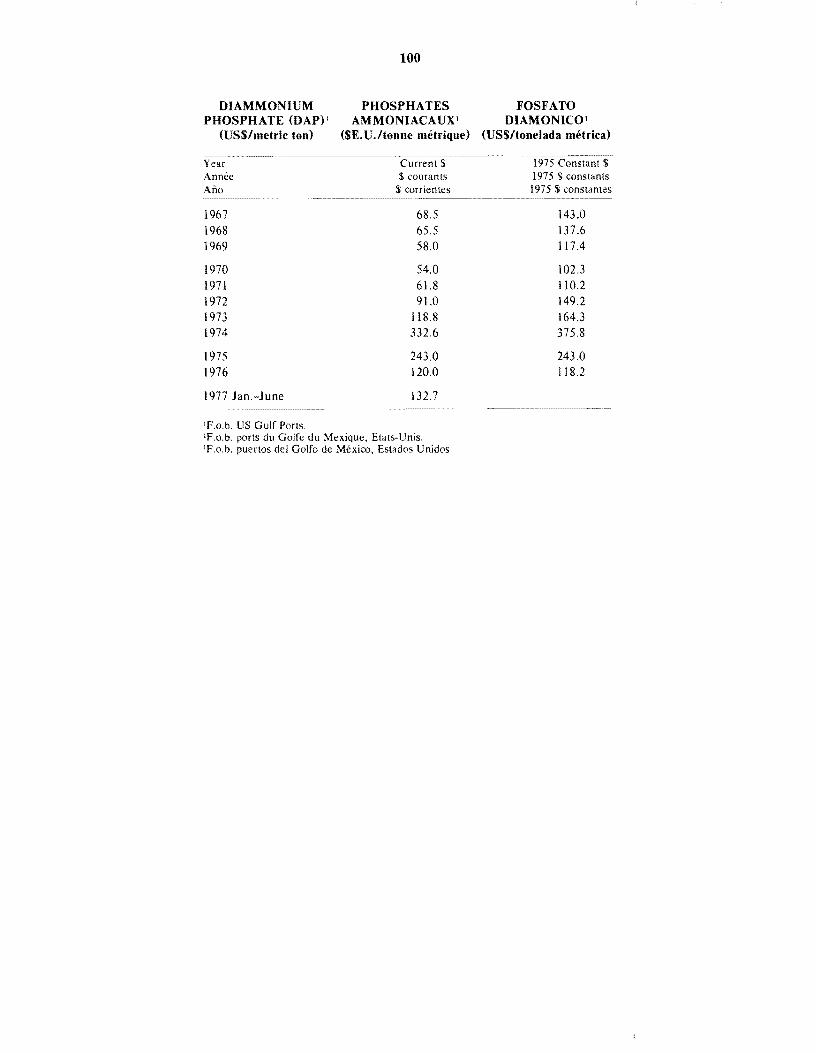
100
DIAMMONIUM PHOSPHATES PHOSPHATE (DAP)1 AMMONIACAUXI
(US$/metric ton) ($E. U.ltonne metrique)
Year Current $ Annee $ courants Ano $ corrientes
1967 68.5 1968 65.5 1969 58.0
1970 54.0 1971 61.8 1972 91.0 1973 118.8 1974 332,6
1975 243,0 1976 120.0
1977 Jan,-June 132,7
'F,o.b, US Gulf Pons. IF,o,b. ports du Golfe du Mexique, Etats-Unis, 'Fo.b. puenos del Golfo de Mexico, Estados Unidos,
FOSFATO DIAMONICOI
(US$/tonelada metrical
1975 Constant 1975 $ constants 1975 $ constantes
143.0 137.6 117.4
102.3 110.2 149.2 164.3 375,8
243.0 118.2
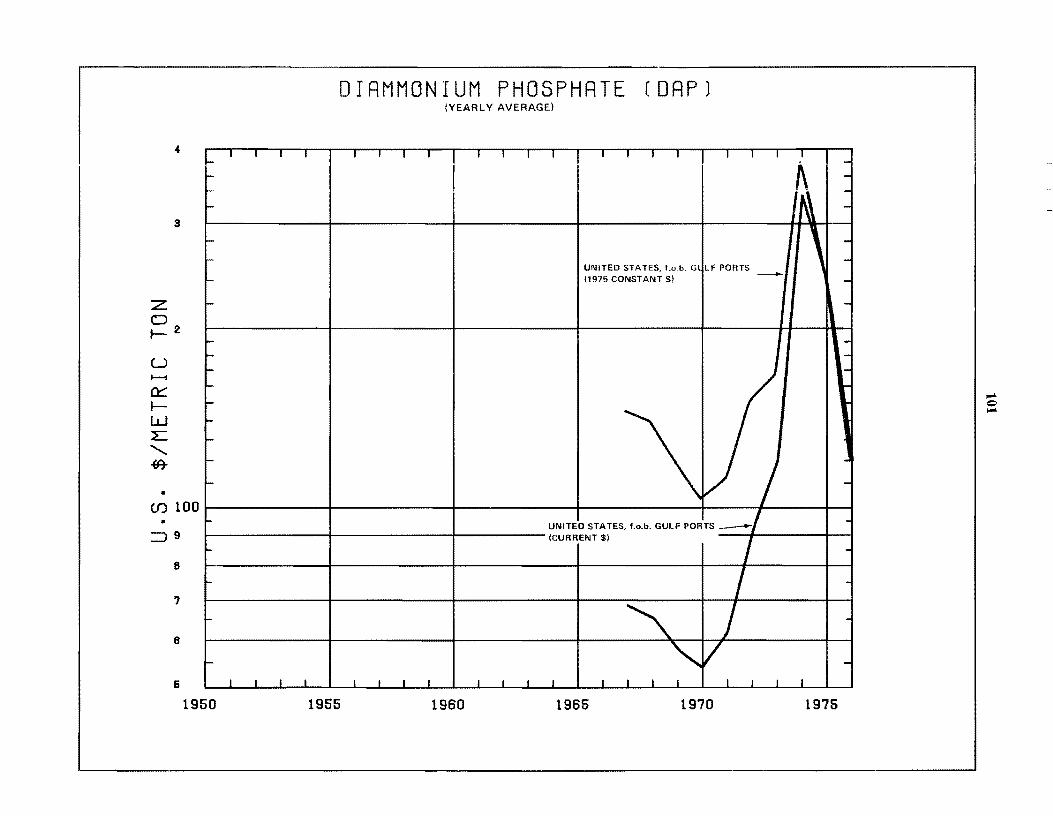
OIRMMONIUM PHOSPHRTE (ORP} (YEARLY AVERAGE)
" C'I } ...f
s
z o J-2
U 1--1
a:::: JW L: ......... -(A-
•
l-
I-
I-
-I-
I-
I-
I-
I-
I-'-
,... l-
I-
l-
'-
(J) 100 •
::J9
8
7
8
-
6
1950
I I I
I I
I I I L_ I L I I
1955 1960
I I~ ---
\ -UNITED STATES, f.c.b. Gl -
LF PORTS -(1975 CONSTANT $1 --
---
I . -
UNITED STATES, f.o.b. GULF PORTS _I (CURRENT $1 I -
/
'" J '" V -
I I I I I I I I I
1965 1970 1975
.... Q ....
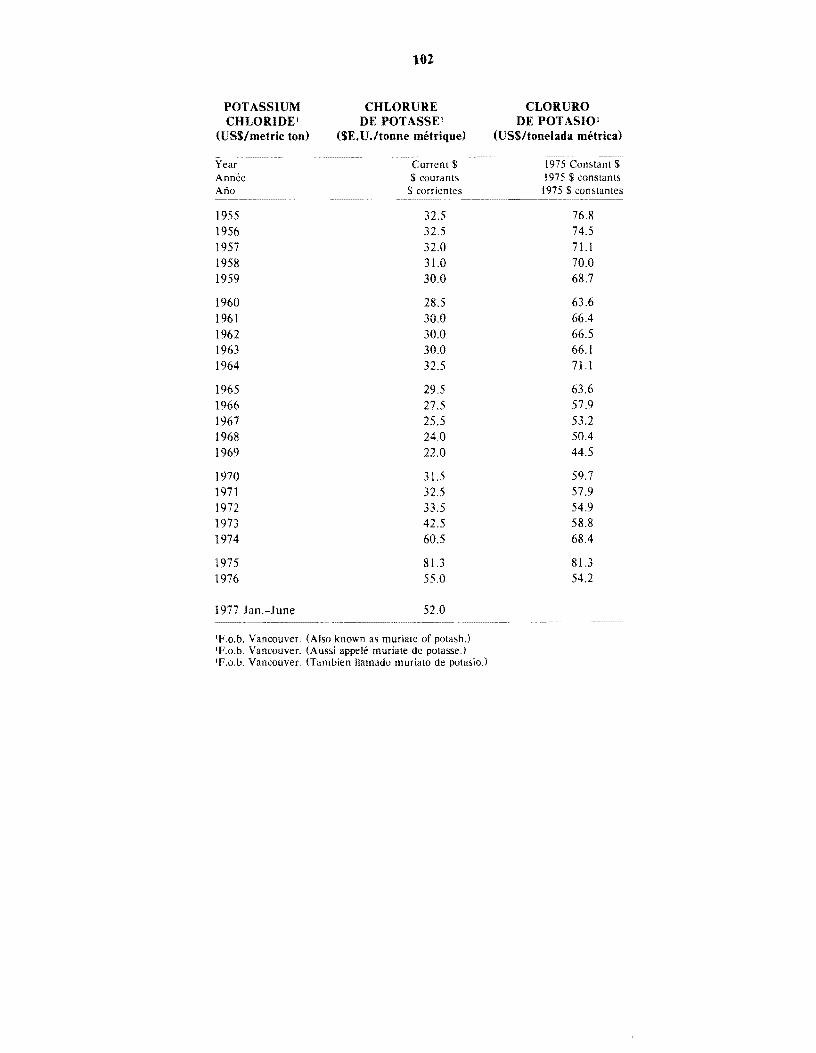
102
POTASSIUM CHLORURE CLORURO CHLORIDE! DE POTASSEI DE POTASIOI
(USS/metric ton) (SE. U.ltonne met rique) (USS/tonelada metrica)
Year Current $ 1975 Constant $ Annee $ courants 1975 $ constants Ano $ corrientes 1975 $ constantes
1955 32.5 76.8 1956 32.5 74.5 1957 32.0 71.1 1958 31.0 70.0 1959 30.0 68.7
1960 28.5 63.6 1961 30.0 66.4 1962 30.0 66.5 1963 30.0 66.1 1964 32.5 71.1
1965 29.5 63.6 1966 27.5 57.9 1967 25.5 53.2 1968 24.0 50.4 1969 22.0 44.5
1970 31.5 59.7 1971 32.5 57.9 1972 33.5 54.9 1973 42.5 58.8 1974 60.5 68.4
1975 81.3 81.3 1976 55.0 54.2
1977 Jan.-June 52.0
iF.o.b. Vancouver. (Also known as muriate of potash.) IF.o.b. Vancouver. (Aussi appele muriate de potasseJ IF.o.b. Vancouver. (Tambien llama do muriato de potasioJ
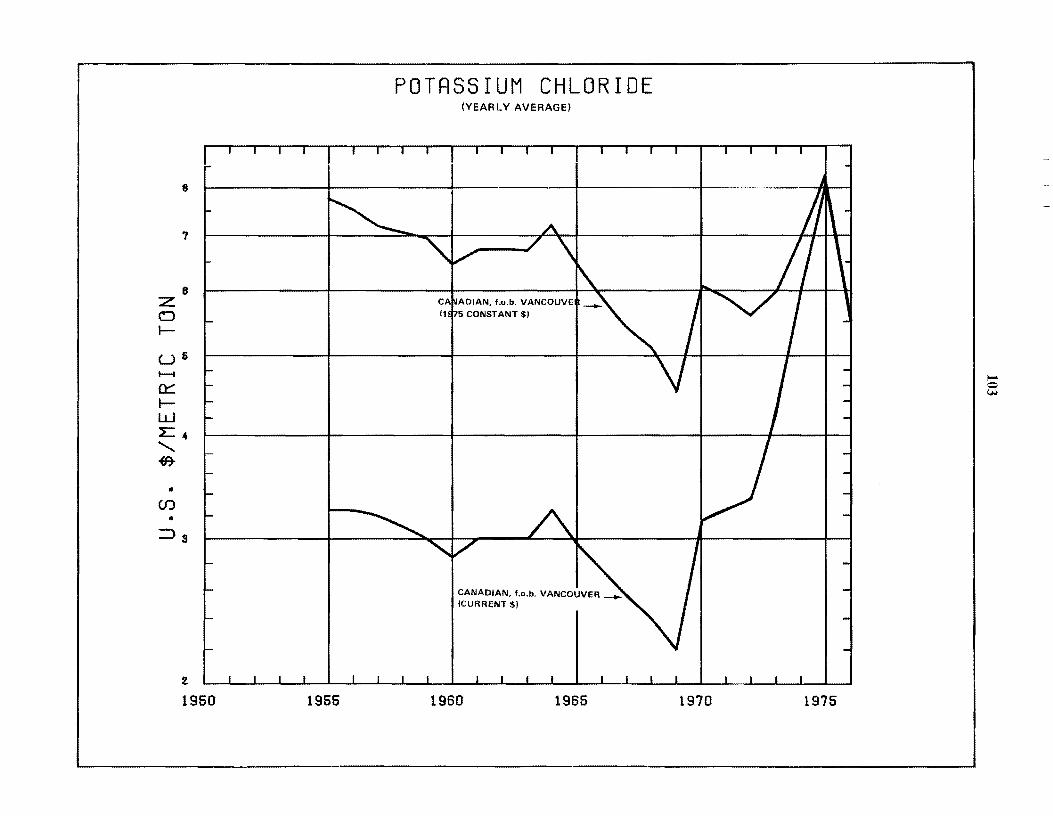
8
7
8 Z c::J l-
US 1--1
~ a:::: I-w L4
" -1FT
• en
• =>3
2
1950 1955
POTRSSIUM CHLORIDE (YEARLY AVERAGE)
CANADIAN, f.o.b. VANCOUVER _ {CURRENT $)
1960 1965
\/1 I I 1 I§
1970 1975
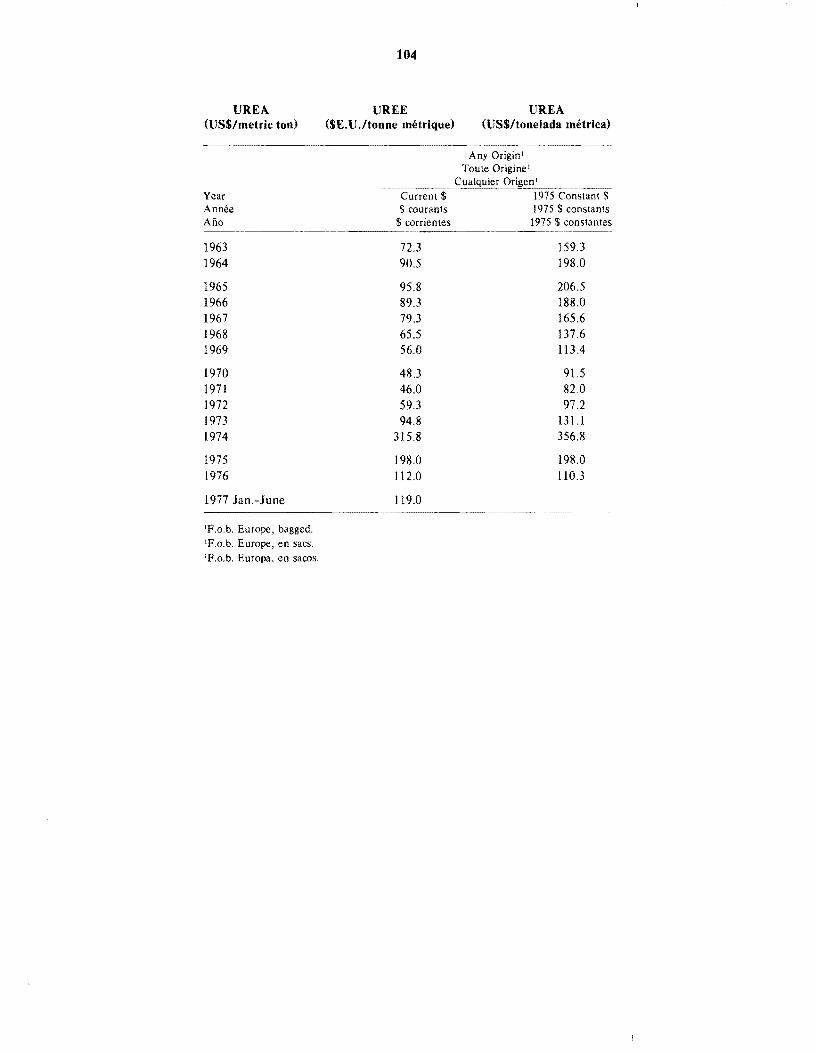
UREA (US$/metric ton)
Year Annee ABo
1963 1964
1965 1966 1967 1968 1969
1970 1971 1972 1973 1974
1975 1976
1977 Jan.-June
'F.o.b. Europe, bagged. 'F.o.b. Europe, en sacs. IF.o.b. Europa, en saws.
104
UREE ($E.U.ltonne metrique)
Current $ courants
$ corrientes
UREA (uS$ltonelada metrical
Any Origin! Toute Origine '
Constant $ 1975 $ constants
1975 $ constantes --------- ' -"--' ~,~--
72.3 90.5
95.8 89.3 79.3 65.5 56.0
48.3 46.0 59.3 94.8
315.8
198.0 112.0
119.0
159.3 198.0
206.5 188.0 165.6 137.6 113.4
91.5 82.0 97.2
131.1 356.8
198.0 110.3
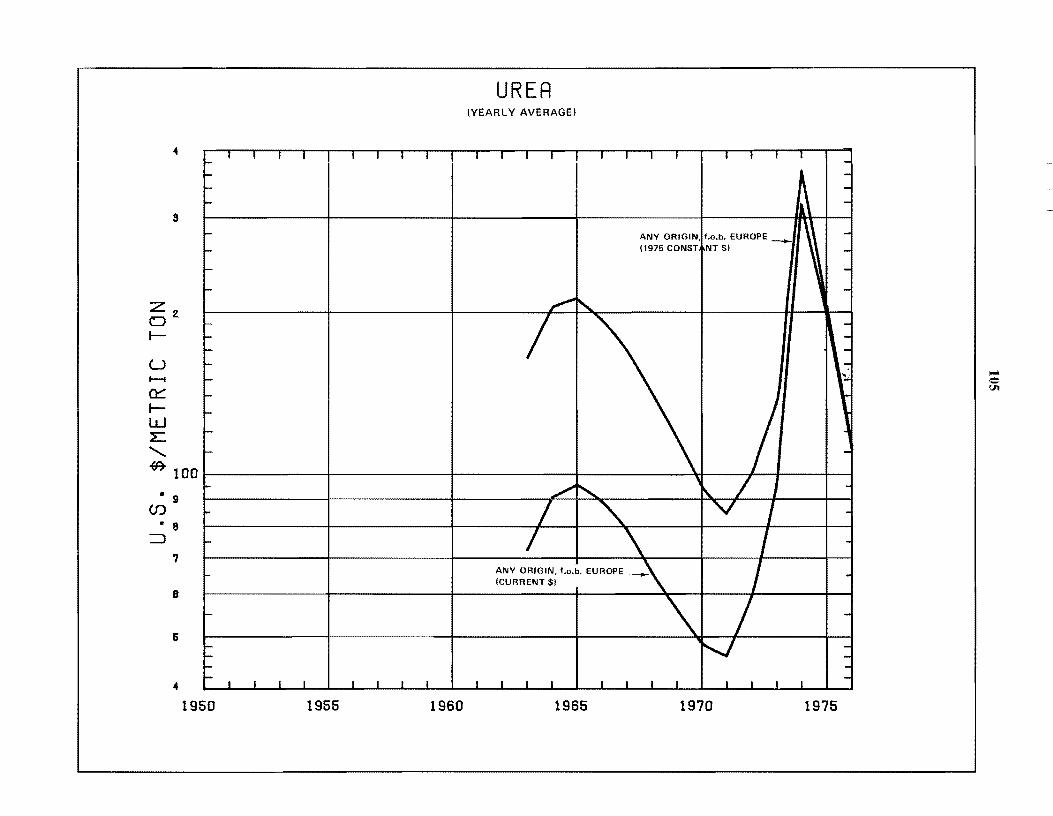
4
3
Zz <:)
J-
u t--i
a::::: JW L:
"'-
f- I
I-I-
I-
I-
f-
--
~
,... I-f-
f-
I-
f-
.... -
.fI7 100
• 9 (J)
• 8 => .,
8
-6
I-I-I-
4 I- I
1950
,
I
I I I I I I
I I I I I I
1955 1960
UREA (YEARLY AVERAGE)
I I I I
I I I I I I I I
ANY ORIGIN f.o.b. EUROPE _
(1975 CONST NT$I
~ " /
~ ",. "
, / ,
I " V I
/ \ / ANY ORIGIN, f.o.b. EUROPE _\ (CURRENT $1 /
~ / '" I I I I I I I L I I J
1965 1970
I
I
1975
----
----
----:. ~,
-
-
------
.... o Ul