Embed Size (px)
Citation preview

, I+ National Libary of Canada
Bibiiothdqth nationale du Canada
Canadian Theses. Service Services des theses canadbnnes
Ottawa. Canada K I A ON4
CANADIAN THESES
NOTICE The quality of this microfiche is heavily dependent upon the quality of the original thesis submitted for microfilming. Every effort has W n made to ensure the highest quality of reproduc- tion possible.
H pages are missing, contact the university which granted the 7
degree.
Some pages may have indistinct print especially if the original pages were typed with a poor typewriter ribbon or i f the univer- sity sent us an inferior photocopy. - -
Previously copyrighted materials (journal articles, published tests, etc.) are not filmed.
Reproduction in full or in part of this film is governed by the Canadian CopyrlgM Act, R.S.C. 1970, c. C-30.
THIS DISSERTATION HAS BEEN MlCROFlMED EXACTLY AS RECEIVED
La qualit6 de cette microfiche depend grandement de la qualit6 de la these soumise au mic.rofilmage. Nous avons tout fait pour assurer une qualit6 sup6rieure de reproduction.
S'il manque des pages, vefi~dlez communiquer avec I'univer- site qui a confer4 le grade.
I
La qualit6 d'impression de certaines pages peut laisser 4 dbsirer, surtout si Ids pages originales ont Bte dactylographibes. B I'aide d'un ruban us6 ou si I'universitt! nous a fait parvenir une photocopie de qualit6 inferieure.
Les documents mi font d6ja I'objet d'un droit d'atrteur (articles de revue, examens. publi&, etc.) ne sont pas microfilm6s.
La reproduction, meme partielle, de ce microfilm est soumise a la Loi canadienne sur le droit d'auteur. SRC 1970, c. C;-30.
LA T H ~ S E A E T ~ M~CROFILM~E TELLE QUE
NOUS L'AVONS REGUE

THE EFFECT OF AMP * PNP ON ATP HYDROLYSIS
'CATALSSED BY BEEF HEART S U B M ~ ~ O C H O N ~ R ~ ~ PARTICLES AND
~ a h a Kastelic
B.Sc., Simon Fraser University, 1983
THESIS SUBMITTED IN PARTIAL FULFILLMEhlT OF
THE REQUTREMENTS FOR THE DEGREE OF
MASTER 0 4 SCIENCE
in the Department
of
Chemistry
Tania Kdstelic 1987
SIMON FRASER UNTVERSITY
April 1987
All rights reserved. This work. may not be reproduced in whole or in pan. by photocopy
or other means, without permission of the author.

Permission has been granted to the National Library of Canads. to microfilm this thesis and to lend or sell copie-s of the film.
The. author (copyright owner) h a s r e . s e r v e d o t h e r publication rights, and neither the thesis nor extensive extracts from it may be printed or otherwise reproduced without his/her written permission.
L' autorisation a 6th iccordhe la ~iblioth&que nationale
du Canada de microfilrner cette th&se et de prgter ou de vendre ,des exemplaires du film.
L' auteur (titulaire du droit d'auteur) se rhserve . les autres droits de publication; ni la th&se ni de longs extraits de celle-ci ne doivent gtre imprimks ou ,autrement reproduits sans son autorisation 6crite.
ISBN 0 - 3 1 5 - 3 6 3 2 8 - 2

APPROVAL
-- Name: .Tania Kasteiic
Degree: Master of Science -
The Effect of AMP. PNP on ATP Hydrolysis
Catalysed by Beef Heart Submitochondrial Pa&les and F1-ATPase
Examining Committee:
Chairman: Dr. P. Percival
Associate Professor Chemistry
-
Dr. \A:. R. Richards Associate Professor Chemistry
Dr. fi. \.. ~lcssdr Professor 3 Chetmsuy
Dr. P. D. I3ragg5' I kstcrnal Examiner Professor Depanment of Biochemistry Uni\:ersity lof ~ r i u s h Columbia
Date Approved: // , / / /&?.I)
PART l AL COPYR l GHT L I C E N S E
I hereby g ran t t o Simon Fraser Un l ve rs l t y the r i g h t t o lend
my thes is , proJect or extended essay ( t h e t i t l e o f which i s slown \ below)
t o users o f the Simon Fraser Univers i t y L l brary, and to make p a r t i a l 'or
s i n g l e copies on ly f o r such users o r I n response t o a request from the
l i b r a r y o f any o ther university, o r o ther educational I n s t i t u t i o n , on
i t s own behalf o r f o r one o f I t s users. I f u r t he r agree t h a t permission
f o r m u l t i p l e copying o f t h i s work f o r scho la r l y purposes may be granted
b~ me o r the Dean o f Graduate Stud les. I t i s understood t h a t copying
or p u b l i c a t i o n o f t h i s work f o r f l nanc la l gain sha l l not be al lowed
wi thout m y ~ w r i t t e n permission.
T i t l e of Thesis/Project/Extended Essay
The E f f e c t o f AMP-PNP o n ATP H y d r o l y s i s C a t a l y s e d by
Beef Heart S u b m i t o c h o n d r i a l P a r t i c l e s a n d F,-ATPase
Author: I I
( s i gna tu re )
T a n i a Kastel ic
A p r i l 15, 1987
(da te )

The mechanism of adenosine-5' -a;iphosphate (ATP) hydrolysis catalysed by beef
heart submitochondrial particles (SMP) and soluble Fl-ATPase was studied using the
.ATP anal'og, adeaylyl imidodiphosphate (AMP* PNP). AMP* PNP inhibition of ATP
hydrolysis by energized SMP was shown to be insensitive to increasing concentrations
of the hydrolysis produc( adenosine-5' -diphosphate (ADP), under the conditions used.
Hyperbolic competiuve inhibition was also observed which was consistent with a model
In which binding of two AMP* PNP. molecules occurred, both competitive with respect i
to AT'?. The &ssociation constants (Ki and Ki,) were determined to be 0.58 ctM and i
19 p M , respectively.
Whereas AMP* PNP inhibilion yielded linear steady-state rates of ATP hydrolysis -
when catalysed by energized SMP, timedependent inhibition was observed with a
non-energized SMP and F,-ATPase. The timedependent inhibition was reversible as -L
shown when treated enzyme was diluted into an assay medium, either directly or after
the treated enzyme was centrifuge gel filtrated through a ,Sephadex G-50 column to
remove ftee or loosely bound inhibitor. Whereas non-energized SMP recovered virtually
all (9%) activity during the time' course of the assay. Fl-ATPase recovered only 6%
activity. The remaining. inhibition is .attributed to AMP* PNP bound at a high affinity - site. The rate of ATP hydrolysis was shown to decrease exponentially during
~ m e d e p e n d e ~ l t AMP* PNP inhibition. and the recovery of activity also increased
exponentially after removal or dilution of AMP* PNP.
AMP* PNP inhibition of F,-ATPase acqvity also displayed hyperbolic competitive
inhibition, consistent with the binding of a single AMP- PNP molecule with a Ki of

DEDICATION
To Mom, Dad, and Willy
Their love, encouragement support and &!uihance is my suength and foundation.

QUOTATIONS
"The reasonable man adapts himseif to the world; the unreasonable one persists in uying,to adapt the world to himself. Therefore all progress depends on the unreasonable man."
George Bernard Shaw
"Of course women are the most unreasonable of all, n'est pas?"
Tania Kastelic

ACKNOWLEDGEMENTS
I would like to gratefully acknowledge the people in the lab who gave iheir?
time unselfishly, and helped with the mitochondria1 preparations. This work could not
have been started without them. \ ,
To a special member of the lab group, Dr. Seeloch Beharry, who, in addition to . .
helping with the F, preparations, was alwdys there as a friend.
I
But most of all, 1 would liko to thank Dr. Michael J. Gresser, who gave me
the opportunity to work in the field of enzyme kinetics and membrane bioenergetics* @ ---
an undergraduate. Throughout this entire experience, he was always available to offer
encouragement and support, while providing assistance. and guidance with his knowledge
and expertise.

TABLE OF CONTENTS
~pproval .......................................................................................................................................................... ii
ABSTRACT ........................................ ........................................................................................................ iii
DEDICATION ............................ ; ........................................................................................................... iv
QTJOTATIONS ......................................................... ................................................................................... v
R ACKNOWLEDGEMENTS ................................................................................................................ vi
List
Lisr
I.
11.
111.
IV.
v .
of f i les ............,....... . ........................................................................ : ................................... ix
of Figures ....................................................................... .................................................................... $ X 1
ABBREVIATIONS ..'. ...................................................... * ........................................................... 1
INTRODUCTION .......................................................................................................................... 3
OBJECTIVES ............ ................ .......... ... ...................... ... ............ .,..... .. ............ ...................... .......... 10 .D
EXPERIMENTAL PROCEDURES ................................................................ . ......... . ........ 11
MATERIALS .................................................................................................................................. ' 11
METHODS .................................................................. ................................................................ 12
RESULTS AND DI%USSION ............................................................................................. 21
Effect of ADP on AMP PNF Inhibition of Energized SMP ................................... 21
Determination of Ki for AMPPNP Inhibition of Energized SMP ....................... . 36
The Effect of AMP . PNP on Non-energized SMP ...................................................... 51 -
Effect of AMP-PNF on Soluble F,-ATPase ................................................................ 73
Determination of Ki for AMPWPNP Inhibition of Soluble F,-ATPase ................ 84
VI. SUMMARY AND FUTURE WORK ................,........................................................... . . 99 -~ ,
VI1. APPENDICES ............................................................................................................................. 101
APPENDIX 1 ........................................................................................ : ................................. 101
APPENDIX 2 ................................................................ .............................................................. 103 i APPENDIX 3 ............................................................................................................................ 107

.................................................................................................................. APPENDIX 5 119
P viii

LIST OF TABLES
Table
1 Reactivation of F,-ATPase Activity .-............ . ....................................................................... 81

LIST OF FIGURES
Figure
................................................................ 2 Method of Preparing SMP and F, ....................... : 5
......................................................................................... 3 Structures of ATP and AMP- PNP 7
4 Diagram of a Column Assembly Used for ReacGvation Studies ............................ 14
5 Effect of PK on AMP* PNP Inhibition of ATP ~ ? d r c l ~ s i s by &ereiLed 1- SMP ............................................................................................................................. .- ...... ,, 3 r
. ................................................................................ 6 Lmeweaver-Burk Plot fo: PI( Activity 24
,.?
7 Steadystate ADP Concentrations as a Function of PK Concentration ................ 26
8 Effect of ADP o n ' AMP-PNP Inhibition of ATP 2s
9 .. Effect of ADP on AMP* PNP Inhibition of A T Hydrolysis Catalysed by 2 d ............................... ................................................................................... Energized SMP : 3 1
\
............................. Po Possible Mechanism lnvoivine IF, Interaction with F,F,- ATPase 34
a ....................................... 11 Population of F,F,-ATPase Acting as a Coupling Enzyme 3
12 Lineweaver-Burk Plots for AMP- PNP lnhibition of the ATPase Activit) of Energized SMP ................................................................................................................... 37
13 Secondaiy Plot for AMP- PNP Inhibition of the ATPase Activity of ......................................... Energized SMP ......................................................................... : 39
14 Proposed Mechanism for AMP* PNP Inhitition of ATPase Activity: Modc! 1 . 4?
15 Non-Linear Regression of the Rate Expression Deriv for Model 1 r o Fig. 13 ......................................................................... ................................................. 4J J-
'16 Proposed Mechanism for AMP* PNP Inhibition of ATPase Activity: Model ? . 47
17 Non-Linear ~egr&ion of thL Rate Expression Derived for Model 2 to Fig. 13 .............. , ................................................................................................................. 44
4
18 Effect of AMP-PNP on ATPasc Activity of Non-Engergited SMP ...................... 5 2
19 Sample Non-Linear Regression Fits for the Inactivation of ATPasc Activity .................................................................................................................... by AMP* PNP 5
20 Effect of Preincubation Time of AMP* PNP with Non-Energized SMP .............. 57

Theoretid AMP* PNP Inhibition Curves: A Fusctim of Pnhbadon Time .. 59
Timehqxndenr AMP* Phi inhibition of ATP Hpbrolysis ' Catafpw! by Non-tnergid SMP ,-,.--+- --..-----.-I 62
Rmclisation of ATPasc Activity b$ Nan-Energized S M P : ATP Pmenr in hinhtwtion Medium ,.+...-,...-- ,.-- ............-.......... ............................................... 64
Reactivation of ATPase Activity Catalysed by Non-Energized SMP: ATP Omitled From Preiacubation Medium ............--........-~.......~..-.......................... 67
Reactivation of ATPase Activity: fnhibiuxl SMP Added D i r ~ l f y into Lhe Aswy bicdiun; .......................... ..........(..,........................................ ............................. 69 -
Sample Non-Lanear Regression Fils w Figs. 23 - 2-5 / C m t 2 ) .........,............-. 71 s
?mt-Ikpendcn: AMY- P P Ifihibitian of ATP Hydrolysis Caralysed b:; F: ..... 74
Estenr AMP* PNP Inhibition of F,-ATYase Acfit+ify as a ~uncGm of Incubtian Time .............-............--..........................................-.-............................... 76
Ractivatim of .hTPase Activir). by F:: ATP in hyincubuon Medium ............. 79
Apprrnl Raw Canrtants for F: Inactivatior.: A Functi~n of A.MP* PNP md ATP Concenuation .........................-.......................... , ...............,............................... $2
AMP. PNP Coflcennaticms ,., ..-..-...........-............................................................. . 85
Scmndpr) P b i for AMP- PW Inhibition of F:-ATPw &riry Low AMP. PHP Comuatiw .................... :.., .................................................................... 87
........................ I~ntwcaver-Burk P las for AMP..PNP Inhibition of F,-ATPass ., .,.. 89
Ncm-l~ncar Fit of r h e Kate Expression l k r i v e d for M d t l i to Fig. 34 ........ 94
Prqmecl Mecharusm fo: AMP. PNY Inhibition of ATPass .4ctivity: Single WC Muidple Sire Binding .... , .....................+........................................................ 97

- C)UPI"ERl
ABBREVUITIONS
.4MP/ADP/ATP adenosine 5 ' - mmo- /di-[uiphmphate
AMPa PNP adenylyl imidodiphwhaw
AP3A P'. P!. diadenosine penraphcsphatc
3-NAD'/$-NADH 3-nicotinarnide adcninc dinucleoticic (oxidized/rcduced)
= ~ -.73.kDP/3-fr;ADPH ,? -nicotinamide adenine dinucleoude phosphaw
(oudizcd./reduced; I
bovine serum albumin
F : ' soluble ATPaxt -/
FCCP a carhnyicyanide p-tnfluoromcthox)
GTP puanosine 5 ' -mpnospharc
HK hexohnase
naolxal ArPase inhibiror
mosine 5 ' -mphospharc
NAP,-AMP- P?W .h~-4-atid~2-niuophenyl-~i -bminobutyr).i-AMP- PNY
PCP pe~ushiorophenol
PEP " phosphoeno! p\;ruvare
inorganic' phosphalc

SMP
TNP-ATP
pyruvate kinase
subrni tochondrial particles *
2 ' , 3'-&(2, 4, 6-mniuophenylkATP
m s (h ydroxymeth yl) aminomethane h ydrochioride
Tris (h ydroxymethyl) aminomethane/acetate
Much effort has' been devoted to elucidating the mechanism of ATP synthesis
ca'alysed by the mitochondria1 ATP synthase complex. The ATF' symbse complex.
I m t e d on the inner membrane of the mitochondrion (mauis side), is an inuicate - - - X.
oligomeric protein' composed of a . lipid soluble fraction, FG. and a soluble fraction. F, 1
(Fig., 1 - ref. 1). Both fractions are themselves of multisubunir complexity. The
stoichiometr) of F, is aib,c,. ,,. which varies dependmg upoc the source and method
of extraction. I t is thought that not only does F, serve as an anchor for' F,, bur .that
i t also contains a pore through which protons pass duringyATP synthesis and
hydrolysis. The catalyuc moien. F,, contains five subunits: a(55.2 kD). P(51.6 kD).
1(30.1 kD), b(l5.1 kD). and c(5.7 kD) arranged in a o ,dI-T6 c stoichiometry (1. 2).
'i
F,, prepared as outlined in Fig. 2 (adapted from .ref. 3). catalyses the
Me'--dependent hydrolysis of ATP to ADP and inorganic phosphate (Pi). Recently i r
has been shown that F, isolated from a number of sources can synthesize ATP.
although the release of product does not occur (4 - 9). Although solyble F,-ATPase
cannot catalyse net ATP synthesis, when reconstituted into F, depleted submitochondnal
panicles. it is apab le of synthesizing ATP in the presence of an oxidizable substrate
e.g. succinate or NADH (10). Utilizing an elecuochemical gradient (consisting of two
components: the transmembrane potential-separation of charge, and the pH gradrent)
which is formed upon oxidation of electron transport chain substrates or the hydrolysis
of ATP, SMP can couple this electrochemical gradient to ner ATP synthes~s.
Binding studes have revealed the existence of six nucleotide binding sites on F ,
(11). The catalytic sites, known to hydrolyse a number of nucleotide mphosphates

Figure 1

submitochondrial particles
0 Fl depleted SMP
Figure 2
Method of Preparing SMP and F,

( A T , .e-ATP, TNP-AT, GTP. ITP, 2-azido-ATP, 8-azido-ATP) (12 - 15). have been
localized to the @-subunits, whereas the "regulatoryw sites are highly specific for
adenine nucleotides (AD(T)P, 2-azido-AD(T)P. and AMP* PNP). Labelling studies using
L~ azido derivatives of adenine nucleotides, support the hypothesis that the regulatory sites
are located at the a/@ interfaces (16). Binding studies to the isolated p-subunit From.
Rhdospirillum mbrum F,, have shown that the ,!?-subunit contains two nucleotide
binding sites; one high affinity site (Kd for A T and ADP of '4.4 and 6.4 clM,
respectively-independent of MgJ*j, and one low affinity site (Kd for ATP of
200 pM-Mgi--dependent) (17). In contrast, the isolated a-subhit from E. coli, has '
been shown to contain only one adenine nucleotide binding site (Kd for ATP and
2. ADP of 0.1, and 0.9 uM, respectively) (18). Kmetic and oxygen labe Ing experiments
in the presence of Mg2*, show that adenine nucleotide's exhibit negative cooperativity in
bindmg to the catalytic sites and positive cooperativity in catalysis (19). It has also
been shown that the cooperative effects of ATP can be eliminated by bicarbonate
which is thought to accelerate ADP release once Pi has dissociated (20). I
In order to elucidate the mechanism of mitochondria1 ATP synthase complex,
substrate analogs. photoactivatabie substrate analogs, as well as radiolabelled substrates
and analogs have been extensively used to study Ltalytic mechanism, binding properties
and subunit interactions (21). One such ATP substrate analog is adenylyl
~midodiphosphate (AMP* PNP), shown in Fig. 3.
Synthesized by l'ount et al. (22) in order to study the mechanism of myosin *
ATPase in muscle (23), AMP* PNP is used extensively as an .4TP analog to study
mitochondria1 ATPase. It was once thought that F, was incapable of hydrolysing the
phosphoramidate linkage, yet able to bind AMP* PNP and A T , its normal substrate, -
with equal efficiency (24). However, recent studies have s h o w that not only is

AMP. P-NP
Figure 3
Structures of ATP and AMP* PNP

AMP* PNP: hycirdysed WG~+-ATP~S~ from sarcoplasfiric reticulum (251 and E. cdi
alkaline phosphatase (22). but also by F,-ATPase, although slowly in thkpmsence af
Although inhibition studies with F1 and SMP have shown AMP- PNP to be a
strong competitive inhibitor of ATP hydrolysis (11. 27 - 31). with the dissociation
constant (Ki) for -the enzymeinhibitor' complex reported to be as low as 14 nM (11).
oxidative phosphorylation by SMP (29 - 32) is not inhibited. This has been interpreted -- -
as evidence supporting the existence of separate catalnc sites for t h i 'ATP synthesis
and hydrolysis reactions (31). Another possibility consistent with the binding-change
mechanism proposed by Boyer et al. (33, 34). is that AMP* PNP tightly bound at the -
catalytx site is released upon binding ADP at a high affinity site h t e d on a second
interacting p-subunit AMP* PNP bound to F,' is released upon ADP binding within
one catdytic turnover of the enzyme. In this way, AMP* PNP is never observed to
cause inhibition of ATP synthesis and would appear to be a one-way inhibitor of
ATP synthase. Under typical ATP synthesis assay conditions, initial velocities are $
monitored at high ADP concentrations, which are kept constant using an ATP trap
(HK, G-6-PDH, glucose, and NADP). Depending on the effici'ency of 'the coupled 1
enzyme system. ADP concentrations maintained in such assxys may overcome any
possible inhibition by AMP* PNP. Contaminating ADP present in the assay medium,
may also relieve AMP. PNP inhibition prior to initiation of ATP synthesis.. Studies
have shown that ADP has a significant effect on relieving AMP* PNP inhibition of
ATP hydrolysis by Sh?'P or F, (29, 31, 35). In other studies in which binding of
AMP* PNP or its photoactivatable analog NAP,-AMP- PNP to F, was measured, it was
shown that addition of ADP caused release of AMP* PNP (36, 37). Since synthesis of
ATP by ATP synthase requires a transmembrane .electrochemical potential (Ap ) (38), H+

1
the lack of AMP* PNP inhibition may also be explained by a decreased affinity of the
ATP analog for SMP -
of the membrane. In
of ATP hydrolysis by
explaining the absence
due p a conformational 'change of the enzyme upon energization
view of these observations, the sensitivity of AMP* PNP inhibition -
energized SMP to ADP may be of fundamental importance in
of AMP* PNP inhibition of ATP synthesis.
In addition to not inhibiting ATP synthesis, another peculiar property observed
-fer the ATP analog AMP- PNP, was the wide range of Ki values reported for its
inhibition of ATP hydrolysis. In published studies, Ki values which vary over a
'htihdred fold range have been reported; 14 nM (11) to 0.2 - 1.3 p M (28. 30. 31).
This in itself is not surprising since F, possesses multiple nucleotide bindingBsites with"
different affinities for AMP* PNP: one high affinity site (Kd = 18 nM) and two low .Q I
affinity sites (Kd = 1.0 DM) (11). The Ki value observed may represent the
dissociation of AMP- PNP from a site which is dependent on the assay conditions
used, i.e.. AMP* PNP and ATP concennations, dilution of the enzyme prior to assay,, A
etc.. The Ki values observed may also reflect the presence of ADP, which may lower
the affini'ty of the enzyme for AMP- PNP and lead to an increase in the Ki value. I
I
I - I Studies of AMP* PNP inhibition of ATP hydrolysis catalysed by F, (28. 31, 35)
1 have also revealed a time-dependent inhibition not observed with energized SMP
\Questions which must be raised are: does *complete inhibition of ATP hydrolysis by I /AMP* PNP occur or is a steady-state level of inhibition reached? Is this inhibition \ - reversible? Until these questions are answered, the conclusions based on F, studies
which are used to elucidate the mechanism of ATP synthesis, may not be directly -
applicable to the mechanism of mitochondria1 ATP synthase complex in viva.

1. Determine whether increasing ADP concentration reduces AMP- PNP inhibition of
ATP hydrolysis by energized SMP. Determine the extent of AMP-PNP inhibition
1 I at various steady-state ADP concentrations. ' -
2. Determine the Ki value(s) for AMP* PNP inhibition of ATP hydrolysis over a
wide range of AMP* PNP corlcenuations.
3. Observe the kinetic effects of AMP* PNP on non-energized SMP
4. 'Study the AMP. PNP iqhibition of ATP hydrolysis catalysed by F1 as a function
of incubation time.
5. Determine the K i value for AMP* PNP inhibition ,of F,-ATPase.
-
6. Formulate mechanisms which &.n mtionalize the resu l t obtained, and relevant +*
published. results. 9

CHAPTER N
EXPERIMENTAL PROCEDURES
- A11 reagents used were reagent grade, analytical reagent grade or enzyme grade
quality. The following chemicals and enzymes were obtained from Boehringer I
Mannheim: ,L? -NADP (crytallized monopotassium salt); PEP (monopotassiur~1 salt); AP A
(mlithium salt); AMP* PNP (tetralithiurn salt); G-6-PDH (ammonium sulfate suspension.
Grade 1 from yeast); and LDH (ammonium sulfate suspension, from rabbit muscle).
The chemicals and enzymes obtained from Sigma Chemical Co. were as follows:
rotenone; p-NADH (disodium salt, Grade I11 from yeast); Tris-HC1; Tris-Base; sucrose
(Grade I); BSA (crystallized, lyophilized); ATP (disodium salt, from equine muscle);
ADP (sodium salt, Grade IX from equine muscle); HK (ammonium sulfate suspension.
Type C-300 from Bakers yeast); and PK (lyophilized, Type 111 from rabbit muscle).
Monobasic potassium phosphate (KH,PO,), dibasic potassium phosphate (K,HPOIg 3HIO),
and D-glucose were obtained from Amchem Co.. Sephadex G-50 (fine) was obtained
from Pharmacia Fine ~ h e d s . EDTA was from BDH Chemicals. Succinic acid was
obtained from two sources: Sigma Chemical Co. (disodium salt* hexahydrate) and
McArthur Chemical Co. Ltd.. Ammonium sulfate was from Schwan/Mann. Inc. division !
of Mediscience. PCP was from ICN Pharmaceuticals.

Preparation of Beef Heart SMP
0
Beef heart rnitdchondria (heavy Fraction) isolated by the method of Smith (39)
were used in the preparation of SMP as described by Beyer (40). SMP were stored at
-70 'C until ,, used.
Preparation of Beef Heart Mitochondrial F,-ATPase
Beef heart mitochondria (both heavy and light fractions) were used to prepare %- 5. "r ,*
F,-ATPase by the method described by Knowles and Penefsky (41. 42). The F,\ was A
stored at 4 'C as an ammonium sulfate suspension until used.
Desalting Ammonium Sulfate Suspensions of Coupling Enzymes 4
Sephadex-G-50 (fine) was swollen overnight (3 'C) in 50 mM TrisOAc pH 7.5
(5 g Sephadex : 100 ml buffer). A 1.0 rnl tuberculin syringe fitted with a porous
polyethylene frit was filled with swollen Sephadex The columns were centrifuged in a
I.EC. tabletop centrifuge, swinghg bucket rotor model 221, at 1050 x g (setting 5,
1 min). Unless otherwise stated, all Sephadex columns were centrifuged under these -
conditions. Ammonium sulfare suspeniions were centrifuged at 27.000 ' x g, in a Sorvall
RC-5B Centrifuge, (15.000 rpm, 4 - 6 'C, 15 min, Sowall SS-34 rotor). The pellet . was resuspended in cold buffer, aliquot5 (125 ~ l ) were added to each packed Sephadex
column (0.7 ml), and centrifuged in the IEC. tabletop centrifuge. Tne eluate was then
collected and diluted. with cold buffer to the appropriate concentration.

Desalting Amtnoniurn Sulfate Suspensions of F,
The procedure used to desalt F, was similar to that described for the coupling
enzymes except Sephadex was swollen in F, resuspension butrer (0.25 M s u m / l mM
MgClJSO mM Tris-OAc pH 7.5); an aliquot of E, ~nrnoniurn sulfate suspension was
centrifuged at 17,000 x g (12,000: rpm. 4 - 6 'C, 15 min, Sorvd! SS-34 rptor). rhc
pellet was quickly dissolved in F, resuspension buffer (25 'C) LO apprournatel!
1:2 mg/rnl. centrifuged through a packed Sephadex column and h e eluate dilutcd ro
0.6 m g / d with F, resuspension buffer (25 'c). The desalted F: solution was kept a:
room temperature (20 - 25 'C) during the experiment Usually 5% activity loss
oscurred within 5 hours-under these conditions.
'Preparation of Reactivation Experiment Columns
Sephadex swollen in 50 mM Tris-OAc pH 7.5 (SMP reacuvauon) or F,
resuspension buffer (F, reactivation) was added to a 1 rnl tuberculm syringe fitted wrth
a porous polyethylene
sephidex column (0,7
and fitted with a cut
evehtuall y contain the
Fig. 4.
frit and cenmfuged in the tabletop centrifuge. The packed
rnl) was transfered to a clean conical centrifuge tube (15 mi).
eppendorf tip (1000 p1: 250 k1 capagty when cut), whlch would
ueated enzype sample (100 - 1 2 m The set-up is shown in
Protein Determinations ' 0
Protein concentrations were detemned by the method of Lowiy c i al. (43) using
BSA ( ~ 2 8 0 ~ ~ = 0.667 rnl rng crr- I ) as standard.


preparation of Srodr Solutiom I
, All amk soiutiazs were made in Tris-OAc buffer (30 mM. pH 7.5). and
adjusted to pH 75 with either Tris-O~c (50 mM. pH 4) or Tris-3ase' (SO mM, 0
p~ 9.8j. uni& othernix stami
A sW s o i u t i m of rotenone (1 mM in 95% ethanol) wu diluted twofold inro a -
1:: suiurion of 9 5 8 erhanolAris-OAc (SO mM. -- pH 7.5). This solution was prepared
fresh tach day before usc.
h sroch- solution of PCP (iO mM in 95% ethanol) was diluted to 2
concenmtion of 0.15 mM ir. a 1:l ssiuGon of 95% erhanolAris-O,4c~(.CO ' m ~ ,
pH 7.5). The diiuied PCP 7soIurion was prepared fresh each day before usc.
Stack PEP was adjusred io pH 7.5 using a small volume of KOH (5 M) In
Two cornpurer prugams use6 fo: rhe non-knm regresstor! ana. j s i s . T i e ) were:
. homdcal Computer Prognms (BMDP)
Dtzparanent of Biomathtmatitr University of Cafifomia
Burnab!. E.C.. Cam&

Spxmphotomemc Assays f
All spm@mmetrk assays were performed at 30 'C using a Cary 14
specnophotometer which the change in zbsorbance of NADH or NADPH at -
340 (Q~o,, as a function of time. .- /
A T P Hydrolysis Assay
The rate of ATP hydrolysis catalysed by SMP or F, was monitored by coupling
the production of ADP to the oxidation of NADH using PEP: PI(, and LDH. The
reaction is shown in Scheme 1.
Monitoring ATP hydrolysis by SMP required special assay cbnditions in order to
avoid complications, in the interpretation of the data, produced by some of the other
integral proleins associated with the vesicle membrane. Rotenone, an inhibitor of the
NADH dehydrogenase complex of the mitochondria1 respiratory chain, was added
1.5 min prior to the addition of NADH to the reaction medium in o r d p to prevent
energization of the SMP membrane by NADH oxidation. If left uninhibited, the - --
observed rate of NADH oxidation would be greater than the m e net rate of ATP
synthesis. AP,A was also included to inhibit adenylate kinase, which catalyses the
reaction: 2ADP * ATP + 'AMP. If .this reacthi were not inhibited, ADP would
bypass the coupied enzyme assay system, resulting in a net decrease in the ADP
concentranon in the a s s a y ' mehum.
Monitoring A'IP hyirolysis under energized conditions required oxygenation of the
buffer (50 rnM Tris-O~c, pH 7.5). MgCl,, succinate, and glucose solutions prior to
initiauon of the reactior! in' order to prevent 0: depletion during the course of the i \ ' reaction. Succtnat:, a rgiratory chain subsmite, was included to energize the
A

H,O + AT P SMP or F1 ADP + Pi
PYRUVATE PEP
LACTATE
Scheme 1
ATP Hydrolysis: Coupled Enzyme Assay System
- - membrane.
In order to study ATP hydrolysis by non-energized SMP, PCP was added to the
standard assay- medium. PCP. a proton ionophore, dissipates the transmembrane pH ';p
': paden t (ApH) and the electrical potential (A*) generated by the oxidation* of
/-3 su~x&te.~??$ hydrolysis of ATP. The minimum concentration of PCP which abolished
--A4
AT? synthesis by dissipating the transmembrane electrochemical potential (Ap ), was H+
added 10 the hydrolysis rn&iurri. The residual rate of K\;ADPH production absented
wner! monitorin_g ATP s~nthesis was due -to glucose oxidation in the presence of Pi

The rate of ATP synthesis cakysed by energized S M P was md6tored by .t --
couphg the synthesis of ATP to NADPH production using glucose, HK, and
W P D H . The reaction is shown in Scheme 2. Again AP,A w$ included in the.
assay mixture to prevent ATP formation by adenylax Ynase. The reaction mixture was 1 -
also oxygenated prior to the assay.
PK Kinetic Parameters' Assay
The rate of ATP synthesis cafalysed by PK was monitored by. coupling the
production of ATF' to the appearance of NADPH using glucose, HK, and G6-PDH.
The reaction is shown in Scheme 3. Although the production of pyruvate by PK can
also be measured directly using LDH and NADH, the reaction shown in this scheme - .
maintaia a anstant ADP concentration in the assay medium, which is necessary when --
measuring initial velpcities.

, SUCCINATE+ $02 F UMARATE + H20
F + A D P - .f
ATP+ SMP I -
GLUCOSE-6-PHOSPHATE GLUCOSE
a
Scheme 2
ATP Sycthesis: Cou?led Enzyme Assay System

PEP + ADP - A'I'P + PYRUVATE -
GLUCOSE-6-PHOSPHATE GLUCOSE
Scheme 3 $
ATP Synthesis-From ADP and PEP: Coupled Enzyme Assay System

RESULTS a AND DISCUSSION
Effect of ADP on AMP -PNP Inhibition of Energized SMP
In order to observe the effect of ADP on AMP- PNP inhibition of ATP
hydrolysis catalysed by energized SMP, without changing the total nucleotide
- concentration in the assay medun, . the concennation of PK in the reaction medium
was varied As s h o w in Fig. 5, at saturating PK concentmior,, 0 . p M AMP. PNP
was dole to inhibit ATP hydrolysis by 27%. As expected, lowering the PK
concenuation decreased the rate of NADH oxidation observed in the presence and
absence of AMP* PNP.
As the concentration of PK is lowered from saturating levels where the
production of AD2 is rate h t i n g , to subsaturating conbtions where the production of .
b ADP by SMP catalysis is not, the steady-state concertrations of ADP were expected to
increase. Using Eq. 3 from Appendix 1; the steady-state A D P concentration could be
calculated given the concentration and kinetic parameters of the PK used, and the rate
of NADH oxidation observed Since the specific activity of the PK used varied greatly
wlth the age and preparation of the enzyme, the kiiietic parameters of this enzyme
were determined for each experiment From the experiment shown in Fig. 5, the
Krn and Vmax under sarurating copdtions df PEP, was determined to be 565 pM ADP
and 295 pmole*'rnin-'0 mg-', respectively, as calculated from the Lineweaver-Burk plot
, shown in Fig. 6. As shown in Fig.. 7. the steady-state ADP concentration did decreasec' . ..
as the concenuation of PK 'in the assa) medium was innwsed. Even at the lowest
PK cor~cenuation used (4.1 pg/ml), only 4 p M ADP was present ( 2 0 7 m f the mtal

Figure 5
Effect of PK on AMP* PNP Inhibition of ATP Hydrolysis by Energized SMP.
SMP (0.16 mg) were incubated at 30 'C for 3 minutes in an assay medium containing 50 rnM Tris-OAc pH 7.5, 6 mM glucose, 10 rnM succinate, 10 mM MgCL 20 rnM PEP, 5 mM Pi, 0.4 mM AP,A, 5 pM rotenone, 0.11 mM NADH, 30 L L ~ LDH, and various concentrations of PY in the presence ( ) or absence ( 0 ) of 0.5 LLM AMP PNP. The assay was initiated with the addition of ATF' (20 p M). The decrease in absor'bance at 340 nm was monitored versus time. The total reaction volume was
- 1.0 ml.


Figure 6
Lineweaver-Burk Plot for PK Activity.
PK (90 pg) was inabated at 30 'C for 3 rnin i p a n assay medium containing 50 rnh4 Tris-OAc pH 7.5, 6 mM glucose, 10 mM succinate, 10 gnM MgCl,, 20 mM PEP, 5 m M Pi, HK (0.36 mg), 'G-6-PDH (0.10 mg), and 1. mM NADP. The reaction was initiated with the addition of ADP. The increase in absorbance at - 7
340 nm due to N A D P reduction was monitored versus ATP productioi The total reaction volume was 1.0 ml.
time m-determine the rate of


Figure 7
Steady-State ADP Gmcenuations as a Function of PK Concentration.
Based on Eq. 3 from Appendix I, the steady-state ADP concentration was determined in the presence ( ) and absence ( 0 ) of 0.4 pM AMP- FNP. .

c~phritlw. foi wtr! AMP. PNP &ibibm of .4TP hydrdysis b cnergmd SMP 1s mr

A: rhe given PK concenuauor., and rate of ATP h!drolvsls bi energzed S M P In the p?exnce ( ) and z m n c c r C ) of C.5 il M AMP* PNP shour ~ r . F I ~ . 5 . and the corrcspcndmg stead!-su:e AD? concer,~=at~or. showr. In FIE -. i h c :arc or A T P h\dro lp ls can be $ozx 2s 2 ~ U ~ Z Q O C of stead!rtarr .4Df ioncenirauon The lnser shows b e sensluvl? of AMP. PYP 1ri :5:~or, of ATP hidro1i9s:c ro sread!-sate AIIP comexiratlon


Figure 9
Effect of ADP on AMP* PNP Inhibitior, of ATP Hydrolysis Catalysed by Energized sw.
The experimental conditions were as those described in the legend to Fig. 5. except SMP (0.31 mg) were incubated in the presence ( ) or absence ( 0 ) of 1.0 P M AMPgPNP. The inset shows the inhibition of ATP hydrolysis as a funcuon of steady-state ADP concenuation

fact be a consequence of the S M P isolation procedure. The naturally occurring inhibitor
protein (IF,) which inhibits ATP hydrolysis, may either be dissociated from F,, or still
bound to F, bm mnformationally m b l e to inhibit ATP hydrolysis. Activity .nay also
arise from F, bound to membrane 6aaements 'which may show a higher affinity for
ATP than F, bound to membrane vksicles which have been energized. The
physiological association of .IF: to F, in vivu, may be a mechanism which ' prevents -- -
ATP (newly synthesized 07 endogenous) from binding to the catalytic site of F,.
Ordered binding of subsnates, ADP and P ~ : F may prevent ATP or AT? &xilogs from
bicdrng to the same sitt.
~ i g . 10 is such a model where IF, prevents the binding of a nucleoude mphoqphate.
This model would predict no
syhbesis to occur. Pi bindng
bindmg site (not participating
of Pi binding to F, (approx.
AMP- PNP with SMP i.e. its
AMP* PNP inhibition or product inhibition of ATP
prior to U P is likely to occur at the third nucleotide . . . ,
in the catalytic cycle) giving support to the stoichiomeuy 4
. 1 : 1) found by Penefsky (44). The interaction of
ability to inhibit the hydrolysis but not synthesis of
ATP, which has been used to support the theory of two different sites on F,: one
for synthesis and the other for hydrolysis, may indcate the presence of different- F,
populations. It is therefore possibie that AMP* PNP may only affect F, incapable of
.4l? synthesis. It is conceivabIe that although lowering the PK concentratjon did
mcrtase the steady-srate b~ cbncentration, the population of F, "geared" to ATP
synthesis may have kept the ADP concentration low b!. catalysing the synthesis of
AT? from new1)- hydrolysed ADP and Pi preseni as shown in Fig. 11, in t h ~ way
acting as a coupling -enzyrn:.

ADP L 'J ADP
-K conformat ional
change
ATP -
. Figure 10
Possible M ~ h a r u s m lnvoiving IF, Interaction with F,F,-ATPase

H20-+ FUMARATE SUCCINATE + 3 4 It /
PVRUVATE PEP
( rnoni tored )
- E = F1 incapable of net- ATP synthes i s
catalyses .net ATP synthes i s
Figure 11
Population of F,Fi-ATPase Acting as a Coupling Enzyme

Determination of fi for AMP0PNP Inhibition of Eneraized SMP
AMP* PNP inhibition of ATP hydrolysis catalysed by 'sMP has been studied by
other workers (30, 31). Energization of the submitdchondrial membrane either by
NADH oxidation or ATP hydrolysis, yielded Ki values of 0.16 p M (0 , - 1.48 pM
AMP* PNP --ref. 31) and 1.3 pM (0 and 1.92 p M AMP- PNP - ref. 30). In the
presence of the uncoupler FCO, a Ki value of 0.20 pM was determined
(0 - 6.3 pM M e PNP - ref. 30). The Ki values determined for soluble F1-ATPase
also varied with the AMP* PNP concenuatior, range used. Cross and Nalin (11)
determined a Ki value as low as 14 nM (0 - 50 O ~ M AMP* PNP), while AMP- PNP
concentrations. in the pmolar region gave Ki values of 0.92 pM (30). 0.5 pM (28). \
0.33 pM (31). and 0.32 pM (27).
Because of the variety of conditions used, it was decided to study AMP* PNP
inhibition of ATP hydrolysis by energized SMP using a large range of AMP* PNP
concentration. As. seen in Fig. 12, the Lineweaver-Burk plots for AMP* PNP inhibition
of ATPase activity show AMPg PNP to be a competitive inhibitor of energized SMP in
agreement with other - studies (11. 27 - 31). The kinetic parameters Krn and Vrnax, for
ATP hydrolysis by energized S M P determined in the absence o i AMP* PNP, were - -
calculated from the horizontal intercept (-1Km) and vertical intercept (1Nrnax). p e
values of Krn and Vrnax were found to be 53.2 pM and 372 -mole-min-'* mg-'. /
Tne replot of the slop6 from tbe Lineweaver-Burk plots versus the inhibitor
c o n w a r i o n shown in Fig. 13, was not linear, as expected for a competitive inhibitor
(see Appendx 2 for explanation). The ndary plot is hyperbolic. As the
conaxtiation of AMP* PNP increases, the slope of the graph decreases.

Linev aver-Burk Plots for AMP- PNP Inhibition of the ATPase Activity of Energized SMP.
SMP (0.18 zg) were incubated for 3 min at 30 'C in an assaymedium containing 50 rnM Tris-OAc pH 7.5, 6 mM glucose, 10 rnM succinate, 10 rnM MgCl,, 20 mM PEP, 5 rnM Pi, 0.4 rnM @,A, 5 BM rotenone, PK (0.18 mg), LDH (75 pg) , 0.13 mM NADH, and AMP* PNP (0' - 40 PM). ATP (20 - 100 DM) was added at the third minute of incubation to initiate the hydrolysis reaction. The 'rate of NADH oxidation was monitored at 340 nrn. The total reaction volume was 1.0 mi. The curve symbols ( A , 0 , 0 , 0 , , 0 , X ) represent AMP* PNP concenuations of (0, 1, 2 , 5, 10, 25, and 40 BM), respectively. The verticd bars indicate a 5% enor.

[ ATP I-' , ( m ~ - ' )

Figure 13
Secondary Ploi for AMP* PNP Lnhibition of the ATPase Activity of ~nergized SMP
The slopes from the Lineweaver-Burk plots shown in Fig, 12 were plotted as a function of AMP* P a concentzation.
, *

10 20 30 40
[ AMP-PNP ] , ( pM )

Because of the existence of three p-subunits per F,-ATPase, a model which
only involves one AMP- PNP binding competitively with respect to ATP, yet while I
I bound allows two site catalysis to occur at the remaining N o silts, was postulated
(Fig. 14). If one assumes that AMP* PNP bound at a site does not affect the
maximal velocity of the two sites i n v o m in catalysis, then the secondary plot would
obey Eq. 1.
where a and b are
constants defined --
in Appendix 3
Equation 1
&. 1 would predict that at the exuemes of inhibitor concentration ([l) = 0 and m).
the slope would increase from Km/Vmdx (at [ f l = 0). to its limiting value of
(KmNrnax)= a/b or Km' Nmaxl_ La! Il) = w). In order for the slope to increase,
parameter a must be greater than parameter b.
A non-linear regression analysis of Eq. 1 to the expenmental data shown tn
Fig. 13, yielded Fig. 15. As an be seen from this graph, the model could precbct
the observed data at k e low AMPe'PNP concentrations, whereas large devialions
occurred at the higher concennations used.

- Y s q c m C ~ & h a n i m fo: AMP* PNP Inhibmon of ATPase Acuvity: Model 1.
where E - Free enz)me T - ATP D - ADP and Pi
I - AMP*Ph-F'

- . hqh affinity
) low affinity - -
r change in binding affinity

Figure 15
Non-hear Regression of the Rate Expression Derived for Model 1 to Fig. 13.
Slope expression was: -
where P1 = a/Ki P2 = b/Ki
a and b are defined in Appendix 3
Fit:
CorrelaGon Mamx: i.03 3.96 1.00


- *
A second r n e c h k was therefore proposed which would allow the binding of a
second r n o l d e of AMP* PNP to F,, again competitive with respect to ATP. This
model is shown in Fig. 16. As in the previous model, if one assumes that the
maximal velocity of two site catalysis is not affected by the presence of bound
%, AMP* PNP. then the s&ndary plot would obey Eq. 2.
where a, b, and c are
constants defined
in Appendix 4
Equation 2 - % %
Eq. 2 would prehct that at the extremes of inhibitor concentration ([rj = 0 and
infinity), the slope would increase from Km/Vmax (at [rj = 0). to Xinity
(at [fl = s). At high Inhibitor concentrations, the slope should vary lihearly with
inhibitor concentration As in the previous model, in order for the slope to increase,
constant a must be greater than b.
J
A non-linear regression analysis of Eq. 2 was performed using the experimental
data shown in Fig. .l3. As can be seen from Fig. 17, the model involving the binding
of multiple -AMP* PhT molecules to ATP synthase, fit the experimenral data over the
ennre AMPo PNP concentration range used Under singksite catalysis conditions, the
equilibrium constant for ATP hydrolysis by soluble F,-ATPase, was found to be

Figure 16
Proposed Mechanism fbr AMP* PNP Inhibition of ATPase Activit);:' Model 2. - b
where E - Free enzyme . .
T - A T D - ADP and Pi I - AMP-PN-F' k*
. high affinity
) low affinity
* change in binding
affinity

Figure 17
Nan-Linear Regression of the Rate Expression Derived for Model' 2 to
Slope expression was:
I + P1;[fle( 1 + P3*[0 ) Vmax .1 + P2- [fl
where P1 = a/& P2 = b/Ki P3 = c/&,
a, b, and c are defined in Appendix 4
Fit:
Correlation Mamx: 1.00 0.97 1.00 0.75 0.87 1.00
. Fig. 13.


0.5 (45) and approximately 0.5 with KC1-washed SMP (46 - 48). If the equilibrium
constants for the ATP hydrolysis steps (k,/k2 and k,,/k,,) shown in Fi.g. 16, are set
to 0.5, Ki and Ki, values of 0.58 p M and 19 pM, respectively, could. be calculated
from the fit shown in Fig. 17. I
In ordk to determine if the slope is in fact dependent' on inhibitor
concenuation at the, h g h AMP* PNP concentrations (consistent with Model 2) or
approaches a limiting value which is independent of inhibitor concentration (Model 1).
adduional studies at very high AMP* PNP concentrations will need to be done.
The Effect of AMP *PNP on Non-energized SMP
Whereas AMP* PNP produced l m inhibited steady-state rates of ATP hydrolysis
by energized SMP at AMP* PNP concentrations as high as 40 D M in the presence of
20 DM ATP, timedependent inhibition was observed .under non-energized conditions. --
This timedependent loss in activity was not due simply to the SMP or any of the I
coupling enzymes losing activity over the course of the assay.
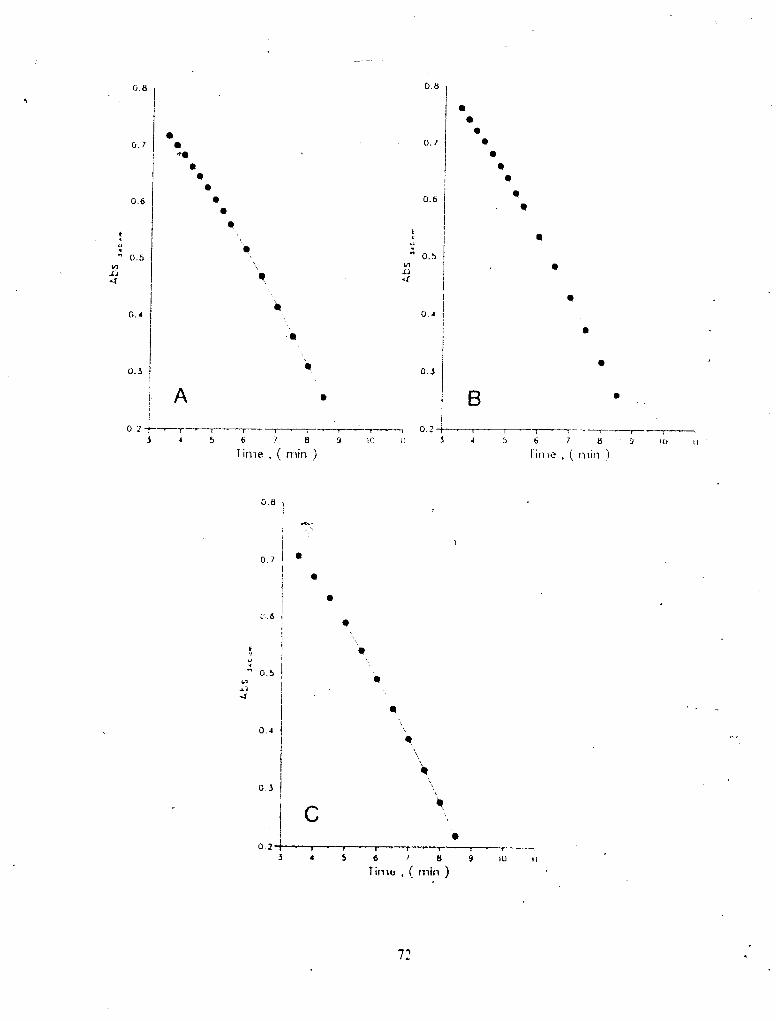
As compared to ATP hydrolysis in the absence of W P * PNP (Fig. 18 curve 1)
which showed a slight lag in hydrolysis before a linear steady-state rate was achieved \
( A A h i n = 0.188), AMP* PNP added to the SMP time minms prior to ATP I
(Fig. 18 curve 3) or with AT? (Fig. 18 curve 4), produced timedependent inhibition. /' -
The initial rate of A T P hydroly&j monitored, was faster when AMP* PNP was not
preincubated with the enzyme (Fig. 18 curve 4) as compared to a three minute
preincubation (Fig. 18 curve 3), correspondmg to 58% and 67% inhibition, respectively.
A non-linear -regression analysis to the equation describing the first order decay of
ATPase activity (see Appendix 5) for the time-dependent inhibition shown in Fig. 18

I
Figure 18
Effect of 'AMP* PNP on ATPase ~ c t i v i t ~ ' of Non-Engergized SMP. - - SMP (0.18 mg) were incubated at 30 'C for 3 rnin in a medium which contained 50 mM Tris-OAc pH 7.5, 6 rnM glucose, 10 mM MgCI,, 22 mM PEP, 5 mM Pi, 0.4 rnM AP,A, 0.18 mg PK, 75 wg LDH, 5 wM rotenone, 0.13 mM NADH, 7.5 LM PCP, and where indicated 5 wM AMP* PNP. The hydrolysis reaction was initiated with ATP (final concenuation 40 wM). The total reaction volume was 1.0 ml. The change in absorbance due to NADH oxidation was monitored at 340 mn.
- Curve 1 + PCP no AMP* PNP Curve 2 - PCP no AMP- PNP Curve 3 + PCP + AMP* PNP (ATP initiates rxn) Curve 4 + PCP + (AMP* PNP and ATP initiate rxn)

curves 1 & 2 curves 3 81 4 - - 1 min 2min ,
ATP

curves 3 and 4, gave apparent first order rate constants (kapp ) of 0.080 and @act ,
0.211 min-l, resp and the percent activity remaining at steady-state as 0 and
14%. respectively. !&mple inactivation fits for curves 3 and 4 (Fig. 18). are shown in +-JT
Fig. 19. The absence of PCP in the $say medium (Fig. 18 cuge 2) resulted in a
17% decrease in ATP hy@olysis activity (AMrnin = 0.156). Although succinate was not
included in th& ATP hydrolysis medium, energization of the membrane vesicle may C have allowed for the synthesis of ATP. Recause the observed net rate of ATP
hydrolysis is equal to the difference between the ATP hydrolysis and synthesis rates,
any synthesis of .4TP would deerease t;.? net hydrolysis rate observed.
As Fig. 20 shows, the initial rate of ATP hydrolysis was sensitive to the length
of time AMP- PNP was preincubated with non-energized SMP. As the preincubation
time increased. the initial rate of ATP hydrolysis decreased. AMP- PNP added with
ATP caused a 56% inhibition of ATPase activity. whereas a 2 hours preincubation,
resulted in 94% inhibition of the rate of ATP hydrolysis. Inhibition of ATP hydrolysis
by AMPg PNP appears to be biphasic; that is, a rapid inactivation is followed by a *
slower rate of inactivation. Based on the constants AAhin , , AA/rnin , and kapp cC) inact
determined for curves 3 and 4 (Fig. 18), a time course for AMP- P- inhibition is
shown in Fig. 21. Lncluded in Fig. 21 is the data from Fig. 20. As can be seen
4-r- From this graph, there is virtually no Qfference in the percent inhibition (25%) within
the first 20 BLin, but large deviations occur after this time. The fit of the first order
rate equation to the data shown in Fig. 18 curve 4, requires that at steady-state
(t + =). the level of inhibition be 868. A similar fit t o the data of Fig. 18 ,curve 3.
requires that at steady-state A n hydrolysis be lWo inhibited. As can be seen from
Fig. 21, the initial inhibition measured after a prolcnged preincubation of non-energized
SMP with AMP- PNP is in'termediate between these two cases. The biphasic name of

Figure 19
Sample Non-Linear Regression Fits for the Inactivation of ATPase, Activq b~ AMP* PNP.
curve 1: fit to Fig. 18 (curve 4)
@Pinact = 0.211 min-I
curve 2: fit to Fig. 18 (curve 3)
kappinact = 0.080 min-I

0.1 -I ~ v ~ - - - r ~ r - ~ - - - r - ~ - - r r r r- I 0 1 2 3 4 5 6 7 8 9 1 0 1 1 1 2
Time , ( min )
Effea of Preincubation Time of .AMP. PYP with Non-Energized SMP
SMP (0.18 mg) were preinabated a1 30 'C for the indicated length of time prior to rhe initiation of the ATP hydrolysis reaction by the addition of 40 f i M A n . in a medmm which contained 50 mM Tris-OAc pH 7.5. 6 m M glucose. 10 mM MgCI,. 20 mhi PEP. 5 mM Pi. d.4 rnM AP,A. 7.5 PM PCP, and 5 P M AMP* PNP. Tnr ee -- minum prior to the inination of the assay, 0.18 mg PK. Y ~g LDH, alld 5 pM s tenone were added to the assay medmrn followed by 0.13 mM NADH, 1.5 rnin prior to initiation The total reaction volume was 1 rnl. The absorbance change due to NADH oxidation was monitored ar 340 nm. The initial rate of NADH oxidation was compared to the amno1 rare' which drd not contain AMP* PNP in the assay medium.

Time, (min.) v

6
Theoretical AMP* PNP Inhibition Curves: A Function of Preincubation Time.
curve 1: Data from non-linear regression of Fig. 18 curve 3
curve 2: Data from non-linear regression of Fig. 18 curve 4
Lappinact = 0.211 min-
AA/rnin, = 0.085 AA/rnina, = 0.027
A A'rmnsteady-state for the uninhibited conditions = 0.188
T h e solid circles ( ) represent data given in Fig. 20.

- --- --
curve 1
- - - - - - - - - curve 2
- .
40 60 80 l oo Time, (min.)

AMP* PNP inhibition of ATP hydrolysis may be a
enzyme population, or alternatively it may represent
r
result of a heterogeneity in
diEerent processes: binding
the
of
additional AMP* PNP molecules to F, 'or slow conversion of the enzyme* inhibitor V
complex to a more inhibited form. If this is the' case, the equation describing the
time course of inactivation may be a function of nvo euponentials.
In order to rest if the observed timedependent inhibition of ATP hydrolysis \.,
catalysed by non-ene&ed SMP using the ATP analog AMP* PNP was reversible. an
aliquot of inhibited SMP was either diluted directly into a new assay medium or
applied to a Sephedex G 5 0 column, which would iemove free or loosely bound
AMP- PNP from the enzyme, before reassaying for ac t iv i~ . Fig. 22 curve 1 shows the
linear steady-state rate observed when ATP was added to non-energized SMP in the
absence of inhibitor compared with curve 2 in which the SMP was incubated foi
3 rnin with 5 pM AMP* PNP prior to the addition of ATF'. The apparent rate
constant for inactivation (kapp ), AA/rnin,, and AA/min were determined to be inaa O,
- 0.078 min-l, 0.088, and 0.007. respectively. The extent of inhibition at time zero was
determined to be 63%. It should be noted that in calculating the initial level of
AMP* PNP inhibition, it is assumed that the kinetics observed in the presence of ATP
(and therefore during enzyme turnover) are the sarrie as in its absence. After a
15 min preincubation of AMP* PNP with SMP, the level of inhibition calculated using
the above values of kapp , PA/min,, AA/min was 86%. An aliquot of this . inacr 0,
hydrolysis medium, first applied to a Sephadex column, then diluted into an assay
medium, shows that relative to the control which contained no AMP* PNP in the
preincubation medium and displayed a linear steady-state rate of ATF' hydroljsis when
initiated with 0.5 rnM ATP (Fig. 23 curve 1). the prtsence of AMP* PNP showed a
reactivation of ATPase activity (curve 2). The calculated percent inhibition on addition

Figure 22 '
Time-Dependent AMP* PNP Inhibition of ATP Hydrolysis Calalysed by Non-energized SMP.
SMP (0.37 mg) were incubated in the presence (curve 2) or absence (eke 1) of 5 M M AMP* PNP at 30 'C for 3 min. The assay medium also contained 50 mM. Tris-OAc pH 7.5, 6 mM glucose, 10 mM MgCl,, 10 mPcl PEP, .0.2 mM APsA, 5 m M
+. Pi, 5 MM rotenone, 15 PM PCP, 0.14' mM NADH, 0.30 mg PK, and 90 p g LDH. The reaction was initiated by the addition of 20 p M ATP. The change in absorbance at 340 nm due to the oxidation of NADH, was monitored. The total reaction volume was 1.0 ml. The steady-state rate of ATP hydrolysis under these conditionsx (curve 1) was AA/min = 0.236 or 103 m o l e min-I mg- l .

curve 1 - 0.5 min
ATP
curve 2 - 2 min
ATP

Figure 23
Reactivation of ATPase Activity by Non-Energized SMP: ATP Present in Preincubation Medium.
SMP (0.37 mg) were incubated at 30 'C for 15 rnin in a preincubation medium containing the presence (curve 2) or absence (curve 1) of 5 p M AMP* PNP, 50 mM Tris-OAc pH 7.5, 6 mM glucose, 10 mM MgCl,, 10 mM PEP, 0.2 mM AP,A, 5 mM Pi, 15 DM PCP, 20 L ~ M ATP, and 0.30 mg PK. At the 15th min of preincubation. a 100 pl aliquot was added to a packed Sephadex column (0.7 ml) and centrifuged on a tabletop centrifuge. At the 17th min (time 0 for the activity assay), 75 p1 of the eluate was added to an assay medium containing 50 mM TrisOAc . pH 7.5, 6 rnM glucose, 10 m M MgCl,, 10 rnM PEP, 0.2 mM AP,A, 5 mM Pi, 5 pM rotenone, 15 u M PCP, 0.12 mM NADH, 0.30 mg PK, and 90 pg LDH. ATP (0.5 mM) was addcd aher a 3 rnin incubation to initiate ATP hydrolysis. The total assay volume was 1.0 ml. The rate of .NADH oxidation was monitored at 340 nm. The reactivation activity of the control (AMP* PNP absent from the preincubation medium) was AA/min = 0.107 or 0.65 pmole* min- mg- (curve 1).

curves 1 & 2 ----I
2 min
ATP AT P
ATP included in preincubation medium

of the eluate to the assay medium based on a non-linear regression analysis of the +
reactivation equation (see Appendix 5) to the data of Fig. 23 curvc 2. was 92%
(A Mmin = uninhibited rate = 0.107). Total recovery of ATPase activity (relative curve 1
to the control) was achieved within 7 r&n of diluting ' the eluate.
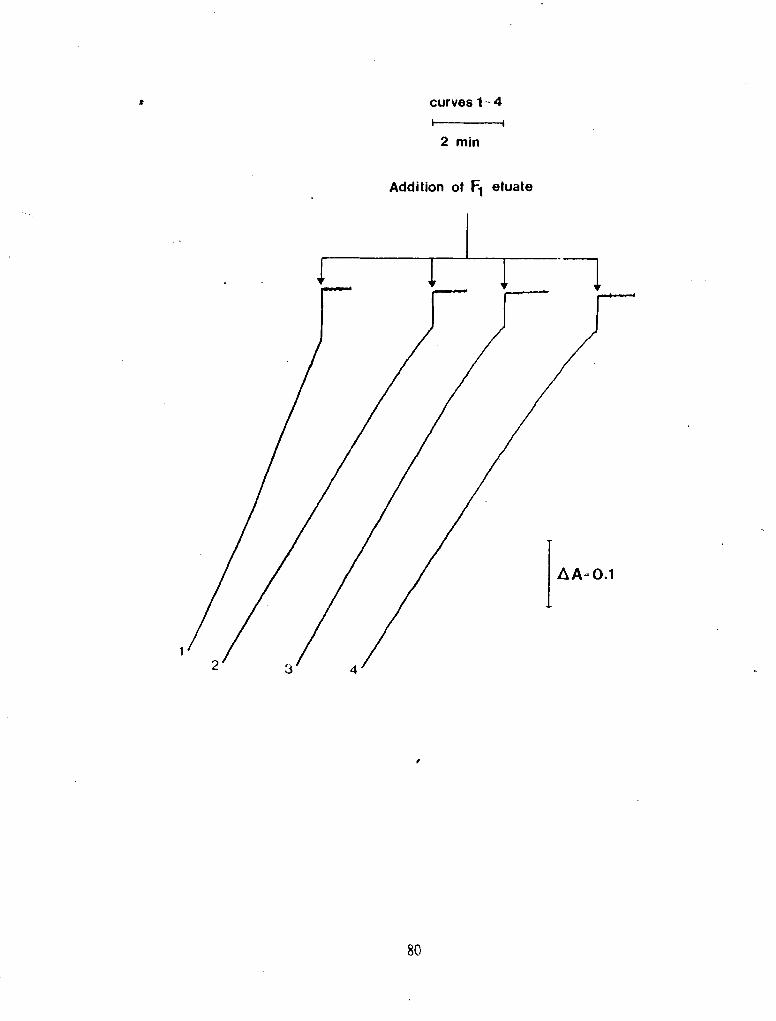
The activity observed when the preincubation medium lacked ATP, again showed
a linear stcady-state rate of ATP hydrolysis when initiated with 0.5 JnM ATP
(Fig. 24 curve 1). The presence of 5 PM AMP* PNP in the preincubation medium
resulted in an inhibition which was reversible (curve 2). Based on a non-iinear fitf the
calculated initial inhibition upon diluting the eluate into the assay medium was 83%
(AA/rnin = uninhibited rate = 0.110). Again, total recovery of ATPase activity curve 1
(rela'Live to the control) was achieved within 7 min.
When an aliquot of the preincubation medlum was added directly to an assay
medium, a linear steady-state rate of ATPase activity was observed for SMP not
preincubated with AMP* PNP (Fig. 25 curve 1). As anticipated, the enzyme when
preincubated with 5 PM AMP* PhT, displayed a reactiva~on of ATPase activity
(curve 2). Based on the non-linear regression fit for the recovery of activity shown in
Fig. 25 (curve 2), the calculated initial level of inhibition upon diluting the inhibited
enzynie directly into the assay medium, was3 90% (AA/min = uninhibited rate = curve 1
0.122). The percent inhibition remaining upon diluting the inhibited SMP into an assay
medi.urn after 9 rnin (30 s. prior to complete NADH oxidation), was 2%.
The average initial level of ATPase inhibition upon diluting the treated SMP.
which was calculated based on the reactivation fits, was 88%. This compares with 86%
inhibition which was expected after a 15 rnin incubation of AMP* PNP with SMP.
Sample reactivation fits to Figs. 23 - 25 (curve 2). are shown in Fig. 26.

Figure 24
. Reactivation of ATPase Activity Catalysed by Non-Energized SMP: ATP Omitted From heincubation Medium.
- -- -
The preincubation media were identical to those described in the legend to Fig. 23. except ATP was omitted. The assay meda were identical to those described in the legend to Fig. 23. The reactivation activity measured for the control (AMP* PNP absent from, the preincubation medium) was AAImin = 0.110 or 0.66 p mole* rnin- l mg- ' (curve 1).

ATP
curves 1 & 2 I--
2 min
ATP absent from preincu bation medium

Reactivation of ATPase Activity: Inhibited SMP Added ~ i iec t ly into the A s ! Medium.
The preincubation medium was identical to that given in the legend to Fig. 23. At the 15th rnin of preincubation, 75 ~1 of the solution was added directly into the assay medium described in Fig. 23. ATP (0.5 rnM) was added after a 3 min incubation, to initiate ATP hydrolysis. The total assay volume was 1.0 mi. The rale of NADH oxidation was monitored at 340 nm. The reactivation activity of the control (AMP* PNP absent frorr! ~e preincubation medium) was AA/min = 0.122 or 0.71 urnole* min-' mg-' (curve 1).

1 min
ATP
ATP included in preincufmticm .medium .-.

Figure X _ . ..I
Sample Non-Lmehr Regression FILS ro Figs. 23 - 25 (Curve 2),
A: 'Fit to Fig. 23 (curve 2 )
kappreacl = 0.146 min '
B: Fir ro Fii. 24 (curve :) = 0,160 r n j n ~ ' kapp,,o
C: Fir to Fig. 15 -(curve 2)
hP'reacr = 0.169 mln
0 2 - t - - . t - r . , - i . i 1 0 2 - J 4 5 6 7 8 I O I I
Tirne . ( niin )

It should be noted that the specific activity of the enzyme prior to the
application of the non-energized SMP to the Sephadex column, was the same as the 0 b
eluate.
Effect of AMP-PNP on Soluble F,-ATPase
- I
The timedependent AMP- PNP inhibition of ATP hydrolysis was not 'only
observed with non-energized SMP, but also with soluble F,-ATPase. As can be seen
from Fig. 7 7 , ir? the prs.enc: of 2C U M ATP, concenuauons of AMP* PNY less than 4
0.5 pM produced linear steady-state rates of ATP hydrolysis. AMP* PNP conccnuations
greater rhan this produced the typical -7.-:-dependent inhibition observed with
non-energized SMP. I t is likely that curvilinear rates were not seen ar the lower
- c'oncentrations of AMP- PNP. bepuse complete NADH oxidauon wurred before slow
tight binding bf AMP* PNP to F, took place to an observable extent Fin. 27 curve 3
([AMP- Pw]= 0.25 PM) does show a slight decrease in rate prior , to depletion of
NADH. Based on the constans obtained from fitting the first order rate' equation to
the dara shown in Fig. 27, kapp , and A-A/mis for ATP hydrolysis (20 U M ATP). - inac t
"P the extent of i ibition at various AMP- PNP concentrations was-plotted .as a function
of time (Fig. 28). As this graph shows. 1 MM AMP- PNP (5% of the total nucleotide
concentration present) was able to inhibit the initial rate of ATP hydrolvsis by 66%.
-A1 st=&-state, the inhibition had racked a value of 98%: - b .. -- -
_ As with non-energized SMP, i r was interesting to determine3 i f the inactivation of
F, by AMP* PNP was reversible. F! preincubated with .4TP (20 uM) and AMY* PNP ' I
(0 - 1.0 uM) for 9 min. was applied to a Sepkadex G S O column and reassayed fb:
activity. Fig. 28 ( ) shows the inhibition expected after a 5 lnin preincuhation time.

"Figure 27 c '
1
TimkDependent AMP* PNP Iahibi!jon of ATP Hydrolysis Caralysed by F,.
F, (11.6 ~ g ) was added to an ass!: medium which had been incubated -at 30 'C for 3 rnin to initiate the ATP hydrolysis reaction. The assay medium contained 50 mM Tris-OAc pH 7.5, 20 mM MgCl,. 10 rnM PEP, 0.2 :ng PK, 0.11 mg LDH. 5 rnM Pi, 20 fiM ATP, AMP* P-W (0 - 1 PM), and 0.13 mM NADH. The change in absorbance 6 340 nrn due to oxidation of NOH, was monitored. The total reaction volume was 1.9 ml. The steadystate rate of ATP hydrolysis in the absence of AMP* PNP under these conditions (curve 1) was AA/min = 0.193 or 2.67 fimole* rnin- mg- l . Curves 1 - 6 contained 0, 0.1, 0.25, 0.5, 0.75; and 1 f iM AMP* PhT. respectively.

curves 2-6 C--------(
4 min
curve 1 ----- ,

Q
Extent AMP* PNP Inhibition of F1-ATPase Activity as a Function of Incubation Time.
Based on non-linear fits of the dhta From Fig. 27 to the equation given in Appendix 5, the percent inhibition as a function of incubation time was obtainel
Parameters calculated from regression analysis:
lJq curve symbols ( . 0 . . . O ) represen[ incubation tihes of (ID, 5, 9, and w rnin), respectively.


As $own in Fig. 29, recovery of ATPase activity was also observed The results of
- non-linear fits to the reactivation curves, are shown in Table 1. As can be seen from
this table, between 11 and 18% of the inhibition was lost upon centrifuging the
preincubation medium through the Sephadex G-50 column, and prior to reassaying
ATPase activity.
Whereas non-energized SMP were able to totally reverse the extent of inhibition
developed in -the preincubation period. F, inhibited from 78 to 91% was only able to
reverse the level of inhibition to an average steady-state level of 31.4 + 3.8%. The
remaining steady-state hydrolysis activity of the F,-ATPase (213 the conuol rate), may
be due to AMP- PNP or its hydrolysis product AMP* PNH2, still bound at a high
, affinity site, which is not released under these experimental conditions, or during the P
time course of the assay. +b
Fig. 30 shows apparent rate constants for inactivation of ATPase activity by
AMP* PNP, as a function of ATP concentration. As can be seen by this graph,
k a ~ ~ values at a giver! AMP* PNP concentration, appear to decrease with increasing inact
.lTP concentration. As was seen with energized SMP, AMP* PNP inhibition of ATPase
activity, led to mechanistic models which predicted multiple subunit involvement The
curvilinear nature of the secondary plot (slope vs. AMP* PNP concen&tion), was
ascribed to the existence of multiple catalytic sites present on the enzyme, each
possessing different afinities for "the ATP analog. The apparent dependence of
k a ~ ~ on ATP concenuation may be a result of ATP lowering the probability of inact
AMP- PNP binding to the .enzyme, as well as influencing which nucleotide binding site
AMP* PNP is able t6 bind to.

' Figure 29
Reactivation of ATPase Activity by F,: A T in Preincubation Medium.
F, (11.6 pg) was added to a preincubation medium at 30 'C containing 50 mM Tris-OAc pH 7.5. 10 mM MgCl,, 10 mM PEP, 0.2 mg PK, 5 rnM Pi, 20 W M ATP, and AMP* PNP (0 - 1 PM). Nine minutes after adding F,. a 125 ct l aliquot of the preincubation medlurn was added to a packed Sephadex column (0.7 ml) and cennifuged on a tabletop centrifuge. At the -11th rnin (time 0 for the activity assay). 70 p1 of the eluate was added to an assay mediurn (incubated" at 30 'C for 3 min) containing 50 mM Tris-OAc pH ?.5. 10 rnM MgC1,. 10. mM PEP. 5 rnM Pi. 2 mM ATP, 0.2 mg PK, 0.11 mg LDH, and 0.15 mM NADH. The total assay volume was 1.0 rnl. The rate of NADH oxidation was monitored at 340 nm. The reactivation activity of the conuoi (AMP- PNP absent from the preincubation) was AA/rnin = 0.130 or 25.7 mole* min-lo mg-' (curve 1). Curves 2 - 4 contained 0.5. 0.75, and 1.0 p M AMP* PNP in the preincubation medium. respectiveiy.
curves 1 - 4 - 2 mln
Addition of F1 eluate

Table 1
Reactivation of F,-ATPase Activity
[AMP* PNP] Inhibition (%) Inhibition (Q) A Q'preact 1nhib;tion (%) in (9th min) (initial) Inhibition (steady-state)
preincubation (preincubation) (reassay (min- l ) (reassay) (P M)
'' Dara is from Fig. 28 and noa-linear fits of the reactivation curves from Fig. 29.

Figure 30
Apparent Rate Constants for F, Inactivatiox A Function of AMP* PNP and A.P Concentration.
The appxent rate constants for F, inactivation by &.!P- FNP are shown as a function ~f AMP* PNP and ATP concentrations. The curve symbsis ( . 0 , . . 0 ) correspond to A P concentrations of (20, 30, 45, and 63 pM); respectively. AMP- PNP concenuation ranged from 0.25 - 1.0 uM. Rate constant; were obtained under conditions given with Fig. 33 and were calculated as described in Appendix 5.


. kapp arises. a separate experiment was devoted to this problem. Erron of f 5.16 react
and 1 4 . B (the result of four determinations in each case) were assip'ed to the ' ,
apparent rate constants of inactivation and reactivation, respectively.
Determination of Iii for AMP-PNP Inhibition of Soluble F.-ATPase -
As mentioned earher, man!. workers have derermined KI values for AMP* PNP
inhibitior, of soluble F.-ATPase (11. 7 ? . 25, 36. 31). T h c Ki values which vaned from
14 nh4 to 0.92 DM. a d be. dependent on the experimental cond~tions used
AMP* PNP inhibition of F , -APase activity in a low ~ n h i b ~ ~ o r concenuauon range -
(50 - 150 IN), does show competitive inhibition with respect to ATP '(Fig. 51). The
Vrnax dnd Km values determined for the range of ATP concenuation used
(20 - 60 uM), were 5.43 urnole* nun-'. me-' and 45.6 pM. respectively. f i e secondary
plot of slope versus '&PO PNP mncenrration: shown in Fig. 32. 1s linear .at these
inhibitor concentrations. Since higher AMP. PNP concennations (to 1 pM) caused
si-pnificanr time-dependent inhibition dunng the course of the assay, Lneweaver-Bqk -
plots for a wide range of inhibitor concedration (0.05 - 1.0 bM), which are shown '
in Fig. 33, were obtained based on velocities calculated either on the initial rate
determined from a fit of the first order rate equation the data (when
- time-dependent inhibition was observed), or measured direcrly (when no ume-dcpenden!
inhibibon occurred). Fig. 33 shows that 1 B M AMP. PNP causes more ~nhlbwon than --
would be predxted ar the iower ATP ~ e n t r a t i o n s . as evldent b! the upward '
c u r y u r e of the pio:. This phenomenon wzs also observed b) Schuner et a . (27) - 4
Slopes calculated ar h e hlph ATP concenuauons. werc plotted versus lnhib~tor
amcenuation and are s h o w in F I ~ . 34. As seen with energized SMP. F; also

Figure 31
1
Lmeweaver-Burk Plots for AMP* PNP inhibition of F1-ATPase: Low AMP- PNP Concenua tions. -
F, (11.6 pg) was added to an assay medium incubating at 30 'C for 3 min which contained 50 rnM Tris-OAc pH 7.5, 10 rnM MgCl,, 10 mM PEP, 0.2 mg PK, 0.11 mg LDH, 5 m M Pi, AMP* PNP (0 - 150 nM), 0.13 mM NADH, and ATP (20 - 60 pM) as indicated F, added to the assay mixture initiated ATP hydrolysis. Tfie change in absorbance due to of NADH. w u o n i t o r e d at 340 m
, The total reaction volume was 1.0 used were: ( . 0 , . , 0 ) correspondtng to AMP* PNP mncen 50. 100, and 150 nM). respectively.


Figure 31
Secondary Plot - for AMP* PNP dnhibition of F,-ATPase Ac t iv i~ : Low AMP- PNP Concentrations.
The slopes from the Lineweaver-Burk plots shown in Fig. 31 were plotted versus AMP- PNP concentration. The apparent Ki was determined to be 0.25 wM.


, Figure 35
Lineweaver-Burk Plots for AMP* PNP Inhibition of F,-ATPase.
F, (10.2. 11.6, or 12.4 ug) was added to an assay medium incubating at 30 'C for 3 rnin which conrained 50 rnM Tris-OAc pH 7.5. 10 mM MgC12, 10 rnM PEP, 0.2 m i PK, 0.11 mg LDH, 5, rnM Pi, AMP* PNP (0 - 1.0 uM), 0.13 rnM NADH, and ATP (20 - 60 uM) as indicated F, added to the assay mixture initiated ATP hydrolysis. The change in absorbance due to the oxidation of NADH. was monitored at 340 nrn. The total reaction volume was 1.0 ml. Symbols used were: ( . 0 . . , , -A , -k . X $ corresponding to AMP* PNF concentrations of (0. 0.05. 0.1. 0.15, 0.5. 0.75,kand 1.0 pM). respectively. The initial velocities were either calculated from a non-linear fit (when timedependent ihhibition was observed) or directly (when no timedependent inhibition was observed).

[ ATP I-' , ( m ~ - ' )

- displayed a nuvilinear secondary plot which-was biphasic A fit of the equation
derived for the model shown in Fig. 14 to the data shown in Fig. 34 is shown in
Fig. 35. Assuming that the equilibrium wnstants for the two A V hydrolysis steps
(kl/kl and kl, /kll)are equal to 0.5. then the Ki value for binding a single
AMP* PNP molecule to F,, would be 0.16 pM. This value is in good agreement with
hose reported by the -majority of workers, but it is an order of magnitude greater
- -than the value determined by Cross and Nalin (11). The discrepancy in the Ki values
may reside in the assay technique employed. In all other studies, F, ~ was added to the
assay medium to initiate ATP hydrolysis, whereas Cross and Nalin initiated hydrolysis \ with the addition of ATP after a 10 rnin incubation Studies by Kironde and Cross
1 '(49) have shown that beef heart F, stored as a (~),SO,/ATP/EDTA/sucrose/Tris, 0 -
2
pH 8.0 suspension, contains three bound adenine nucieotides after Sephadex gel %
filtration. Two of these adenine nucleotides are bound to non-exchangeable sites, and
the third at aff-exchangeable site. It .is possible that dilution of the enzyme into an
assay medium not containing ATP would allow' the nudeotide bound at the catalyoc
site to dissociate. The long preincubation (10 rnin) of F, with AMP- PNP may allow
AMP* PNP to bind to this high affmity site; it is very likely that it is this site for
which Cross and Nalin measured a Ki value of 14 nM. The presence of- ATP, which
shows a high affinity for this site (Ka = 1011 M-I ) '(45). would effectively prevent
AMP* PNP from interacting at this site. A comparison of the Ki values determined for
the binding of a single h'L.IP. PNP molecule to
SMP (0.58 PM), shows that energization lowers
agreement with Penefsky (47) .who showed that
by succinate or NADH, ATP afinity decreased.
F,-ATPase (0.16 pM) and energized
AMP* PNP affinity. This is in
upon energization of KCl-wash'ed- SMP
Cherynak and Kodov (50) also showed
that succinate induced energization relieved AMP* PNP inhibition, consistent with a
change in A M P ~ N P affinity.

Figure 34
Secondary Plot for &PO PNP Inhibition of F,-ATPase Activity.
TLe slopes fron the Lineweaver-Burk plots (obtained in the high ATP concentration region) shown in Fig. 33, were plotted versus AMP* PNP concentration.

I 1 I I l l , , I I l l l I l ~ l l l
I 0.2 0.4 0.6 0.8 1 1.2

Non-Linear Fit of the Rate Expression Derived for Model 1 to Fig. 34,
Slope expression was:
slope = Km .{1 + P l * [ l J } Vmax 1 + P2- [u
Fit:
Correlation Mamx: 1.00 0.99 1.00
a and b are defined . in Appendix 3
KmIVrnax = 4.83 rnmole- ' min * mg mM P1 = 6.38 f 0.75 - P2 = 1.20 5 0.25 \

-
[ AMP-PNP ] , ( p M )

-
Given the r 6 d t S of Cross and Nalin, and the fact that binding of AMP- PNP
causes ADP release . .
- F,-ATPase- may be
(24). the complete model for AMP* PNP interaction with
best represented by the model shown in Fig 36. This model
shows that AMP- PNP binding to F, can result in the determination of three unique P
Ki values, depending on the assay conditions. The ability of AMP* PNP to bind u,
the high affinity site measured by C m s and Nalin, is dependent on the level of ATP
present during the preincubtion, as well as the rate a i -which A 3 P dissociates from
this site during single site catalysis.

anim far

IED
) low affinjty
change in binding
affinity

(3IAmm VI
SUMMARY k%D FUTURE WORK
As can be seen, the mechanism of ATP hydrolysis catalysed by mitochondria1
ATP spthase and its inhibition by AMP* PNP. is very complex. .4MP* PNP inhibition
of ATP hydrolysis catalysed by energized SMP was shown to be insensitive to
increasing mncentra.tions of ADP under the conditions used.
I . . Due to the existence of multiple mtaly-tic sites. Ki values determined frm
secondary plots were expected to van. depending on experimental con&tions used.
Hl~erbolic competiuve mhibition was observed, which was consistent with a m d e l in
which binding of two AMP* PNP m o l d e s occurred, both competitive with respect to
ATP. The dissociation consrants (Ki and Ki:) were 'determined to be 0.58 pM and
19 pM. rapa ive ly . AhfP- PNP inhibition of F,-ATPase activity also displayed
hyperbolic competitive inhibition, consistent with the binding of a single AMP- PNP
molecule with a KI of 0.16 PM.
AMP* PNP inhibtion was shown to be time-dependent when ATP hydrolysis was
catalysed by non-energized SMP or F,. in contrast to catalysis by energized SMP. This
inhibition was shown to be totally reversible with non-energized SMP. whereas only
6% activity was recovered with F,-ATPase. The remaining inhibition is amibupd to
AMP- P W bound ar a high affinity site. Funher studies are needed to explain
time-dependent AMP* PNP inhibition of ATP hydrolysis catalysed by F, or SMP.
Ideall!.. radiolabeled AMP* PNP should be used to correlate the arliounr of AMP* PNP
bound to F, with the level of inhibition. Double labelling stuhes will make 'it p s i b l e
to determine whether the remaining ~nhibition observed at steady-state is due to
AMP- PNP bound ar a catalytic site, or its hydrolysis producr, AMP* PNH,. i

Since the ATP analog AMP- PNP appean to be a one way inhibitor of the
AT? synthase complex, it would be beneficial to synthesize 'the ADP analog -
AMP-PNH,, - and determine if it acn as a one way inhibitof of ATP synthesis. Fumre
studies m a y also show that the ATPase activity observed using F, and SMP
preparations is due to F, devoid o or F, possessing IF, conformationally different w than its in vivo counterpar, Possible ordered binding of substrates and the role of IF,
may provide researchers with the key to elucidating the mechanism of the ATP
synthase complex.

- APPENDICES
APPENDIX 1
The steady-state concentration of ADP in a ATP hydrolysis medium was
determined knowing the specific activity L . d Km value for ADP at saturating PEP, for
the PK used, and simple r ~ a q e r n e n t of' the Michaelis-Menten equation (Eg. 1) in
terms or tho ADP concenuation (Eqs.Lan,c! 3).
P
V = Vmax [ADP] \
where Vmax = maximum rate = kcat [total PK]
V = .rate observed
Km = [ADP] which gives half maximal velocity
Equation 1
Vmax - 1'
Equation 2

- - v Km -
SA [stock PK] volume of stock PK used - V
where SA = specific activin: of PK used
Equation 3 '

Dead-end inhibitors which bind to the same enzyme f o q that the substrate
does, are known as competitive inhibitors. The simple reaction mechanism is shown in
Fig. 1.
-'*
where E = free form of the enzyme
'. S = substrate
I = inhibitor
P = product
Figure 1

. *. >. Deriving the rate equation for product formation for the scheme shown above
(steadystate approximation), yields' Eq. 1.
v = Vmax
where Vmax = maximum velocity = k,* e
Krn = [ S ] = (k: + k , ) /k , 0.5. Vmax
Ki = dissociation constant for enzymeinhibitor'
complex
e = total enzyme concentration
Equation 1
A Lineweaver-Burk plot (1/V vs l/[S]) for competitive inhibition would therefore obey
v Vmax Vrnax [ Sl
Equation 2

Fig. 2 shows typical Lineweaver-Burk plots. 0
Figure 2
From Eq. 2, the slope from a Lineweaver-Burk plot would be given by Eq. 3.
slope = Krn ' (1 + [fl K i )
Vrnax '
Or in other terms,
Equation 3
siope = Km Km +
[ I1
Vmax Vrnax Ki

This would predict a sec0nCh-v plot (slope vs. [I)) to be linear as shown in Fig. 3.
'Kj
Figure 3
The horizontal intercept would correspond to the negative of the dissociation constant
(Ki) for the enzymeinhibitor complex ' .-

The derivation of the rate expression for the model (shown - - below) of
AMP* PNP inhibition of ATP hydrolysis catalysed by SMP or F,, is presented here. - -
Model 1: _(binding of a single AMP* PNP molecule)
T TED IED
D T&y
kl E D ~ ~ I E D - k,, ET --r-
k12 - IET
The steady-state rate expressions for the different enzyme species are: \

1
Simplification of the rate expr-ion was as follows:
where Vmax = k,k,e
2. Eq. 1 now reduces to:
Equation 2

1
Simplification of the rate expre3sion was as follows:
1. Setting [a = 0, the rate equation becomes:
2. Eq. I now reduces to:
where Vmax =
Equation 2

This reduces to:
k k e 10 12 , 11'1
[i] + (kg+klO) (kl l+k12)


Dividing h e dmominaro: and numerator by:
b e rare expression becomes:
,,7 = Vmax ['I']
v = - Vmax ['r]
where k: (k : : + k::)

The inverse of Eq. -3 is:
The mechanism predicts' competitive inhibition with a slope which varies with inhibitor
concentration by the following equation:

I
APPENDIX 4
f
The derivation of the rate expression for the model (shown below) of
AMP* PNP h i b i t i o n of ATP hydrolysis catalysed by SMP or F,. is presented here.
Model 2: (binding of two AMP* PNP molecules)
TED
The sthdy-state rate expressions for the different enzyme species are the same as
those given in Appendix 3, with the following change-Tn d[lED]/dt, and addtion of

Enzyme conservation equation is given by: T
e = [a + [ED] + [TED] + [ED] + [m] + [a+ [Lm]
Rate expression for product (D) formation is:
After appropriate manipulation of the above equations (and those given in Appendix
3), the rate expression in terms of ([I, e, and [q), was determined LO be:
Equation 1

Using the simplification techniques used in Appendix 3, and again assuming
V m = Vrnax' , thy Eq. 1 reduces to:
17 = Vmax [TI
where Vrnax and Krn lare as defined in
Appendix 3
Equation 2

Eq. 2 can also be written as:
Vmax [T] v =
where a =
Equation 3

The inverse of Eq. 3 is:
v Vmax Vmax 1 1 + b[ l ] j ~ i ) [TI
The mechanism therefore predicts competitive inhibition, with the slopes fin . -
Lineweaver-Burk plots, to vary with inhibitor concentration by the following equation:
slope = i 1 + a - [I-j/K-1* (1 + c * [u/Ki,)
Vmax 1 + b*[fl!h

APPENDIX 5 . .
The equations which were used to describe the timedependent inhibition or
recovery of activity observed using non-energized SMP or F, was a simple first-order
process with respect to the rate of ATP hydrolysis. The derivation of an expression
which relates absorbaxe to time, is described here.
-kt V = ( V o - V ) e + V - (inactivation)
w 0,
where V = velocity at any time t
V, = initial rate e
V = steady-state rate 0,
k = apparent rate constant of inactivation
or reactivation
-kt dA = (V, - V )e + - V
I -- a, 0,
dt

where A = absorbance at any time t
A, = initid absorbance
Note: The term (V, - V )/k in the inactivation and reactivation processes, is m
ygative and positive, respective!^. - -

BIBLIOGRAPHY -
Futai, M., and Kanazawa, H. (1983) Microbid. Rev. 47, 285 - 312
Walker, J.E, Fearnley, I.M.. Gay, NJ.. Gibson, B.W., Northsop, F.D., Powell. S.J.. Runswikk M.J.. Saraste, M., and Tybulewia, V L J . (1985) J . Md. Bid. 184. 677 - 701
Ernster, L (1984) C u r . Topics Cell. Regui. 24, 313 - 334
Yoshida, M. (1983) Biochem. Biophys. Res. Com'mun. 114, 907 - 912
Yohda, M, Kagawa, Y., and Yoshida, M. (1986) Biochim. Biophys. Acta 850, 429 - 435
Sakamoto. J. (1984) J. Biochem. 96, 475 - 481
Sakamoto, J. (1984) J. Biochem. 96, 483 - 487
Feldman, R.I. and Sigman, D.S. (1982) J. Bid. Chem. 257, 1676 - 1683
Feldrnan, RI. and Sigrnan, D.S. (1983) J. Bid. Chem. 258, 12178 - 12183
Penefsky, H.S.. Pullman, ME, Datta, A, and Racker, E (1960) J. Bid. Chem. 235. 3330 - 3336
b
Cross, RL, and Nalin, C.M. (1982) J. Bid. Chem. 257, 2874 - 2881
Harris, D .k , Gome:-Fernandez, J.C., Klungs0y1, L, and Radda, G.K. (1978) Biochim. Biophys. Acta 504, 364 - 383
Sloothaak, J.B., Berden, J.A., Herweijer. M.A, and Kemp, A. (1985) Biochim. Biophys. Acta 809. 27 - 38
Grubmeyer, C., and Penefsky, H.S. (1981) J. Bid. Chem. 256, 3718 - 3727
Van Dongen, M.B.M., 'De Geus, J.P., Korver, T., Hartczg. A.F. Hartog, and Berden, J.A. (1986) Biochim. Biophys. Acta 850, 359 - 368
Van Dongen. M.B.M., and Berden, J.A. (1986) Biochim. Biophys. Acto 850, 121 - 130
Gromet-Elhanan, Z., and ~hananshvili, D. (1984) Biochemistry 23, 1022 - 1028
Durn, S.D. and Futai, M. (1980) J. Bid. Chem. 255, 113 - 118
Kayalar, C., Rosing, J., and Boyer, P.D. (1977) J. Bid. Chem. 252, 2486 - 2491
20. ' Kasho, V.N., and Boyer, P.D. (1984) J. Biwnerg. Bimemb. 16, 407 - 419

Vignais. P.V., and Lrwdi . J. (1985) Ann. Rev. Biochem. 54. 977 - 1014
Yount RG., Babcock, D., Ballantyne, Wm, and OjaIa, D. (1971) ~ i o c h e m i s t r ~ 10, 2484 - 2489
Yount, RG., Ojala, D., and Babcock, D. (1971) Biochemistry 10, 2490 - 2496
Beharry, S . (1985) Ph.D Thesis, Simon Fraser University, ,Bumaby, B.C.. .Canada
Taylor, J.S. (1981) J. Bid. Chem. 256. 9793 - 9795
Tomaszek Jr., T.A., and Schuster, S.M. (1986) J. Bid. Chem. 261, 2264' - 2269 f .
Schuster, S.M., Ebel, P-E, and Lardy, H.A. (1975) J. Bid. Chem. 250, 7848 - 7853
Belda, F.J.F., Carmona, F.G., Canovas, F.G., Gomez-Fernandez, J.C., and Lozano, J.A. (1983) Biochem. % 210, 727 - 735
I -#hnd , P.C., LaBelle, W.C., and Lardy, H.A (1974) Biuchemistry 13, 4549 - 4553
Melnick, R.L. Tavaras de Sousa. J., Maguire. J., and Packer, L. (197 Biochem. Biophys. 166, 139 - 144 9 Arch.
Penefsky, H.S. (1974) 1. Bid. Chem. 249, 3579 - 3585
Garren N.E. and Penefsky, H.S. (1975) J. Bid. Chem. 250. 6640 - 6647
Gresser, M.J., Myers, J.A., and Boyer, P.D. (1982) J. Bid. Chem. 257, 12030 - 12038
Rosen, G., Gresser, M., Vinkler, C., and Boyer, P.D. (1979) J. Bid. Chem. 254, 10654 - 10661
Ortiz-Flores, G., Amta, A, and Gomez-Puyou, A. (1982) Biochim. Biophys. Acla 679. 466 - 473 4
Nalin, C.M., and Cross, R.L. 11982) J. Bid. Chem. 257, 3055 - 8066
Lunardi, J., and Vignais, P.V. (1982) Biochim. Biophys. Acta 682, 124 - 134
Mitchell, P. (1961) Nature I91, 144 - 148
Smith, A.L. (1967) Methods in Enzvmdoa 10, 81 - 86
Beyer, R.D. (1979)' M e t h d ~ i n Enzmdoqy 55, 186 - 194
Knowles. A.F., and Penefsky. H.S. (1972) J. Bid. Chem. 247, 6617 - 6623
Penefsky, H.S. (1979) Methods in Enzvmdogy 55, 304 - 308
b w r y . O.H., Rosebrough. NJ.. Fan, AL, and Randall, RJ. (1951) J. Bid. Chem. 193, 265 - 275
Penefsky, H.S. (1977) /. Bid. Chem. 252, 2891 - 2899
Grubmeyer. C.. Cross. R.L, and Penefsky. H.S. (1982') J. Bid. Chem. 257. 12092 - 12100 - Penefsky. H.S. (1985) J Bid. Chem. 260. 13728 - 13734
Penefsky. H.S. (1985) 1. Bid. Chem. 260, 13735 - 13741
Penefsky, H.S. (1985) Proc. Natl. Acad. Sci. 82, 1589 - 1593
Kironde, F.A.S., and 'cross, RL (1986) J. Bid. Chem. 261, 125fl - 12549
Chempak, B.C.. and Kozlov, LA. (1977) FEBS Letters 104, 215 - 219