Embed Size (px)
Citation preview

'I i Pacific Northwest
National Laboratory Operated by Battelle for the U.S. Department of Energy
? I
4
, . 'Prepared for the U.S. Dep&&ent'of Energy , . , . ,
': ' . ;under' Contract DE-ACO6-76RLO . , ' - r1830- , ,
. . ,. , ,


DISCLAIMER
Portions of this document may be illegible in electronic image products. Images are produced from the best available original document.

!
PNNL-1182 1 UC-602.
Drying Results of K-Basin Fuel Element 5744U (Run 4)
G. S. Klinger B. M. Oliver J. Abrefah
S. C. Marschman P. J. MacFarlan G. A. fitter
July 1998
Prepared for the U.S. Department of Energy under Contract DE-ACO6-76RLO 1830
Pacific Northwest National Laboratory Richland, Washington 99352

Summary
An N-Reactor outer fuel element that had been stored underwater in the Hanford 100 Area K-West Basin was subjected to a combination of low- and high-temperature vacuum dryiig treatments. These studies are part of a series of tests being conducted by Pacific Northwest National Laboratory on the drying behavior of spent nuclear fuel elements removed from both the K-West and K-East Basins.
The drying test series was designed to test fuel elements that ranged from intact to severely damaged. The fuel element discussed in this report was removed from K-West canister 5744U during the third fuel selection campaign, conducted in 1996, and has remained in wet storage in the Postirradiation Testing Laboratory (PTL, 327 Building) since that time. The fuel element had a separated top cap with extensive corrosion near the separation. Cracks and splits were also noted. K-West canisters hold up to seven complete &el assemblies, but, for purposes of this report, the element tested here is designated Element 5744U.
The drying test was conducted in the Whole Element Furnace Testing System located in G-Cell within the PTL. The testing system is composed of three basic systems: the in-cell furnace equipment, the system gas loop, and the analytical instrument package. Element 5744U was subjected to the drying processes based on those proposed under the Integrated Process Strategy, which inciided a hot drying step. The test cycles are listed below:
0 Cold Vacuum Drying (CVD) at -5OOC under vacuum (-17 hr)
Pressure Rise Test at -50°C (-1 hr)
0 Hot Vacuum Drying (HVD) for a total of -65 hr (-23 hr at -8O"C, -35 hr at -8OOC to 400"C, and ,
-7 hr at -4OOOC)
System Cooldown to -50°C (-3 1 hr)
0 Post-Test Pressure Rise Test at -50°C (-1 hr).
Approximately 15 ml of water were observed in the condenser during the condenser pumpdown phase of CVD, and an additional -0.5 mg of water was removed during the post-CVD Pressure Rise Test. This release is likely fiornpee water that was trapped and not completely released during CVD. Comparison of the total and moisture pressure rises from the post-CVD and post-HVD Pressure Rise Tests suggests that other sources of gas are responsible for some of the total pressure rise observed in the post-CVD test.
During the first segment of HVD, -0.7 g of water was removed at temperatures below 80OC. The second phase of HVD released -0.3 g of water with a single broad peak at -138OC. The single broad peak in the moisture release during this phase indicates water release from chemisorbed sites (i.e.,
iii

hydrated species) at higher temperatures. Unlike earlier runs, thermal decomposition of the hydrated species was not the most significant factor in controlling the removal of water fiom the system during the HVD. The final phase of HVD at 400°C released -4 mg of water, kith an additional -3 mg of water released during post-HVD, cooldown.
The water released after the post-CVD Pressure Rise Test is attributed chiefly to release fiom regions beneath the cladding and fiom under the corroded regions. Decomposition of metal oxy-hydrates may also account for some of the release. Water released. fiom the element fiom isolated regions may be the controlling factor in post-CVD water removal. As observed in previous drying tests, a temperature above 400°C may be required for complete drying of the fuel element within a reasonable period of time.
Hydrogen data were obtained fiom the gas chromatograph during HVD when argon was flowing through the system. .Approximately 24 mg of hydrogen were released during HVD-1. Hydrogen release during HV?-2 occurred in two noticeable broad peaks (-170°C and -265OC), the first of which roughly (-80 mg) corresponded with a similar water release. The molar quantity of hydrogen released was greater than the water release, which suggests that most of the water released was reacting with the fuel to produce hydrogen. The latter hydrogen release peak (-73 mg) at - 265OC was due to uranium hydride decomposition. Above -265OC, the level of hydrogen decreased with time, with -33 mg of hydrogen released during HVD-3. Total hydrogen release during HVD was -200 mg.
iv

Quality Assurance
This work was conducted under the Quality Assurance Program, Pacific Northwest National Laboratory (PIWL) SW-70-001, S W Quality Assurance Program, as implemented by the PNNL SNF Characterization Project Operations Manual. This QA program has been evaluated and determined to effectively implement the requirements of DOERW-0333PY Office of Civilian Radioactive Waste Management Quality Assurance Requirements and Descripron (QARD). Compliance with the QARD is mandatory for projects that generate data used to support the development of a permanent High-Level Nuclear Waste repository. Further, the U.S. Department of Energy has determined that the te.sting activities which generated the results documented in this report shall comply with the QARD. Supporting records for the data in this report are located in the permanent PNNL SNF Characterization Project records, Furnace Testing of SNF Fuel Element 57442% .
V


Contents
Summary ............................................................................................................................................ iii
Quality Assurance .............................................................................................................................. v
Acronyms ........................................................................................................................................... xiii
1 . 0 Introduction ................................................................................................................................ 1.1
2.0 Whole Element Furnace Testing System ................................................................................... 2.1
2.1 Major Systems Overview .................................................................................................. 2.1 .
2.2 Vacuum Pumping System .................................................................................................. 2.4
2.2.1 Varian Scroll Pump ......... : ....................................................................................... 2.4
2.2.2 Water Condenser .................................................................................................... 2.4
2.2.3 Pipmg, Valves, and Filters ...................................................................................... 2.5 . .
2.2.4 System Line Heaters ............................................................................................... 2.5
2.3 Process Heating System ..................................................................................................... 2.5
2.4 Gas Supply/Distribution System ........................................................................................ 2.7
2.5 Gas Analysis Instrumentation ............................................................................................ 2.8
2.5.1 Bakers Omnistar Mass Spectrometer ..................................................................... 2.8
2.5.2 MTI M.200 Gas Chromatograph ............................................................................. 2.8
2.6 . Process Instrumentation ..................................................................................................... 2.9
2.6.1 Panametrics Moisture Monitor ............................................................................... 2.9
2.6.2 MISS Baratron Pressure Transducers ...................................................................... 2.10
2.6.3 Cole-Parmer Pressure Transducers ......................................................................... 2.11
2.6.4 Thermocouples ....................................................................................................... 2.11
vii

. . . . . -_-.
, ... ..... ... __ ............ -.-------
2.7 Data Acquisition and Control System ............................................................................... 2.11
3.0 Vacuum Drying Testing ofElement 5744U .............................................................................. 3.1
3.1 Fuel Element Transfer and Loading .................................................................................. 3. 1
3.1.1 Pre-Test Visual Inspection ...................................................................................... 3.1
3.1.2 Fuel Element Rinsing ............................................................................................. 3.1
3.2 Fuel Element Drying .............................. ; ........................................................................... 3.1
3.2.1 Cold Vacuum Drying .............................................................................................. 3.3
3.2.2 Pressure Rise Test ................................................................................ : .................. 3.3
3.2.3 Hot-Vacuum Drying. Step 1 .................................................................................... 3.4
3.2.4 Hot-Vacuum Drying. Step 2 ....................................................................... ........... 3.4
3.2.5 Hot-Vacuum Drying. Step 3 .................................................................. : ................ 3.4
3.5 3.2.6 System Cooldown and Post-Test Pressure Rise Test .............................................. 3.3 Calculation of Water and Hydrogen Inventories ............................................................... 3.5
4.0 Visual Examinations of Element 5744U .................................................................................... 4.1
. . 4.1 Pre-Test Visual Exammation ............................................................................................. 4.1
4.2 Post-Test Visual Examination ........................................................................................... 4.2
5.0 Experimental Results ................................................................................................................. 5.1
5.1 Cold Vacuum Drying ......................................................................................................... 5.1
5.2 Pressure Rise Tests .............................................................................................................. 5.1
5.3 Hot Vacuum Drying .......................................................................................................... 5.8
5.4 Gas Chromatograph Measurements ................................................................................... 5.8
viii

5.5 Mass Spectrometer Measurements .... ; ............................................................................... 5.13
6.0 Discussion ................................................................................................................................ 6.1
7.0 References ........................ : ....................................................................................................... 7.1
8.0 Supporting Documents and Related Reports ............................................................................. 8.1 I
ix
... . . . . . . - ... . . I . ~
.... ........ . . . : ..,. , -~ ___ .
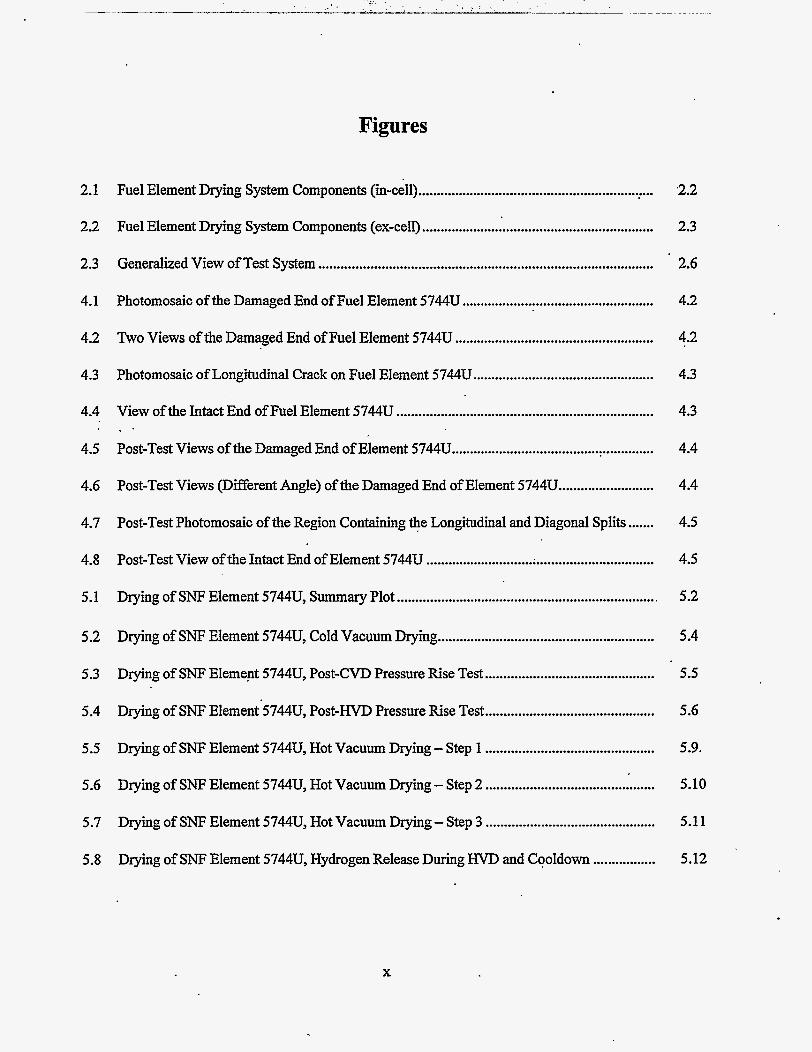
Figures
2.1 Fuel Element Drying System Components (in-cell) ............................................................ .. ... 2.2 Fuel Element Drying System Components (ex-cell) ............................................................... 2.3 Generalized View of Test System ........................................................................................... 4.1 Photomosaic ofthe Damaged End of Fuel Element 5744U ....................................................
4.2 Two Views ofthe Damaged End ofFuel Element 5744U ...................................................... 4.3
4.4
Photomosaic of Longitudinal Crack on Fuel Element 5744U ................................................. View ofthe Intact End of Fuel Element 5744U ......................................................................
4.5 Post-Test Views ofthe Damaged End ofElement 5744U ....................................................... 4.6 Post-Test Views (Different Angle) ofthe Damaged End ofElement 5744U .......................... 4.7 Post-Test Photomosaic of the Region Containing the Longitudinal and Diagonal Splits ....... 4.8 Post-Test View ofthe Intact End ofElement 5744U ..............................................................
.2.2
2.3
2.6
4.2
4.2
4.3
4.3
4.4
4.4
4.5
4.5
5.1 Drying of SNF Element 574413; Summary Plot ....................................................................... 5.2
5.2
5.3
Drying of SNF Element 5744Uy Cold Vacuum Drying ........................................................... 5.4
5.5 Drying of SNF Element 5744Uy Post-CVD Pressure Rise Test ..............................................
5.4 Drying of SNF Element 5744Uy Post-HVD Pressure Rise Test .............................................. 5.6
5.5
5.6
Drying of SNF Element 5744Uy Hot Vacuum Drying . Step 1 .............................................. Drying of SNF Element 5744Uy Hot Vacuum Drying - Step 2 ..............................................
5.9.
5.10
5.7 Drying of SNF Element 5744Uy Hot Vacuum Drying . Step 3 .............................................. 5.11
5.8 Drying of SNF Element 574423; Hydrogen Release During HVD and Cooldown ................. 5.12
X

Tables
2.1
3.1 Summary ofNominal Test Design Conditions ......................................................................... 5.1 Fuel Element 574411 Drying Run Time Line ............................................................................
Water and Ice Vapor Pressure Data Versus Temperature ......................................................... 2.10
3.2
5.3
xi

Acronyms
ATS CVD DACS
ET GC HP HVD ID IPS MS
NIST OD P h L PTL4
QA QARD SFEC SNF UHP VP
Applied Test Systems Cold Vacuum Drying data acquisition and control system
elapsed time gas chromatograph Hewlett Packard Hot Vacuum Drying inside diameter Integrated Process Strategy mass spectrometer
National Institute of Standards and Technology outside diameter Pacific Northwest National Laboratory Postirradiation Test Laboratory Quality Assurance Quality Assurance Requirements and Description single fuel element canister spent nuclear fuel ultra high purity vapor pressure b
. -
. I
xiii .

1.0 Introduction
The water-filled K-Basins in the Hanford 100 Area have been used to store N-Reactor spent nuclear fuel (SNF) since the 1970s. Because some leaks in the basins have been detected and some of the fuel is breached due to handling damage and corrosion, efforts are underway to remove the fuel elements fiom wet storage. An Integrated Process Strategy (IPS) has been developed to package, dry, kansport, and store these metallic uranium fuel elements in an interim storage facility on the Hanford Site (WHC 1995). Information required to support the development of the drying processes, and the required safety analyses, is being obtained fiom characterization tests conducted on fuel elements removed fiom the K-Basins. A series of whole element drying tests (reported in separate documents, see Section 8.0) have been con- ducted by Pacific Northwest National Laboratory (€'NNL)(a) on several intact and damaged fuel elements recovered fiom both the K-East and K-West Basins.
This report documents the results of the fourth of those tests, which was conducted on an N-Reactor outer fuel element removed fiom K-West canister 5744U. This'element (referred to as Element 5744U) was stored underwater in the K-West Basin fiom 1983 until 1996. Element 5744U was subjected to a combination of low- and high-temperature vacuum drying treatments that were intended to mimic, wherever possible, the fuel treatment strategies of the IPS. The system used for the drying test was the Whole Element Furnace Testing System, described in Section 2.0, located in the Postirradiation Testing Laboratory (PTL, 327 Building). The test conditions and methodologies are given in Section 3.0. Inspections of the fuel element before and after the test are provided in Section 4.0. The experimental results are provided in Section 5.0, and discussed in Section 6.0.
(a) Operated by Battelle for the U.S. Department of Energy under Contract DE-ACO6-76RLO 1830.
I. 1.1

2.0 Whole Element Furnace Testing System
A complete description for the Whole Element Furnace Testing System, including detailed equipment specifications, is provided inRitter et al. (1998).
2.1 Major Systems Overview
hoverview of the furnace testing system is presented in this section. The subsystems pertinent to this test report are as follows:
Vacuum Pumping System - This system consists of a scroll-type vacuum pump, a condenser with chiller, filters, valves, and piping, which provide the vacuum pressures and flows required for the proposed IPS vacuum processes.
0 Process Heating System - This’system consists of a resistively heated, clam-shell furnace and a , sample chamber (retort) to provide heating to the fuel element and to control process temperatures.
Gas Supply/Distribution System - This system consists of gas bottles; mass flow controllers; piping; and valves for metering argon, air, or oxygen through the system. A bubbler is also available for adding water vapor to the system if desired.
0 Gas Analysis Instrumentation - The gas analysis instrumentation includes a 300-amu quadrupole mass spectrometer ( M S ) and a gas chromatograph (GC) for monitoring selected elements in the process gas stream.
0 Process Instrumentation - The system is equipped with several instruments for measuring process temperatures, pressures, and moisture level. An auxiliary turbo vacuum pumping system provides low system pressures for zero adjustment of the high accuracy retort pressure sensor.
0 Data Acquisition and Control System (DACS) - The DACS consists of an lBM-compatible computer and data acquisitiodcontrol unit to monitorktore key system parameters (temperatures, pressures, flows, moisture level), along with controlling the process heating system and a safety argon system.
Figures 2.1 and 2.2 are photographs of the equipment located inside and outside of the PTL G-Cell. The furnace (including retort) and some of the process piping, instrumentation, and valves are located inside the hot cell. The furnace sits on the cell floor, and the process piping is routed to a rack that hangs on the west cell wall. Process piping and electrical power and instrumentation wires pass through several split plugs on the west side of the cell. The process piping on the outside of the cell is contained within a glove bag, which provides a secondary containment as a precaution in case the process piping lines become contaminated. The vacuum pump, condenser, bubbler, GC, and the remainder of the instrumen- tation and valves are located inside this glove bag. Instrumentation and electrical power wires are routed through pass-through sleeves on the sides of the glove bag to the instrument rack and computer console.

bD c .d
2. a
2.2

' - -
.
2.3

The instrument rack contains the readouthontrol k i t s for the pressure sensors, moisture sensor, and flow controllers, along with the heat trace temperature controllers, data acquisitiodcontrol unit, turbo pump controller, GC laptop computer, and unintermptible power supplies. The computers for the DACS and MS are located next to the instrument rack. The following sections provide more detailed descrip- . . tions of the components for these subsystems.
2.2 Vacuum Pumping System
The vacuum pumping system provides the pressures and flows requireG &.,r the propose1 IPS proc- esses. This system connects the furnace retort with all the other components of the test system through various valves, fittings, and piping. The vacuum pumping system consists of the following components:
0 scroll pump for evacuating the system to pressures below. 1 Torr
0 water condenser with refiigerated chiller for gross removal of water
valves and piping for connecting the various components and controlIing the flow direction
particulate filters to prevent the spread of contamination
0 heating cords with temperature controllers for preventing condensation in lines.
2.2.1 Varian Scroll Pump
The system vacuum pump is a Varian model 300DS scroll pump. This pump has an ultimate vacuum pressure less than Torr and a peak pumping speed of 250 Vmin (8.8 cfm). These pressures and flows are more than adequate for simulating the conditions of the proposed IPS vacuum processes. For a single fuel element, this amount of flow may be more than desired. Therefore, a metering valve was 'installed on the pump inlet to throttle the flow to lower levels as required. The desired system pressure is achieved by either using the metering valve or flowing ultra high purity (UHI?) argon into the system through the entire gas loop or via a direct injection of ballast gas at the pump inlet. The use of argon gas helps to pre- vent the in-leakage of moisture-containing air through small system leaks (which are difficult to elimi- nate) that would interfere with process monitoring equipment.
2.2.2 Water Condenser
The scroll vacuum pump can be damaged by condensation of liquid water in the scroll mechanism, and, since each fuel element is wet at the start of each test, the possibility of pump damage was considered. A water condenser with corresponding chiller was installed in the system to condense the 6ulk'of the water before it reaches the pump. This condenser can be valved into the system in series with the scroll vacuum pump, or it can be bypassed if not needed. The condenser cannot trap all the liberated free water, but is efficient at removing the majority of free water in the system. The condenser is only
2.4

used during the frrst phase of a Cold Vacuum Drying (CVD) test for a single fuel element. The condenser was custom fabricated specifically for this system. Detailed sketches and specifications for the condenser are given in Ritter et al. (1998).
’ 2.2.3 Piping, Valves, and Filters
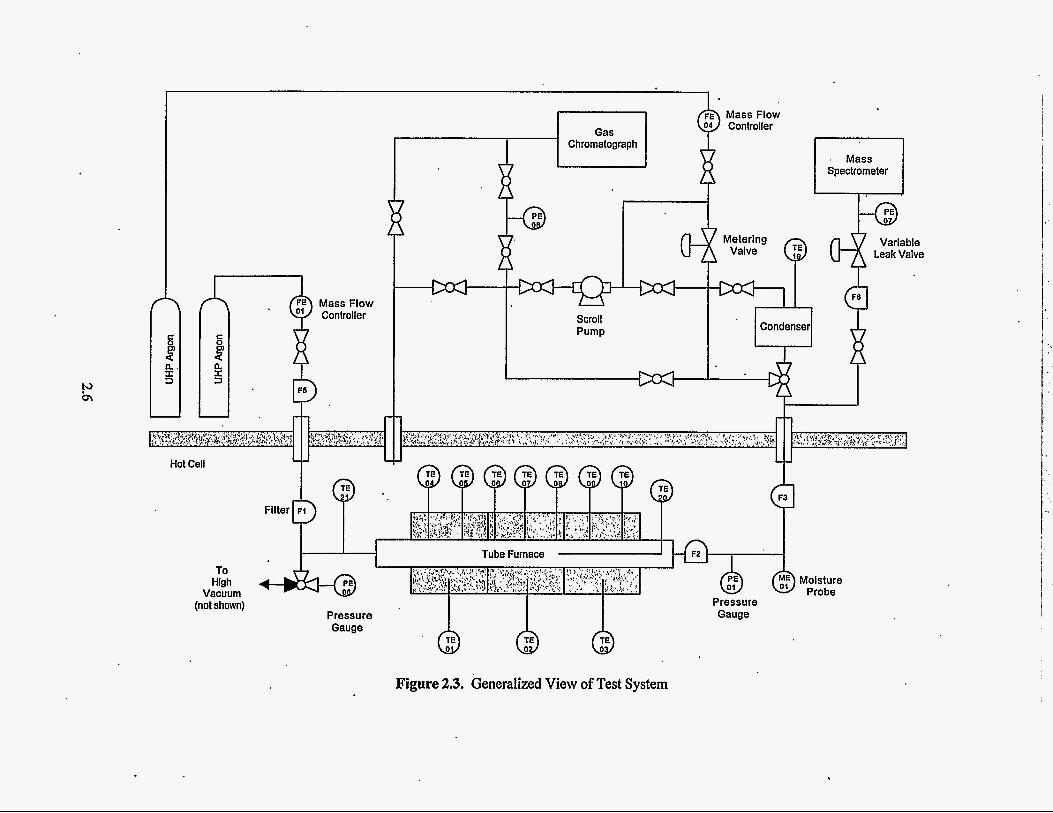
The vacuum pumping system connects the system components through various valves, fittings, and piping. A simplified piping schematic for the system is shown in Figure 2.3. This schematic shows the basic flow path of gases through the system that was used for this test, along with the relative locations of the major components, valves, and instruments. Detailed system piping diagrams are provided in Ritter et al. (1998), along with approximate lengths for the piping lines. As seen in Figure 2.3, there are numer- ous valves in the system that are used to direct the flow to and from the various components. Most of the valves in the system are ball valves and range from 1/4 in. to 1/2 in. nominal size. The system piping is constructed of thin wall tubing (1/4 in. to 1/2 in. OD) and is typically connected using simple Swagelok fittings (tees, elbows, unions, etc.). Ports for gas sampling/analysis and monitoring of system pressure, temperature, and humidity are also provided at key locations in the system piping. Special fi&gs and pipethreaded fittings are used in some locations for connecting piping to the process i n v e n t s .
’
Particulate filters are installed in the system on both the inlet and outlet to the retort to help prevent the spread of contamination to the system piping on the outside of the hot cell. These filters are constructed of a microporous fiberglass media in a stainless steel housing. They are 99.9% efficient for particulates that are 0.2 microns and larger in size. Two different size filters, manufactured by Matheson, are used in the system.
9
2.2.4 System Line Heaters
All of the stainless steel tubing that carries gases into the furnace retort and resultant gases from the retort is heated to about 75°C to ensure condensable water vapor remains in the gas phase. Simple heat “cords” capable of being wrapped upon each other (as required at tees, elbows, sind other connections) were found to be a good heating method for this system. The heating cords are controlled by simple proportional controllers. Type-K thermocouples are installed on each heated l i e so the DACS caq be used to monitor and record temperature.
2.3 Process Heating System
The whole element furnace is a Pft-long, resistively heated, clam-shell furnace. The furnace, Series 3210 supplied by Applied Test Systems (ATS), has a temperature rating of 900°C and total heating capacity of 13,800 W. The internal dimensions are 5 in. ID by 45 in. long. The furnace has three separate sets of heating elements that allow the heating to be controlled in zones; each zone is 15 in. long and sup- plies up to 4600 W heating. The zones can be controlled separately to establish a flat temperature profile within the furnace, even though heat is lost preferentially out the end with the retort entry flange. A heat reflector consisting of several thin Inconel plates is used to reduce heat loss from the flange end of the retort. The furnace controller is an ATS Series 3000, which consists of three programmable, self-tuning
2.5
I i! C
a X 3
-
4
C
i! a I 3
-
Controller
. - - - -. . . (not shown)
Filter 67 FI
Chromatograph
4 I r
4
Variable Leak Valve
To High Moisture
Vacuum Probe Pressure
Pressure Gauge Gauge
Figure 2.3. Generalized View of Test System
proportional with integral and derivative controllers. These controllers are also interfaced to the DACS, which is capable of providing limited input to the controllers as required.
The retort, an ATS Series 3910, is an Inconel tube fitted with a gas inlet tube at one end and a gasketed flange at the other. Of all high-temperature materials, Inconel series 600 was selected to reduce the amount of oxidation and water pickup by the retort and associated components. Experience has shown that stainless steel components were easily affected by corrosion, which could then affect test results. The body of the retort is fabricated from schedule 40 Inconel pipe (4.5 in. OD, 4.026 in. ID), and the inside length is about 44.5 in. Seven type-K thermocouples are installed equidistant along one side of the retort and extend into the retort interior approximately 1/8 in. These thermocouples are used to monitor the retort temperature so that if a reaction with the fuel element occurs (which would locally raise the retort temperature), this event can be correlated with the approximate location on the fuel.
An Inconel sample/transfer boat is used to load the fuel element into the furnace. The boat is fabri- cated from an 11-gauge (0.120-in.-thick) Inconel 601 sheet, which is formed into a flattened u-shape. The boat has a weir’and a swivel handle on each end. The weirs are used to keep free water or particulates contained in the boat as required.
2.4 Gas Supply/Distribution System
The gas supply system and vacuum pumping system together are capable of controlling the fuel ele- ment environment to vacuum or moderate pressure conditions, and/or exposing the fuel element to a . variety of gases or gas mixtures. The gas loop is typically operated as a single-pass system with no capability for recirculation. The gas supply system consists of gas bottles; mass flow controllers; piping; and valves for metering argon, air, or oxygen through the system. A bubbler is also available for adding water vapor to the process gas stream as required, but it was not used in these tests.
The gas supply system contains three Matheson mass flow controllers calibrated for argon, air, and ,oxygen. All gases are. typically specified “ultra high purity” and are additionally filtered for water using molecular sieve columns. Argon is the principal inert gas used, as it is more dense than air; provides reasonable thermal conductivity; and requires simpler handling procedures than lighter gases such as helium. Theargon purge gas is introduced into the retort through FE-01, which is a Matheson model 8272-0422 oxygen controller, recalibrated for argon gas at 25OC using a NIST-traceable bubble flow meter. The recalibration resulted in a flow rate rkge of 0 - 324 sccm argon. Air and oxygen are not currently used because any oxidative steps have been deleted fiom the current IPS for the SNF. The manufacturer’s specifications for the air and oxygen controllers’ flow rate ranges are 0 - 1000 sccm air and 0 - 10 sccm oxygen. If higher flow rates are desired, a new mass flow controller with a higher range could be procured and installed in the system.
2.7
2.5 Gas Analysis Instrumentation
2.5.1 Bakers Omnistar Mass Spectrometer
’ The Balzers Omnistar Mass Spectrometer is a compact, computer-controlled, quadrupole MS capable of scanning to 300 m u . The unit is capable of monitoring up to 64 components within a gas stream with a nominal detection limit of less than 1 ppm for most gases other tlian hydrogen. The MS was used to monitor hydrogen, nitrogen (for air in-leakage), krypton, xenon, ahd other elements during the test.
The MS was modified as a result of early system testing and calibration to improve the time response to small changes in hydrogen pressure. Prior to testing, the MS was calibrated for hydrogen using mixtures of hydrogenand helium, and hydrogen and argon gas. The residence time of each gas could be measured in the quadrupole chamber, and it was observed that the hydrogen decay time was approxi- mately four times as long as helium. This was not unexpected as turbomolecular pumps have a lower pumping efficiency for very light gases. In standard practice this is acceptable, but for these tests, where determining hydrogen could be very important, steps were taken to improve the hydrogen decay time. The MS vacuum system was modified by adding a stainless steel flanged tee, a gate valve, and a room- temperature hydrogen getter downstream fiom the quadrupole. Under vacuum the gate valve can be opened, exposing the getter to the system to help scavenge hydrogen fiom the system following analysis. This modification reduced the residence time of hydrogen in the system substantially, and decreased the background level of hydrogen by about a factor of 2. The getter improved the system response to transient events that might result in the release of hydrogen.
A Granville-Phillips variable leak valve, series 203, was added to the gas sampling inlet of the MS in order to permit operation over a wide range of system pressures. Without the leak valve, system pres- sures above about 40 Torr produce too much flow through the MS capillary tube, which overyhehs the turbo pump used to pump down the MS vacuum chamber. Flow through the leak valve can be continu- ously varied from 0.4 Vs to lo-” Vs, which allows the MS inlet pressure to be controlIed to any pressure desired, even if the system pressure varies dramatically. The pressure on the low pressure side of the leak . valve was measured using a Cole-Parmer sensor (PE-07) aqd recorded by the DACS.’ The inlet head pressure is divided by the pressure used for the calibration, and this factor is applied to the test data for calculating actual gas concentrations. The MS was calibrated at -30 Torr head pressure with a certified gas standard consisting of 1050 ppmv hydrogen in argon.
2.5.2 MTI M200 Gas Chromatograph
The MTI h.11200 Gas Chromatograph is a high-speed GC that is used to monitor the quantities of hydrogen and other light gases in the furnace testing system gas loop. This instrument is interfaced with a laptop computer to record data. The GC is designed to operate at near-atmospheric pressure; thus it may be configured in two different ways for measurement purposes. At system pressures near atmospheric, the GC is configured to sample directly from3he gas loop ahead of the system vacuum pump. When the system is under vacuUm, the GC is configured to sample fiom the exhaust side of the vacuum pump. The gas output from the pump is sufficiently compressed that the GC can sample and analyze this gas. The GC inlet pressure is measured using a Cole-Paxmer pressure sensor (P&OS) and recorded by the DACS.
2.8

No correction for the difference in the sample pressire and calibration pressure is applied, since both are -760 Torr (1 atm). The GC was calibrated with a certified gas standard consisting of 1050 ppmv hydrogen in argon.
2.6 Process Instrumentation
The furnace testing system contains several process instruments for monitoring moisture content, pressure, and temperature. The key instnunents are as follows:
Panametics moisture monitor
MKS Baratron pressure transducers
Cole-Parmer pressure transducers
Type-K thermocouples
2.6.1 Panametrics Moisture Monitor
The Panametrics moisture monitor model MMS35 uses a solid electrochemical probe (model M2L) that measures moisture by measuring the characteristic capacitance of the probe as a function of the moisture in the gas phase. The sensor has a nominal dew point range of -1 10°C to 20°C. Previous testing indicated that contamination by radioactive elements (e.g., cesium) causes the probe to lose calibration and results in moisture readings that drift with time. To prevent contamination of the probe tip, the probe is installed in the gas loop downstream of two glass particulate filters. Further, the probes are changed following each test and surveyed for radioactive contamination. If no contamination is found, and the data correlate well with the data obtained fiom the MS, the readings are accepted.
A calibration verification procedure can be performed using calibrated water "leak" tubes. These tubes can be placed inside the furnace and, when heated, will establish a known water vapor pressure in the system. However, this procedure is time intensive; approximately 2 weeks are required to calibrate one probe over the range of moisture likely to be encountered in these tests. This procedure is only used if the moisture monitor results vary widely fiom the MS data.
Output of the moisture monitor is in dew point in degrees Celsius. For comparison with other test data, these dew point values were converted to water vapor pressure in Torr using the water and ice vapor pressure data shown in Table 2.1. *Interpolation of the data was accomplished using a 6th-order poly- nomial fit to the log of the vapor pressure (VP) versus temperature data. The resulting conversion expression is as follows:
2.9 . .

Table 2.1. Water and Ice Vapor Pressure Data Versus Temperature
Dew Point
-80 -75 -70 -65 -60 -55 -50
' -45 -40 -35 -3 0 -25 -20 -15 -10 -5 0 10
ri) CRCPress. l!
("C) PaYa) 5.5OOOE-02 1.22ooE-0 1 2.61OOE-01 5.4OOOE-01
2.093OE+OO 3.936OE+OO 7.202OE+OO 1.284OE+Ol 2.235OE+O 1 3.80 1 OE+O 1 6.329OE+Ol l.d326E+02 . 1.6530E+02 2.5990E+02 4.017@+02 6.1 129E+02 1.2281E+03
17. Handbook of
i.0800E+00
VaDor Pressure Nl L
(Torr) 4.136E-04 .9.174E-04 1.963E-03 4.061E-03 8.122E-03 1.574E-02 2.96OE-02 5.4 16E-02 9.656E-02 1.681E-01 '
2.858E-01 4.759E-01
. 7.765E-01 1.243E-tOO 1.954E+OO 3.02 1E+OO 4.597E+OO 9.235E+OO
ternisby & Physic
Log (Torr) -3.3 834 -3.0374 -2.7071 -2.3914 -2.0904 -1.8030 -1.5287 -1.2663 -1.0152 -0.7745 -0.5439 -0.3224 -0.1099 0.0945 0.2910 0.4802 0.6625 0.9655
78" edition.
where x = the measured dew point ("C) and A = -6.7260-10-'2 '
B = -1.7250-10'9 C = -1.7089.10-' D = -7.26 1 8- 1 O4 E = -2.9668~10~ F = 3.4414~10-~ G = 0.66043 .
2.6.2 MKS Baratron Pressure Transducers
Two MKS Baratron model 690 calibrated pressure transducers coupled with MKS model 270 signal conditioners are used as the primary measurement for the overall system pressure. As shown in Figure 2.3, PE-01 measures the system pressure downstream of the retort ouff et, whereas PE-06 measures the system pressure at the retort inlet. PE-01 indicates pressure in the range of 0.1 Torr to 10,000 Torr. The pressure range of PE-06 is 0.01 Torr to 1000 Torr. PE-06 was i n d l e d after the first two fuel element drying tests fo provide more accurate measurements than PE-01 for low pressures. PE-06 is
2.10

therefore considered the primary system pressure measurement. In addition, the 270 signal conditioner procured with PE-06 has a special capability to remotely zero the transducer, which provides more accurate pressure measurements below 1 Torr. '
An auxiliary high-vacuum turbo pump is used to evacuate the inlet to PE-06 to well below lo4 Torr, so that the transducer can be accurately rezeroed. The 270 signal conditioner used with PE-01 does not have a remote zeroing capability. Both signal conditioners have analog outputs that are interfaced to the DACS so that system pressure is continuously recorded.
2.6.3 Cole-Parmer Pressure Transducers
Two Cole-Pmer model H-6880 1:53 diaphragm-type, calibrated pressure transducers are installed on the MS and GC sample lines as indicated by PE-07 and PE-08 in Figure 2.3. These pressure measure- ments are used to normalize the MS and GC data so that actual gas concentrations in the system can be calculated from the relative concentrations measured. These sensors have a range of 0 to. 1500 Torr with a resolution of 0.1 Torr, and an accuracy of &l% or &l Torr, whichever is larger. Both readout units (model H-68801-03) have analog outputs that are interfaced to the DACS so that these pressures are continuously recorded.
2.6.4 Thermocouples
Thermocouples provide a simple, reliable method for measuring system temperatures. As shown in Figure 2.3, over 20 thermocouples are installed at various locations in the system to provide key temperature measurements. The retort temperatures are of primary importance, and these temperatures are measured by thermocouples TE-04 through TE-10, which are positioned equidistant along the length of the retort. Other key temperature measurements include the retort center temperature (TE-20, which is a 30-in.-long thermocouple installed through the outlet end of the retort), retort inlet temperature (TE-21), condenser gas temperature (TE-19), and the condenser coolant temperature (TE-22). Thermocouples TE-11 through TEi-17 are used for controlling the temperature of the heated lines. All thermocouple read- ings are continuously recorded using the DACS.
2.7 Data Acquisition and Control System
The DACS monitors system parameters, and controls the furnace and the safety argon system. The DACS consists of a Hewlett Packard (HP) 3497A data acquisitiodcontrol unit and an IBM-compatible computer. A National Instruments general purpose interface bus card, installed in the IBM-compatible computer, is used to communicate with the HP 3497A. The computer communicates with the furnace temperature controllers over serial port 0 using an RS-232RS-485 converter. The DACS uses National . Instruments LabView for Windows as the control software.
The DACS is designed to measure critical system parameters during fuel conditioning tests, including temperatures, pressures, flow rates, and moisture level. The measured parameters are converted to engineering units, displayed on the computer screen, and stored to disk at user-defined intervals. The data
2.11

files are stored in a tab-delimited format to allow importing into a standard spreadsheet or plotting program. A plotting screen also allows for plotting of up to six parameters at a time.
Limited control of the furnace can be performed with the DACS. Each of the three furnace zone temperatures can be remotely set by the DACS. In addition, the DACS allows the operator to start and stop the furnace and select one of four temperature profiles that are pre-programmed in the furnace temperature controllers. Note that these profiles must be programmed manually in the furnace controllers before using the DACS to select them.
.
2.12

3.0 Vacuum Drying Testing of Element 574417
The drying test was performed in accordance with the requirements of the Test Procedure, Furnace Testing of N-Reactor Fuel Element 5744U, PTL-005, Revision 0. This document'is located in the PNNL permanent project records for this test.
The testing consisted of three parts (discussed in this section):
0 removing the fuel from its shipping canister, performing a visual inspection, loading the fuel onto the * furnace system sample boat, and transferring it to the PTL G-Cell for loading into the furnace.
performing the fuel element drying using a combhation of Cold Vacuum Drying (CVD) and Hot Vacuum Drying (HVD) processes.
0 unloading the furnace, performing a post-test visual inspection, and returning the fuel element to its shipping canister.
3.1 Fuel Element Transfer and Loading
' 3.1.1 Pre-Test Visual Inspection
The pre-test visual inspection was'conducted using a €$$-resolution black and white video camera located outside the PTL F-Cell (adjacent to G-Cell), where the sample was unloaded from the shipping canister. The results were recorded using a Panasonic Super-VHS resolution video recorder. This examination was conducted to document the condition of the fuel element prior to the test and to determine if any changes had occurred since it was removed from the K-West Bkin and shipped to the PTL. The results of this inspection are presented in Section 4.1.
3.1.2 Fuel Element Rinsing
Fuel eIement 5744U had been stored in the PTL water storage pool contained in a single fuel element canister (SFEC) that was filled with K-Basin water. Before the start of the fuel element drying test, the element was rinsed in F-Cell. This rinsing involved raising and lowering the element several times in the SFEC using one of the cell's manipulators. Following rinsing, the element was transferred to G-Cell for loading into the test retort.
3.2 Fuel Element Drying
The fuel element was subjected to cold and hot vacuum drying. The drying test was conducted in six phases:
3.1

1. Cold Vacuum Drying 2. Pressure Rise Test 3. Hot Vacuum Drying (first step)
4. Hot Vacuum Drying (second step) 5. Hot Vacuum Drying (third step) 6. Post-Test Pressure Rise Test.
The nominal design conditions used for these test phases are summarized in Table 3.1. Each phase is discussed below. '
Table 3.1. Summary of Nominal Test Design Conditions
. Testsegment A. Cold Vacuum Drying
System Configuration Test Temperature, "C Atmosphere Pressure, Torr Gas Flow Rate, cdmin Gas Species Monitored Duration, hr
B. Pressure Rise Test System Configuration Test Temperature, "C Atmosphere Initial Pressure, Torr Gas Flow Rate, cc/min Gas Species Monitored
. Pressure Rise (acceptable levels, Torr) Duration, hr
C. Hot Vacuum Drying (Step 1) System Configuration Test Temperature Range, "C Atmosphere Pressure, Torr Gas Flow Rate, cc/min Gas Species Monitored Duration, hr
D. Hot Vacuum Drying (Step 2, heatup) System Configuration Test Temperature Range, "C Temperature Ramp Rate, "Chr Atmosphere Pressure, Torr Gas Flow Rate, cc/min Gas Species Monitored
Nominal-Test Condition(')
Pump on, no argon flow 50
Vacuum <5 0
H2, H20, N2,02, C02, Ar, Kr, Xe CVD will be conducted until the total pressure
in the retort falls below 0.5 Torr.
Pump on, argon gas flow 75
Vacuum, Ar background 15
300 H2, H20, N2, 02, Cozy k, Kr, Xe
-1
.Pump on, argon gas flow 75 to 400
10 Vacuum, Ar background
15 300
H2, HzO, N2,02, Cozy & Kr, Xe 35
3.2

Table 3.1. (contd)
Test Segment E. Hot Vacuum Drying (Step 3)
System Configuration Test Temperature, "C Atmosphere Pressure, Torr Gas Flow Rate, cdmin Gas Species Monitored Duration, hr
System Configuration Test Temperature, OC Atmosphere Initial Pressure, Torr Gas Flow Rate, cc/min . Gas Species Monitored Duration, hour
F. Pressure Rise Test
(a) Nominal test design conditioris. Actual values are g
Nominal Test Conditiad")
hunp on, argon gas flow
Vacuum, Ar background 15
300
10
400 -
H2, H20, N2, 02, COZY h, Xe
Test Chamber Isolated 50
Vacuum <5. 0
1 H2r H20, N2, 0, c92, h, QY Xe
7en in the text. .
3.2.1 Cold Vacuum Drying
While the fuel element was being handled and prepared for the drying test, it was kept damp by sprinkling it with deionized water. The amount of surplus liquid water, though small, could not be ascer- tained. There were no pools of water in the sample boat; however, water was adsorbed into corroded areas, cracks, and crevices. The element was then loaded into the furnace, and the test started.
The furnace temperature was increased to approximately 50°C and allowed to stabilize. The system vacuum pump was then timed on, and the system water condenser valved in. When the system pressure dropped to a reasonable level, the vacuum pump was valved out and only the'condenser left in the system. When the system pressure reached the vapor pressure of water, the condenser was then valved out of the gas loop, and the vacuum pump was used to remove any fiee water fiom the system, During this time, the pressure dropped steadily until the water vapor pressure became lower than the condenser could extract. At this point, the water content in the gas phase began to rise, and the condenser was valved out of the sysfem while the vacuum pump was valved back in to continue evacuating &e system. No argon was injected during CVD in this test. CVD was conducted at an ultimate pressure of -0.7 Torr for -17 hr. The purpose of this phase of the test was to determine if CVD is successful in removing the majority of the .free water from the system in a reasonable length of time.
3.2.2 Pressure Rise Test
The Pressure Rise Test involved isolating the system fiom the effects of vacuum pumping and meas- uring any system pressure increases while at CVD pressure and temperature conditions. The purpose of the Pressure Rise Test was to determine the effectiveness of the preceding CVD process. This test was
3.3

conducted by valving the vacuum pump out of the gas loop and closing the exhaust valves in the gas loop. The condition for acceptance of this portion of the test is a total system pressure rise of less than 0.5 Torr in a 1-hr time period. If this condition is not met, the system is re-opened to the vacuum pump and the Pressure Rise Test repeated.
3.2.3 Hot-Vacuum Drying, Step 1
Following completion of the Pressure Rise Test, the vacuum pump was re-opened to the system ’
retort; argon gas flow was established at a rate of 324 cc/min; and the retort temperature was increased to -8OOC. This condition was held for a period of -23 hr. This portion of the test can be used to obtain isothermal hydrogen and water release data for assessing oxidation of the fuel at low temperatures.
3.2.4 Hot Vacuum Drying, Step 2
The second step of the HVD tes‘t involved raising the temperature of the retort from -8OOC to 400OC at a carefully controlled rate whilemaintaining the same argon flow and pressure conditions. Thus, any release of gas species during this temperature rise can be assigned to a specific temperature. The second step of the HVD process was conducted for about 35 hr.
During this step, hydrogen may be released fiom the fuel through the decomposition of uranium hy’dride (Cotton 1988); tIiis reaction is rapid at temperatures greater than 25OOC.
3 2
U H 3 +U+-H2
Water may also be liberated by various hydrated species found on fuel elements, such as hydrates of uranium oxides, aluminum hydroxides, and hydrated iron oxides. Water is also released slowly along a ‘’tortuous path” from beneath corroded parts of the fuel element and fiom behind the cladding. The released water can also react with the fuel element to generate hydrogen through the reactions:
’ U+2H20 + UO, +2H2
7 2
UH3+2H,0+U0,+-H2
3.2.5 Hot Vacuum Drying, Step 3
(3.3)
The final step of the HVD process involved holding the temperature of the retort at -4OOOC while again maintaining the same argon flow and pressure conditions as in steps 1 and 2. The hold point will yield isothermal release data for any remaining hydrated species on the fuel element, and for oxidation of uranium by any remaining water. This final step of the HVD process was conducted for about 10 hr.
3.4
3.2.6 System Cooldown and Post-Test Pressure Rise Test
Following completion of the final HVD step, the system retort was allowed to cool to -50°C, at which time another Pressure Rise Test was conducted. The purpose of this post-test Pressure Rise Test was to determine the baseline in-leakage rate of air into the retort from the cell environment. Knowing this rate is important to allow for correction of the system and moisture pressure increase rates determined in the jnitial post-CVD Pressure Rise Test. Since the conditions are identical to those used for the initial test, the assumption is made that the air in-leakage rate should be nearly the same as well.
3.3 Calculation of Water and Hydrogen Inventories
Assuming ideal gas behavior of the water vapor, total water inventory (in grams) in the kystem during those portions of the test conducted with argon flowing into the retort can be approximated from the ' measured water vapor pressure and the argon gas flow as follows:
dm M P" dv dt -Vo (Pt -Pw) dt
where dmldt is the rate of water removal in grams per minute, M is the molecular mass of water in grams per mole, dV/dt is the flow rate in liters per minute (at the calibration temperature .of 25OC), Vo is the molar volume of gas at 25°C and 1 atmosphere in liters per mole, P, is the partial pressure of water vapor in Torr, and Pt is the total pressure in Torr. The total amount of water released is.given by integrating the rate data over time.
The hydrogen inventory may be calculated in a similar fashion with the p,J(Pt-Pw)] expression in the above equation replaced with the measured atom itaction of hydrogen. For the purposes of this report, all hydrogen data are plotted in Tom1 rather than grams. At the calibration conditions of the argon flow controller, 1 Torf.1 is equivalent to approximately 0.1 1 mg of hydrogen.
The assumptions made in estimating the water and hydrogen values are:
,e The flow into the retort is approximately equal to the flow out (Le., contributions to the flow from other gas species such as hydrogen are neglected).
0 The argon mass flow is referenced to 25OC (as determined from the calibration ofthe flow gauges).
0 The sample gas is at the same temperature as the calibration gas (GC and MS measurements).
3.5 .

4.0 Visual Examinations of Element 5744U
An N-Reactor fuel assembly consists of an inner element and outer element made from a uranium alloy co-extruded with a Zircaloy-2 cladding. Both elements are annular, right-cylinders. The inner element has a smaller outer diameter and is held in place within the outer element.
.
Fuel element 5744U, chosen for Run 4, was an outer element removed from the K-West Basin in 1996. The element had been in sealed water storage in the K-West Basin since 1983. This fuel element was selected to represent a classification of fuel damage termed “broken top cap” (Lawrence 1997). The furnace drying test series (this is Run 4 of 8) were intended to progress from intact (unbreached) fuel ele, ments to severely damaged fuel elements. This fuel element was to represent fuel elements in between appearing just broken (as in Run 3) &d appearing severely damaged (as in Run 7). Note: An as- fabricated N-Reactor outer element (Mark NE) has the dimensions: 66.3 cm in length, 6.15 cm OD, 4.31 cm ID. The fuel element had been kept in K-Basin water at the PTL storage basin since it was loaded into its SFEC and shipped to the facility in 1996. The first relatively detailed examination of the fuel element was conducted just prior to the drying test and is discussed below.
* 4.1 Pre-Test Visual Examination
The fuel element was removed from the SFEC and examined using a high-resolution black and white video camera in the PTL F-Cell. The visual examination revealed the fuel element was more damaged than originally categorized (Lawrence 1997). Jn.addition to the corrosion damage at one end of the fuel element, the element had, or developed, a split running several centimeters along its length. Several . diagonal cracks were also observed along the surface of the fuel element. As noted above,‘ this pre-test inspection was the first detailed inspection of the element since its shipment to the PTL. Additional oxidatiodcorrosion damage since being shipped to the PTL in 1996 is a possible explanation for the greater damage, but more likely the damage was present during the fuel element sampling in K-Basin but not observed.
Figures 4.1 and 4.2 show stil l images of the damaged end of the fuel element captured from the black and white videotape. The cladding had completely separated from the endcap and was peeled away due to the force applied by oxidation of the metallic fuel matrix. Several centimeters of the uranium fuel material were missing from the end of the element. The longitudinal split down the side of the cladding is shown in Figure 4.3. The split appeared to be several millimeters wideand at least 15 cm long. A diagonal crack that appeared to branch from one end of the split was apparent. The image lacks resolu- tion, as it is difficult to capture still images. from videotape when the camera is being panned across the fuel element surface. Figure 4.4 shows the undamaged end of the fuel element that appeared to be intact. Visual inspection of the circumference of the braze joint did not suggest the braze joint was breached. The element also appeared to have a thin surface layer orcoating. The coating was too thin to collect a ,sample for examination. Because the fuel element surface was kept damp during the examination, it could not be determined if the coating was uniformly distributed across the surface. The variation in
.
4.1

Figure 4.1. Photomosaic of the Damaged End of Fuel Element 5744U
Figure 4.2. Two Views of the Damaged End of Fuel Element 5744U
color change from wet to less-damp areas makes the evaluation of thin coatings difficult. The coating appeared to be gray in color when the surface of the fuel element began to dry.
4.2 Post-Test Visual Examination
A post-test visual examination was conducted using a small color video camera inside the PTL G-Cell. Figure 4.5 contains two still images captured from videotape showing the damaged end of the fuel element. The image on the left side of the figure is the “as-found‘’ condition of the fuel element. The image on the right was taken after the fuel cladding was pulled back to reveal the uranium fuel matrix.
4.2

Figure 4.3. Photomosaic of Longitudinal Crack on Fuel Element 5744U
Figure 4.4. View of the Intact End of Fuel Element 5744U
The fuel material contained many cracks and fissures. The material was brittle and flaked off relatively easily when the cladding was pulled away. Figure 4.6 shows the same damaged end of the fuel element from a different angle. Again, the exposed fuel material was cracked in many places, and the cladding was completely separated from the endcap.
4.3

' Element as removed from test exposed fuel surface
Figure 4.5. Post-Test Views of the Damaged End of Element 5744U
Figure 4.6. Two Post-Test Views (Different Angle) of the Damaged End of Element 5744U
A post-test view of the longitudinal split in the cladding (Figure 4.3) is shown in Figure 4.7. The split appears to have opened, and the fuel element appears to be slightly swollen in this region. The diagonal split apparent in Figure 4.3 also appears to have opened slightly during the drying test. Another diagonal split; not observed during the pre-test visual examination, is apparent at the other end of the longitudinal split. It must be noted that this second diagonal split may have been present before the test but was not detected during the pre-test visual examination. The widening of the longitudinal split may be caused by oxidation of the metallic fuel matrix during the drying test, possibly due to reaction with water vapor liberated from the fuel element.
The fuel coating material appeared to remain on the surface of the fuel cladding but may have darkened in color, taking on a slightly brown tint. Attempts to recover some of the material were made using a putty knife and a small abrasive pad. While the material could be removed, the coating was so thin that it was not practical to recover enough material for analysis. It is estimated that removal of the coating from at least one half of the fuel element would have been required to provided enough material for X-ray diffraction. However, recovery of the fine powder from the abrasive pad would have
4.4

f ” * ” ‘ ~ , , ~ ,
Figure 4.7. Post-Test Photomosaic of the Region Containing the Longitudinal and Diagonal Splits ’
been difficult. If the coating material contained uranium oxy-hydrates, the change in color could be attributed to the release of the waters of hydration, leaving beh&d a dark uranium oxide material.
The intact end of the fuel element was examined, and no new breaches were detected following the w i n g test. A post-test view of the intact end is shown in Figure 4.8.
*,A
Figure 4.8. Post-Test View of the Intact End of Element 5744U
4.5
5.0 Experimental Results
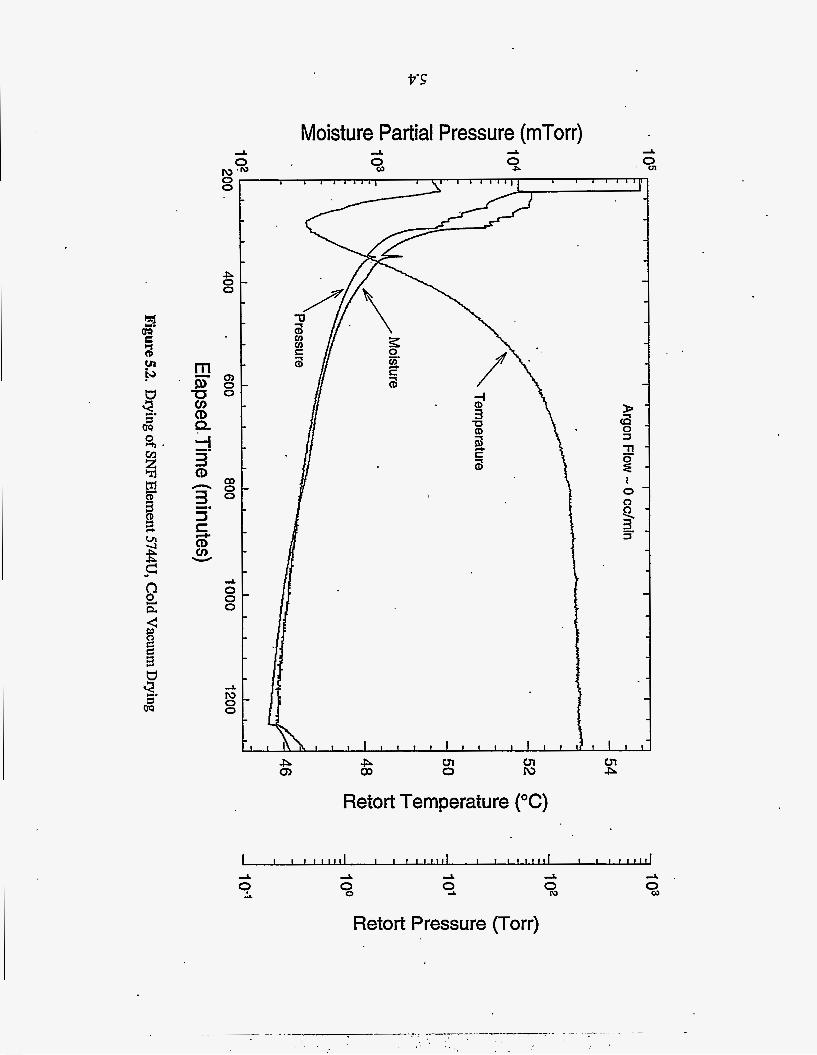
In the following sections, the experimental data collected during the drying test are expanded and plotted for each segment. Summary results are plotted in F i m e 5.1. This figure shows the system .
moisture level response to the pressure changes and the retort tube temperatures during the test. Time intervals for the various test segments are shown in the upper section of the plot, and also are outlined in Table 5.1. The temperatures shown in Figure 5.1 were recorded from one of seven thermocouples (TE-07) on the system located near the center of the retort. The pressure data were taken from the 0 to 1000 Torr Baratron sensor (PE-06) located upstream of the retort.
5.1 Cold Vacuum Drying
The water release from the CVD portion of the test is shown in Figure 5.2. The baseline moisture partial pressure in the system prior to heating was -13 Torr at a retort temperature of -24°C. Total system pressure was -750 Torr, with no argon gas flow. After heating to -5O”C, the moisture pressure and system pressure stabilized at -1 1.Torr and -840 Torr, respectively. Based on the pressure differences at these two temperatures and assuming ideal gas behavior, there is an approximately 28 Torr pressure difference. This may be due to gases evolved during the heatup to 50”C, such as hydrogen from moisture reactions, and gases dissolved in the free water. Another explanation for the calculated pressure difference is that the average retort temperature was somewhat greater than 50°C.
The CVD commenced at an elapsed time (ET) of 224 min when the vacuum pump was opened briefly in order to “ro~gh-out’~ the system retort to -30 Torr (total pressure). Figure 5.2 shows that the moisture pressure initially rose, reaching’a maximum of about 14 Torr after several minutes, then dropped slowly to -6 Torr over the next 75 min while the condenser and vacuum pump were being used alternately to remove most of the water. At -290 min ET, the condenser was valved out of the system for the final time and the retort opened to the vacuum pump. Atsthis point both the moisture pressure and the total pressure began to drop more rapidly, with both pressures reaching a final value of -0.2 Torr by the end of CVD. Note that the moisture pressure is plotted from 0.1 to 100 Torr, while the total pressure is plotted from 0.1 to 1000 Torr. Approximately 15 ml of water were observed in the condenser during CVD. Because of the design of the condenser, however, the observed water is likely to be an underestimation of the total water collected.
A spike in both the pressure and moisture signals can be seen at ET -380 in Figure 5.2. A possible cause of the these spikes is a “burst release” of a small quantity of water in an isolated region during the temperature rise:
5.2 Pressure Rise Tests
The results of the two pressure rise phases of the drying test (post-CVD and post-HVD) are shown in Figures 5.3 and 5.4. The purpose of the post-JWD test was to determine the ambient air in-leakage rate
5.1

0 0 0 0 0 0 0 0
0 0 0 0 , 0 F 03 (D d- cu 0
cu T-
0 0 v)
0 0 d-
0 0 cu
0 0 T- O
I 1 1 1 1 1 1 1 1 ( 1 1 1 1 1 1 1
*\ &
E
p!
2 n
3 v) v) 1
' 0 . o 0 . a
n - > ' 0 :
e (3
T- 0 F
0
5.2

Table 5.1. Fuel Element 5744U Drying Run Time Line
Activity Start of Test Heat furnace to -5OOC Cold Vacuum Drying Test Open pump valve and condenser to furnace (initial) Open pump valve, close condenser valve (final) Pressure Rise Test(@ Close pump (isolate furnace) . Open pump vaIve Hot Vacuum Drying Test (Step 1) Start argon flow (-320 cc/min), raise furnace temperature to -8OOC and hold Hot Vacuum Drying Test (Step 2) Raise furnace temperature to -400°C @ 1 O°C/min Hot Vacuum Drying Test (Step 3) Hold furnace temperature at -4OOOC System Cooldown Reduce temperature of retort to -50°C, maintain argon flow Post-Test Pressure Rise Test Turn off argon flow, and close pump valve (isolate furnace) Turn off furnace heaters, end test
Date/Time ~
12/14/97 12:14
12/14/97 15:16 12/14/97 16:28
~~
12/15/97 8:20 12/15/97 9:20
12/15/97 9:23
12/16/97 8:03
12/17/97 19:20
12/18/972:35
12/19/97 9:33 12/19/97 10:50
Elapsed Time ( i n )
42
224 296
1248 1308
1311
2671
4788
5223
708 1 7158
into the system as it had been configurea for the drying test. bile under vacuum conditions, with no argon flow, any air in-leakage will contribute to the data signals observed for the various process gases measured during the test, particularly water and hydrogen. As discussed above, the data plotted for the total pressure are from the 0 to 1000 Torr Baratron sensor (PE-06) located upstream of the retort. This sensor has higher sensitivity and therefore lower noise than the 0 to 10,000 Torr Baratron (PEGO1) located downstreak of the retort. For calculation of total water mass removed from the retort, pressure data from the 0 to 10,000 Torr sensor (PE-01) were used, as this sensor is closer to the moisture sensor. Differences in the pressure indications of the two sensors are small, however, and therefore negligible when compared with overall system uncertainties.
The post-CVD Pressure Rise Test was conducted over ah ET of 1248 min to 13 10 min. Both the total pressure and the moisture pressure showed essentially linear pressure rises over the course of the test.
5.3
p’s
m 0, a v) CD Q
L
8 - 0
b) 0 - 0
Cm 0 - 0
A 0 - 0 0
r
Moisture Partial Pressure (mTorr)
P a P (x,
u1 0
UI P
Retort Temperature (“C)
I I I I I I I l l I I 1 I t I I I I I t 1 I 1 1 1 1 1 I 1 1 1 1 1 1
Retort Pressure (Torr)

Figure 5.3. Drying of SNF Element 5744U, Post-CVD Pressure Rise Test

9 s
2 0 0
2 cn 0
2 30
-
2 (P 0 J
3 z . o
1 0 c)
Q 3 9'
Moisture Partial Pressure (mTorr) 0 0
-.I A . P 0 cn 0 cn
P Iu 0
I
-L 0 0
Retort Temperature ("C)
P 0 0
0
Retort Pressure (Torr)

Regression fits (dotted lines in the figure) yielded a total pressure rise rate of -0.22 Torrh (well below the 0.5 Torrhr criterion for the test), and a moisture pressure rise rate of 0.052 Torrh. The difference between the total pressure rise rate and the moisture pressure rise rate is -0.17 Torrh.
Assuming that the water vapor pressure increase is fiom water sources within the test system, and assuming ideal gas behavior of the water vapor, the rate of desorption of the water will be constant, given by:
dn - V dP dt RT . dt -_-.-
where n is the number of moles of gas, V is the volume of the system (-10,000 cm3), R is the gas constant (82.06 cm3.atm/g-mol.K), T is the temperature (-326 K), and dpldt is the rate of change in the pressure given by the slope of the regression line. The total amount of water released to the system' during the Pressure Rise Test is given by the integral of the above equation. Assuming a total period of 62 min, the total amount of water released was -0.5 mg. Using a total surface area of -8900 cm2 for the system (total surface area of the retort, sample boat, tubing, and an outer fuel element), and l O I 5 atoms per cm2 as the monolayer gas density on surfaces, approximately two monolayer equivalents of H20 were evaporated.
The results of the post-HVD pressure rise measurements are shown in Figure 5.4. Again, both the total pressure and the moisture pressure show an essentially linear increase with time, however with significantly lower slopes than observed for the earlier post-CVD measurements. The total pressure rise lias a regression slope of -0.1 1 Torrh, and the moisture pressure rise has a slope of -O.00006 Torrh. The rate of increase in the total pressure is essentially the same as observed in Run 3 (Element 0309M).
The ratio of the water pressure rise to the total pressure rise is -0.0005, which is significantly lower than would be expected just from humidity alone in air in-leakage fiom the cell environment (air at 2OoC and 25% relative humidity would yield a water pressure to total pressure ratio of -0.007). A likely explanation for the low moisture pressure rise in the post-HVD test is that the previous vacuum drying of the fuel element at temperature has resulted in the formation of hygroscopic species, which are "gettering" most of the moisture from either air in-leakage or from some remaining on the element that would otherwise have been released.
Comparison of the total and moi&e pressure rises fiom the post-CVD and post-HVD pressure rise tests indicates that the residual moisture is only one source of the total pressure rises observed in the 'initial post-CVD tests. The difference between the to@ pressure rise and the moisture pressure rise for the post-CVD test is higher than can be explained by air in-leakage into the retort alone as measured in . the post-HVD test. This suggests that other sources of gas are responsible for some of the observed total pressure rise in the post-CVD test. A slight increase in the signals for hydrogen and for xenon isotopes was noted in the MS data dwkg CVD.
5.7

5.3 Hot Vacuum Drying
The first segment of HVD, shown in Figure 5.5, includes the ramp and hold fiom -50°C to -80°C in flowing argon gas (324 cc/min) under partial vacuum. HVD-1 was run over an ET of 13 10 rnin to 2680 min. The moisture pressure decreased steadily fiom -200 mTorr to -7 mTorr during the -80°C period. Total system pressure was essentially constant over this first HVD phase at -19 Torr. Total water removed was -0.7 g.
The second phase of.HVD involved maintaining the same system conditions as in HVD-1 but raising the temperature from -80°C to -400°C at a rate of lO"C/hr. HVD-2 was run over an ET of 2680 rnin to 4788 min. Total system pressure remained essentially constant at -19 Torr. As is shown in Figure 5.6, upon initiation of this second phase, the moisture partial pressure increased, reaching a maximum value of -21 mTorr before dropping asjmptotically to a value of -1 mTorr at 400°C. This continuous release of water is likely due to the depletion of water in small isolated regions under the corrosion and fiom behind the cladding. A single broad peak is evident in the moisture release at a temperature of -138°C. This peak is an indication of water release from chemisorbed sites (i.e., hydrated species) at higher tempera- tures. Total water removed during the second phase of HVD was -0.3 g, approximately one half of that removed during the first phase.
The third phase of HVD is shown in the left-hand side of Figure 5.7 (ET of 4788 min to 5223 min), and covered the temperature hold.period at -400°C. This period is characterized by a steady decrease in the moisture pressure fiom -1.3 mTorr to -0.3 mTon. Total water removed..was -4 mg.
Following the final phase, the system was allowed to cool to -50°C in preparation for the post- test Pressure Rise Test. Water removed during the system cooldown was -3 mg.
5.4 'Gas Chromatograph Measurements
The GC is calibrated to measure hydrogen in the sample gas. As discussed earlier, the hydrogen concentration is converted from ppmv to Torr1 so that the absolute quantity of hydrogen gas released can be determined independent of argon flow rate. The GC yielded data for the release of hydrogen in the gas stream during most of the HVD steps. During these parts of the test, argon was flowing through the system at a rate of about 324 cc/min. As a result of software limitations in the GC, data collection was terminated at an ET of 4420 min. Additionally, it was not possible to sample for hydrogen using the GC during the CVD portion of the test since it was conducted with no flow of argon gas. .
. . Measured hydrogen release during the HVD segments of the drying test are shown in Figure 5.8. As
is evident, there are three main peaks occurring at temperatures of -76°C (-0.25 TorrVmin), -170°C (-1.1 TorVmin), and -265°C (-2.0 Torrl/min). Approximately 220 T o r 1 (-24 mg) of hydrogen were released over a period of -23 hr, the majority being released in the first few hours. As described in Section 3.2.3, HVD-1 is nearly isothermal, and can therefore be used to provide information on reaction kinetics. The hydrogen and water signals are well correlated during HVD-1; the molar ratio of water to hydrogen released (ET 1600 through 2700) is approximately 2.
5.8

103 90
80
70
60
50
Figure 5.5. Drying of SNF Element 5744U, Hot Vacuum Drying - Step 1

n L 5 20 t- E 2
a"
U
3 v) v) a,
a, 3 v)
L-
.w .- 8
400
300
200
100
. Elapsed Time (minutes)
c 0 v
t=: 0 +-,
d
a,
Figure 5.6. Drying of SNF Element 5744U, Hot Vacuum Drying - Step 2 I

0 Eu v)
Y 0 7 v) 0
' u ? Y
0 0 0 0 0 0 0 0 -3- m cv 7
9 0
m
I
cu 0
5.11

.
0 0 0 0 0' 0 0 0
-3 c3 cv r
cu 0 7
v- 0 7
0
v 0
v-
0 7-
0 - 0 0 LI)
0 - 0 0 -3
0 - 0 0 c9
0 - 0 0 cv
5.12

The 170°C peak correlates closely with a large water release at the same time, and is likely due to oxidation of the fuel by water. Based on deconvolution of the hydrogen data &om ET 2700 through 4400, approximately 740 Tom1 (-80 mg) of hydrogen were released during the same period as the water release peak. Again, this is likely due to oxidation of uranium by water vapor. The molar ratio of water to hydrogen released during the peak water release period (ET 2750 through 3600) is -0.3. This implies
’ that water is reacting with the fuel at a rate higher than it is being released into the vacuum and thus swept away with the argon flow past the moisture sensor. It is likely that the hydrogen released during this period is due to oxidation of fuel by water released through oxy-hydrate decomposition in the corrosion regions or in isolated regions under the cladding.
The 265OC peak is most likely due to the decomposition of uranium hydride. This is further supported by the observation that there is no correlation with the water signal during this period, and also that this is the expected temperature for U H 3 decomposition (Cotton 1988). The quantity of hydrogen released due to U H 3 decomposition is, therefore, -680 T o r 1 (73 mg). This equatest0 -6 g of UH3.
A smaller peak that is unresolved from the 265°C peak occurring at -300°C is likely due to oxidation of uranium or uranium hydride by any remaining water. Similar peaks at 265OC and 300°C (and greater temperatures) were also observed in the hydrogen release for fuel element 0309M (Run 3). Approxi- mately 3 10 Tom1 (33 mg) of hydrogen were released during HVD-3. The total quantity of hydrogen released during HVD (until just prior to 400OC) was -1900 Tor1 (-200 mg).
The “spike” in the hydrogen data just after the peak.at 76°C (ET -1600) is regarded a “noise transient” and thus not interpreted as a hydrogen release event.
5.5 Mass Spectrometer Measurements
The Bakers Omnistar MS was used to collect hydrogen and other gas release data over the test run. As evident in Figure 5.8, the MS hydrogen signal showed the same general trends as the GC data, with the magnitude of the peaks being smaller. As also noted in Run 3, this is likely due to differences in the calibration pressure for the MS and the actual pressures encountered in these drying tests. Two modifications are planned to resolve this issue: 1) replacement of the MS inlet pressure gauge with one that is more accurate this low-pressure range, and 2) re-calibration of the MS at lower inlet pressures. These modifications will allow for more accurate normalization of the MS to actual sampling pressures.
A second trend evident in Figure 5.8 is that the MS hydrogen peaks observed during the second phase of HVD are generally offset in time relative to the corresponding GC peaks. This offset is approximately 100 min, with the MS data leading the GC data in time. The reason for this offset is not clear, but does not appear to be the result of timing errors in the GC and MS data acquisition systems. A possible cause could be the addition of ballast argon gas into the inlet of the vacuum pump at an ET of about 2700 min, however, no mechanism for such a ballast gas affected delay has been identified.
.
5.13
No significant krypton or xenon releases were noted in the MS data. A very small rise in xenon and krypton signals were observed in the data during the post-CVD Pressure Rise Test, and are likely caused by release of these fission gases due to oxidation at the 50°C temperature. The static conditions of the post-CVD Pressure Rise Test allow for the accumulation of these fission gases at detectable levels.
5.14
6.0 Discussion
Approximately 15 ml of water were observed in the condenser during the condenser pumpdown *
phase of CVD. An additional -0.5 mg of water was removed during the post-CVD Pressure Rise Test. As the temperaturewas only -5O"C, it is unlikely that metal oxy-hydrate decomposition was the source of this additional water. Therefore, this release can likely be interpreted as coming fiomfree water that was trapped and not completely released during CVD. Comparison of the total and moisture pressure rises from the post-CVD and p o s t - w Pressure Rise Tests indicates that the total pressure rises observed in the post-CVD tests only partially resulted fiom residual moisture, suggesting that other sources of gas are also responsible for some of the total pressure rise.
I
During the first segment of HVD, approximately 0.7 g of water was removed at temperatures below 80°C. The second phase of HVD released approximately 0.3 g of water with a single broad peak at -138°C. The final phase of HVD at 400°C released only about 4 mg of water, with an additional L3 mg of water released during post-HVD cooldown. This indicates that the fuel element still contained small residual quantities of water even after the drying test was completed.
'
The water released after the post-CVD Pressure Rise Test is attributed chiefly to the release of water fiom regions beneath the cladding and from under the corroded regions. Decomposition of metal oxy- hydrates may also account for some of this water. The bulk of the water removal occurred during the first phase of the HVD, which entailed the temperature ramp from-5O"C to -80°C. The single broad peak in the moisture release during HVD-2 indicates water release from chemisorbed sites @e., hydrated species) at higher temperatures. Unlike earlier runs, thermal decomposition of the hydrated species was not the most significant factor in controlling the removal of water from the system during the HVD. Water released fiom the element fkom isolated regions along a "tortuous path" may be the controlling factor in post-CVD water removal. As observed in the previous drying tests, a temperature above 400°C may be required for complete drying of the fuel element wi& a reasonable period of time.
Hydrogen data were obtained from the GC during HVD when argon was flowing through the system. Hydrogen was first observed starting at the ramp-up to 75"C, reaching a peak at 75°C before dropping. Approximately 220 Tor1 (-24 mg) of hydrogen were released during HVD-1. Hydrogen release increased again during the ramp from -75OC to -4OO0C, with two noticeable broad peaks at -170°C.and -26!j°C, the first of which roughly corresponded to a similar water release and was -740 Tom1 (-80 mg). The latter hydrogen release peak [ 4 8 0 Tom1 (73 mg)] at - 265°C is due to uranium hydride decom- position, and is equivalent to -6 g of UH3 decomposed. Above -265"C, the level of hydrogen began to decrease with time, with -3 10 Tor1 (33 mg) of hydrogen released during HVD-3. Total hydrogen release during HVD was -19.00 Tor1 (-200 mg). Hydrogen levels attributed tohranium hydride decomposition and oxidation of uranium by water vapor arebased on deconvolution of the GC hydiogen data shown in Figure 5.8.
Hydrogen data collected by the MS showed the same general trends as the GC data, but with the magnitude of the peaks being smaller, and a noticeable offset of -100 min between the GC and MS data.
6.1

A possible cause was the addition of ballast argon gas into the inlet of the vacuum pump at the beginning of HVD-2 phase; however, no specific mechanism for such an effect from ballast gas has been identified. It can also be noted that no significant krypton or xenon release events were observed in the MS data, although trace quantities of xenon isotopes were detected during the post-CVD Pressure Rise Test.
6.2

7.0 References
Cotton, F. A. 1988. Advanced Inorganic Chemistry, 5" edition. John Wiley & Sons, New York.
CRC Press. 1997. Handbook of Chemistry &Physics, 78" Edition. New York.
Lawrence, L. A. 1997. Strategy for Examination of the 15 K-West Basin Fuel Elements. HNF-SDSNF- SP-018, DE&S Hanford, hc., Richland, Washington.
Ritter, G. A,, S. C. Marschman, P. J. MacFarlan, and D. A. King. 1998. Whole EZement Furnace Testing Syftern. PNNL-11807, Pacific Northwest National Laboratory, Richland, Washington,
Westinghouse Hanford Company (WHC). 1995. Hanford Spent Nuclear Fuel Project Integrated Process Strategy for K Basins Spent Nuclear Fuel, WHC-SD-SNF-SP-005, Rev. 0, Richland, Washington.
7.1

8.0 Supporting -Documents and Related Reports
Gerry, W. M. 1997a. Calibration MMms Flow Controllers: SNFTPL012, Rev. 0, Pacific Northwest National Laboratory, Richland, Washington.
Gerry, W. M. 1997b. Calibration of Balzer Quaaktar Mms Spectrometer. SNF-TP-014, Rev. 0, Pacific Northwest National Laboratory, Richland, Washington.
Gerry, W. M, 1997c. Calibration of MI Gas Chromatograph Model MOO. SNF-’I”-013, Rev. 0, Pacific Northwest National Laboratory, Richland, Washington.
Serles, J. A. 1997. Furnace Testing of N-Reactor Fuel Element 5744U. PTL-005, Revision 0, Pacific Northwest National Laboratory, Richland, Washington.
Reports are written separately for the whole element drying test series as follows:
System Design Description for the Whole Element Furnace Testing System
Spent Fuel Drying System Test Results (First Dry-Run)
Spent Fuel Drying System Test Results (Second Dry-Run)
Spent Fuel Drying System Test Results (Third Dry-Run)
Drying Results of K-Basin Fuel Element 1990 (Run 1)
Drying Results of K-Basin Fuel Element 3 128W (Run 2)
Drying Results of K-Basin Fuel Element 0309M (Run 3)
Drying Results of K-Basin Fuel Element 5744U (Run 4)
Drying Results of K-Basin Fuel Element 6603111 (Run 5)
Drying Results of K-Basin Fuel Element 1164M (Run 6 )
Drying Results of K-Basin Fuel Element 2660M (Run 7)
Drying Results of K-Basin Fuel Element 6513U (Run 8)
8.1