Embed Size (px)
Citation preview
I i
t .. I 1 G. Charalambous (Ed.), Food Flavors: Generation, Analysis and Process Influence -
O 1995 Elsevier Science B.V. All rights reserved I
, : I 1 e .
It is N i I l
1141 ! " t
i n
i i the I Effect of oxygen on the ethyl acetate production from con,&uous etha- ,
a no1 stream by Candidá utilis in submerged cultures >
the
i
I.
i l
1
ì -/
I I
I
lte
Procesos, Universidad Autónoma Metropolitana - - -.-.. -3 09340, México D.F., MEXICO.
?cherche ScienISque pour le Développement en uooperatlon), Cicerón 609, Col. Los Morales, CP 11530, México D.F., MEXICO.
If -
- Abstract. The purpose of this work wa+'to compare ethyl acetate production by C. utilis at different oxygen concentrations in an iron fiee medium. The study was achieved in a batch stirred tank reactor and gaseous ethanol was fed continuously in the air stream. The acetaldehyde production as well as the cell growth were increased when oxygen level was maintained between 5% and 15 % rather than 0% and 2%. It was also found that the ethyl, acetate maximum concentration was iderior (5.1 gA against 8.0 gfl) at higher oxygen levels but with a higher productivity (0.1 g/l.h) in that case. Finally, ethyllacetate and acetaldehyde productions were found to be directly dependent on the grpwth phase in both cases.
r i
renties, there has.been an increased interestin the use ir riavors that can be labeled as "natural" in the food industry. This trend has
d research to look for new sources of these products. Among the "*om plant tissue cultures 111, the enzymatic
ir either by adchng new,ehzymes or by using the native system of
L. ' . Ell --- II. 7 B.
pal origin 141. products, including food &dients - such I (generally recognized as safe) status;
wmcn is the case tor most of the biotechnological products likely to be used in the food industry.
isms that can produce flavors or flavor enhancers is )road NJ, and these are already a great number of processes successfully applied in
"'hile microorganisms have a deh i t e role in the production of the ewer are the cases where the microorganisms
;enerate these flavors under controlled conditions to optimize the production of the
-1 - - - I -
'-' L - 2 - 1 I
_ _ .
._ - , .- I - .
acemaenyae L ~ J , rseudomonas Fagï for strawberry flavor due to C4-cS ethyl
i I
l
esters [SI), yeasts (e.g. Yarrowia lipolytica for 4-decalactone [9]) or molds (e.g. Penicillium roqueforti for ketones 1101 o r lactones [ll], Ceratocystis fimbriata for banana-like aroma [12]).
The role of yeasts, such as Saccharomyces cerevisiae, in the formation of secondary aromas in the alcoholic fermentation must be considered: fusel oils [13], acylated amines [141 o r esters [151. Among the diversity of flavoring compounds secreted by yeasts, acetaldehyde and ethyl acetate are of relevance as additives in the food industry The former delivers a fresh nr GGty fl,evc?r te fwd such as fi-ùits, bread, vegetables, dairy products and candies. It is also known to be highly reactive and is used to produce chemicals such as acetic acid, ethyl acetate, butanol, ...[ 161. The latter, characterized by a fruity note, is present in almost all the fruits and used in ice creams, candies, baked goods or chewing gums [16]. Both are listed as GRAS by the US Food & Drug Administration and their annual consumption as flavoring agent, in the US. in 1987, was about 147 and 14 tons, respectively [17].
Although ester production by microorganisms was recognized since the beginning of the century, it was until the fifties that the formation of these compounds by yeasts was studied with special interest in ethyl acetate. Works with Hansenula and Pichia strains [18,19] grown on glucose demonstrated that ethyl acetate formation was due to the aerobic utilization of the ethanol formed. It was also shown that acetaldehyde and acetic acid were also produced and it was suggested that the ester formation had a survival value for the yeasts by preventing the accumulation of toxic amounts of free acetic acid. For the cases of Hansenula mrakii and Geotrichum penicillatum, it was shown that not only ethyl acetate was formed but also other acetate esters, such as isobutyl, isopentyl or 2- methylbutyl acetates from the alcohols formed from deamination and decarboxylation of amino acids [3,20]. Nevertheless the mechanism of ethyl acetate formation seems to be different from the other esters because it is produced in the growth phase while the other esters are formed in the stationary phase. In this phase the microorganisms are also able to convert added alcohols and carboxylic acids into esters. The authors pointed out that a clear diauxic effect was observed when glucose was exhausted in H. mrakii cultures 1211.
Another yeast, Kluyveromyces fragilis, showed its ability to produce ethyl acetate from whey permeate but only if lactose and ethanol are both present in the broth [22,23]. The levels of dissolved oxygen were shown to have a primordial importance on the orientation of the metabolism [23].
Ester formation (specially ethyl and isoamyl acetates) has been also thoroughly studied in the alcoholic fermentation with Saccharomyces cerevisiae [24,251. The membrane bound enzyme alcohol acetyl transferase has been suggested to produce the ethyl acetate [26]. S. cerevisiae fermentation produces also acetaldehyde which is very important due to its low sensory threshold value. Saccharomyces rouxii, used in the soy-sauce fermentation, is also known for producing ethyl acetate [27]. In that case, the yeast was found to produce large amounts of the ester from glucose and added ethanol (conversion yield about 16 %) but showed a poor ability to produce it from ethanol alone. An inhibitory effect of sodium chloride was established.
The yeast Candida utilis has been shown t o produce ethyl acetate and acetaldehyde from ethanol as sole carbon source [28-301. The production of the volatiles was shown to be dependent on lack of iron in the medium. It has been
.g. or
of
ds in
re <l . id
31,
... 4
35 is
le se
I t I t
' y )f :1 !- d -1
LS
LS
5
V 5
t
1
1 2
i
l suggested that this limitation inhibits the TCA cycle thus causing an accumulation of acetyl-coA which, through an alcohol acetyl transferase, produces the ethyl acetate. Similar observations were made with C. pseudotropicalis, but inferior ethyl acetate concentrations were reached [311.
The ester is mainly formed when there are low ethanol concentrations in the medium. This has led some authors to propose that this transformation may be used as an alternative method to treat dilute ethanol streams such as those obtained in brewing 1291. When the alcohol concentration was increased in the medium beyond 35 gA, the metabolism of the yeast shifts t o produce acetaldehyde. Rapid accumulation of acetaldehyde may inhibit acetyl-coA formation thus reducing the production of ethyl acetate. Acetaldehyde can be further oxidized to acetic acid which may in turn reduce the yeast activity by lowering the pH.
As any production of microbial metabolites, ethyl acetate and acetaldehyde formation is strongly dependent on the environmental conditions. For S. cereuisiae ethyl acetate formation is strongly reduced when maltose concentration is high in
aerobic. Aeration rate plays a very important role-as it is directly linked to oxygen 1 availability on the medium which, in turn, influences growth and ethyl acetate yields in H. anomala [321 and in C. utilis 1291. On the other hand both studies showed that higher aeration rates bring about a reduction in ethyl acetate concentration in the medium, but this effect could be attributed to stripping.
The pH is another important parameter for ethyl acetate production by H. anomala 1191 where acidic pH was studied and for C. utilis where neutral p s more suitable for acetaldehyde production [28]. For ethyl acetate production, a pH between 5.0 and 7.0 is preferred although values above 6.0 favor acetate formation [291. The pH has shown to have an influence in the ethanol oxidation by C. utilis yeasts 1331 where at a pH of 4.2, maximum respiration rates are observed.
Besides the experiments for the production of volatile compounds by viable yeast cells, recent reports have shown other biotechnological possibilities. Ethanol has been converted into acetaldehyde by resting cells of Pichia pastoris [34,351 in a semi-batch fermenter with added ethanol in air. Also, dried Hansenula polymrpha cells have been tried in a gas solid bioreactor to transform gaseous ethanol into acetaldehyde 1361. Continuous conversions were achieved under a reduced water content (about 8%).
In previous works, the culture of C. utilis on solid supports was successfully achieved with glucose or partially hydrolyzed starch [371 or gaseous ethanol [381 as sole carbon sources. A particular attention was given on the kinetic parameters and a diauxic growth was shown as also observed by other authors for H. a m m l a . A clear limitation on growth was observed when low nitrogen concentration was used [381.
The aim of the present work was to study the effect on oxygen levels on growth and metabolites accumulation by C. utilis, in submerged cultures, when gaseous ethanol was fed as sole carbon source.
I
1144
! MATERLAL AND METHODS Microorganism and culture medium i
prepare the inoculum, it was grown in 50 ml of dextrose (20 g/l) and malt extract
Candida utilis ATCC 9950 was used throughout this study. It was grown on Potato Dextrose Agar slants for 3 days at 30°C and then maintained at 6°C. To
(20 gALmedium in 150 ml Erlenmeyer flask with continuous shaking at 200 rpm at 30°C. 'Lhe yeast was then grown on the iron Íi-ee minimai s a h medium prwioüsiy- described by Thomas and Dawson [39] which has been already used in various studies [28,29,371. Fermentation conditions
Fermentation experiments were run in a 3 1 Bioflo III fermenter (New Brunswick, USA). To avoid evaporation of ethanol and other volatile products, a condenser fed continuously with a refiigerant at -10°C was installed at the gas exit of the fermenter. Culture volume was 2.2 1 and temperature was 30°C. The pH was maintained at 6.0 with NaOH 0.5 M. Inoculum size was 10% to give an initial concentration of lx107 cells/l and initial ethanol concentration was fixed to 3.0 gA. Air was fed at a rate of 24 l/h (0.2 wm) and agitation was controlled to keep dissolved oxygen levels in the vessel at levels below 3% for experiment 1 (Exp. 1) and between 5 and 15% for experiment 2 (Exp. 2). Agitation varying from 200 to 500 rpm for Exp. 1 and up t o 600 rpm for Exp. 2 were required. Ammonium sulfate concentration was 2.5 gA in Exp.1 and reduced to half in Exp.2 to limit yeast growth in the culture.
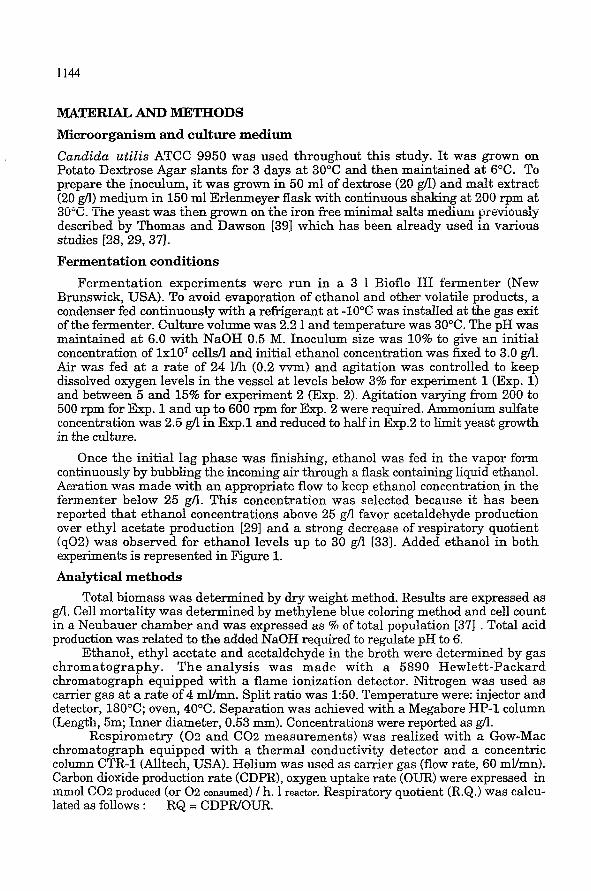
Once the initial lag phase was finishing, ethanol was fed in the vapor form continuously by bubbling the incoming air through a flask containing liquid ethanol. Aeration was made with an appropriate flow to keep ethanol concentration in the fermenter below 25 gA. This concentration was selected because it has been reported that ethanol concentrations above 25 g/l favor acetaldehyde production over ethyl acetate production [29] and a strong decrease of respiratory quotient (q02) was observed for ethanol levels up to 30 g/l [33]. Added ethanol in both experiments is represented in F'igure 1. Analytical methods
Total biomass was determined by dry weight method. Results are expressed as g/l. Cell mortality was determined by methylene blue coloring method and cell count in a Neubauer chamber and was expressed as % of total population [37] . Total acid production was related to the added NaOH required to regulate pH to 6.
Ethanol, ethyl acetate and acetaldehyde in the broth were determined by gas chromatography. The analysis was made with a 5890 Hewlett-Packard chromatograph equipped with a flame ionization detector. Nitrogen was used as carrier gas at a rate of 4 mVmn. Split ratio was 150. Temperature were: injector and detector, 180°C; oven, 40°C. Separation was achieved with a Megabore HP-1 column (Length, 5m; Inner diameter, 0.53 mm). Concentrations were reported as g/l.
Respirometry ( 0 2 and CO2 measurements) was realized with a Gow-Mac chromatograph equipped with a thermal conductivity detector and a concentric column CTR-1 (Alltech, USA). Helium was used as carrier gas (flow rate, 60 mVmn). Carbon dioxide production rate (CDPR), oxygen uptake rate (OUR) were expressed in mmol CO2 produced (or 0 2 consumed) / h. 1 reactor. Respiratory quotient (R.Q.) was C ~ C U - lated as follows :
\
RQ = CDPWOUR.
R
a'
It P:
tl tl al
n-
\I
Ll CI h a Ir v CI F
I 1
t t
3
I
I
,
3 t :i
3 1
-1 5
1
1
1145
Acetic acid and other organic compounds were determined by liquid chromatography using a 1081 Hewlett Packard chromatograph equipped with an U V detector (h = 210 nm). Separation was achieved with an Aminex HPX 87H column (Bio-Rad, USA). Oven temperature was 65 "C and 6 mmolar sul fur ic acid was used as eluent at a rate of 0.8 ml/mn.
20"r -e- Experiment 1 O
160
n M - 120' 2 -3 - 80' 9 6 * '40.
a
O
,d - - 0 - - Experiment 2 - c Ø
/ Ø
d O' , f
- P
O I I i I I O 12 24 36 48 60 72 84
Time (h)
Figure 1. Added ethanol profiles for both experiments.
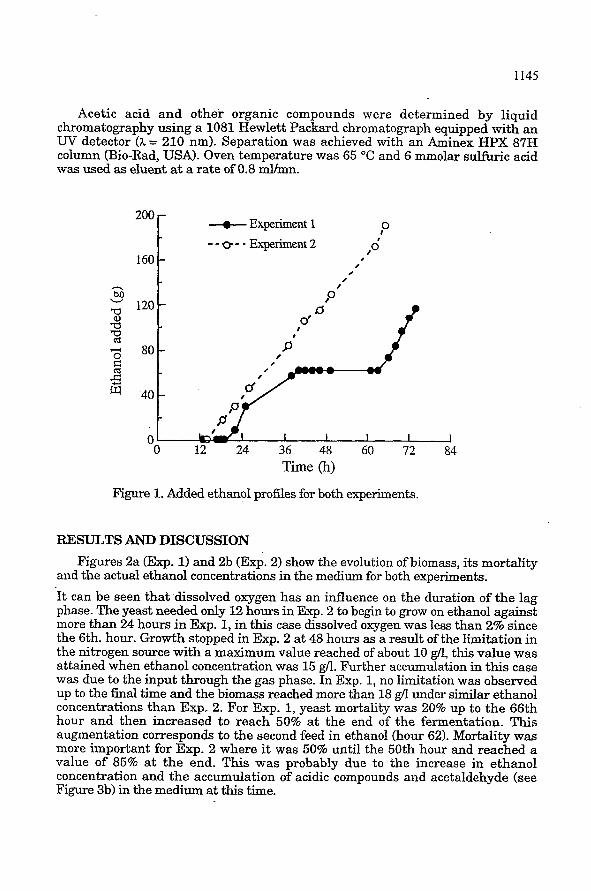
RBSULTS AND DISCUSSION Figures 2a (Exp. 1) and 2b (Exp. 2) show the evolution of biomass, its mortality
and the actual ethanol concentrations in the medium for both experiments. It can be seen that dissolved oxygen has an influence on the duration of the lag phase. The yeast needed only 12 hours in Exp. 2 to begin to grow on ethanol against more than 24 hours in Exp. 1, in this case dissolved oxygen was less than 2% since the 6th. hour. Growth stopped in Exp. 2 at 48 hours as a result of the limitation in the nitrogen source with a maximum value reached of about 10 g/l, this value was attained when ethanol concentration was 15 g/l. Further accumulation in this case was due to the input through the gas phase. In Exp. 1, no limitation was observed up to the final time and the biomass reached more than 18 g/l under similar ethanol concentrations than Exp. 2. For Exp. 1, yeast mortality was 20% up to the 66th hour and then increased to reach 50% at the end of the fermentation. This augmentation corresponds to the second feed in ethanol (hour 62). Mortality was more important for Exp. 2 where it was 50% until the 50th hour and reached a value of 85% at the end. This was probably due t o the increase in ethanol concentration and the accumulation of acidic compounds and acetaldehyde (see Figure 3b) in the medium at this time.
1146
-A- Biomass ---.o _.__ Mortality 25 r
Time (h) Figure 2a. Evolution of biomass, ethanol and mortality yield for Exp. 1.
s 20 W
O O 24 48
Time (h)
80
20
A u
72
Figure 2b. Evolution of biomass, ethanol and mortality yield for Exp. 2.
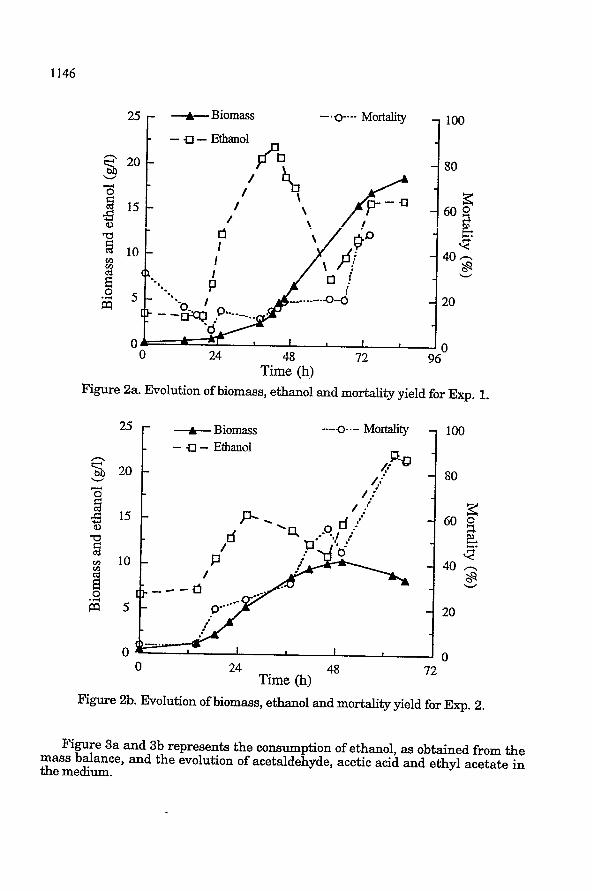
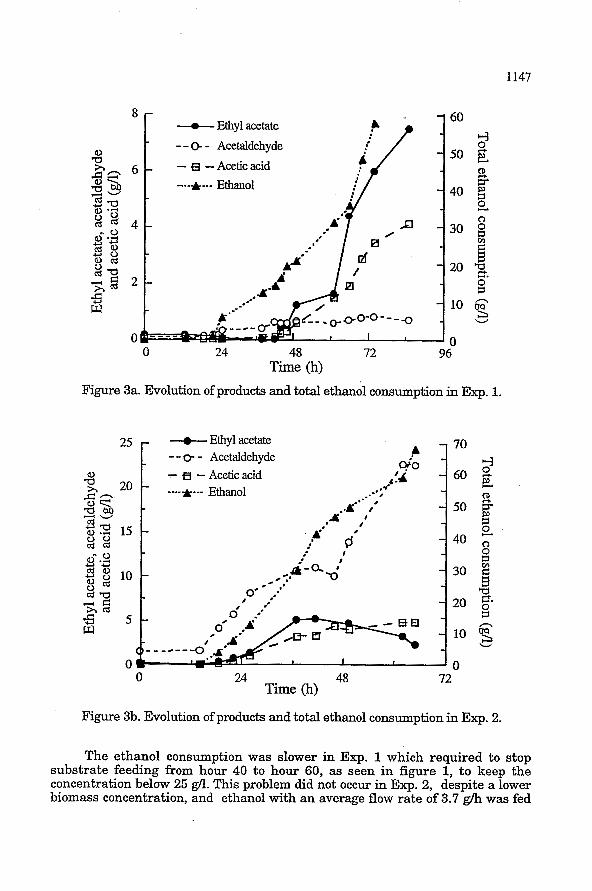
Figure 3a and 3b represents the consumption of ethanol, as obtained from the mass balance, and the evolution of acetaldehyde, acetic acid and ethyl acetate in the medium.
sub: con( bion
1147
he in
--e- Ethyl acetate - - O- - Acetaldehyde - El -Acetic acid --A---- Ethan01
Time (h) _ -
Figure 3a. Evolution of products and total ethanol consumption in Exp. 1.
+ Ethyl acetate - - 0 - Acetaldehyde - fi - Acetic acid _. .d4 ----e-- Ethanol - - c
-.&*'- 4 Ø l
15 . A.' "i 2s d* L I -
10 - 30
20
- - -
o O z s 'd
3 g.
O 24 48 Time (h)
- u 72
Figure 3b. Evolution of products and total ethanol consumption in Exp. 2.
The ethanol consumption was slower in Exp. 1 which required to stop substrate feeding from hour 40 to hour 60, as seen in figure 1, to keep the concentration below 25 g/l. " h i s problem did not occur in Exp. 2, despite a lower biomass concentration, and ethanol with an average flow rate of 3.7 g/h was fed
1148
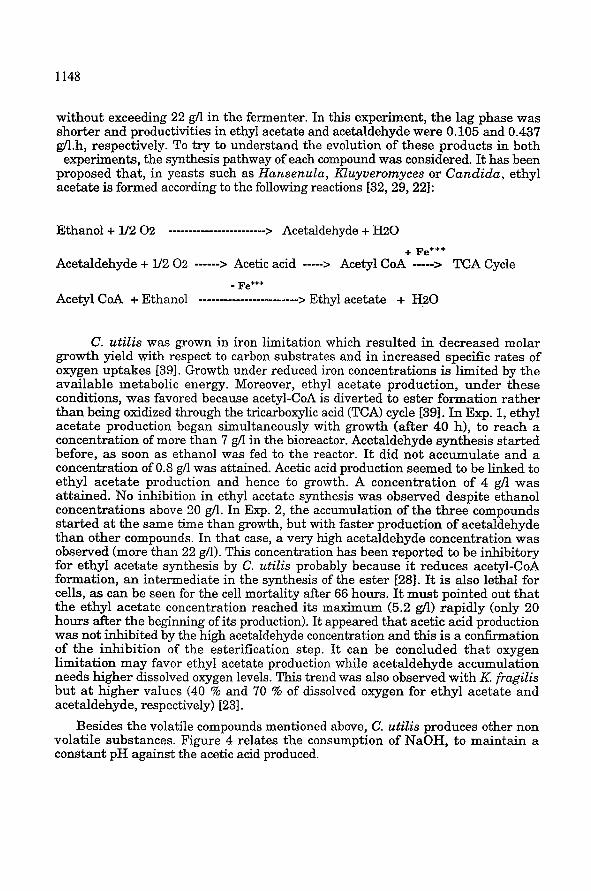
without exceeding 22 g/l in the fermenter. In this experiment, the lag phase was shorter and productivities in ethyl acetate and acetaldehyde were 0.105 and 0.437 g/l.h, respectively. To try t o understand the evolution of these products in both
experiments, the synthesis pathway of each compound was considered. It has been proposed that, in yeasts such as Hansenula, Kluyveromyces or Candida, ethyl acetate is formed according to the following reactions [32,29,22]:
C. utilis was grown in iron limitation which resulted in decreased molar growth yield with respect to carbon substrates and in increased specific rates of oxygen uptakes [391. Growth under reduced iron concentrations is limited by the available metabolic energy. Moreover, ethyl acetate production, under these conditions, was favored because acetyl-coA is diverted to ester formation rather than being oxidized through the tricarboxylic acid (TCA) cycle 1391. In Exp. 1, ethyl acetate production began simultaneously with growth (after 40 h), to reach a concentration of more than 7 g/l in the bioreactor. Acetaldehyde synthesis started before, as soon as ethanol was fed to the reactor. It did not accumulate and a concentration of 0.8 g/l was attained. Acetic acid production seemed to be linked to ethyl acetate production and hence to growth. A concentration of 4 g/l was attained. No inhibition in ethyl acetate synthesis was observed despite ethanol concentrations above 20 g/l. In Exp. 2, the accumulation of the three compounds started at the same time than growth, but with faster production of acetaldehyde than other compounds. In that case, a very high acetaldehyde concentration was observed (more than 22 g/l). This concentration has been reported to be inhibitory for ethyl acetate synthesis by C. utilis probably because it reduces acetyl-coA formation, an intermediate in the synthesis of the ester [28]. It is also lethal for cells, as can be seen for the cell mortality after 66 hours. It must pointed out that the ethyl acetate concentration reached its maximum (5.2 g/l) rapidly (only 20 hours after the beginning of its production). It appeared that acetic acid production was not inhibited by the high acetaldehyde concentration and this is a confirmation of the inhibition of the esterification step. It can be concluded that oxygen limitation may favor ethyl acetate production while acetaldehyde accumulation needs higher dissolved oxygen levels. This trend was also observed with K. fragilis but at higher values (40 % and 70 % of dissolved oxygen for ethyl acetate and acetaldehyde, respectively) [231.
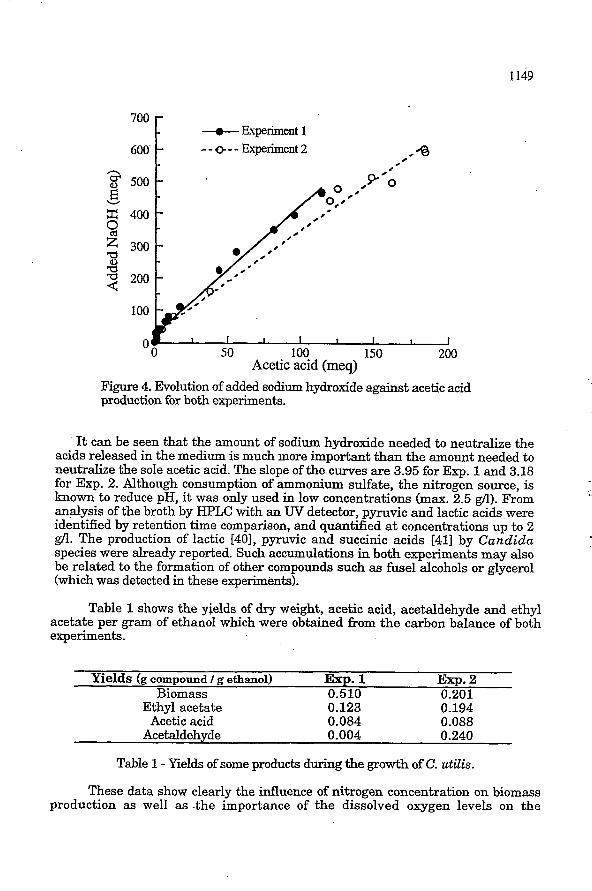
Besides the volatile compounds mentioned above, C. utilis produces other non volatile substances. Figure 4 relates the consumption of NaOH, to maintain a constant pH against the acetic acid produced.
ac nt fo kr ar id.
sp be (5%
id
act ex]
1149
-a-- Experiment 1 600 --o--- Experiment 2
" O 50 100 150 200 Acetic acid (mes)
F'igure 4. Evolution of added sodium hydroxide against acetic acid production for both experiments.
It can be seen that the amount of sodium hydroxide needed to neutralize the acids released in the medium is much more important than the amount needed to neutralize the sole acetic acid. The slope of the curves are 3.95 for Exp. 1 and 3.18 for Exp. 2. Although consumption of ammonium sulfate, the nitrogen source, is known to reduce pH, it was only used in low concentrations (max. 2.5 gn). From analysis of the broth by HPLC with an W detector, pyruvic and lactic acids were identified by retention time comparison, and quantified at concentrations up to 2 gn. The production of lactic [401, pyruvic and succinic acids [41] by Candida species were already reported. Such accumulations in both experiments may also be related to the formation of other compounds such as fusel alcohols or glycerol (which was detected in these experiments).
Table 1 shows the ~ e l d s of dry weight, acetic acid, acetaldehyde and ethyl acetate per gram of ethanol which were obtained from the carbon balance of both experiments.
Yields (g compound I g ethanol) Exp. 1 EXP. 2 Biomass 0.510 0.201
Ethyl acetate 0.123 0.194 Acetic acid 0.084 0.088
Acetaldehyde 0.004 0.240
Table 1 - Yields of some products during the growth of C. utilis.
These data show clearly the influence of nitrogen concentration on biomass production as well as -the importance of the dissolved oxygen levels on the
1150
metabolites production. Medium used in Exp. 2 contained a concentration twice lower in nitrogen source than medium used in Exp. 1, which explains a lower biomass synthesis. This was already observed with the same media used in solid state cultures of C. utilis [38]. The results given in table 1 show an increase of acetaldehyde and a decrease of biomass per gram of substrate on higher oxygen levels. Also, a slight increase on acetaldehyde and acetic acid production was observed in these conditions. So that, formation of end products was favored at high levels of oxygen. Also, higher oxygen levels enhance the formation of acetaldehyde over ethyi acetate. Furthermore, these conditions favored also higher specific productivities (expressed as grams of product per gram of biomass). While different distribution in biomass and products between the experiments was observed, both systems showed similar substrate carbon conversion capacities, (68% and 71% was transformed into biomass and products for Exp. 1 and Exp. 2, respectively).
Hernández and Johnson reported a value of 0.68 g of cells per gram of ethanol growing C. utilis in Erlenmeyer flasks in a non-iron-deficient medium. The iron-limited media decreases the efficiency of energy and growth yields with respect to the carbon sources, but it increases the specific rates of oxygen in microorganisms [42]. Therefore, it was expected to obtain low yields in the formation of cellular material, but the ethyl acetate production and acetaldehyde production were increased due to the presence of ethyl acetate substrates such as oxygen, acetic acid and ethanol. Table 2 resumes the results for ethyl acetate production from various studies.
Yeast Particular conditions Yield Ref.
Candidu utilis Nitrogen free medium+ ethanol (10 g/l) 0.254 29 Hansenula anomala Continuous culture (D=O.1 h-1) 0.014 32 Kluyueromyces fiagilis Lactose + ethanol (10 g/l) 0.300 22 Saccharomyces roui i Glucose + ethanol (46 mg/l) 0.308 27 Candida Iron free medium + ethanol (30 g/l) 0.191 31 pseudotropical is Candida utilis This study, Exp. 1 0.123 Candidu utilis This study, Exp.2 0.194
Table 2 - Yields in ethyl acetate conversion from ethanol for various yeasts.
<g/g EtOH)
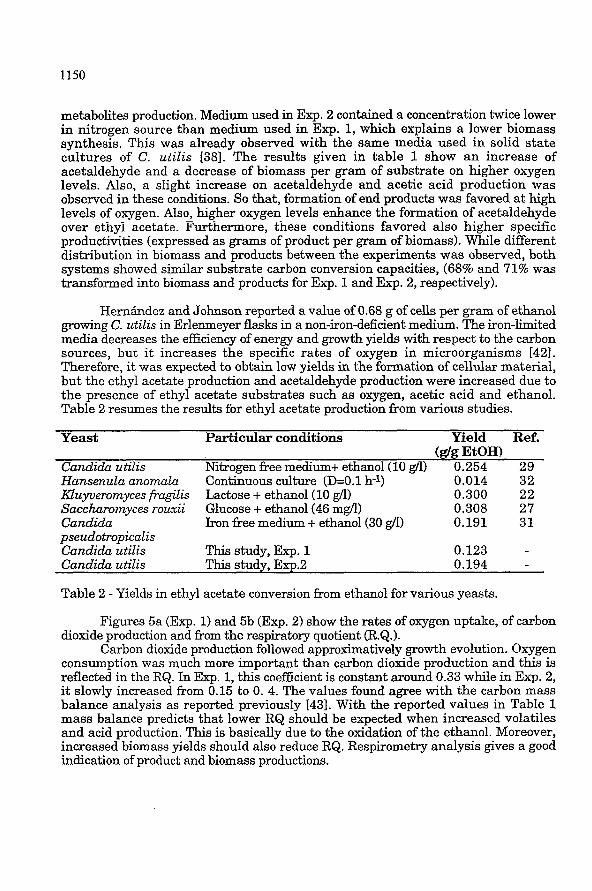
Figures 5a (Exp. 1) and 5b (Exp. 2) show the rates of oxygen uptake, of carbon dioxide production and from the respiratory quotient (R.Q.).
Carbon dioldde production followed approximatively growth evolution. Oxygen consumption was much more important than carbon dioxide production and this is reflected in the RQ. In Exp. 1, this coefficient is constant around 0.33 while in Exp. 2, it slowly increased from 0.15 to O. 4. The values found agree with the carbon mass balance analysis as reported previously 1431. With the reported values in Table 1 mass balance predicts that lower RQ should be expected when increased volatiles and acid production. This is basically due to the oxidation of the ethanol. Moreover, increased biomass yields should also reduce RQ. Respirometry analysis gives a good indication of product and biomass productions.
1152
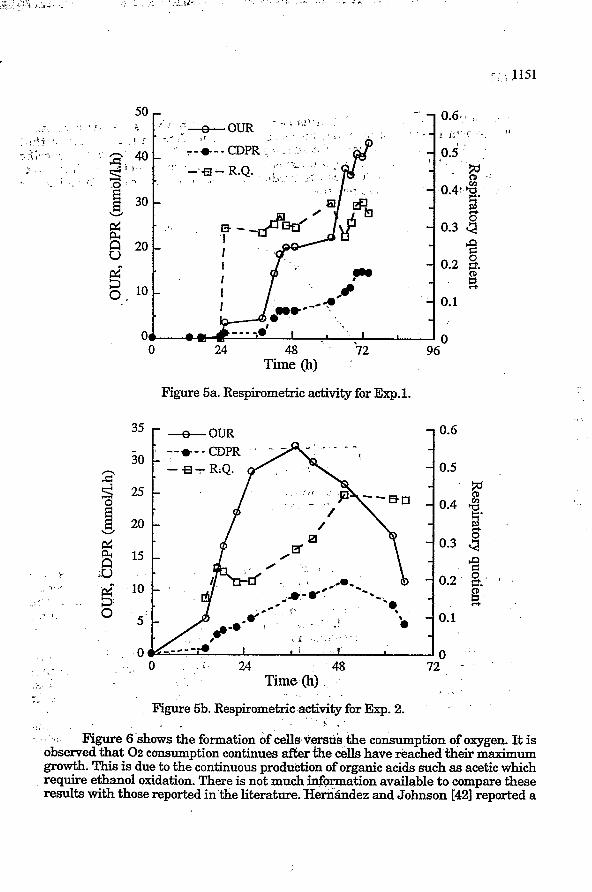
P i i
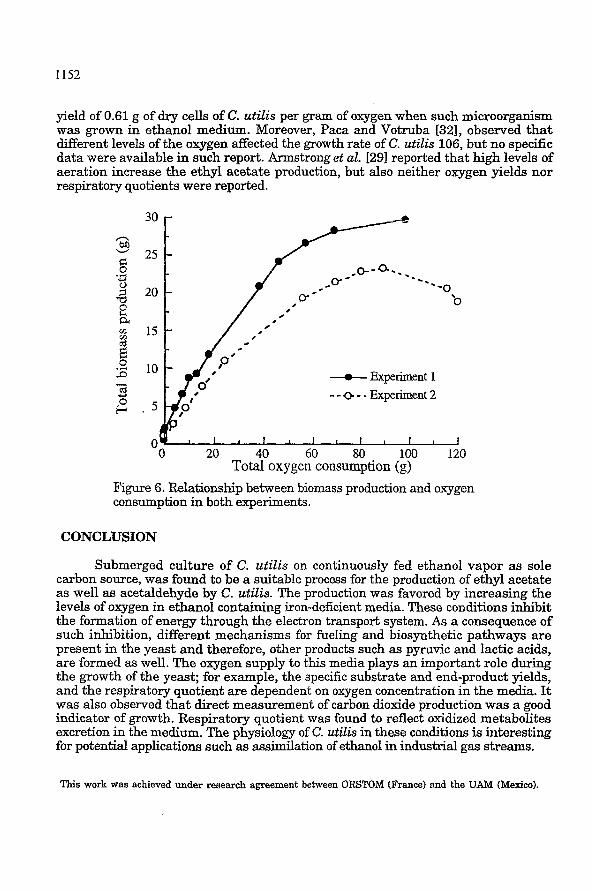
yield of 0.61 g of dry cells of C. utilis per gram of oxygen when such microorganism was grown in ethanol medium. Moreover, Paca and Votruba [32], observed that different levels of the oxygen affected the growth rate of C. utilis 106, but no specific data were available in such report. Armstrong et al. [291 reported that high levels of aeration increase the ethyl acetate production, but also neither oxygen yields nor respiratory quotients were reported.
O O 20 40 60 80 loo 120
Total oxygen consumption (g) Figure 6. Relationship between biomass production and oxygen consumption in both experiments.
CONCLUSION
Submerged culture of C. utilis on continuously fed ethanol vapor as sole carbon source, was found to be a suitable process for the production of ethyl acetate as well as acetaldehyde by C. utilis. The production was favored by increasing the levels of oxygen in ethanol containing iron-deficient media. These conditions inhibit the formation of energy through the electron transport system. As a consequence of such inhibition, different mechanisms for fueling and biosynthetic pathways are present in the yeast and therefore, other products such as pyruvic and lactic acids, are formed as well. The oxygen supply to this media plays an important role during the growth of the yeast; for example, the specific substrate and end-product yields, and the respiratory quotient are dependent on oxygen concentration in the media. It was also observed that direct measurement of carbon dioxide production was a good indicator of growth. Respiratory quotient was found to reflect oxidized metabolites excretion in the medium. The physiology of C. utilis in these conditions is interesting for potential applications such as assimilation of ethanol in industrial gas streams.
I
c L
i
.. This work waa achieved under research agreement between ORSTOM (France) and the UAM (Merico).
sm hat ific
xor j of
)le tte he %t. Pf
.re 1%
1% It od es !lg
1153
REFERENCES 1. R.J. Whitaker and D.A. Evans, Food Technol., 41(9) (1987) 86. 2. P. Christen and A. López-Mungda, Food Biotechnol., Accepted for publication.
1994. 3. L. Janssens, H.L. de Pooter, N.M. Schamp and E.J. Vandamme, Proc. Biochem.
27 (1992) 195. 4. P.S.J. Cheetham, The flavour and fiagrance industry. In: Biotechnology. The
science and the business, V. Moses and R.E. Cape.(eds.), Harwood Acad. London, 26 (1991) 481.
5. P.S.J. Cheetham, Trends Biotechnol., 11 (1993) 478. 6. G.M. Kempler, Adv. Appl. Microbiol., 29 (1983) 29. 7. M.S.A. Wecker and R.R. Zall, Appl. Env. Microbiol., 53(12) (l987) 2815. 8. F. Cormier, Y. Raymond, C.P. Champagne and A. Morin. J. Agric. Food Chem.,
39 (1991) 159. 9. M.I. Farbood and B.J. Willis, (1985) US Patent No 4 560 656. 10. C. Creuly, C. Larroche and J.B. Gros, Appl. Microbiol. Biotechnol., 34 (1) (1990)
20.
11. P. Chalier and J. Crouzet, Biotechnol. Lett., 14(4) (1992) 275. 12. P. Christen and M. Raimbault, Biotechnol. Lett., 13(7) (1991) 521. 13. E. Peynaud and G. Guimberteau, Ann. Technol. Agric., 11 (1962) 85. 14. P. Schreier, F. Drawert, A. Junker, H. Barton, and G. Leopold, 2. Lebensm.
15. H. Suomalainen, J. Inst. Brew., 87 (1981) 296. 16. Fenaroli's handbook of flavor ingredients, 2nd Ed., Vol. 2, CRC Press, Boca
17. F. Welsh, W.D. Murray and R.E. Williams, Crit. Rev. Biotechnol., 90) (1989)
18. R. Davies, E.A. Falkiner, J.F. Wilkinson and J.L. Peel, Biochem. J., 49(1951) 58. 19. J. Tabachnick and M.A. Joslyn, J. Bacteriol., 65 (1953) 1. 20. L. Janssens, H.L. de Pooter, E.J. Vandamme and N.M. Schamp, Med. Fac.
21. L. Janssens, H.L. de Pooter, L. Demey, E.J. Vandamme and N.M. Schamp,
22. H. Kallel-Mhiri and A. Miclo, FEMS Microbiol. Lett., 111 (1993) 207. 23. H. Kallel-Mhiri, J.M. Engasser and A. Miclo, Appl. Microbiol. Biotechnol., 40
24. S. Shindo, J. Murakami and S . Koshino, J. Ferment. Bioeng., 73 (1992) 370.
Unters. Forch., 162 (1976) 279.
Raton, Fla. 1975.
105.
Landbouww. Rijskuniv. Gent, 52(4) (1987) 1907.
Med. Fac. Landbouww. Rijskuniv. Gent, 53(4b) (1988) 2071
(1993) 201.
1154
25. E. Longo, J.B. Velázquez, C. Sieiro, J. Cansado, P. Calo and T.G. 'Villa, World .J.
26. K Yoshioka and N. Hashimoto, Agric. Biol. Chem., 450) (1981) 2183.
27. F.M. Yong, KH. Lee and HA. Wong, J. Food Technol., 16 (1981) 177.
28. D.W. Armstrong, S.M. Martin and H. Yamazaki, Biotech.Lett., 6(3) (1984) 183.
29. D.W. Armstrong, S.M. Martin and H. Yamazaki, Biotech. Bioeng., 36 (1984) 1038.
30. W.D. Murray, S. J.B. DuE2 P.H. Lanthier, D.W. Armstrong, F.W. Welsh and R.E. Williams, In: Frontiers of Flavor. G. Charalambous (ed.), Proceedings of the 5th. International Flavor Conference, Porto Kamas, Chalkidiki, Greece, Elsevier Science Publishers B.V., Amsterdam. (1988) 1.
Microbiol. Biotechnol., 8 (1992) 539
31. A, Willets, Antonie van Leeuwenhoek, 56 (1989) 175.
32. J. Bol., W. Knol and B. ten Brink, Dechema-Monographs, 105 (1987) 235.
33. J. Paca and J. Votruba, Appl. Microbiol. Biotechnol., 33, (1990) 438.
34. W.D. Murray, S.J.B. Duff and P.H. Lanthier, Biomass, 23(3) (1990) 229
35. H.K. Chiang, G.L. Foutch and W.W. Fish, Appl. Biochem. Biotech., 28/29
36. C.H. Kim and S. RRhee, Biotechnol. Lett., 14(11) (1992) 1059. 37. P. Christen, R. Auria, C. Vega, E. Villegas and S. Revah, Biotechnol. Adv.,
38. P. Christen, R. Auria, R. Marcos, E. Villegas and S. Revah, Adv. Bioprocess
39. KC. Thomas and P.S.S. Dawson, Can. J. Microbiol., 24 (1978) 440.
40. A. Prell, J. Paca and K Sigler, Appl. Microbiol. Biotechnol., 36 (1991) 236.
41. A. Collings, A.R. Holmes and M. G. Shepherd, Biomedical Lett., 46 (1991)
42. E. Hernandez and M.J. Johnson, J. Bacteriol., 94(4) (1967) 996.
43. L.E. Erickson, I. G. Minkievich and V.K. Eroshin, Biotech. Bioeng., 20
(1991) 513.
11 (1993) 549.
Eng., (1994). In press.
285.
(1978) 1595.
il
;... -!
G. Ch 8 1991
Chan proc
F.A.
Depar Col1 i
Abst F l
stud:) ProPC showr char: convE 0.83, extri compl thern great be d i
1.
TI. the i contr funct
El micro i n th scann
F1 micro showc starc therm
Th i n CO í n mil tempe
I
DEVELOPMENTS IN FOOD SCIENCE 37B
FOOD FLAVORS: GENERATION, ANALYSIS AND PROCESS INFLUENCE PROCEEDINGS OF THE 8TH INTERNATIONAL FLAVOR CONFERENCE, COS, GREECE, 6-8 JULY 1994
Edited b y GEORGE CHARALAMBOUS
1995 ELSEVl ER Amsterdam - Lausanne - New York - Oxford - Shannon -Tokyo
ORSTOM Fonds Pocumentaire
" E L//(".+$&Q!J~