Embed Size (px)
Citation preview
The New I-64 Economic and
Regional Mobility Study
Quarterly Report # 2
March – May 2008

1. Executive Summary On January 2, 2008, the section of I-64 from Ballas Road to I-170 (see map) was completely closed for construction. The closure is planned to last through the end of 2008, at which time a section to the east will be closed for construction for the bulk of 2009. Construction is proceeding well in the west closure section. This quarterly report assesses the period March through May 2008 that includes the 3rd, 4th and 5th months of the western closure, evaluating the three key areas of Project Communications (MoDOT’s provision of information to the public, and the public’s response to the project), Mobility (the effects of the closure on travel behavior, choices, and traffic flow), and Economics (the effects of the closure on businesses within the corridor as well as the economic health of the region). With the western closure now five months old, findings are beginning to emerge that will be of interest to MoDOT and the general public. To date, the research team has found:
closure
Communications (pp. 2-10) Mobility (pp. 11-21) Economics (pp. 22-24) Over 2,950 members of the public
have given feedback through web surveys, mail surveys, personal
interviews, and surveys administered by Motorist Assist.
The public is fairly satisfied with the closure, how information has been communicated, and how they are
managing to move around the region.
The closure has had varying effects on the public’s travel
habits, with nearly 3/4 indicating their travel frequency has
changed for certain trips and earlier morning commute times.
People’s reported travel times are lengthening (travel times greater
than 15 minutes was approximately 29%), although many trip times are relatively
unchanged.
The closure has re-routed approximately 140,000 to 150,000 vehicles per day; travelers have taken alternative routes, altered
their travel schedules, and considered alternate modes.
Freeway travel times are similar to the previous year and there is a
noticeable peak spread and increased traffic volumes on some
freeways.
The RideFinders rideshare program experienced a 37 percent jump in comparison to the last year and
during the month of May, 500 new participants signed up. Gas prices have probably contributed to the
demand for these services.
Arterial traffic volumes generally have increased between 3 and 50
percent (see page 16) except Lindbergh Boulevard, where traffic
patterns have changed because of the closure.
A draft major findings report was developed on the first regional
business survey. 369 respondents provided information for inclusion
to this report.
I-64 ERM –Second Quarter Report, 2008 1
MERIC supplied special ZIP-code-
level data for the first quarter of 2006 and all four quarters of 2007.
This information along with the previous completed economic study for serve as baseline data.
Specific transportation-dependent local firms and organizations were
identified for detailed follow-up interviews. These firms include
catering, parcel shippers, utilities, hospitals, hotels and lodging,
agricultural research and museums. To date, 12 firms and
organizations have been interviewed.

2. Communications Communications Highlights The citizens of the St. Louis region are providing input to this research through online surveys, mailed surveys, handouts by Motorist Assist operators, and personal interviews. Highlights gleaned from these surveys include:
• Awareness. From the responses to date, it appears that MoDOT effectively communicated the upcoming closure to the affected population in 2007; pre-closure awareness was reported as very high.
• Satisfaction. Respondents are largely satisfied with their ability to travel around the region and with the level of information that has been communicated by MoDOT and others regarding the closure.
• Information Sources. TV News appears to be the best way to reach the majority of the respondents, with radio news, newspapers, and road signs also being effective methods. For those who use the internet, online information sources are almost as effective as TV news. However, a large portion of the general population does not obtain their information via the internet and other methods should continue to be used to reach them.
• Alternative Routes. I-44 was the most recommended alternative route. Two nearby parallel arterials, Ladue Road and Clayton Road, received more negative recommendations than positive (with Ladue receiving over 1.6 times as many negatives as positives).
• Travel Time. The majority of respondents are indicating that that their travel time for basic trips has increased; although many have indicated no change or even an improvement in travel times.
• Travel Mode. Initial responses on how the closure has changed people’s mode of travel are somewhat inconclusive. It is clear that the dominant mode of travel by the respondents has been, and continues to be, the automobile.
• Personal Impact. The closure is affecting people’s trip choices. Survey respondents are indicating changes in basic trip destinations such as shopping and eating out. Overall, almost three quarters of respondents are indicating that their frequency of travel to certain areas has been affected by the closure. Some residents have shifted their work hours, especially the respondents to the Web survey, who indicated a shift to earlier morning commutes. However, the web survey received a heavy early response when impact uncertainty to the closure was high. This issue will be explored in more detail as progress is made on the I-64 study.
To date, the responses have been fairly consistent over the various survey methods (with the exception of some of the interview results as can be seen in the travel-time responses presented later). This general agreement across surveys is important because it appears to demonstrate that one can generalize from the surveys to the general population (other than issues related to online access, which is by definition skewed in the Web survey responses).
I-64 ERM –Second Quarter Report, 2008 2

Communication Assessment Objectives and Methods
Total Collected Surveys by Method
Web 1,040 Mail 700 In-person 100 Motorist Assist MoDOT 749 I-64 Traffic Response 362 TOTAL 2951
Estimate changes in behavior
Hear everyone’s voice (obtain generalized sample)
Measure participant satisfaction for key issues
Determine effectiveness of pre-closure notification
Develop and implement survey instruments
Major Goals – Communication Assessment
Four classes of survey instruments were developed to assess the communication aspects of this project:
• A detailed online survey was developed; participants had the option to complete a brief, medium, or detailed survey. Surprisingly, 61 percent of the respondents were interested enough in sharing their opinion that they elected to complete the detailed survey. Links to the survey were placed on both MoDOT’s main website and the New I-64 Project site. MoDOT, through its project public outreach efforts, continues to encourage and promote public input via this survey method. Beginning in the 3rd quarter (June 1, 2008), enhancements were made to the online survey instrument to gain additional information and insight on the I-64 project. A copy of the enhanced online survey is contained in Appendix A.
• To help obtain a representative sample, a physical survey was developed and mailed to 10,000 respondents in twenty-eight zip codes near the I-64 project. This work was completed during the first quarter and summarized in the 1st quarterly report. This mailed survey was successful in helping achieve a better cross-sectional representation of the region’s population. This survey will be administered again early in 2009 and after the I-64 project is completed.
• In-person surveys were utilized to assess public opinions at two major shopping locations in the immediate area of the closure (the St. Louis Galleria near I-64/I-170, and Schnuck’s grocery store at Lindbergh Boulevard and Clayton Road). These interviews were conducted late in the 1st quarter and are summarized in this report, with the final summary report contained in Appendix A.
• Project satisfaction measures were also added to the Motorist Assist and I-64 Traffic Response service surveys that are distributed to people serviced by Motorist Assist and I-64 Traffic Response operators. During the second quarter period, 650 - Motorist Assist and 324 - I-64 Traffic Response were received. This significant increase in survey information received is a direct result of operators’ encouragement to those they serve to complete the survey, to help strengthen both programs with public input received.
In order to facilitate comparisons of changes across survey types and from time to time, the statistics used in the project assessment usually do not include the “not sure” or “no opinion” percentages. This eliminates a major source of random variability and allows a more accurate observation of change over time. In addition, this methodology is consistent with how MoDOT calculates similar Tracker measures.
I-64 ERM –Second Quarter Report, 2008 3

Communications Results Communications Results
Use of I-64, Knowledge of the Closure Use of I-64, Knowledge of the Closure
Usage of I-64 before Closure
(Web Only)
Almost every day 32% Very rarely 20 %
Two to three times a week 16 % Once a week 15 %
Most weekdays 14 % Never 3 %
Knowledge of Closure
(Web Only) The survey results indicate that the public was very aware of the closure well before it occurred. 98.4 percent of the online respondents were aware of the upcoming closure in 2007, and since 97.2 percent of the online respondents traveled on the affected section of I-64 at least once per week before the closure, it appears that the target population received the needed advance information. The changes between the first quarter and second quarter report measurements were generally less than 1 percent. The entire five months of online survey data is included in this report to give a more complete picture of perceptions regarding the roadway closure to-date for readers of this report.
The survey results indicate that the public was very aware of the closure well before it occurred. 98.4 percent of the online respondents were aware of the upcoming closure in 2007, and since 97.2 percent of the online respondents traveled on the affected section of I-64 at least once per week before the closure, it appears that the target population received the needed advance information. The changes between the first quarter and second quarter report measurements were generally less than 1 percent. The entire five months of online survey data is included in this report to give a more complete picture of perceptions regarding the roadway closure to-date for readers of this report.
Aware of closure before survey: 98 % Learned about closure:
Before Dec ‘07 94 % % Dec ‘07 Dec ‘07 4 % 4 % Jan ‘08 Jan ‘08 2 % 2 %
Satisfaction Satisfaction The charts at right summarize survey respondents’ opinions in the area of satisfaction. As the graphs indicate, 69 to 95 percent of the respondents expressed satisfaction in response to each question in each forum, and responses were fairly consistent across the different survey types.
The charts at right summarize survey respondents’ opinions in the area of satisfaction. As the graphs indicate, 69 to 95 percent of the respondents expressed satisfaction in response to each question in each forum, and responses were fairly consistent across the different survey types. Satisfaction was highest with “how well the public has been kept informed” (91 to 95 percent) and “the timeliness of information” (89 to 94 percent). The least amount of satisfaction was expressed for “how traffic is flowing in work zones” (69 to 76 percent) and “accuracy and understandability of construction zone signs” (76 to 77 percent).
Satisfaction was highest with “how well the public has been kept informed” (91 to 95 percent) and “the timeliness of information” (89 to 94 percent). The least amount of satisfaction was expressed for “how traffic is flowing in work zones” (69 to 76 percent) and “accuracy and understandability of construction zone signs” (76 to 77 percent).
Respondent Satisfaction (% of respondents)Very Satisfied Satisfied Dissatisfied Very Dissatisfied
Web Surveys (n= 1,040)
202125
3536
4844
50
5648
4743
4728
41
1921
2012
1311
87
510
810
413
32
45
accurate/understandable signsw ork zone traffic flowmanaging to mov e around areaov erall satisfactioncommunication of alts2 y ears v s 6-8 y earstimely informationpublic informed
Mail Surveys (n=700)
192023
3132
4141
49
5856
595756
45
46
2018
139
108
54
36432
753
accurate/understandable signsw ork zone traffic flowmanaging to mov e around areaov erall satisfactioncommunication of alts2 y ears v s 6-8 y earstimely informationpublic informed
The in-person interviews, conducted late in the first quarter at two major shopping locations near the closed section of I-64, showed general agreement with other survey results. Conducting surveys at shopping locations provides a potential correlation link with the economic component of this study. Consistency in data across all survey efforts helps validate that true public opinion is being gained.
The in-person interviews, conducted late in the first quarter at two major shopping locations near the closed section of I-64, showed general agreement with other survey results. Conducting surveys at shopping locations provides a potential correlation link with the economic component of this study. Consistency in data across all survey efforts helps validate that true public opinion is being gained.
Motorist Assist Surveys (n=1,111)
3744
5245
79
managing to mov e around area2 y ears v s 6-8 y ears
Interviews (n=100)
15
2425
38
3951
53
6058
48
5043
27
1613
9
115
4
03
5
01
0 20 40 60 80 100
ability to mov e around area
communication of altsov erall satisfaction
2 y ears v s 6-8 y ears
timely informationpublic informed
I-64 ERM –Second Quarter Report, 2008 4

Note: written and verbal responses to the surveys are still being processed, but one notable item is that respondents have expressed satisfaction regarding the regional collaboration on signal timing that has facilitated arterial flow during construction; the public has also expressed a desire to see these timing improvements continued after the project is complete.
Note: written and verbal responses to the surveys are still being processed, but one notable item is that respondents have expressed satisfaction regarding the regional collaboration on signal timing that has facilitated arterial flow during construction; the public has also expressed a desire to see these timing improvements continued after the project is complete.
4610
25
515
19
3234
4041
3535
18
6562
5651
4437
2135
w here I liv ew here I w orkw here I bankw here I buy gasw here I eat outw here I shopfreq. trav el to certain areas
Strongly Agree Agree Disagree Strongly DisagreeThe Closure Has Changed… (% of respondents)
Web Surveys (n= 1,040)
Mail Surveys (n=700)
455101317
36
442
924
22
2629
3836
2932
13
6662
5545
3429
1536
w here I liv ew here I w orkw here I bankw here I buy gasw here I eat outw here I shopfreq. trav el to certain areas
Personal Impact of the Closure Personal Impact of the Closure
Interviews (n=100) As the graphs at right indicate, respondents much more often modified their frequency of travel to certain areas than the location of their basic trip destinations. The most affected destination types were shopping (29 to 39 percent) and eating out (21 to 37 percent).
As the graphs at right indicate, respondents much more often modified their frequency of travel to certain areas than the location of their basic trip destinations. The most affected destination types were shopping (29 to 39 percent) and eating out (21 to 37 percent).
Spatial/Temporal Effect on
Job
Mail Web Same hours, same location 87 % 69 %
Shifted hours 8 % 22 % Shift location more often 4 % 6 %
Quit job 1 % 3 %
Commute or Other Travel Period Demonstrates Shift
Web only before after
Most respondents indicated that they have continued to work the same hours in the same locations since the closure. The online respondents, including residents more distant from the closure than the mailed survey, were much more likely to have shifted hours in response to the closure compared to those who completed the mailed survey.
Most respondents indicated that they have continued to work the same hours in the same locations since the closure. The online respondents, including residents more distant from the closure than the mailed survey, were much more likely to have shifted hours in response to the closure compared to those who completed the mailed survey.
15
15
10
10
25
20
26
33
44
49
61
53
52
43
25
4
6
5
3
1
0 20 40 60 80 100
changed w here I spend my money
changed how often I trav el ov erall
changed my w ork schedule, location, or habits
caused me to combine my trips more often
changed how often I trav el to certain areas
The web survey revealed a stated shift to earlier morning commute/travel hours (192 before to 277 after), but no significant shift in the evening hours. It should be noted that anecdotal information, and other observations, indicate that this shift was high initially, but has lessened over time as conditions have begun to stabilize. The high number of web survey responses in the early weeks of the closure may therefore skew this data; future reports will further examine time trends to explore this effect.
The web survey revealed a stated shift to earlier morning commute/travel hours (192 before to 277 after), but no significant shift in the evening hours. It should be noted that anecdotal information, and other observations, indicate that this shift was high initially, but has lessened over time as conditions have begun to stabilize. The high number of web survey responses in the early weeks of the closure may therefore skew this data; future reports will further examine time trends to explore this effect.
before 7 am 192 277 7 - 9 am 419 334
9 am - 3 pm 93 93 103 103 3 - 6 pm 3 - 6 pm 370 370 376 376
after 6 pm after 6 pm 125 125 145 145
I-64 ERM –Second Quarter Report, 2008 5

Information Sources and Communication Methods TV News was considered to be the best method for MoDOT to distribute information to the public by the respondents of both the online and physical surveys. As expected, there was much variance in the perceived effectiveness of internet communications between the two survey types. Online respondents, who had to have access to the internet to even complete the survey, thought the internet was the second best way for MoDOT to provide information to them. However, those who returned the physical surveys were not as likely to use the internet to obtain their information (only 37 percent of these respondents thought the internet was a good way for MoDOT to provide them with information). Radio news and newspapers were also considered very good methods of communication, followed by road signs. Best Way for MoDOT to Distribute Information (% responses; multiple choices allowed)
Web R Mail Responses esponses
Alternate Routes (% responses)
11202526263030
44
3212
153124
14
8348
6259
43464642
6
24
0 20 40 60 80 100
I-55Ladue
I-70Page
Clay tonManch
Oliv eI-44
tried - recommend tried - don't recommend hav en't tried
Alternative Routes Respondents were also asked to provide input about eight alternative routes. I-44 was the most recommended route, with 44 percent of the respondents recommending it (just over three-fourths of those who had tried the route). Clayton Road and Ladue Road were the least recommended routes, in the sense that more respondents recommended against their usage than for them.
7737
53554739
12172117
868
10
2
TV News Internet Sites Radio News Newspapers
Road signs headed toward closure Road signs on other roads
Project email (MoDOT or I-64 Team) Radio Talk Shows
Receive info in mail (newsletter, etc.) Word of mouth (friend)
Work Proj display boards @ public gatherings
Call 511 Call 1-888-ASK-MODOT
Other
New I-64 (TheNewI64.org)Post-Dispatch (STLToday.com)
MoDOT's (MoDOT.org / MoDOT.gov)TV Channel 5 (KSDK.com)
GatewayGuide.comTV Channel 4 (KMOV.com)
TV Channel 2 (MyFOXSTL.com)Post 4 Traffic Online (post4trafficonline.com)
Metro (MetroStLouis.org)Radio AM 1120 (KMOX.com)
Other
6058
4943
3828
22191110109542
40312925
18141311874322
1
GetAroundSTL.comRadio AM 550 (KTRS.com)
DontGetStuck.orgMidMetro4.com
I-64 ERM –Second Quarter Report, 2008 6
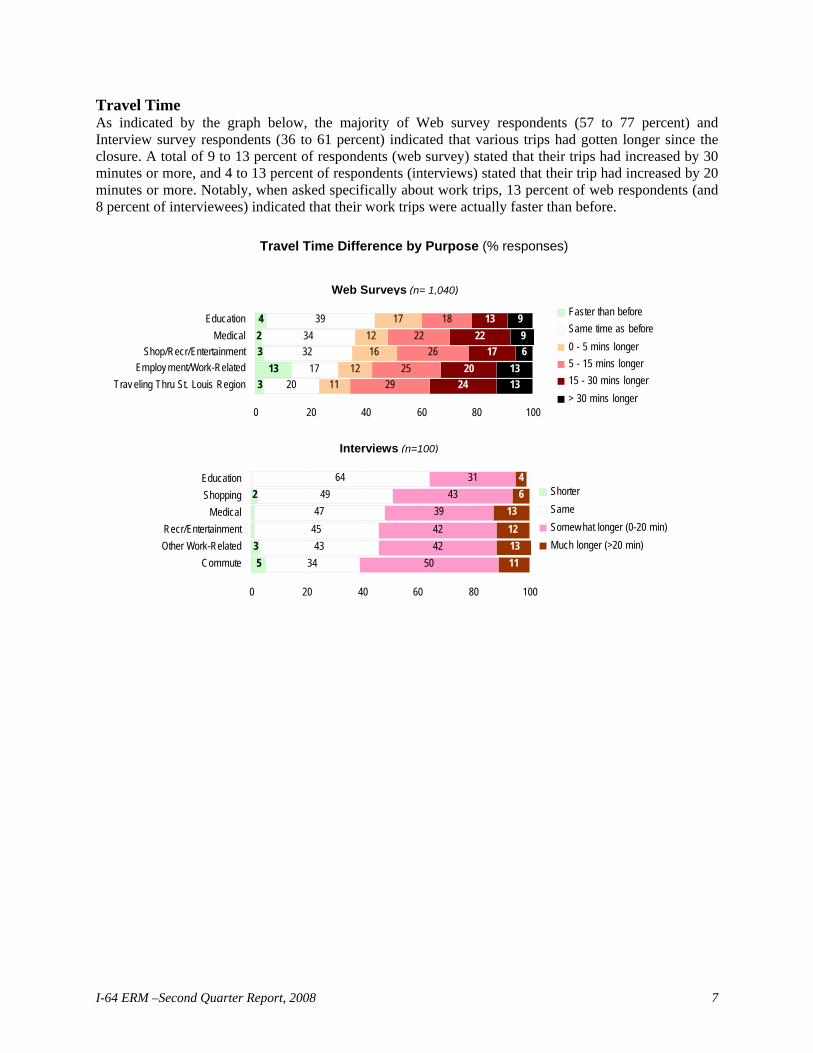
Travel Time As indicated by the graph below, the majority of Web survey respondents (57 to 77 percent) and Interview survey respondents (36 to 61 percent) indicated that various trips had gotten longer since the closure. A total of 9 to 13 percent of respondents (web survey) stated that their trips had increased by 30 minutes or more, and 4 to 13 percent of respondents (interviews) stated that their trip had increased by 20 minutes or more. Notably, when asked specifically about work trips, 13 percent of web respondents (and 8 percent of interviewees) indicated that their work trips were actually faster than before. Travel Time Difference by Purpose (% responses)
Web Surveys (n= 1,040)
313
4
2017
3234
39
1112
1612
17
2925
2622
18
2420
1722
13
1313
69
9
32
0 20 40 60 80 100
Trav eling Thru St. Louis RegionEmploy ment/Work-Related
Shop/Recr/EntertainmentMedical
Education Faster than beforeSame time as before0 - 5 mins longer 5 - 15 mins longer15 - 30 mins longer> 30 mins longer
53
2
3443
4547
4964
50424239
4331
11131213
64
0 20 40 60 80 100
CommuteOther Work-RelatedRecr/Entertainment
MedicalShoppingEducation
ShorterSameSomew hat longer (0-20 min)Much longer (>20 min)
Interviews (n=100)
I-64 ERM –Second Quarter Report, 2008 7

Travel Modes Change in Travel Mode To date, the surveys have revealed only slight changes in
reported travel mode since the closure, as illustrated below and at right. Single-occupant driving has apparently slightly decreased by 2 to 3 percent, and carpooling also appears to have decreased. For other modes, the fluctuations are not stark, but there appears to have been some increase in each. Further study of these results, in comparison with mobility results, may shed additional light on commute options. The interview survey travel mode question was more direct in nature regarding travel mode shift; however, the sample size of 100 respondents and sample location near the closure may require correlating this information with future interviews along the corridor. Also, the increased carpooling shown in the figures below appears to correlate to the increasing matches reported by RideFinders.
(% of respondents, interview)
3881416
9792928584
0 20 40 60 80 100
Ride the BusWalk or BikeTelecommuteDriv ing w ith Multiple PeopleRide MetroLink
Increased No Change Decreased
Travel Mode (% of respondents, mail and Web)
1247
7992
869492
2744
155
1055
205
424
0 20 40 60 80 100
Driv ing aloneDriv ing w /others
WalkingTelecommuting
Riding MetroLinkBiking
Riding the bus
Before the Closure After the Closure
Nev er few times to 4x /w k Most w eekday s Almost ev ery day
Surveys
Web
Surveys
1549
8091
869492
2642
145
9
5
5
5
54
3920
444
858179
9294
942
121719
74
266 8
62
0 20 40 60 80 100
Driv ing aloneDriv ing w /others
WalkingTelecommuting
Riding MetroLinkBiking
Riding the bus
651
888082
9494
935
101715
54
256 8
60
0 20 40 60 80 100
I-64 ERM –Second Quarter Report, 2008 8

Demographics The table below summarizes the responses to demographic questions from the respective surveys. One of the purposes of supplementing the Web survey with a mail survey was to reach populations without internet access, in order to ensure the research considered the input of as many groups as possible – a representative sample. By targeting the mail survey at many of the zip codes near the closure, the research team succeeded in its objective of reaching a more diverse population, especially in reaching more minorities and more females.
Demographics of Survey Respondents
Age Web Interview Mail Web Interview Gender Mail under 25 5 % 11 % 7% Male 41 % 55 % 34% 26 to 40 20 % 37 % 41% Female 59 % 45 % 66% 41 to 65 57 % 50 % 32% Over 65 19 % 20% Income Mail 2 % Web
Less than $20,000 * 2 % * Race Mail Web $20,000 to $40,000 * 11 % *
American Indian 1 % 1 % 0% $40,001 to $60,000 * 17 % * Asian 1 % 2 % 1% $60,001 to $90,000 * 21 % *
Black/African-American 15 % 2 % 12% $90,001 to $120,000 * 23 % * Hispanic/Latino 1 % 1 % 1% $120,001 to $150,000 * 9 % *
White/Caucasian 79 % 92 % 86% $150,001 to $200,000 * 9 % * Other 2 % 2 % 0% More than $200,000 * 8 % *
* Based on the sensitivity of question, it was not asked in these surveys
The maps on the following page illustrate the zip codes of survey respondents within Missouri (a small portion of the responses – around 2 percent – were from outside the state). These results are preliminary; future reports will likely aggregate zip codes into larger geographic units with more statistical robustness.
I-64 ERM –Second Quarter Report, 2008 9

Survey Respondents’ Residence, Commute Destination (by zip code)
Residence Location Commute Destination
Web
I-64 ERM –Second Quarter Report, 2008 10

3. Mobility
Mobility Highlights The study team continued the development of a series of systems to automate the collection, processing, and display of the enormous stream of available data. Key findings to date are listed below:
• Approximately 140,000 to 150,000 daily vehicles used the segment of I-64 between Ballas Road and I-170 before its closure. The assessment of where those vehicles have gone is still underway; based on the data in this report, the only large traffic increase seen with available data is on I-170. Volume data is still being evaluated for I-70, I-270, and the many parallel facilities that have been impacted by the closure. More data will be available next quarter, when year-old archive data from some of these facilities first comes on-line.
• Initial analysis of Traffic.com travel-time data has not indicated a significant variation in peak-hour travel times on key freeways in the region; however, additional study is needed before any conclusions can be reached.
• Transit usage is up by 9 percent over a year ago; however, this trend is not far out of alignment with the growth of the past two years.
• The RideFinders Rideshare program continued to experience increasing growth rates, with a 37-percent jump in monthly rides in the year between April 2007 and April 2008; this increase, plus smaller but noteworthy increases over the past six months appears to have been in response to (and anticipation of) the I-64 closure.
Mobility Assessment Objectives and Methods
Major Goals – Mobility Assessment
Assess the shifts (temporal, spatial, and modal) in travel demand throughout the region
Assess congestion effects of the closure
Assess closure effects on transit, ride-sharing, and park-and-ride demand.
This assessment uses a variety of tools to measure the region’s mobility before, during, and after the closure period. The assessment examines traveler shifts and their effects, using a
multitude of data sources of varying resolution. The complexity and sheer size of the data set requires examinations at several levels, and future reports will continue to hone and refine the assessment. The initial analysis of the region’s roadways and highways is focused on facilities in four Tiers, as illustrated at right. Tier 4 facilities are being assessed to see whether they should be included in the Tier 3 grouping, or excluded from further analysis. For each of these facilities, relevant mobility data (traffic volumes, travel times, incidents) are being gathered
Facility Tiers
Closure
Tier 1: Interstates Tier 2: Regional Arterials Tier 3: Local Arterials Tier 4: Candidate Local Arterials
I-64 ERM –Second Quarter Report, 2008 11

throughout the duration of the closure to measure its regional impacts.
Mobility data is being obtained through numerous sources:
• MoDOT is providing historical traffic counts through its count program, as well as archived traffic data from the Gateway Guide system. In addition, MoDOT forces have conducted travel-time runs on key segments of Tier 2/3/4 facilities multiple times since the I-64 closure. MoDOT also maintains statistics for its park-and-ride facilities across the state, and is providing monthly count data for its facilities in the region. Finally, MoDOT has produced a series of e-mail updates (initially daily, now weekly) that provide area residents (and the study team) with important mobility information.
• Traffic.com is a commercial Web site that provides, for highways in metropolitan areas across the U.S., real-time traffic congestion, travel-time, and incident data. These data are based primarily on sensors placed throughout the area. Traffic.com archives traffic volume, travel speed, and incident data – in 1-minute intervals – and has an agreement to share this information with MoDOT. The research team developed customized software routines to download, organize, prune, and analyze this data.
• St. Louis County has conducted traffic counts and travel-time studies on regional arterials periodically since the closure.
• Metro collects ridership information on MetroLink, MetroBus, Call-A-Ride, and special services, and is providing statistics aggregated on a monthly basis. In addition, Metro collects parking data at its stations with park-and-ride facilities.
• RideFinders, sponsored by Madison County Transit, is the St. Louis regional rideshare program. Rideshare data is provided on a monthly basis.
• The research team is supplementing data collection where necessary, including travel-time runs, traffic counts, and field observations.
Mobility Results
Pre-closure Capacity Improvements It is important to note that regional mobility began to be affected by The New I-64 project even before the closure. Perhaps most notably, several highway/roadway capacity improvements were implemented by MoDOT and St. Louis County on parallel and complementary facilities, as listed at right. As the list indicates, one change has been reversed in recent moths.
Key Improvements to Regional Highways/Roadways
I-70 Restripe from I-170 to I-270 (add lane in each direction)
I-44 Restripe from I-270 to I-55/I-70 (add lane in each direction)
I-270/I-64 Restripe interchange ramps to improve traffic flow now returned to original configuration
I-270/I-44 Restripe interchange ramps to improve traffic flow
Clayton Road Restripe from Mason Road to Lindbergh Blvd; upgrade various traffic signals; new traffic signals at Topping Road and Bopp Road
Ladue Road Upgrade various traffic signals; various new left/right-turn lanes; new traffic signals at Graeser Road/Warson Road
Improved Signal Timing along Page Avenue, Olive Boulevard, Manchester Road, Lindbergh Boulevard, Clayton Road, Brentwood Boulevard, Hanley Road, Big Bend Boulevard, Kingshighway Boulevard, Grand Boulevard, and Forest Park Parkway
In addition, Metro improved its transit system capacity in anticipation of the closure by increasing service frequency and adding new routes. The research team has recently received a complete list of these improvements, and they will be
I-64 ERM –Second Quarter Report, 2008 12

incorporated into future reports. Traffic Volumes Freeways Prior to the closure, in baseline 2006, I-64 carried approximately 107,000 vehicles per day (vpd) on a typical weekday – this is Annual Average Daily Traffic, or AADT (excluding “outlier” days). 100 percent of this traffic was necessarily displaced (temporally and/or spatially) as a result of the closure. Several sources are being used to evaluate the closure’s effects on traffic volumes - including before/after volumes (from MoDOT, Traffic.com, and St. Louis County), responses to the various public surveys developed, and selected aggregated data reported by MoDOT in its frequent e-mail briefings. The map at right, extracted from Traffic.com and MoDOT data, shows east-west daily traffic volumes for many of the key study facilities for the baseline year of 2006. Similar data has been extracted for the key north-south facilities (I-270, I-170, Lindbergh Boulevard, etc.) It is important to note that this information averages every non-holiday, non-“outlier” weekday from 2006, and therefore is not a good base against which to compare the effects of the closure for smaller periods (such as the current quarter under evaluation). However, it is useful for illustrating order-of-magnitude baseline conditions.
Baseline Daily Weekday Traffic (000’s) East-West Corridors (2006, full year)
128
9913
99
127128
122162
5064
184124 111 60
48
76121
125120
10794
97149
338160
21 34 21 32 18
4610
40 39 20
8 1411123 133 125
141
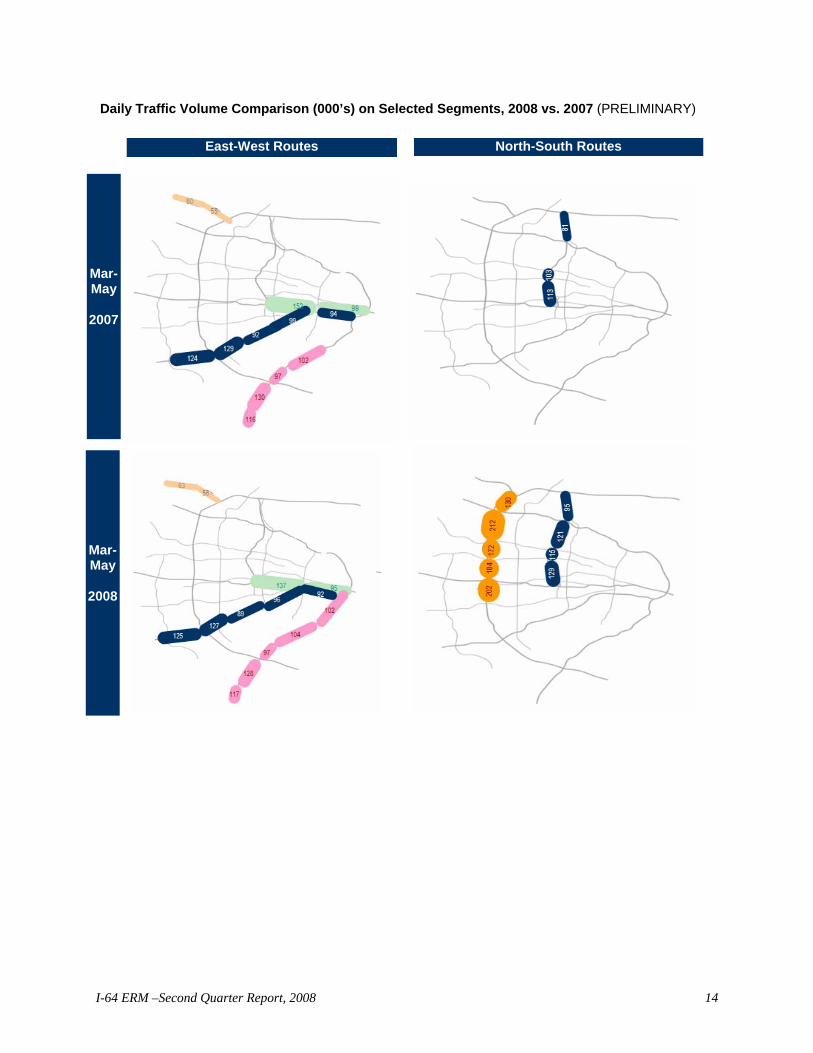
The maps on the next page show a more fair initial comparison for selected segments. They compare weekday March-May 2008 volumes with the March-May 2007 volumes. (Weekend volumes are also being assessed.) Based on these maps, the following preliminary conclusions can be gleaned:
• Daily traffic volumes on I-64 immediately east of the closure have decreased by approximately 15,000 vpd.
• Daily volumes on I-44 and I-55 appear to be roughly equivalent to those before the closure.
• Volumes on I-170 between I-64 and I-270 have increased by approximately 12,000 to 16,000 vpd compared to the previous year.
115
129
96
103
10 15 19
I-64 ERM –Second Quarter Report, 2008 13
East-West Routes North-South Routes
Mar-May
2008
Mar-May
2007
Daily Traffic Volume Comparison (000’s) on Selected Segments, 2008 vs. 2007 (PRELIMINARY)
I-64 ERM –Second Quarter Report, 2008 14

The Traffic.com data is also being examined at more refined resolutions, from hourly totals all the way down to five-minute volumes. The graphs below illustrate how the effect of the closure on the duration of the peak period is being examined. As the graphs indicate, overall volumes on this segment have generally increased, but the peak periods have spread as well. Further analysis of this spread will be undertaken in subsequent reports.
Example 15-Minute Traffic Volume Profiles I-44 at Elm Avenue
Eastbound Westbound
I-64 ERM –Second Quarter Report, 2008 15

Arterials St. Louis County has been tracking arterial volumes since the I-64 closure. The graphs below illustrate ADT data available from the County and are under study to extract trend information. For many days on which data are not plotted, volumes are only available for one direction. No significant conclusions can yet be drawn from these data, but they will continue to be a resource as the study progresses. Average Daily Traffic Volumes Recorded by St. Louis County, 2008
Jan Feb Mar Apr May
Brentwood @ Manchester
-10,00020,00030,00040,00050,000
Brentwood @ Clayton
-10,00020,00030,00040,00050,00060,000
Jan Feb Mar Apr May
Clayton @ I-270-10,00020,000
Jan Feb Mar Apr May
Forest Park @ Big Bend-10,00020,00030,00040,000
Clayton @ Crestwood-
10,00020,00030,000
Clayton @ Lay-
10,00020,00030,00040,000
Hanley @ Olive-
10,00020,000
Ladue @ Warson-
10,00020,00030,000
Laclede Station @ Marshall-
10,00020,00030,00040,00050,000
Brentwood @ I-64/40
-10,00020,00030,00040,00050,000
Jan Feb Mar Apr May
Big Bend @ Manchester-
10,00020,00030,000
Kirkham @ Newport-
10,00020,00030,000
Jan Feb Mar Apr MayDelmar @ Hanley-
10,00020,00030,000
Jan Feb Mar Apr May
I-64 ERM –Second Quarter Report, 2008 16

MoDOT also collects volume data from many of the arterials in the region using its ACTRA system tied into signalized intersections. The graphs on the following pages examine volume trends on many of the key arterials during both peak hours on a monthly basis since the closure, including a comparison to a pre-closure baseline. The table below summarizes the data. Several limitations of the data should be noted: • The pre-closure data is from a single day, in most cases collected in November or December 2007. • During the closure, not all days had available or usable data. • This data reflects only through volumes approaching intersections; hence, right- and left-turning
traffic is not included. In spite of these limitations, the data reveals some anticipated patterns, such as volume increases on Page and Olive, which run parallel to the closure. Archiving and studying these data beyond the closure will help in understanding the closure’s effects.
Manchester at Braeshire
Eastbound and Westbound: 4% to 17% increase
Eastbound: 6% reduction (after initial January dip of 20%) Westbound: 9% increase (after initial dip of 7%)
Manchester at Lindbergh
Eastbound: 10 to 27% increase Westbound: 44% to 53% increase
Eastbound and Westbound: 12% to 22% increase
Rte. 141 at Howard George
Southbound: 4% to 20% increase Northbound: dip below pre-closure (after January increase)
Southbound: 5 to 10% decrease Northbound: 4 to 7% increase (except February dip of 7%)
Lindbergh at Conway
Northbound and Southbound: 20% to 40 % decrease
Northbound and Southbound: 20% to 40 % decrease
Lindbergh at Manchester
Southbound: 200% average increase Northbound: 40 to 65% reduction
Northbound and Southbound: 40 to 65% reduction
Eastbound: 15% increase (after initial slight dip of -0.6%) Westbound: 3% to 17% increase
Eastbound: 7% to 11% increase. Westbound: up to 10%. increase (a.m. volumes higher than p.m.)
Page
Eastbound: 30% to 50% increase Westbound: 14% to 27% increase. (p.m. volumes higher than a.m.)
Olive Eastbound and Westbound: 50% to 80% increase at Old Ballas
A.M. Peak Period P.M. Peak Period
Summary of ACTRA Volume Reporting Since Closure, Key Arterials
I-64 ERM –Second Quarter Report, 2008 17

Arterial Trends, 15-minute Volumes during Peak Periods – MoDOT Actra System, 2008 East – West Routes
Baseline
Jan ‘08 Feb ‘08 Mar ‘08
Apr ‘08 A.M. Peak Hour P.M. Peak Hour
0
200
400
600
800
Volum
e (v
eh/h
r)
Eastbound EastboundWestbound Westbound
Oliv
e @
Old
Bal
las
Page
@ B
all
0
200
400
600
800
Volum
e (v
eh/h
r)
Rt1
00@
Lind
berg
h
0
200
400
600
800
Volum
e (v
eh/h
r)
35:00 6:00 7:00 8:00 9:00
Time of Day
5:00 6:00 7:00 8:00 9:00
Time of Day
:00 4:00 5:00 6:00 7:00 3:00 4:00 5:00 6:00 7:00
Time of DayTime of Day
I-64 ERM –Second Quarter Report, 2008 18

Arterial Trends, 15-minute Volumes during Peak Periods – MoDOT Actra System, 2008 North - South Routes
Baseline Jan ‘08 Feb ‘08 Mar ‘08 Apr ‘08
A.M. Peak Hour P.M. Peak Hour
Lind
berg
h@C
onw
ay
0
200
400
600
800
Volum
e (v
eh/h
r)
Northbound Southbound Northbound Southbound
Rt1
41@
How
ardG
eorg
e
0
200
400
600
800
Volum
e (v
eh/h
r)
Lind
berg
h@M
anch
este
r
0
200
400
600
800
Volum
(veh
/hr)
e
3:00 4:00 5:00 6:00 7:00
Time of Day
5:00 6:00 7:00 8:00 9:00
Time of Day
5:00 6:00 7:00 8:00 9:00
Time of Day
3:00 4:00 5:00 6:00 7:00
Time of Day
I-64 ERM –Second Quarter Report, 2008 19

MoDOT Park-and-Ride Volumes
Vehicles Parked in Lot County Lots
Total spaces Feb07 May07 Aug07 Nov07 Feb08 May08
Franklin 6 413 295 205 189 175 168 Jefferson 11 962 321 337 379 386 367 St. Charles 12 1110 427 403 283 315 301 St. Louis 6 792 519 540 582 451 493 Total 35 3277 1562 1485 1433 1327 1329
Travel Times The research team has begun using Traffic.com’s archived speed data to calculate travel times on freeway segments throughout the region. The table at right contains some of the data extracted. P.M. peak-period data are averaged over the current quarter, and compared with the last three months of 2007. In the next quarterly report, a more direct comparison of identical periods from 2007 and 2008 will be possible because Traffic.com data is available after June of 2007. The travel times in general do not show major variations from the pre-closure data, and also generally indicated faster travel times. The causes of these results will continue to be investigated, and could be attributable to a combination of peak-spreading, re-routing due to the closure, increased fuel costs, and other factors.
Travel Times (min), Selected Freeway Segments
(Preliminary)
Travel Time (min), P.M. Peak Hour
Aug–Dec ‘07
Mar-May ‘08 Miles
I-70 from I-270 to I-170 EB 3.7 5.6 5.6 WB 3.6 6.3 5.8 I-170 from I-270 to I-64/US 40 NB 3.7 7.9 7.8 SB 3.8 7.9 7.8 I-270 from I-70 to I-64 NB 3.5 9.2 8.1 SB 3.5 9.8 8.9 I-270 from I-64 to I-44 NB 6.5 7.3 6.8 SB 6.6 12.7 10.6 I-44 from Rte 141to Kingshighway EB 3.0 13.6 13.0 WB 3.0 12.0 11.9 I-64 from Rte 141 to I-270 EB 3.3 3.5 3.5 WB 3.3 2.9 2.9
Park-and-Ride The table below summarizes one year’s worth of quarterly parking counts at MoDOT’s Park-and-Ride lots in St. Louis County and neighboring counties. Updates to this table will be made as information becomes available.
I-64 ERM –Second Quarter Report, 2008 20

Transit Key Transit Statistics At the time of this report, Metro statistics are only
available through January 2008. The table and graphs at right summarize some key statistics regarding Metro usage. Ridership on the total Metro system in January 2008 (the first month of the I-64 closure) was over 9 percent higher than ridership in January 2007. However, as the graphs indicate, Metro ridership has been steadily increasing since at least mid-2005, and the increase seen in comparing January 2008/2007 data does not appear to substantially deviate from this trend.
Jan ’08 Increase over
ridership Jan ‘07
MetroBus (fixed route) 2,723,970 9.1% MetroLink (passenger rail) 1,944,205 9.4%
Call-a-Ride (paratransit) 60,167 8.4% Total Metro system (includes services not listed)
4,733,423 9.3%
Total Metro system – equivalent daily riders per month Anticipated statistics from Metro will shed additional light on any closure-related transit trends. Future quarterly reports will examine more specifics regarding individual routes affected by the closure.
-
50,000
100,000
150,000
200,000
Jan03 Jan04 Jan05 Jan06 Jan07 Jan08
-10%
0%
10%
Jan04 Jan05 Jan06 Jan07 Jan08
Month’s increase over previous year Rideshare
Ridefinders Statistics RideFinders, sponsored by Madison County Transit, is the St. Louis regional rideshare program. The graph at right shows historical ridership for RideFinders, and indicates a general upward trend since the second half of 2007. The lower portion of the figure further illustrates this jump in ridership by indicating, for each month, the percentage increase over the previous year. As the graph indicates, one-year increases in 2008 have been over 30 percent, much higher than in 2007. Obviously, some portion of these increases can be attributed to rising fuel costs, but the I-64 closure also has been a likely contributor. The research team is working with RideFinders to obtain more details to help correlate rideshare activities with I-64 closure statistics.
0%
20%
40%
J F M A M J J A S O N D J F M A M
0
2,000
4,000
6,000
8,000
J F M A M S O N D J F M A M S O N D J M
Monthly Rides vanpool
J J A J J A F M A
carpool
participating employers 2006 2007 2008
% increase over same month in previous year
(carpool + vanpool) 37 %
2007 2008
I-64 ERM –Second Quarter Report, 2008 21

4. Economics
Economics Highlights
Major Components of Economic Analysis
Analysis of pre-closure and current conditions
Determine the effectiveness of the reconstruction and traffic management
strategies on the local economy
Identify the strategies that are the most appropriate for near-term and long-term economic vitality based on special data tabulations, survey results, and individual
The primary highlight for this quarter is the analysis of the first business survey’s results. Three hundred sixty-nine survey responses from St. Louis businesses were collected during the period from February 18th through March 13th, 2008. The collection of published economic data is ongoing, and the analysis of the first package of custom ZIP code level data from the Missouri Economic Research and Information Center (MERIC) has begun. To date, MERIC has provided HDR with economic data for first quarter 2006 and all four quarters of 2007. Given the time lag in available
economic data indicators, this quarterly report will only focus on preliminary economic conditions from before the I-64 closure, while future reports will include analysis of economic conditions and impacts after and related to the I-64 closure.
Economic Analysis Progress Current activities to date include: • Presented to the MoDOT Connections Committee regarding the approach for the economic
assessment, the draft business survey, and data collection plan. • Inventoried and collected available published economic, demographic, and fiscal data. • Received from MERIC special ZIP-code-level data for the first quarter of 2006 and all four quarters
of 2007. The economic data included: industry employment, wage, and establishment data tabulations.
• Created and distributed the online Business Survey. Feedback was provided from MoDOT prior to distribution. The survey was distributed with help from local and regional economic development/business organizations. The results of the business survey have been submitted to MoDOT for review and will be available shortly.
• Specific transportation-dependent local firms and organizations were identified for detailed follow-up interviews. To date, 12 firms and organizations have been interviewed.
Business Survey
Business Survey –Selected Preliminary Results
Total Distributed 6,000+
Total Responses 369
Respondent location (based on zip code, reported by 73%)
Immediate I-64 region 23% Satisfaction w/ MoDOT execution of project
Very satisfied 46% Satisfied 40%
Dissatisfied 3% Very dissatisfied 1%
The first business survey results were collected and analyzed resulting in a Major Findings document (Appendix C) that has been submitted to MoDOT for comments. The survey’s combined distribution list included 6,000 contacts from the five economic development organizations that included 3,600 different businesses; for this round of business surveys, 369 separate responses were received. The three distinct focus areas of the first business survey were commuting, transportation/shipping costs, and sales/visitation. The survey’s questions were directed at the conditions just prior to the closure and the changes following the closure of the Western portion of I-64. The survey has provided insight regarding how business performance is being impacted based
I-64 ERM –Second Quarter Report, 2008 22

on the business type, size, and proximity to western closure of I-64. Some of the business performance indicators included retail spending patterns, visitation, and transportation costs. Major Findings:
• Satisfaction: 86 percent were satisfied or very satisfied with MoDOT’s delivery and execution of the I-64 Project, and 91 percent were satisfied with the performance of alternative routes.
• Proximity: 86 percent of the businesses that completed the survey are located within 10 miles of the I-64 Reconstruction Project.
• Future Planning: 13 percent of total survey respondents said future decisions on expansion, new investment, or location of facilities will be impacted by I-64’s closure.
• Commuting: To help manage during I-64’s reconstruction, 38 percent of respondents noted the use of flex time programs while 16 percent encouraged car/van pools and 21 percent allowed increased telecommuting.
• Transportation Costs: 94 percent of businesses located within the impacted areas of the I-64 corridor have experienced a significant or minor change in cost due to travel time delays.
• Sales and Visitation: 12 percent of all businesses surveyed confirm a lower volume of visitors and customers each week1.
Interviews As a supplement to the business survey, HDR has conducted follow-up, in-depth interviews with transportation-dependent businesses in and near the I-64 corridor. The interview process is nearly complete for this stage of the evaluation as representatives from 12 separate businesses and organizations have been interviewed via telephone. Different industry groups were targeted, with significant help from the St. Louis Regional Chamber and Growth Association (RCGA), to provide a detailed and in-depth understanding of how a range of private sector businesses are being impacted adversely by the I-64 closure and the steps businesses are taking to cope with the closure. Representatives from the following local businesses and organizations have been interviewed: catering, parcel shippers, utilities, network hospitals, hotels and lodging, agricultural research firm, and museums. The overall consensus is that businesses expected the worst before the closure, but the conditions for the first quarter have not been nearly as bad as they anticipated. To cope, some businesses have offered new flex hours and telecommuting options, and all have encouraged carpooling or public transit. These interview findings have been consistent with the results of the business survey.
1 Please note the survey questions were worded “For this time of year” to account for seasonal customer, visitor, and sales swings.
I-64 ERM –Second Quarter Report, 2008 23

Economic and Fiscal Data Analysis Preliminary analysis of the first custom economic dataset from MERIC was initiated this month. The first dataset included economic information for the first quarter of 2006 and all four quarters of 2007. The preconditions analysis of I-64 began with MERIC’s Pre-Construction2 analysis, which focused on the period from 2003 through the first Quarter of 2005. Our analysis will extend the precondition analysis forward through the fourth quarter of 2007, which will complete the preconditions portion of the analysis and establish a baseline for conditions before construction. It is anticipated that the first quarter of 2008 will be available in the third quarter of 2008, providing the most comprehensive dataset on economic impacts from I-64’s January 2008 closure. The published data is at the ZIP code level for both St. Louis County and St. Louis City. The data has been sorted by geography (corridor or non-corridor) to be consistent with the geographic units used in the Business Survey analysis. In addition, quarterly ZIP code level data from Missouri Department of Revenue for Taxable Sales is being processed to gauge local consumer sales trends and impacts. The data by ZIP code includes industry detail at the two-digit NAICS level for the number of establishments, total wages, and the number of jobs. The table at right displays the aggregate economic information for the 9 ZIP code areas impacted by I-64 closures (corridor) and the ZIP codes that make up the remainder of St. Louis City and St. Louis County (non-corridor).
St. Louis I-64 Corridor and Non-Corridor Economic Profile
(3rd Quarter 2007)
Corridor Non-Corridor Jobs 201,200 628,100
Number of Establishments 9,405 31,445 Wages ( $ Millions) $ 2,471 $ 6,753 Total Taxable Sales ($ Millions) $ 927 $ 4,167
Source: MERIC and Missouri Department of Revenue
Zip Code Definitions for Study Regions
County
City
Conclusions and Future Steps The Business survey was successful in soliciting responses from the local business community and results verify that a majority of businesses are satisfied with MoDOT’s initial performance during the I-64 closure. Upon final review by MoDOT, documents will be publicly available regarding the business survey analysis and the summary of interview findings. A meeting with the region’s lead economic development agencies and local developers has been set for June 17 to be hosted by the RCGA. The purpose is to present the business survey and interview results for discussion and feedback, as well as to obtain feedback from local experts regarding I-64’s impact on economic development conditions. Further analysis of the published data will be conducted and compared in greater detail to the “Interstate 64 Business Climate Report: Pre-Construction Analysis” performed by MERIC, focusing on the seasonal trends of the region.
2 “Interstate 64 Business Climate Report Pre-Construction Analysis”, 2006
Corridor
east
west
I-64 ERM –Second Quarter Report, 2008 24

5. I-64 Traffic Response
I-64 Traffic Response Highlights
Major Goals – I-64 Traffic Response Assessment
Assess benefit/cost of the current I-64 Traffic Response deployment (arterials)
Assess value of continuing future arterial highway
service patrol efforts
Develop white paper that provides a sustainable approach to consideration of future arterial
The main highlight for this quarter was the collection of the I-64 Traffic Response surveys. These surveys are provided during each assist performed. This survey is providing information from motorists receiving these services, including information on location, response/wait time, services provided, the professionalism with which services were provided, and the user opinion on the value of the services. Additional questions on the I-64
project were also included to help gauge users’ opinions on the I-64 project and to connect these services with the I-64 project. The survey form identifies the sponsors, and provides information on the regional traveler information systems (511 and Gateway Guide). 362 surveys have been completed and received during the first five months for the I-64 Traffic Response with 749 from Motorist Assist. In the third quarter, the study team plans to conduct interviews with staff involved with this operation and start the evaluation of responses made by the I-64 Traffic Response team. I-64 Traffic Response Objectives and Methods This assessment will utilize information collected from transportation users, I-64 Traffic Response/ Motorist Assist staff, previous research/study efforts, and the mobility assessment component to establish the benefit/cost of the program. This information will then be used to forecast the future value of continuing regional arterial highway service patrol efforts. The assessment will explore the following potential expanded arterial highway service patrol alternatives: • Expanded services only during major or roadway closure construction activities • Continuous services along major regional arterial corridors • Limited-response services along major arterial corridors by expanding the region’s Motorist Assist
Program and the utilization of the region’s integrated management and operation system A white paper will be developed by June 2009 that will outline a sustainable approach regarding when regional arterial highway patrol services should be considered. This deliverable will provide the region the time necessary to fund and implement desired recommendations.
I-64 ERM –Second Quarter Report, 2008 25

I-64 Traffic Response Results MoDOT performs service patrol activities where operators travel busy highways and provide assistance at incident sites for stranded motorists and crashes. By quickly helping to resolve problems, this program increases the safety and mobility of all motorists in the area. MoDOT 's Motorist Assist program concentrates on the interstates, and I-64 Traffic Response sponsored by St. Louis County covers major arterial roads such as Manchester Road and Olive Boulevard. Starting on January 2, 2008 – the day of the closure – these programs' operators began distributing surveys to those they assisted to obtain feedback about operator performance, and as another method to learn how the closure is impacting motorists. Responses indicate that motorists are very satisfied with operator performance, and their closure responses were similar to those obtained in the web and mail studies. The table at right summarizes some of these satisfaction measures. The 2nd quarter showed an increase in satisfaction compared to the first quarter, and represented input from 974 (650 - Motorist Assist and 328 - I-64 Traffic Response) respondents. The total of 1,111 surveys (compared to 1,040 online surveys) received indicates that this could be considered the most effective survey method to-date for gaining public input. The distribution and receipt of surveys will continue throughout the study period, with quarterly updates being made.
Percent Repondents Expressing Satisfaction Motorist Assist and I-64 Traffic Response Surveys
Ability to move
around the St. Louis area
Decision to close for 2 years vs. 6-8
2nd Quarter
Ist Quarter
2nd Quarter
Ist
Quarter
Motorist Assist survey respondents 59 % 67 % 56 % 67 %
I-64 Traffic Response survey respondents 63 % 74 % 67 % 64 %
I-64 ERM –Second Quarter Report, 2008 26

I-64 ERM –Second Quarter Report, 2008 27
Appendix A: Communications Data – “Final 1st Quarter Interview Report” and Revision Online Survey Appendix B: Mobility Data Appendix C: Economic Data – “Major Findings of First Business Survey” Appendix D: Traffic Response Data