Embed Size (px)
Citation preview

CCEESS WWoorrkkiinngg PPaappeerrss,, IIVV,, ((22)),, 22001122
241
THE MOBILITY OF THE PROCESSES OF REGIONAL INTRA-
INDUSTRY SPECIALIZATION IN ROMANIA
Oana Ancuța Stângaciu
Vasile Alecsandri Universitaty of Bacău, România
Abstract: In analyzing the mobility of the intra-industry specialization processes in Romania in the
period of time 2000-2010 on regional level, we started from the assessment of the of the structural convergence of the specialization from the point of view of the econometric connections between the regional
indexes Grubel and Lloyd and their dynamic. In order to emphasize the stability in time of the comparative
advantages of the intra-industry specialization, we built regression equations in which we used the Lafay
indices of specialization from 2000 and 2010, and in order create an integrated image on the mobility in the structure of the distribution of comparative advantages on regional level we used the probabilistic analysis
using the Markov chains.
Keywords: intra-industry specialization, sections in the Combined Register, Grubel and Lloyd
specialization indices, Lafay indices, comparative advantages
JEL Classification: C32, F10, R19
INTRODUCTION
In Romania, the international specialization on regional level suffered extensive
transformations, especially during the last years when the Romanian economy was, from all points
of view, in full process of integration into the European economic space. One of the priorities of the
process of adherence to and integration into the European Union has been the regional convergence;
consequently, an analysis of the dynamic of the regional intra-industry specialization processes
from the point of view of the mobility of the distribution of comparative advantages would be really
useful for those who have the decision making power in the economic and political environment.
1. REGIONAL COVERGENCE OF THE PROCESSES OF INTRA-INDUSTRY
SPECIALIZATION
Important clues concerning the process of regional convergence (Persson, 1994, p. 33) of the
intra-industry specialization are offered by the econometric connection between the regional
indices Grubel and Lloyd, calculated on sections included in the CR (Combined Register), for 2000
and their dynamic in 2010 compared to 2000. Such an analysis supposes building a regression
CCEESS WWoorrkkiinngg PPaappeerrss,, IIVV,, ((22)),, 22001122
242
equation, a correlogram, in which the independent variable represents the values of the Grubel and
Lloyd regional indices calculated on each section of the CR for 2000, and the dependent variable
is the dynamic of these indices from 2010 compared to the ones in 2000 (2000 = 100%). The type
of connection between the two indices dictates the shape of the regression equation.
Figure 1 - Correlogram of the Grubel and Lloyd regional indices on sections of the C R for 2000 and
their dynamic in 2010 compared to 2000; The test report of the regression equation in SPSS
Source: own processing of the data offered by the INS (National Institute of Statistics)
As we can see in figure 1, there is an interconnection between the two indices (Hallet, 2000,
p. 7); the logarithmic connection is strong (the degree of specialization determines its dynamic in
proportion of 52,8%), while the linear one is indirect and of medium intensity (the degree of
specialization determines its dynamic in proportion of 36,5%). In other words, the lower the intra-
industry specialization of the section in 2000, the higher its dynamic during the period of time
subjected to the analysis (according to the linear regression equation, for a 10% lower degree of
specialization, its dynamic is higher by 0,35%). Consequently, on regional level, there is a strong
logarithmic convergence of the intra-industry specialization for each section in the CR.
y = -0,035x + 3,476
R2 = 0,365
y = -1,506Ln(x) + 7,290
R2 = 0,528
0,0
2,0
4,0
6,0
8,0
10,0
12,0
0,0 20,0 40,0 60,0 80,0 100,0

CCEESS WWoorrkkiinngg PPaappeerrss,, IIVV,, ((22)),, 22001122
243
In order to determine if this convergence on the level of the sections in the CR has also been
conveyed on regional level, we made the same type of analysis, this time using the Grubel and
Lloyd indices aggregated on regions. In the regression equation, the independent variable is
represented by the values of the Grubel and Lloyd regional indices for 2000, and the dependent
variable is the dynamic of these indices in 2010 compared to 2000 (2000 = 100%).
Figure 2 - Correlogram of the Grubel and Lloyd regional indices for 2000 and their dynamic in
2010 compared to 2000; the test report of the regression equation in SPSS
Source: own processing of the data offered by the INS (National Institute of Statistics)
According to figure 2, there is an interconnection between the two indices, the parabolic
connection being a strong one – we must mention the fact that this regression equation explains the
connection between the indices with a probability of only approximately 80% - (the degree of
regional specialization determines its dynamic in proportion of 49,3%). In other words, as the
degree of intra-industry specialization for that specific region in 2000 increases, its dynamic during
the period of time subjected to the analysis increases up to a certain value of specialization and
decreases when the specialization becomes higher. Consequently, on regional level, there is a
convergence as well as a divergence of the degree of intra-industry specialization; the lower the
degree of specialization, the higher the divergence of regional specialization, and the other way
round – as the regional specialization becomes higher, the regions converge towards a certain
degree of specialization.
y = -0,001x2 + 0,096x - 1,894
R2 = 0,493
0,80
0,85
0,90
0,95
1,00
1,05
1,10
1,15
1,20
1,25
1,30
45,0 50,0 55,0 60,0 65,0 70,0 75,0 80,0 85,0

CCEESS WWoorrkkiinngg PPaappeerrss,, IIVV,, ((22)),, 22001122
244
2. ASSESSMENT OF THE STABILITY IN TIME OF THE SPECIALIZATION
PROCESSES
The assessment of the stability in time of the comparative advantages in the intra-industry
specialization processes (Alessandrini and Enowbi, 2008, p. 9) requires a regression equation in
which the independent variable is represented by the values of the Lafay index registered at the
beginning of the period analyzed (2000), and the dependent variable is represented by the values of
the same index at the end of the period of time subjected to the analysis (2010).
The regression equation is as follows:
LF2010= α + β LF2000+ ε
Where: LF2010 and LF2000 = the Lafay indices for 2010 and 2000 respectively
α and β = parameters of the linear regression equation
ε = residual error
The interpretation of the results of the regression analysis according to the regression
parameter (β) can be done as follows (Zaghini, 2003, p. 16):
- if β equals 1, then the intra-industry specialization processes have not suffered
modifications on regional level in the period of time subjected to the analysis;
- if β is higher than 1 then, in that particular region, the degree of intra-industry
specialization has increased or decreased respectively for those products for which there was
already an advantage or a disadvantage respectively; consequently, there is a process of regional
divergence of the specialization;
- if β is between 0 and 1, it means that on average, the intra-industry specialization have
remained the same, as there were increases for the products with small indices and decreases for the
products with high values, thus a process of regional convergence of specialization taking place;
- if β is lower than zero – the intra-industry specialization processes have reversed
The analysis of the regression parameter alone is not enough to establish exactly if the
changes in the structure of the comparative advantages/disadvantages also determine the
modification of the degree of intra-industry specialization. In fact, the regression parameter tells us

CCEESS WWoorrkkiinngg PPaappeerrss,, IIVV,, ((22)),, 22001122
245
what happens on average, and does not offer us clear information concerning the modification
taking place in the dispersion of the distribution of comparative advantages existing in the intra-
industry trade.
In order to find out such information, we must take into consideration the following equation:
Where:
-VAR(LF2010) and VAR(LF2000) = the dispersion of the independent and the dependent variables
-R2 = the coefficient of determination (the square of the correlation coefficient) of the regression
The interpretation of the results can be done from two points of view, as follows:
- From the point of view of the correlation coefficient (R) of the regression equation:
o If the values are high and tend to 1 – there has been no modification of the
relative positions of the products
o If the values are low and tend to 0 – there have been important modifications in
the structure of the distribution, so that the mobility of the structure is high
- From the point of view of thee connection between the regression parameters (β) and
the correlation coefficient (R):
o If they are equal (β=R) – the dispersion of the distribution remains unchanged
o If the regression parameter is higher than the correlation coefficient (β>R) – the
dispersion increases, which means that the intra-industry specialization might be higher
o If the regression parameter is lower than the correlation coefficient (β<R) – the
dispersion decreases; consequently, the intra-industry specialization might be lower
„The regression effect” (given by β) and „the mobility effect” (given by 1-R) give us
information concerning the modifications in the distribution of the comparative advantage for the
intra-industry trade during a certain period of time. Using these econometric tools for the Lafay
indices calculated on national and regional level in 2000 and 2010, we achieved the graphical
representations presented in figures 3 and 4.
On national level, the intra-industry specialization processes remained the same on average
in the period of time 2000-2010, as the regression parameter is between 0 and 1 (β=0,34) [figure 3].
In addition, the value close to zero of the parameter of the regression equation and the average value
of the correlation coefficient (R=0,53), indicate the fact that there were, however, significant
changes in the structure of the distribution of comparative advantages for the intra-industry trade.
2
2
2000
2010
)(
)(
RLFVAR
LFVAR

CCEESS WWoorrkkiinngg PPaappeerrss,, IIVV,, ((22)),, 22001122
246
Figure 3 - Correlogram of the Lafay indices in Romania on each section of the Combined
register in 2000 and 2010; the test report of the regression equation in SPSS
Source: own processing of the data offered by the INS (National Institute of Statistics)
Due to the fact that the parameter of the regression equation is lower than the correlation
coefficient, we can state that in Romania there are significant changes in the structure of the
distribution of the comparative advantages, even though on the whole there is only a slight
decrease of the intra-industry specialization, as the effect of mobility of the structure compensates
the effect of regression. It means that we registered an intra-industry specialization in the sectors in
which initially there was a low specialization, while the specialization decreased in the sectors
which were initially specialized.
Figure 4 - Correlogram of the Lafay indices of regional specialization on sections in the C R for
2000 and 2010
The North-West Region
The Central Region
y = 0,3384x - 0,0363
R2 = 0,2822
-8,0
-6,0
-4,0
-2,0
0,0
2,0
4,0
6,0
-6,0
-5,0
-4,0
-3,0
-2,0
-1,0
0,0
1,0
2,0
3,0
4,0
5,0
6,0
y = 0,0721x - 0,167
R2 = 0,0234
-8,0
-6,0
-4,0
-2,0
0,0
2,0
4,0
6,0
-7,0
-6,0
-5,0
-4,0
-3,0
-2,0
-1,0
0,0
1,0
2,0
3,0
4,0
5,0
6,0
7,0
8,0
9,0
y = 0,2495x - 0,0589
R2 = 0,2275
-8,0
-6,0
-4,0
-2,0
0,0
2,0
4,0
6,0
-15
,0
-14
,0
-13
,0
-12
,0
-11
,0
-10
,0
-9,0
-8,0
-7,0
-6,0
-5,0
-4,0
-3,0
-2,0
-1,0
0,0
1,0
2,0
3,0
4,0
5,0
6,0

CCEESS WWoorrkkiinngg PPaappeerrss,, IIVV,, ((22)),, 22001122
247
The North-East Region
The South-East Region
South Muntenia Region
Bucharest- Ilfov Region
South – West Oltenia Region
The West Region
Source: own processing of the data offered by the INS (National Institute of Statistics)
y = 0,7728x + 0,0605
R2 = 0,7833
-8,0
-6,0
-4,0
-2,0
0,0
2,0
4,0
6,0
-6,0
-5,0
-4,0
-3,0
-2,0
-1,0
0,0
1,0
2,0
3,0
4,0
5,0
y = 1,0684x + 0,0063
R2 = 0,8974
-8,0
-6,0
-4,0
-2,0
0,0
2,0
4,0
6,0
-12
,0
-11
,0
-10
,0
-9,0
-8,0
-7,0
-6,0
-5,0
-4,0
-3,0
-2,0
-1,0
0,0
1,0
2,0
3,0
4,0
5,0
6,0
7,0
8,0
9,0
10,0
11,0
12,0
13,0
y = -0,3799x - 0,0564
R2 = 0,0243
-8,0
-6,0
-4,0
-2,0
0,0
2,0
4,0
6,0
-5,0
-4,0
-3,0
-2,0
-1,0
0,0
1,0
2,0
3,0
4,0
y = 0,2126x + 0,0193
R2 = 0,1514
-8,0
-6,0
-4,0
-2,0
0,0
2,0
4,0
6,0
-8,0
-7,0
-6,0
-5,0
-4,0
-3,0
-2,0
-1,0
0,0
1,0
2,0
3,0
4,0
5,0
6,0
7,0
y = 0,6227x + 0,006
R2 = 0,8767
-8,0
-6,0
-4,0
-2,0
0,0
2,0
4,0
6,0
-10,0
-9,0
-8,0
-7,0
-6,0
-5,0
-4,0
-3,0
-2,0
-1,0
0,0
1,0
2,0
3,0
4,0
5,0
6,0
7,0
8,0
9,0
10,0
11,0
12,0
13,0
14,0
15,0
y = 0,3256x - 0,1169
R2 = 0,0997
-8,0
-6,0
-4,0
-2,0
0,0
2,0
4,0
6,0
-3,0
-2,0
-1,0
0,0
1,0
2,0
3,0
4,0
5,0
6,0
7,0

CCEESS WWoorrkkiinngg PPaappeerrss,, IIVV,, ((22)),, 22001122
248
Figure 5 - The report in SPSS for the testing of the regression equations in figure 4
The Nord – Vest Region
The Central Region
The North – East Region
The South – East Region
South Muntenia Region
Bucharest – Ilfov Region

CCEESS WWoorrkkiinngg PPaappeerrss,, IIVV,, ((22)),, 22001122
249
South – West Oltenia Region
The West Region
Source: own processing of the data offered by the INS (National Institute of Statistics)
In most regions, the intra-industry specialization processes remained mainly the same in the
period of time 2000-2010, as the regression parameter is between 0 and 1, registering an increase of
the intra-industry specialization processes only in the South-East, and an inversion of them in South
Muntenia [Figure 4].
The low values of the correlation coefficient in most regions also indicate the fact that there
were, however, significant changes in the structure of the distribution of comparative advantages
for the intra-industry trade (except for the North-East, South-East and South-West regions, where
the correlation coefficient has high values and consequently, in these regions there were no
significant modifications in the structure of distribution).
Since in most regions the parameters of the regression equation are lower than the correlation
coefficient (except for the South-East, where they are high), we can state that in the regions of
Romania there were significant changes in the structure of the distribution of the comparative
advantages although, on the whole, there is only a slight decrease of the intra-industry
specialization.
This means that the regional economy has specialized in intra-industry trade with products
which were initially less specialized, and lost its specialization in the sectors which were initially
highly specialized.
CCEESS WWoorrkkiinngg PPaappeerrss,, IIVV,, ((22)),, 22001122
250
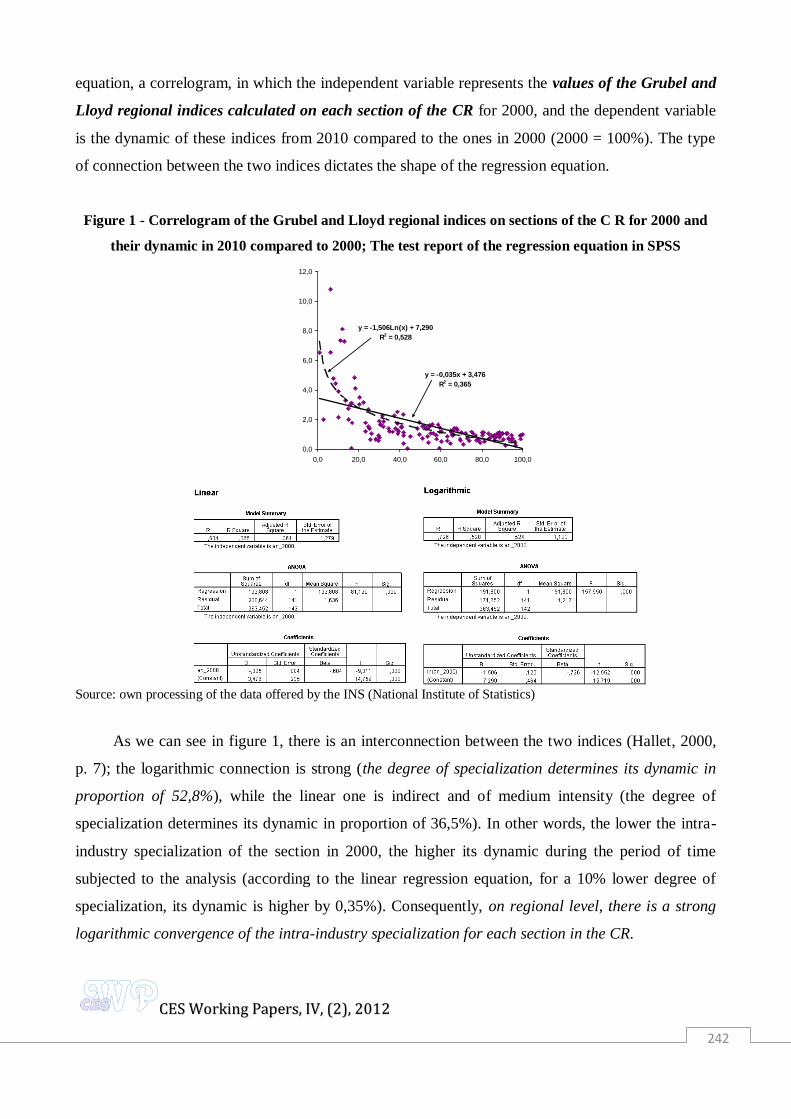
3. MOBILITY OF THE PROCESSES OF INTRA-INDUSTRY SPECIALIZATION
The statistic tools previously used (the linear regression between the Lafay indices for 2000
and 2010) are useful only in establishing certain coordinates for the modifications in the structure of
specialization, since the main disadvantage of the regression is that it offers information on the
average modifications in the structure of the distribution of comparative advantages in the intra-
industry trade.
Consequently, the research was continued through the analysis by means of the Markov
chains, which offers a comprehensive view on the mobility of the structure of intra-industry
specialization on different products. The starting point is the transition possibility matrix (Quah,
1996, p. 8). It required, first of all, the classification of the sections in the C R on 5 categories
(according to the values of the quintiles – the classification of the series into 5 equal parts - the
Lafay indices calculated on each section), as follows:
- sections with a low degree of specialization (Lafay indices between minimum and Q1)
- sections with a medium-low degree of specialization (Lafay indices between Q1 – Q2)
- sections with a medium degree of specialization (Lafay indices between Q2– Q3)
- sections with a medium-high degree of specialization (Lafay indices between Q3– Q4)
- sections with a high degree of specialization (Lafay indices between Q4– Q5)
In order to observe as well as possible the dynamic of the processes of specialization, we
preferred to build up two matrices – one to follow the evolution between 2000 and 2005, and
another one which should include the 10 years of transition (between 2000 and 2010). After
registering the three series of data (the values of the Lafay indices for the 19 sections from 2000,
2005 and 2010) into 5 intervals (the upper limit was included into the interval), the sections were
classified so that 4 sections were included into each of the categories of low, medium-low, medium-
high and high specialization and 3 sections in the medium specialization category.
In the probability matrix, of 5 over 5, we registered in each box the probability for a section
which was included into a certain category of intra-industry specialization in 2000, to make the
transition towards another category of specialization in 2005 and 2010 respectively. For example,
in the table included in figure 6, the values on the first line of the matrix indicate the fact that in
Romania the probability for a section with a low degree of intra-industry specialization in 2000 to
have the same degree of specialization in 2005 is of 75%, while the probability for the intra-
industry specialization to increase thus moving the section into the medium-low category is of 25%.
CCEESS WWoorrkkiinngg PPaappeerrss,, IIVV,, ((22)),, 22001122
251
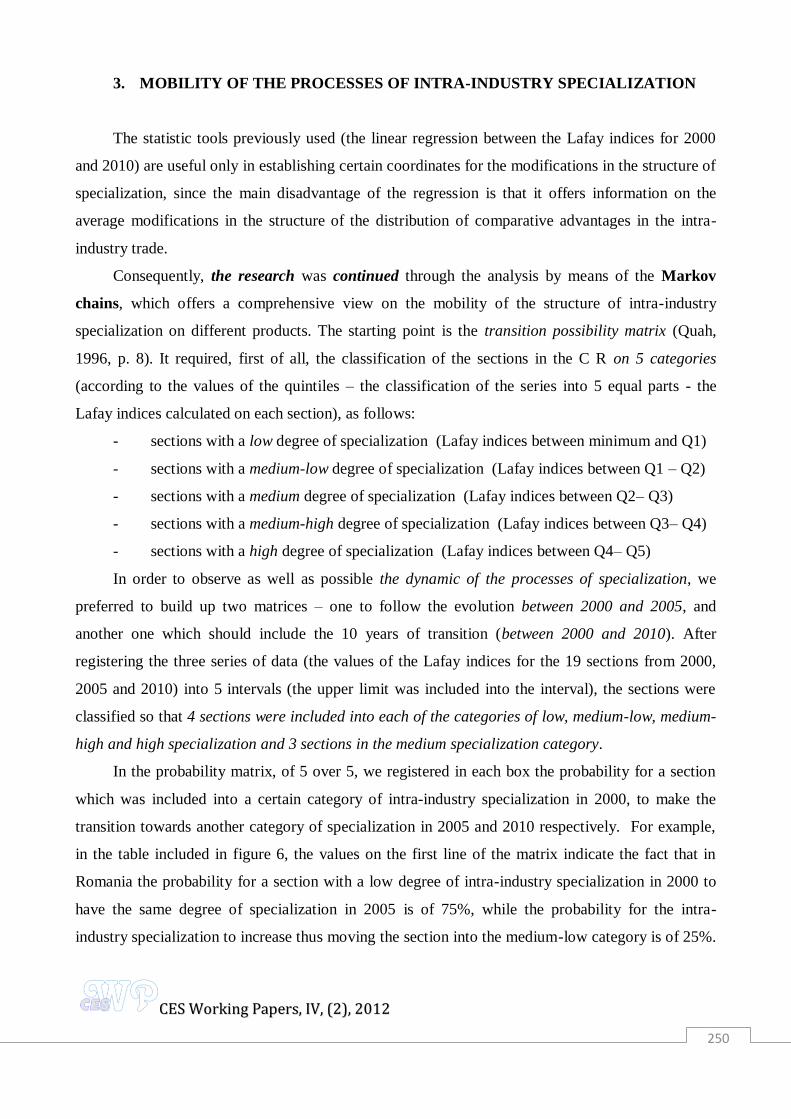
In the same table is calculated the value of the ergodic (stationary) distribution, as well as the value
towards which the process of intra-industry specialization tends in case the evolution stays the
same.
Figure 6 - The transition probability matrix for the processes of intra-industry
specialization in Romania for the period of time 2000-2005 and 2000-2010
Romania – transition probability matrix
Source: own processing of the data offered by the INS (National Institute of Statistics)
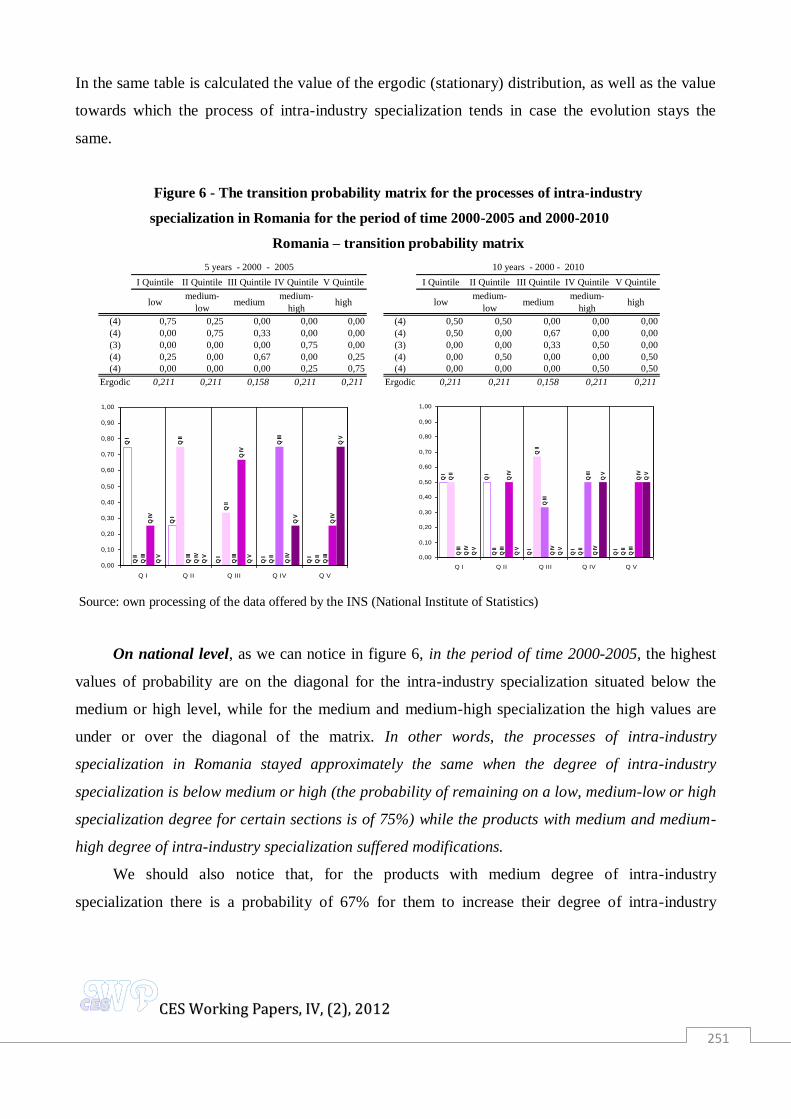
On national level, as we can notice in figure 6, in the period of time 2000-2005, the highest
values of probability are on the diagonal for the intra-industry specialization situated below the
medium or high level, while for the medium and medium-high specialization the high values are
under or over the diagonal of the matrix. In other words, the processes of intra-industry
specialization in Romania stayed approximately the same when the degree of intra-industry
specialization is below medium or high (the probability of remaining on a low, medium-low or high
specialization degree for certain sections is of 75%) while the products with medium and medium-
high degree of intra-industry specialization suffered modifications.
We should also notice that, for the products with medium degree of intra-industry
specialization there is a probability of 67% for them to increase their degree of intra-industry
I Quintile II Quintile III Quintile IV Quintile V Quintile I Quintile II Quintile III Quintile IV Quintile V Quintile
lowmedium-
lowmedium
medium-
highhigh low
medium-
lowmedium
medium-
highhigh
(4) 0,75 0,25 0,00 0,00 0,00 (4) 0,50 0,50 0,00 0,00 0,00
(4) 0,00 0,75 0,33 0,00 0,00 (4) 0,50 0,00 0,67 0,00 0,00
(3) 0,00 0,00 0,00 0,75 0,00 (3) 0,00 0,00 0,33 0,50 0,00
(4) 0,25 0,00 0,67 0,00 0,25 (4) 0,00 0,50 0,00 0,00 0,50
(4) 0,00 0,00 0,00 0,25 0,75 (4) 0,00 0,00 0,00 0,50 0,50
Ergodic 0,211 0,211 0,158 0,211 0,211 Ergodic 0,211 0,211 0,158 0,211 0,211
5 years - 2000 - 2005 10 years - 2000 - 2010
Q I
Q I
Q I
Q I
Q I
Q II
Q II
Q II
Q II
Q II
Q II
I
Q II
I
Q II
I
Q II
I
Q II
I
Q IV
Q IV
Q IV
Q IV
Q IV
Q V
Q V
Q V
Q V
Q V
0,00
0,10
0,20
0,30
0,40
0,50
0,60
0,70
0,80
0,90
1,00
Q I Q II Q III Q IV Q V
Q I
Q I
Q I
Q I
Q I
Q II
Q II
Q II
Q II
Q II
Q II
I
Q II
I
Q II
I
Q II
I
Q II
I
Q IV
Q IV
Q IV
Q IV
Q IV
Q V
Q V
Q V
Q V
Q V
0,00
0,10
0,20
0,30
0,40
0,50
0,60
0,70
0,80
0,90
1,00
Q I Q II Q III Q IV Q V
CCEESS WWoorrkkiinngg PPaappeerrss,, IIVV,, ((22)),, 22001122
252
specialization, while the products with medium-high degree of specialization tend to decrease their
degree of intra-industry specialization with a probability of 75%.
The situation is different in the period of time 2000-2010. Compared to 2000-2005, the
highest values are no longer registered on the diagonal of the matrix; consequently, in the Romanian
economy there is a high mobility of the distribution of the Lafay index on sections. Values of 50%
can be seen under as well as over the diagonal, which means that, during the last 10 years on
national level, comparative advantages have been gained in the intra-industry trade with products
in which we used to be less specialized while advantages have been lost for the products in which
we used to be specialized.
In order to make it easier to compare the mobility of the structure on regional level, we
calculated two mobility indexes (M1 and M2) (Zaghini, 2003, p. 26) which quantify the degree of
mobility for the whole Lafay distribution on sections. M1 shows the amplitude relative to the terms
on the diagonal, the trace function of the matrix, while M2 refers to the index it determines.
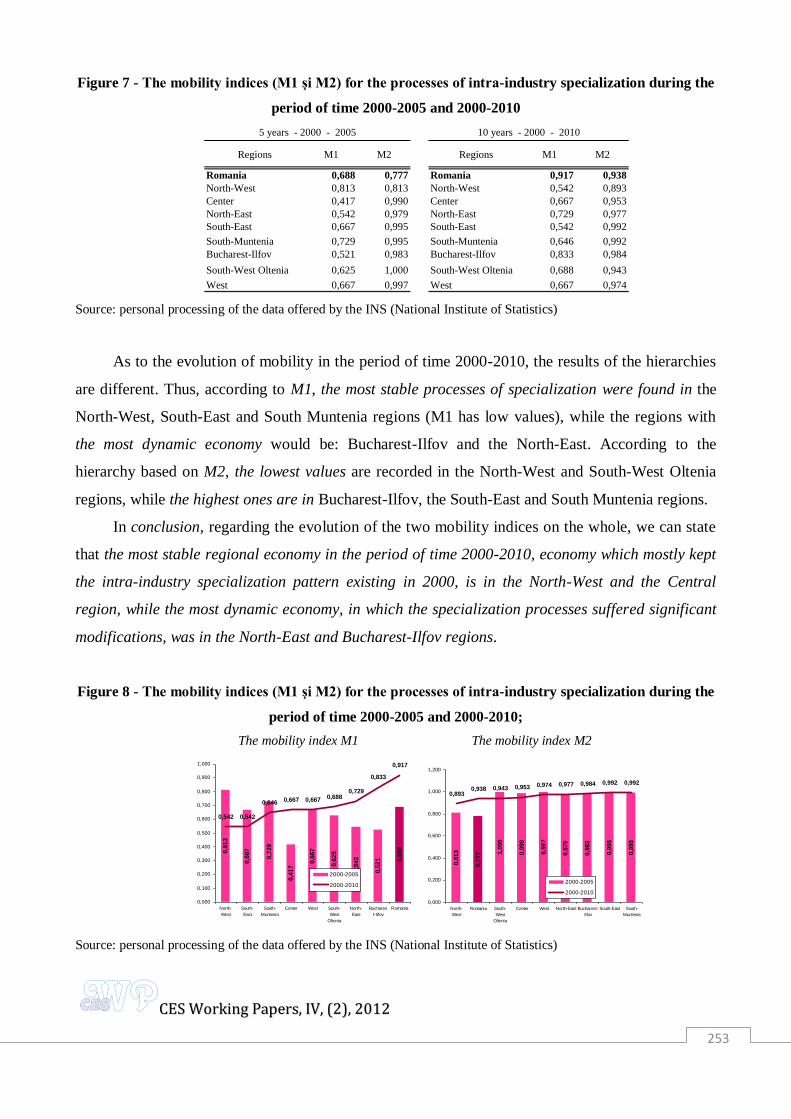
According to figure 7, there are slight differences in the classification of the regions between the
mobility indexes M1 and M2 for the period of time 2000-2005. Thus, from the point of view of M1,
the most stable processes of intra-industry specialization would be in the Central, Bucharest-Ilfov
and the North-East regions (M1 has low values), while the regions with the most dynamic economy
would be: North-West and South-Muntenia. As to the classification according to M2, the lowest
values are in the North-West and North-East regions, while the highest values are in South-West
Oltenia and in the West.
In conclusion, when regarding the evolution of the two mobility indices on the whole, we can
state that the most stable regional economy in the period of time 2000-2005, economy which mostly
kept its intra-industry specialization pattern existing in 2000, is in North-West and North-East,
while the most dynamic economy, where the specialization processes suffered significant
modifications, was in South-West Oltenia and in the West.
CCEESS WWoorrkkiinngg PPaappeerrss,, IIVV,, ((22)),, 22001122
253
Figure 7 - The mobility indices (M1 şi M2) for the processes of intra-industry specialization during the
period of time 2000-2005 and 2000-2010
Source: personal processing of the data offered by the INS (National Institute of Statistics)
As to the evolution of mobility in the period of time 2000-2010, the results of the hierarchies
are different. Thus, according to M1, the most stable processes of specialization were found in the
North-West, South-East and South Muntenia regions (M1 has low values), while the regions with
the most dynamic economy would be: Bucharest-Ilfov and the North-East. According to the
hierarchy based on M2, the lowest values are recorded in the North-West and South-West Oltenia
regions, while the highest ones are in Bucharest-Ilfov, the South-East and South Muntenia regions.
In conclusion, regarding the evolution of the two mobility indices on the whole, we can state
that the most stable regional economy in the period of time 2000-2010, economy which mostly kept
the intra-industry specialization pattern existing in 2000, is in the North-West and the Central
region, while the most dynamic economy, in which the specialization processes suffered significant
modifications, was in the North-East and Bucharest-Ilfov regions.
Figure 8 - The mobility indices (M1 şi M2) for the processes of intra-industry specialization during the
period of time 2000-2005 and 2000-2010;
The mobility index M1 The mobility index M2
Source: personal processing of the data offered by the INS (National Institute of Statistics)
Regions M1 M2 Regions M1 M2
Romania 0,688 0,777 Romania 0,917 0,938
North-West 0,813 0,813 North-West 0,542 0,893
Center 0,417 0,990 Center 0,667 0,953
North-East 0,542 0,979 North-East 0,729 0,977
South-East 0,667 0,995 South-East 0,542 0,992
South-Muntenia 0,729 0,995 South-Muntenia 0,646 0,992
Bucharest-Ilfov 0,521 0,983 Bucharest-Ilfov 0,833 0,984
South-West Oltenia 0,625 1,000 South-West Oltenia 0,688 0,943
West 0,667 0,997 West 0,667 0,974
5 years - 2000 - 2005 10 years - 2000 - 2010
0,8
13
0,6
67
0,7
29
0,4
17
0,6
67
0,6
25
0,5
42
0,5
21 0,6
88
0,542 0,542
0,646 0,667 0,667 0,6880,729
0,833
0,917
0,000
0,100
0,200
0,300
0,400
0,500
0,600
0,700
0,800
0,900
1,000
North-
West
South-
East
South-
Muntenia
Center West South-
West
Oltenia
North-
East
Buchares
t-Ilfov
Romania
2000-2005
2000-2010
0,8
13
0,7
77 1
,000
0,9
90
0,9
97
0,9
79
0,9
83
0,9
95
0,9
95
0,8930,938 0,943 0,953 0,974 0,977 0,984 0,992 0,992
0,000
0,200
0,400
0,600
0,800
1,000
1,200
North-
West
Romania South-
West
Oltenia
Center West North-East Bucharest-
Ilfov
South-East South-
Muntenia
2000-2005
2000-2010
CCEESS WWoorrkkiinngg PPaappeerrss,, IIVV,, ((22)),, 22001122
254
CONCLUSIONS
In most regions, on average, the processes of intra-industry specialization did not change;
however, the degree of specialization decreased slightly due to the high degree of despecialization
in sectors in which the regions used to be specialized at the beginning of the period subjected to the
analysis, decrease which could no longer be compensated by the increase of specialization in other
sectors. Consequently, in the period of time 2000-2010, comparative advantages were gained in the
case of products in which we were less specialized, while advantages were lost in the case of
products in which we were specialized, the mobility in the structures of their distribution being very
high. The exception is the South-East region where the degree of specialization increased due to the
increase of specialization for those products in which they were already specialized.
REFERENCES
Alessandrini, M., Enowbi, B.M. (2008) The trade specialization of Sane: evidence from
manufacturing industries, Discussion Paper Centre for Financial and Management Studies,
No. 91.
Dagenais, M.G., Muet, P.A. (1992) (eds) International Trade Modeling, Chapman & Hill, London.
Grubel, H., Lloyd, P. (1975) Intra-industry trade: the theory and measurement of the international
trade in differentiated products, London, Macmillan.
Hallet, M. (2000) Regional specialization and concentration in EU, Economic papers -European
Commision, No.141.
Lafay, G. (1992) The measurement of revealed comparative advantages, in Dagenais, M.G., Muet,
P.A. (eds) International Trade Modeling, Chapman & Hill, London.
Quah, D. (1993) Empirical cross-section dynamics in economic growth, European Economic
Review, no. 37.
Quah, D. (1996) Empirics for economics growth and convergence, European Economic Review,
nr. 40.
Pecican, E.S. (2009) Econometria pentru economiști. Teorie și aplicații, Ediția- III, Editura
Economică.

CCEESS WWoorrkkiinngg PPaappeerrss,, IIVV,, ((22)),, 22001122
255
Persson, J. (1994) Convergence in per capita income and migration across the Swedish counties
1906-1990, Institute for International Economic Stockholm University - Series Seminar
Papers, nr. 601.
Redding, S. (2002) Specialization dynamics, Journal of International Economics, Vol. 58, No. 1.
Zaghini, A. (2003) Trade advantages and specialisation dynamics in acceding countries, European
Central Bank, Working Paper Series, nr. 249.