Embed Size (px)
Citation preview
Hypertensive Disorders of Pregnancy and Maternal CardiovascularDisease Risk Factor DevelopmentAn Observational Cohort StudyJennifer J. Stuart, ScD; Lauren J. Tanz, ScD; Stacey A. Missmer, ScD; Eric B. Rimm, ScD; Donna Spiegelman, ScD;Tamarra M. James-Todd, PhD; and Janet W. Rich-Edwards, ScD
Background: Women with a history of hypertensive disordersof pregnancy (HDP) are nearly twice as likely to develop cardio-vascular disease (CVD) as those who are normotensive duringpregnancy. However, the emergence of CVD risk factors afterHDP is less well-understood.
Objective: To identify associations between HDP and maternalCVD risk factors and chart the trajectory of risk factor develop-ment after pregnancy.
Design: Observational cohort study.
Setting: United States.
Participants: 58 671 parous NHS II (Nurses' Health Study II) par-ticipants who did not have CVD or risk factors of interest atbaseline.
Measurements: Women were followed for self-reported physi-cian diagnosis of chronic hypertension and hypercholesterol-emia and confirmed type 2 diabetes mellitus (T2DM) from theirfirst birth through 2013; mean follow-up ranged from 25 to 32years across these end points. Multivariable Cox proportionalhazards models estimated hazard ratios (HRs) and 95% CIs, withadjustment for prepregnancy confounders.
Results: Compared with women who were normotensive dur-ing pregnancy, those with gestational hypertension (2.9%) orpreeclampsia (6.3%) in their first pregnancy had increased ratesof chronic hypertension (HRs, 2.8 [95% CI, 2.6 to 3.0] and 2.2 [CI,2.1 to 2.3], respectively), T2DM (HRs, 1.7 [CI, 1.4 to 1.9] and 1.8[CI, 1.6 to 1.9], respectively), and hypercholesterolemia (HRs, 1.4[CI, 1.3 to 1.5] and 1.3 [CI, 1.3 to 1.4], respectively). Althoughthese women were more likely to develop CVD risk factorsthroughout follow-up, the relative risk for chronic hypertensionwas strongest within 5 years after their first birth. Recurrence ofHDP further elevated risks for all end points.
Limitation: Participants self-reported HDP.
Conclusion: Women with HDP in their first pregnancy had in-creased rates of chronic hypertension, T2DM, and hypercholes-terolemia that persisted for several decades. These women maybenefit from lifestyle intervention and early screening to reducelifetime risk for CVD.
Primary Funding Source: National Institutes of Health.
Ann Intern Med. doi:10.7326/M17-2740 Annals.orgFor author affiliations, see end of text.This article was published at Annals.org on 3 July 2018.
During reproductive life, approximately 15% of par-ous women have at least 1 pregnancy complicated
by a hypertensive disorder, such as gestational hyper-tension or preeclampsia (1). Growing evidence sug-gests that these women are nearly twice as likely asthose who are normotensive during pregnancy to de-velop cardiovascular disease (CVD) (2–4). Hypertensivedisorders of pregnancy (HDP) may reveal subclinicalCVD risk under the physiologic “stress test” of preg-nancy, providing early insight into CVD risk that mightbe leveraged to identify high-risk women for targetedprevention from an early age (1, 5). Although the 2011American Heart Association guidelines recommendthat clinicians evaluate CVD risk by screening for a his-tory of HDP, few data exist on which risk factors shouldbe screened for as well as the frequency and timing ofscreening (6).
Hypertensive disorders of pregnancy have beenconsistently linked to future chronic hypertension de-spite the fact that blood pressure returns to normal dur-ing the postpartum period (2, 7–12). Women with a his-tory of HDP have higher risks for impaired glucosetolerance and insulin resistance and a 3- to 4-fold in-creased risk for type 2 diabetes mellitus (T2DM) (9, 13–22). Those with a history of preeclampsia also havehigher levels of total and low-density lipoprotein cho-lesterol and triglycerides; however, these differences
are not consistently statistically significant (16, 18–21,23–25). Many previous studies were limited by smallsample size; short follow-up; or incomplete adjustmentfor potential confounders, such as prepregnancy smok-ing status, body mass index (BMI), and family history.Further, although these associations have been ob-served over variable lengths of follow-up, little is knownabout the specific timing of risk factor development,which is critical to inform screening guidelines.
We examined associations of gestational hyperten-sion and preeclampsia with development of chronichypertension, T2DM, and hypercholesterolemia. Theseassociations were evaluated in a large longitudinal co-hort study with up to 50 years of follow-up from first birth.
METHODSCohort Description and Selection
The NHS II (Nurses' Health Study II) is a prospectivecohort study of 116 429 female U.S. registered nurseswho were enrolled at age 25 to 42 years in 1989. Par-
See also:
Editorial comment . . . . . . . . . . . . . . . . . . . . . . . . . . . 1Summary for Patients . . . . . . . . . . . . . . . . . . . . . . . . . 2
Annals of Internal Medicine ORIGINAL RESEARCH
Annals.org Annals of Internal Medicine 1
Downloaded From: http://annals.org/ by Aland Bisso Andrade on 07/03/2018
ticipants are followed biennially via questionnaires,which collect information on lifestyle, health-related be-haviors, and incident disease.
Study SampleAnalyses were restricted to participants who re-
sponded to the 2009 questionnaire (n = 76 840), whichallowed pregnancies to be dated and linked to specificcomplications. We excluded women who were nullipa-rous (n = 13 253), those who were missing a valid yearof first pregnancy (n = 12), those younger than 18 yearsor older than 45 years at their first birth (n = 846), andthose who were missing gestation length or had a valuethat was incompatible with the pregnancy outcome re-ported (n = 292). Women also were excluded if theyreported chronic hypertension, type 1 or 2 diabetes,hypercholesterolemia, myocardial infarction, or strokebefore their first pregnancy (n = 2470) or if they weremissing the date of diagnosis or reported diagnosis ofthese conditions before 1980 (which precluded datingof those events) (n = 1210). Finally, because unde-tected chronic hypertension before pregnancy may beincorrectly captured as incident chronic hypertensiondirectly after pregnancy, we excluded women who re-ported chronic hypertension within 1 year after their firstbirth (n = 86). This yielded an analytic sample of 58 671women. This analysis was approved by the InstitutionalReview Board at Brigham and Women's Hospital.
Hypertensive Disorders of PregnancyIn 2009, women retrospectively reported their
complete pregnancy history. Hypertensive disorders ofpregnancy were self-reported as “pregnancy-relatedhigh blood pressure” (gestational hypertension) or“preeclampsia/toxemia.” The primary analysis focusedon the first pregnancy because this is when HDP pre-dominantly occurs (24).
To assess the validity of self-reported preeclamp-sia, we reviewed medical records of 598 women whoreported preeclampsia on biennial questionnaires from1991 to 2001 for provider report of preeclampsia orevidence of gestational hypertension (new-onset highblood pressure [systolic blood pressure ≥140 mm Hgor diastolic blood pressure ≥90 mm Hg] after 20 weeks'gestation) and proteinuria (protein excretion ≥300 mgper 24 hours, protein–creatinine ratio ≥0.3, or dipstickreading ≥1+) (26). There were 411 cases of preeclamp-sia confirmed by medical records, for a positive predic-tive value of 69%. Given the complexity of validatingpreeclampsia (confirming normotension before 20 weeksand elevated blood pressures and proteinuria after 20weeks), several components of the medical record arerequired. We excluded 136 medical records with insuf-ficient information available for validation (for example,those that were missing laboratory data or prenataland/or labor and delivery records), resulting in a posi-tive predictive value of 89%. Having complete medicalrecord information for all 598 women would likely haveresulted in a positive predictive value between 69%and 89%.
Recurrent HDP was analyzed in a secondary analy-sis with follow-up starting at age 40 years. This analysis
was restricted to 45 815 parous women who had notexperienced a CVD event or developed CVD risk fac-tors of interest by age 40 years and had no additionalpregnancies at this age or later.
CVD Risk FactorsRisk factors for CVD (chronic hypertension, T2DM,
and hypercholesterolemia) were self-reported on bien-nial questionnaires beginning in 1989. The 1989 ques-tionnaire retrospectively captured any physician diag-noses of “high blood pressure (excluding duringpregnancy),” “diabetes: not during pregnancy,” and“elevated cholesterol” and the year of diagnosis (“be-fore 1980,” “1980 to 1984,” or “1985 to present”).Women prospectively reported incident diagnoses ofCVD risk factors on biennial questionnaires beginningin 1991. The midpoint of each date range was assignedas the year of diagnosis for chronic hypertension andhypercholesterolemia; for T2DM, the year of diagnosiswas obtained via a supplemental questionnaire. Previ-ous validation of self-reported high blood pressure inNHS II indicated good agreement, with sensitivity of94% and specificity of 85% (27). Women who reporteda new diagnosis of diabetes received a supplementalquestionnaire to report diagnostic test results, symp-toms, and treatment. This information was used to clas-sify cases into categories proposed by the NationalDiabetes Data Group and the American Diabetes Asso-ciation (28–30). Information on self-reported use ofcholesterol-lowering medication has been collectedsince 1999. We defined hypercholesterolemia as self-report of hypercholesterolemia or cholesterol-loweringmedication use. Self-reported hypercholesterolemiawas validated in a similar cohort and showed a positivepredictive value of 86% and a negative predictive valueof 85% (31).
Lifestyle Factors and Medical HistoryIn 1989, participants reported height, current weight,
and weight at age 18 years. Participants updated theirweight on all biennial questionnaires. Body mass indexwas calculated from reported height and weight at age 18years and was updated every 2 years from 1989 to 2013.Body mass index was derived for ages at which weightwas not reported, with incorporation of data on weight atage 18 years; weights reported on each questionnaire;and somatograms at ages 20, 30, and 40 years (see theAppendix, available at Annals.org). A previous validationstudy in NHS II found high correlations between physicalexamination records and both recalled weight at age 18years (r = 0.87) and self-reported height (r = 0.94) (32).
Race/ethnicity, family history of chronic hypertension,and strenuous physical activity at ages 18 to 22 years werereported at baseline. History of smoking, alcohol con-sumption, and oral contraceptive use were also reportedin 1989 and updated during follow-up. Biennial question-naires after 1989 queried participants about family historyof diabetes, parental education, and diet. Food-frequencyquestionnaires were used to derive a dietary quality scorefrom the 2010 Alternative Healthy Eating Index (33). Self-reported physician diagnoses of myocardial infarctionand stroke were verified through medical record review.
ORIGINAL RESEARCH Hypertensive Disorders of Pregnancy and CVD Risk Factor Development
2 Annals of Internal Medicine Annals.org
Downloaded From: http://annals.org/ by Aland Bisso Andrade on 07/03/2018
Prepregnancy information was drawn from the biennialquestionnaire immediately before the first pregnancy. Be-cause most first births (85%) occurred before baseline,health-related behavior in high school and within varyingage ranges from 13 through 42 years that was retrospec-tively reported in 1989 was used to assign prepregnancyvalues for these women.
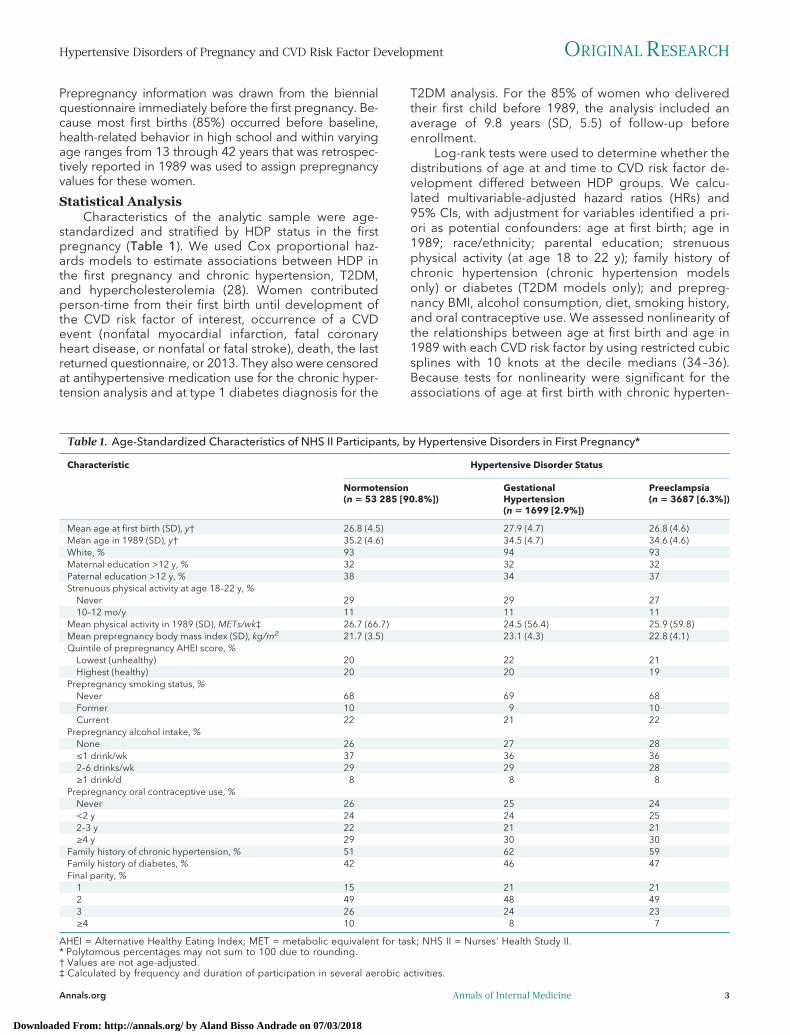
Statistical AnalysisCharacteristics of the analytic sample were age-
standardized and stratified by HDP status in the firstpregnancy (Table 1). We used Cox proportional haz-ards models to estimate associations between HDP inthe first pregnancy and chronic hypertension, T2DM,and hypercholesterolemia (28). Women contributedperson-time from their first birth until development ofthe CVD risk factor of interest, occurrence of a CVDevent (nonfatal myocardial infarction, fatal coronaryheart disease, or nonfatal or fatal stroke), death, the lastreturned questionnaire, or 2013. They also were censoredat antihypertensive medication use for the chronic hyper-tension analysis and at type 1 diabetes diagnosis for the
T2DM analysis. For the 85% of women who deliveredtheir first child before 1989, the analysis included anaverage of 9.8 years (SD, 5.5) of follow-up beforeenrollment.
Log-rank tests were used to determine whether thedistributions of age at and time to CVD risk factor de-velopment differed between HDP groups. We calcu-lated multivariable-adjusted hazard ratios (HRs) and95% CIs, with adjustment for variables identified a pri-ori as potential confounders: age at first birth; age in1989; race/ethnicity; parental education; strenuousphysical activity (at age 18 to 22 y); family history ofchronic hypertension (chronic hypertension modelsonly) or diabetes (T2DM models only); and prepreg-nancy BMI, alcohol consumption, diet, smoking history,and oral contraceptive use. We assessed nonlinearity ofthe relationships between age at first birth and age in1989 with each CVD risk factor by using restricted cubicsplines with 10 knots at the decile medians (34–36).Because tests for nonlinearity were significant for theassociations of age at first birth with chronic hyperten-
Table 1. Age-Standardized Characteristics of NHS II Participants, by Hypertensive Disorders in First Pregnancy*
Characteristic Hypertensive Disorder Status
Normotension(n � 53 285 [90.8%])
GestationalHypertension(n � 1699 [2.9%])
Preeclampsia(n � 3687 [6.3%])
Mean age at first birth (SD), y† 26.8 (4.5) 27.9 (4.7) 26.8 (4.6)Mean age in 1989 (SD), y† 35.2 (4.6) 34.5 (4.7) 34.6 (4.6)White, % 93 94 93Maternal education >12 y, % 32 32 32Paternal education >12 y, % 38 34 37Strenuous physical activity at age 18–22 y, %
Never 29 29 2710–12 mo/y 11 11 11
Mean physical activity in 1989 (SD), METs/wk‡ 26.7 (66.7) 24.5 (56.4) 25.9 (59.8)Mean prepregnancy body mass index (SD), kg/m2 21.7 (3.5) 23.1 (4.3) 22.8 (4.1)Quintile of prepregnancy AHEI score, %
Lowest (unhealthy) 20 22 21Highest (healthy) 20 20 19
Prepregnancy smoking status, %Never 68 69 68Former 10 9 10Current 22 21 22
Prepregnancy alcohol intake, %None 26 27 28≤1 drink/wk 37 36 362–6 drinks/wk 29 29 28≥1 drink/d 8 8 8
Prepregnancy oral contraceptive use, %Never 26 25 24<2 y 24 24 252–3 y 22 21 21≥4 y 29 30 30
Family history of chronic hypertension, % 51 62 59Family history of diabetes, % 42 46 47Final parity, %
1 15 21 212 49 48 493 26 24 23≥4 10 8 7
AHEI = Alternative Healthy Eating Index; MET = metabolic equivalent for task; NHS II = Nurses' Health Study II.* Polytomous percentages may not sum to 100 due to rounding.† Values are not age-adjusted.‡ Calculated by frequency and duration of participation in several aerobic activities.
Hypertensive Disorders of Pregnancy and CVD Risk Factor Development ORIGINAL RESEARCH
Annals.org Annals of Internal Medicine 3
Downloaded From: http://annals.org/ by Aland Bisso Andrade on 07/03/2018
sion and T2DM and the association of age in 1989 withhypercholesterolemia (P < 0.001 for each), correspond-ing spline terms at 26 years for age at first birth and 28years for age in 1989 were included. To evaluate de-partures from the proportional hazards assumption, weused restricted cubic splines to examine the extent towhich the effect of HDP on CVD risk factors was modi-fied by the number of years since the first birth. Theproportional hazards assumption did not hold for anymodel in Table 2 (P < 0.001 for each test); therefore,HRs were also presented within 5-year intervals (Table3). We investigated the presence of effect modificationby preterm delivery (<37 weeks) by using a likelihoodratio test, comparing a model with multiplicative inter-action terms between gestational hypertension andpreterm delivery and between preeclampsia and pre-term delivery to a model without these terms.
Multivariable-adjusted cumulative incidence curvesfor each CVD risk factor by HDP status in the first preg-nancy were obtained using the Breslow estimator at themean and mode values of the continuous and categor-ical covariates, respectively. To address violation of theproportional hazards assumption, time-varying multipli-cative interaction terms between HDP status in the firstpregnancy and time since the first birth were included.All analyses were conducted using SAS, version 9.4(SAS Institute).
Role of the Funding SourceThe National Institutes of Health had no role in the
design, conduct, analysis, or reporting of the study.
RESULTSHDP in First Pregnancy and CVD Risk Factors
First births occurred between 1964 and 2008 at amean age of 26.8 years (SD, 4.6). A total of 5386women (9.2%) experienced HDP in their first pregnan-cy; 2.9% developed gestational hypertension, and 6.3%developed preeclampsia. Women with HDP in their firstpregnancy and those who were normotensive duringpregnancy generally had similar demographic and life-style characteristics (Table 1); however, women withHDP were more likely to have a family history of chronichypertension and had fewer children. By the end offollow-up in 2013 (Appendix), 33.3% of women had de-veloped chronic hypertension, 6.4% had developedT2DM, and 55.6% had developed hypercholesterolemia.
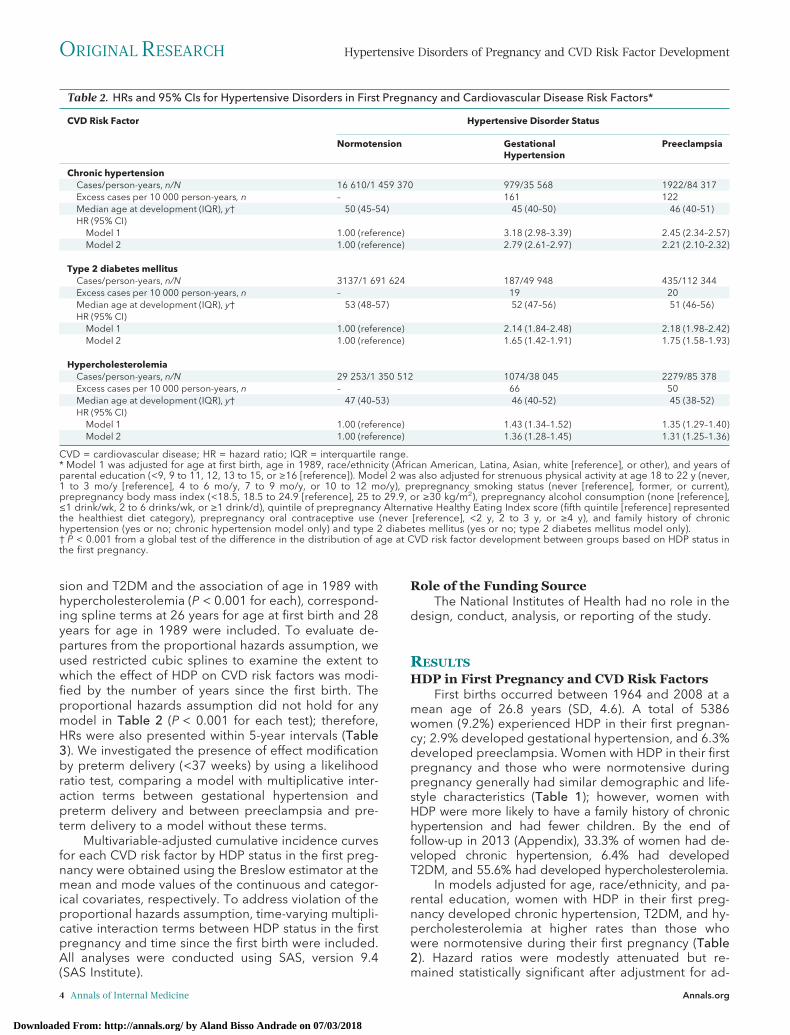
In models adjusted for age, race/ethnicity, and pa-rental education, women with HDP in their first preg-nancy developed chronic hypertension, T2DM, and hy-percholesterolemia at higher rates than those whowere normotensive during their first pregnancy (Table2). Hazard ratios were modestly attenuated but re-mained statistically significant after adjustment for ad-
Table 2. HRs and 95% CIs for Hypertensive Disorders in First Pregnancy and Cardiovascular Disease Risk Factors*
CVD Risk Factor Hypertensive Disorder Status
Normotension GestationalHypertension
Preeclampsia
Chronic hypertensionCases/person-years, n/N 16 610/1 459 370 979/35 568 1922/84 317Excess cases per 10 000 person-years, n – 161 122Median age at development (IQR), y† 50 (45–54) 45 (40–50) 46 (40–51)HR (95% CI)
Model 1 1.00 (reference) 3.18 (2.98–3.39) 2.45 (2.34–2.57)Model 2 1.00 (reference) 2.79 (2.61–2.97) 2.21 (2.10–2.32)
Type 2 diabetes mellitusCases/person-years, n/N 3137/1 691 624 187/49 948 435/112 344Excess cases per 10 000 person-years, n – 19 20Median age at development (IQR), y† 53 (48–57) 52 (47–56) 51 (46–56)HR (95% CI)
Model 1 1.00 (reference) 2.14 (1.84–2.48) 2.18 (1.98–2.42)Model 2 1.00 (reference) 1.65 (1.42–1.91) 1.75 (1.58–1.93)
HypercholesterolemiaCases/person-years, n/N 29 253/1 350 512 1074/38 045 2279/85 378Excess cases per 10 000 person-years, n – 66 50Median age at development (IQR), y† 47 (40–53) 46 (40–52) 45 (38–52)HR (95% CI)
Model 1 1.00 (reference) 1.43 (1.34–1.52) 1.35 (1.29–1.40)Model 2 1.00 (reference) 1.36 (1.28–1.45) 1.31 (1.25–1.36)
CVD = cardiovascular disease; HR = hazard ratio; IQR = interquartile range.* Model 1 was adjusted for age at first birth, age in 1989, race/ethnicity (African American, Latina, Asian, white [reference], or other), and years ofparental education (<9, 9 to 11, 12, 13 to 15, or ≥16 [reference]). Model 2 was also adjusted for strenuous physical activity at age 18 to 22 y (never,1 to 3 mo/y [reference], 4 to 6 mo/y, 7 to 9 mo/y, or 10 to 12 mo/y), prepregnancy smoking status (never [reference], former, or current),prepregnancy body mass index (<18.5, 18.5 to 24.9 [reference], 25 to 29.9, or ≥30 kg/m2), prepregnancy alcohol consumption (none [reference],≤1 drink/wk, 2 to 6 drinks/wk, or ≥1 drink/d), quintile of prepregnancy Alternative Healthy Eating Index score (fifth quintile [reference] representedthe healthiest diet category), prepregnancy oral contraceptive use (never [reference], <2 y, 2 to 3 y, or ≥4 y), and family history of chronichypertension (yes or no; chronic hypertension model only) and type 2 diabetes mellitus (yes or no; type 2 diabetes mellitus model only).† P < 0.001 from a global test of the difference in the distribution of age at CVD risk factor development between groups based on HDP status inthe first pregnancy.
ORIGINAL RESEARCH Hypertensive Disorders of Pregnancy and CVD Risk Factor Development
4 Annals of Internal Medicine Annals.org
Downloaded From: http://annals.org/ by Aland Bisso Andrade on 07/03/2018
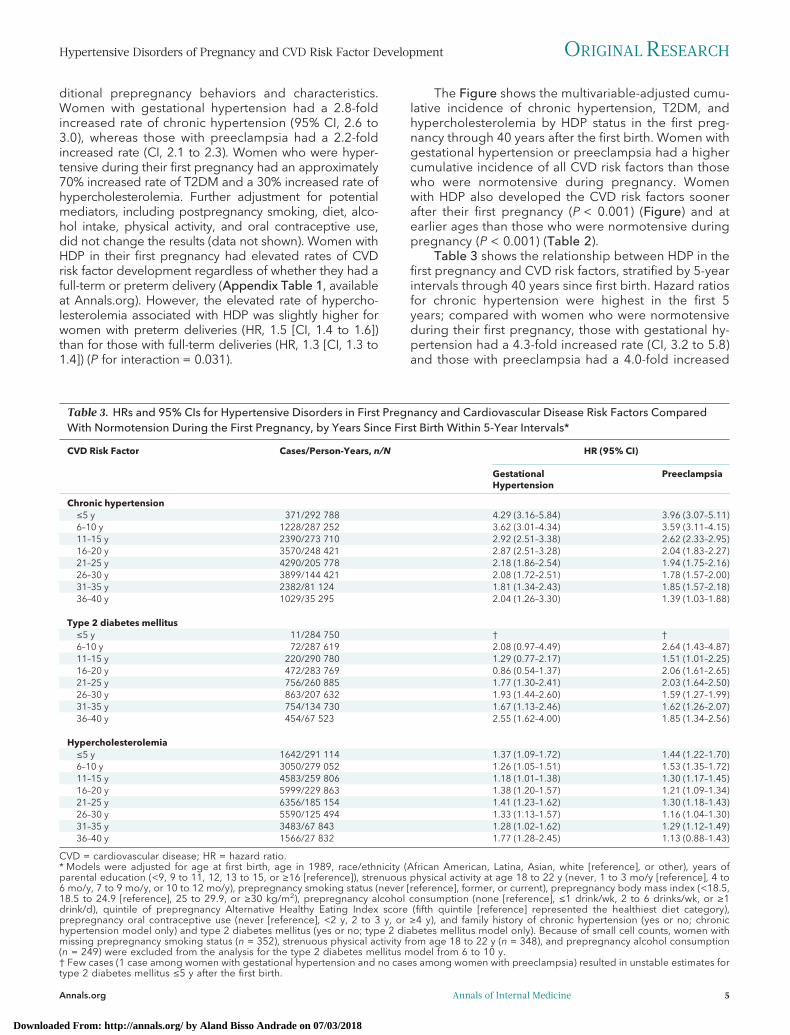
ditional prepregnancy behaviors and characteristics.Women with gestational hypertension had a 2.8-foldincreased rate of chronic hypertension (95% CI, 2.6 to3.0), whereas those with preeclampsia had a 2.2-foldincreased rate (CI, 2.1 to 2.3). Women who were hyper-tensive during their first pregnancy had an approximately70% increased rate of T2DM and a 30% increased rate ofhypercholesterolemia. Further adjustment for potentialmediators, including postpregnancy smoking, diet, alco-hol intake, physical activity, and oral contraceptive use,did not change the results (data not shown). Women withHDP in their first pregnancy had elevated rates of CVDrisk factor development regardless of whether they had afull-term or preterm delivery (Appendix Table 1, availableat Annals.org). However, the elevated rate of hypercho-lesterolemia associated with HDP was slightly higher forwomen with preterm deliveries (HR, 1.5 [CI, 1.4 to 1.6])than for those with full-term deliveries (HR, 1.3 [CI, 1.3 to1.4]) (P for interaction = 0.031).
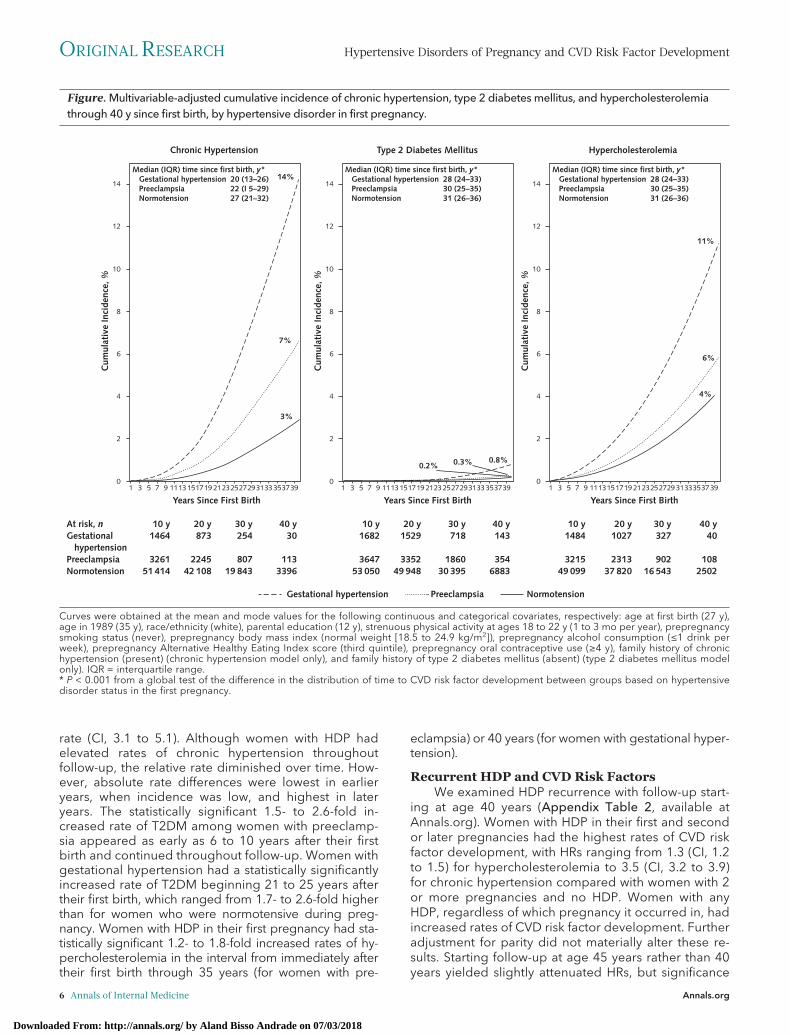
The Figure shows the multivariable-adjusted cumu-lative incidence of chronic hypertension, T2DM, andhypercholesterolemia by HDP status in the first preg-nancy through 40 years after the first birth. Women withgestational hypertension or preeclampsia had a highercumulative incidence of all CVD risk factors than thosewho were normotensive during pregnancy. Womenwith HDP also developed the CVD risk factors soonerafter their first pregnancy (P < 0.001) (Figure) and atearlier ages than those who were normotensive duringpregnancy (P < 0.001) (Table 2).
Table 3 shows the relationship between HDP in thefirst pregnancy and CVD risk factors, stratified by 5-yearintervals through 40 years since first birth. Hazard ratiosfor chronic hypertension were highest in the first 5years; compared with women who were normotensiveduring their first pregnancy, those with gestational hy-pertension had a 4.3-fold increased rate (CI, 3.2 to 5.8)and those with preeclampsia had a 4.0-fold increased
Table 3. HRs and 95% CIs for Hypertensive Disorders in First Pregnancy and Cardiovascular Disease Risk Factors ComparedWith Normotension During the First Pregnancy, by Years Since First Birth Within 5-Year Intervals*
CVD Risk Factor Cases/Person-Years, n/N HR (95% CI)
GestationalHypertension
Preeclampsia
Chronic hypertension≤5 y 371/292 788 4.29 (3.16–5.84) 3.96 (3.07–5.11)6–10 y 1228/287 252 3.62 (3.01–4.34) 3.59 (3.11–4.15)11–15 y 2390/273 710 2.92 (2.51–3.38) 2.62 (2.33–2.95)16–20 y 3570/248 421 2.87 (2.51–3.28) 2.04 (1.83–2.27)21–25 y 4290/205 778 2.18 (1.86–2.54) 1.94 (1.75–2.16)26–30 y 3899/144 421 2.08 (1.72–2.51) 1.78 (1.57–2.00)31–35 y 2382/81 124 1.81 (1.34–2.43) 1.85 (1.57–2.18)36–40 y 1029/35 295 2.04 (1.26–3.30) 1.39 (1.03–1.88)
Type 2 diabetes mellitus≤5 y 11/284 750 † †6–10 y 72/287 619 2.08 (0.97–4.49) 2.64 (1.43–4.87)11–15 y 220/290 780 1.29 (0.77–2.17) 1.51 (1.01–2.25)16–20 y 472/283 769 0.86 (0.54–1.37) 2.06 (1.61–2.65)21–25 y 756/260 885 1.77 (1.30–2.41) 2.03 (1.64–2.50)26–30 y 863/207 632 1.93 (1.44–2.60) 1.59 (1.27–1.99)31–35 y 754/134 730 1.67 (1.13–2.46) 1.62 (1.26–2.07)36–40 y 454/67 523 2.55 (1.62–4.00) 1.85 (1.34–2.56)
Hypercholesterolemia≤5 y 1642/291 114 1.37 (1.09–1.72) 1.44 (1.22–1.70)6–10 y 3050/279 052 1.26 (1.05–1.51) 1.53 (1.35–1.72)11–15 y 4583/259 806 1.18 (1.01–1.38) 1.30 (1.17–1.45)16–20 y 5999/229 863 1.38 (1.20–1.57) 1.21 (1.09–1.34)21–25 y 6356/185 154 1.41 (1.23–1.62) 1.30 (1.18–1.43)26–30 y 5590/125 494 1.33 (1.13–1.57) 1.16 (1.04–1.30)31–35 y 3483/67 843 1.28 (1.02–1.62) 1.29 (1.12–1.49)36–40 y 1566/27 832 1.77 (1.28–2.45) 1.13 (0.88–1.43)
CVD = cardiovascular disease; HR = hazard ratio.* Models were adjusted for age at first birth, age in 1989, race/ethnicity (African American, Latina, Asian, white [reference], or other), years ofparental education (<9, 9 to 11, 12, 13 to 15, or ≥16 [reference]), strenuous physical activity at age 18 to 22 y (never, 1 to 3 mo/y [reference], 4 to6 mo/y, 7 to 9 mo/y, or 10 to 12 mo/y), prepregnancy smoking status (never [reference], former, or current), prepregnancy body mass index (<18.5,18.5 to 24.9 [reference], 25 to 29.9, or ≥30 kg/m2), prepregnancy alcohol consumption (none [reference], ≤1 drink/wk, 2 to 6 drinks/wk, or ≥1drink/d), quintile of prepregnancy Alternative Healthy Eating Index score (fifth quintile [reference] represented the healthiest diet category),prepregnancy oral contraceptive use (never [reference], <2 y, 2 to 3 y, or ≥4 y), and family history of chronic hypertension (yes or no; chronichypertension model only) and type 2 diabetes mellitus (yes or no; type 2 diabetes mellitus model only). Because of small cell counts, women withmissing prepregnancy smoking status (n = 352), strenuous physical activity from age 18 to 22 y (n = 348), and prepregnancy alcohol consumption(n = 249) were excluded from the analysis for the type 2 diabetes mellitus model from 6 to 10 y.† Few cases (1 case among women with gestational hypertension and no cases among women with preeclampsia) resulted in unstable estimates fortype 2 diabetes mellitus ≤5 y after the first birth.
Hypertensive Disorders of Pregnancy and CVD Risk Factor Development ORIGINAL RESEARCH
Annals.org Annals of Internal Medicine 5
Downloaded From: http://annals.org/ by Aland Bisso Andrade on 07/03/2018
rate (CI, 3.1 to 5.1). Although women with HDP hadelevated rates of chronic hypertension throughoutfollow-up, the relative rate diminished over time. How-ever, absolute rate differences were lowest in earlieryears, when incidence was low, and highest in lateryears. The statistically significant 1.5- to 2.6-fold in-creased rate of T2DM among women with preeclamp-sia appeared as early as 6 to 10 years after their firstbirth and continued throughout follow-up. Women withgestational hypertension had a statistically significantlyincreased rate of T2DM beginning 21 to 25 years aftertheir first birth, which ranged from 1.7- to 2.6-fold higherthan for women who were normotensive during preg-nancy. Women with HDP in their first pregnancy had sta-tistically significant 1.2- to 1.8-fold increased rates of hy-percholesterolemia in the interval from immediately aftertheir first birth through 35 years (for women with pre-
eclampsia) or 40 years (for women with gestational hyper-tension).
Recurrent HDP and CVD Risk FactorsWe examined HDP recurrence with follow-up start-
ing at age 40 years (Appendix Table 2, available atAnnals.org). Women with HDP in their first and secondor later pregnancies had the highest rates of CVD riskfactor development, with HRs ranging from 1.3 (CI, 1.2to 1.5) for hypercholesterolemia to 3.5 (CI, 3.2 to 3.9)for chronic hypertension compared with women with 2or more pregnancies and no HDP. Women with anyHDP, regardless of which pregnancy it occurred in, hadincreased rates of CVD risk factor development. Furtheradjustment for parity did not materially alter these re-sults. Starting follow-up at age 45 years rather than 40years yielded slightly attenuated HRs, but significance
Figure. Multivariable-adjusted cumulative incidence of chronic hypertension, type 2 diabetes mellitus, and hypercholesterolemia through 40 y since first birth, by hypertensive disorder in first pregnancy.
Median (IQR) time since first birth, y* Gestational hypertension 20 (13–26) Preeclampsia 22 (I 5–29) Normotension 27 (21–32)
Chronic Hypertension
10
2
4
6
8
10
12
1414%
7%
3%
0.3%0.2%0.8%
4%
6%
11%
11 21232527293133353739131517193 5 7 9
Type 2 Diabetes Mellitus
Years Since First Birth Years Since First BirthYears Since First Birth
Cum
ulat
ive
Inci
denc
e, %
Gestational hypertension Preeclampsia Normotension
At risk, nGestational hypertensionPreeclampsiaNormotension
10 y1464
326151 414
20 y873
224542 108
30 y254
80719 843
40 y30
1133396
10 y1682
364753 050
20 y1529
335249 948
30 y718
186030 395
40 y143
3546883
10 y1484
321549 099
20 y1027
231337 820
30 y327
90216 543
40 y40
1082502
Hypercholesterolemia
Median (IQR) time since first birth, y* Gestational hypertension 28 (24–33) Preeclampsia 30 (25–35) Normotension 31 (26–36)
Median (IQR) time since first birth, y* Gestational hypertension 28 (24–33) Preeclampsia 30 (25–35) Normotension 31 (26–36)
0
2
4
6
8
10
12
14
Cum
ulat
ive
Inci
denc
e, %
0
2
4
6
8
10
12
14
Cum
ulat
ive
Inci
denc
e, %
1 11 21232527293133353739131517193 5 7 9 1 11 2123252729 3133353739131517193 5 7 9
Curves were obtained at the mean and mode values for the following continuous and categorical covariates, respectively: age at first birth (27 y),age in 1989 (35 y), race/ethnicity (white), parental education (12 y), strenuous physical activity at ages 18 to 22 y (1 to 3 mo per year), prepregnancysmoking status (never), prepregnancy body mass index (normal weight [18.5 to 24.9 kg/m2]), prepregnancy alcohol consumption (≤1 drink perweek), prepregnancy Alternative Healthy Eating Index score (third quintile), prepregnancy oral contraceptive use (≥4 y), family history of chronichypertension (present) (chronic hypertension model only), and family history of type 2 diabetes mellitus (absent) (type 2 diabetes mellitus modelonly). IQR = interquartile range.* P < 0.001 from a global test of the difference in the distribution of time to CVD risk factor development between groups based on hypertensivedisorder status in the first pregnancy.
ORIGINAL RESEARCH Hypertensive Disorders of Pregnancy and CVD Risk Factor Development
6 Annals of Internal Medicine Annals.org
Downloaded From: http://annals.org/ by Aland Bisso Andrade on 07/03/2018
and rank were maintained across HDP groups (data notshown).
Sensitivity AnalysesThe majority of women who developed a CVD risk
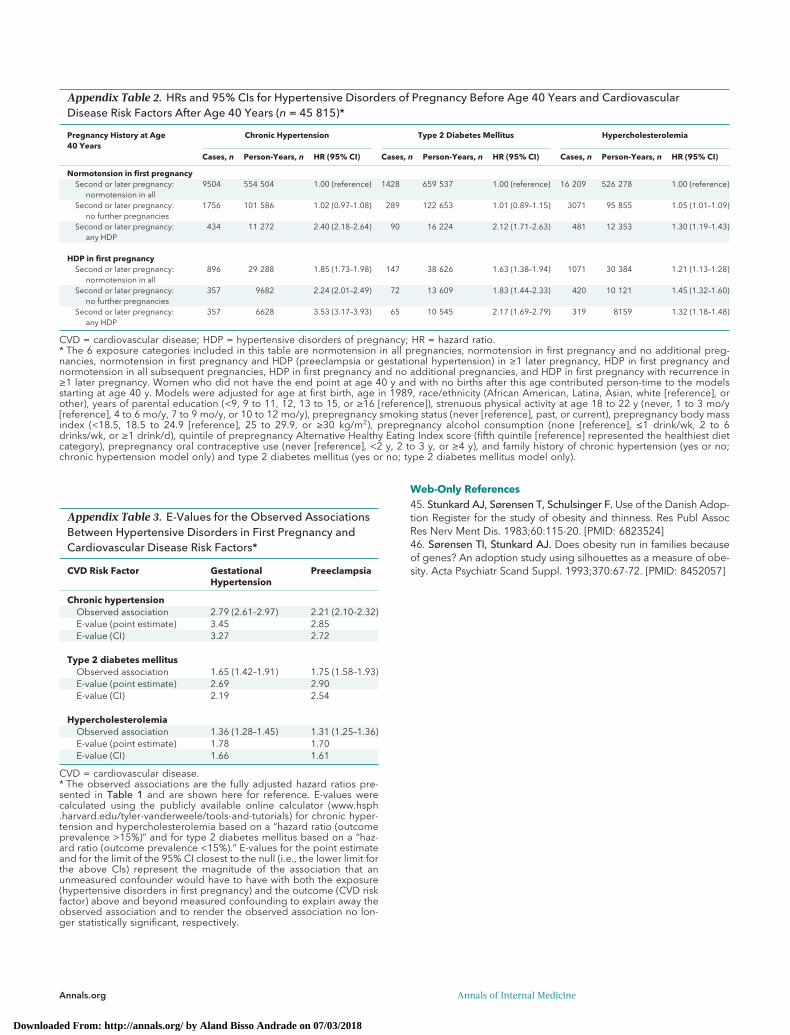
factor during follow-up did so before reporting theirpregnancy history in 2009 (73% among T2DM cases,85% among chronic hypertension cases, and 87%among hypercholesterolemia cases). Given this and theretrospective report of HDP in 2009, we conducted asensitivity analysis with follow-up from 2009 to 2013.Hazard ratios were attenuated but statistically significant,except for the association between preeclampsia and hy-percholesterolemia (HR, 1.1 [CI, 0.9 to 1.2]). Additionalanalyses that started follow-up in 1982 for chronic hyper-tension and hypercholesterolemia (the first year of diag-nosis we could assign for these risk factors), excludedwomen with multiple children in their first birth (n = 819),and used an alternative clinical hypertension end pointthat also included antihypertensive medication useyielded similar results (data not shown). To evaluate therobustness of the results to potential unmeasured con-founding, we calculated E-values using the publicly avail-able online E-value calculator (www.hsph.harvard.edu/tyler-vanderweele/tools-and-tutorials) (37–39). E-valuesfor the observed point estimates ranged from 1.7 for pre-eclampsia and hypercholesterolemia to 3.4 for gesta-tional hypertension and chronic hypertension (AppendixTable 3, available at Annals.org).
DISCUSSIONWomen with a history of gestational hypertension
or preeclampsia in their first pregnancy developedchronic hypertension at a 2- to 3-fold higher rate andhad 70% and 30% higher rates of T2DM and hypercho-lesterolemia, respectively, than women who were normo-tensive during their first pregnancy. These associationspersisted even after we accounted for prepregnancy con-founders, including BMI, smoking, and family history. Toour knowledge, this study includes the most complete ad-justment for prepregnancy confounders of the relation-ship between HDP and CVD risk factors, and it is also oneof the largest studies with one of the longest follow-ups inthe literature. Our ability to describe the trajectory of riskfactor development with up to 50 years of follow-up fromfirst birth provides insight into the timing and pathwaysbetween HDP and CVD.
This study advances our understanding of the tra-jectory of CVD risk after HDP. Although higher magni-tudes of risk have been observed for chronic hyperten-sion and T2DM, those studies largely did not adjust forprepregnancy confounding, followed women for lesstime, or had smaller samples (2, 17, 18). Although HDPhas been inconsistently related to lipid measures (24)and was not previously associated with hypercholester-olemia (8), we found associations of gestational hyper-tension and preeclampsia with incident hypercholester-olemia. Only 3 previous studies have analyzed theassociations between preterm birth or HDP recurrenceand any of these CVD risk factors (10, 11, 17). However,
one considered only the first 2 pregnancies when ex-amining recurrence (10), and another used antihyper-tensive medication use as a proxy for chronic hyperten-sion (11). Our study found that recurrent HDP confersthe highest risk for chronic hypertension and T2DM,even after adjustment for prepregnancy confounding,and is the first to reveal a relationship between recur-rent HDP and hypercholesterolemia. Our findings alsoconfirm that the increased rate of CVD risk factors is notrestricted to preterm preeclampsia but occurs across allcombinations of HDP and gestation length. Only a fewprevious studies examined blood pressure (1), chronichypertension (9, 10, 17, 40, 41), T2DM (9, 14, 17), andlipid values (1) among women with a history of gesta-tional hypertension. Our finding of a higher magnitudeof chronic hypertension risk among women with gesta-tional hypertension compared with those with pre-eclampsia is consistent with findings of 3 previous stud-ies (9, 10, 40) and may suggest different pathologies inthese hypertensive disorders. One previous study cal-culated 10-year cumulative incidence of chronic hyper-tension among women with and without HDP (10), butwe expanded our understanding by charting the 40-year cumulative incidence of CVD risk factors in thesewomen.
The primary limitation of our study is its reliance onself-reported HDP, which was retrospectively reportedin 2009 and may result in recall bias. However, self-reported preeclampsia was validated in a subset ofNHS II participants, and most had medical record evi-dence of preeclampsia. Gestational hypertension hasnot yet been validated, but the proportions of first preg-nancies with gestational hypertension and preeclampsiaare consistent with those seen elsewhere (24). AlthoughHDP history was retrospectively reported, length of ma-ternal recall has not been consistently associated withaccuracy (42).
Given that 85% of participants contributed person-time to the analysis that occurred before enrollment inNHS II, there may have been selection bias. However,on the basis of the retrospective data collected on the1989 baseline questionnaire, we were able to assigntime of onset for chronic hypertension and hypercho-lesterolemia cases arising between 1980 and 1989 andfor all T2DM cases. Because participants were excludedif they developed chronic hypertension or hypercholes-terolemia before 1980, we conducted a sensitivity anal-ysis that excluded person-time between the first birthand 1982 (the year assigned for women who devel-oped end points between 1980 and 1984) and ob-tained similar results. Although inclusion in our analysiswas dependent on survival to 2009, 98.2% of NHS IIparticipants were alive that year. Further, our sensitivityanalysis that included follow-up from 2009 to 2013found results that were consistent with those observedfrom first birth through 2013.
Information on confounders was also self-reported,which may have resulted in misclassification or residualconfounding. However, this study included the mostcomplete adjustment for prepregnancy confounders,and on the basis of our calculated E-values, an unmea-
Hypertensive Disorders of Pregnancy and CVD Risk Factor Development ORIGINAL RESEARCH
Annals.org Annals of Internal Medicine 7
Downloaded From: http://annals.org/ by Aland Bisso Andrade on 07/03/2018
sured confounder would need to be associated withHDP and the CVD risk factor by a magnitude of 1.7- to3.4-fold above and beyond the measured confoundersto explain away the observed associations. The only mea-sured confounder of similar magnitude was prepreg-nancy obesity, so it is unlikely that our associations couldbe explained away by an unmeasured confounder. Be-cause the NHS II cohort includes primarily white nurses,caution should be used when generalizing these findingsto other populations. Although our study provided longerfollow-up since first birth than many previous studies, NHSII participants were still relatively young at the end offollow-up in 2013. As the cohort ages, the relative risksassociated with HDP will likely decrease as the absoluterisks for CVD risk factors increase.
It is not yet clear whether HDP unmasks preexistingcardiovascular risk through the “stress test” of preg-nancy or whether it induces endothelial or organ dam-age that alters a woman's trajectory toward develop-ment of CVD risk factors. Women who developpreeclampsia tend to have slightly higher blood pres-sures and a dyslipidemic profile before pregnancy, in-dicating that preeclampsia may reveal a subclinical tra-jectory toward development of chronic hypertensionand hypercholesterolemia that predates pregnancy(18, 43). Regardless of whether the relationship is cor-relational or causal, a history of HDP may help identifywomen who are at increased risk for CVD risk factorsand events.
Compared with women who are normotensive dur-ing their first pregnancy, those with gestational hyper-tension or preeclampsia are at increased risk forchronic hypertension, T2DM, and hypercholesterol-emia shortly after pregnancy. This increased risk per-sists for several decades. These women may benefitfrom lifestyle interventions and screening to reducecardiovascular risk and delay disease onset. Just asguidelines exist to screen for T2DM among womenwith a history of gestational diabetes (44), our findingsmay inform similar guidelines on screening for CVD riskfactors among women with a history of HDP.
From Harvard T.H. Chan School of Public Health, Brigham andWomen's Hospital, and Harvard Medical School, Boston,Massachusetts (J.J.S., L.J.T., E.B.R., D.S., J.W.R.); Harvard T.H.Chan School of Public Health, Boston Children's Hospital, andHarvard Medical School, Boston, Massachusetts, and MichiganState University, Grand Rapids, Michigan (S.A.M.); and HarvardT.H. Chan School of Public Health, Boston, Massachusetts(T.M.J.).
Acknowledgment: The authors thank the reviewers and editorsfor their helpful comments on an earlier draft of this article.
Grant Support: This research was funded by grant UM1CA176726 from the National Institutes of Health and wassupported by awards from the American Heart Association(12PRE9110014 and 13GRNT17070022). Dr. Stuart was sup-ported by Training Grant T32HL098048 from the National Heart,Lung, and Blood Institute and Training Grant T32HD060454from the National Institute of Child Health and Human Develop-
ment. Dr. Tanz was supported by the Ruth L. Kirschstein NationalResearch Service Award (NHLBI F31 HL131222).
Disclosures: Authors have disclosed no conflicts of interest.Forms can be viewed at www.acponline.org/authors/icmje/ConflictOfInterestForms.do?msNum=M17-2740.
Reproducible Research Statement: Study protocol and dataset: Not available. Statistical code: Available from Dr. Stuart(e-mail, [email protected]).
Corresponding Author: Jennifer Stuart, ScD, Division ofWomen's Health, Brigham and Women's Hospital, 1620 Tre-mont Street, OBC 3-34, Boston, MA 02120; e-mail, [email protected].
Current author addresses and author contributions are avail-able at Annals.org.
References1. Fraser A, Nelson SM, Macdonald-Wallis C, Cherry L, Butler E,Sattar N, et al. Associations of pregnancy complications withcalculated cardiovascular disease risk and cardiovascular risk fac-tors in middle age: the Avon Longitudinal Study of Parents andChildren. Circulation. 2012;125:1367-80. [PMID: 22344039] doi:10.1161/CIRCULATIONAHA.111.0447842. Bellamy L, Casas JP, Hingorani AD, Williams DJ. Pre-eclampsiaand risk of cardiovascular disease and cancer in later life: systematicreview and meta-analysis. BMJ. 2007;335:974. [PMID: 17975258]3. McDonald SD, Malinowski A, Zhou Q, Yusuf S, Devereaux PJ.Cardiovascular sequelae of preeclampsia/eclampsia: a systematicreview and meta-analyses. Am Heart J. 2008;156:918-30. [PMID:19061708] doi:10.1016/j.ahj.2008.06.0424. Ahmed R, Dunford J, Mehran R, Robson S, Kunadian V. Pre-eclampsia and future cardiovascular risk among women: a review.J Am Coll Cardiol. 2014;63:1815-22. [PMID: 24613324] doi:10.1016/j.jacc.2014.02.5295. Sattar N, Greer IA. Pregnancy complications and maternal cardio-vascular risk: opportunities for intervention and screening? BMJ.2002;325:157-60. [PMID: 12130616]6. Mosca L, Benjamin EJ, Berra K, Bezanson JL, Dolor RJ, Lloyd-Jones DM, et al. Effectiveness-based guidelines for the prevention ofcardiovascular disease in women—2011 update: a guideline from theAmerican Heart Association. Circulation. 2011;123:1243-62. [PMID:21325087] doi:10.1161/CIR.0b013e31820faaf87. Brown MC, Best KE, Pearce MS, Waugh J, Robson SC, Bell R.Cardiovascular disease risk in women with pre-eclampsia: systematicreview and meta-analysis. Eur J Epidemiol. 2013;28:1-19. [PMID:23397514] doi:10.1007/s10654-013-9762-68. Heida KY, Franx A, van Rijn BB, Eijkemans MJ, Boer JM, Ver-schuren MW, et al. Earlier age of onset of chronic hypertension andtype 2 diabetes mellitus after a hypertensive disorder of pregnancyor gestational diabetes mellitus. Hypertension. 2015;66:1116-22.[PMID: 26459420] doi:10.1161/HYPERTENSIONAHA.115.060059. Mannisto T, Mendola P, Vaarasmaki M, Jarvelin MR, HartikainenAL, Pouta A, et al. Elevated blood pressure in pregnancy and subse-quent chronic disease risk. Circulation. 2013;127:681-90. [PMID:23401113] doi:10.1161/CIRCULATIONAHA.112.12875110. Behrens I, Basit S, Melbye M, Lykke JA, Wohlfahrt J, BundgaardH, et al. Risk of post-pregnancy hypertension in women with a historyof hypertensive disorders of pregnancy: nationwide cohort study.BMJ. 2017;358:j3078. [PMID: 28701333] doi:10.1136/bmj.j307811. Engeland A, Bjørge T, Klungsøyr K, Skjærven R, Skurtveit S, FuruK. Preeclampsia in pregnancy and later use of antihypertensivedrugs. Eur J Epidemiol. 2015;30:501-8. [PMID: 25784365] doi:10.1007/s10654-015-0018-5
ORIGINAL RESEARCH Hypertensive Disorders of Pregnancy and CVD Risk Factor Development
8 Annals of Internal Medicine Annals.org
Downloaded From: http://annals.org/ by Aland Bisso Andrade on 07/03/2018
12. Parikh NI, Norberg M, Ingelsson E, Cnattingius S, Vasan RS,Domellof M, et al. Association of pregnancy complications and char-acteristics with future risk of elevated blood pressure: the Vasterbot-ten Intervention Program. Hypertension. 2017;69:475-83. [PMID:28137991] doi:10.1161/HYPERTENSIONAHA.116.0812113. Callaway LK, Lawlor DA, O’Callaghan M, Williams GM, NajmanJM, McIntyre HD. Diabetes mellitus in the 21 years after a preg-nancy that was complicated by hypertension: findings from aprospective cohort study. Am J Obstet Gynecol. 2007;197:492.[PMID: 17980185]14. Feig DS, Shah BR, Lipscombe LL, Wu CF, Ray JG, Lowe J, et al.Preeclampsia as a risk factor for diabetes: a population-based cohortstudy. PLoS Med. 2013;10:e1001425. [PMID: 23610560] doi:10.1371/journal.pmed.100142515. Epstein FH. Late vascular effects of toxemia of pregnancy. N EnglJ Med. 1964;271:391-5. [PMID: 14164656]16. Laivuori H, Tikkanen MJ, Ylikorkala O. Hyperinsulinemia 17 yearsafter preeclamptic first pregnancy. J Clin Endocrinol Metab. 1996;81:2908-11. [PMID: 8768850]17. Lykke JA, Langhoff-Roos J, Sibai BM, Funai EF, Triche EW,Paidas MJ. Hypertensive pregnancy disorders and subsequentcardiovascular morbidity and type 2 diabetes mellitus in themother. Hypertension. 2009;53:944-51. [PMID: 19433776] doi:10.1161/HYPERTENSIONAHA.109.13076518. Magnussen EB, Vatten LJ, Lund-Nilsen TI, Salvesen KA, DaveySmith G, Romundstad PR. Prepregnancy cardiovascular risk factorsas predictors of pre-eclampsia: population based cohort study. BMJ.2007;335:978. [PMID: 17975256]19. Manten GT, Sikkema MJ, Voorbij HA, Visser GH, Bruinse HW,Franx A. Risk factors for cardiovascular disease in women with a his-tory of pregnancy complicated by preeclampsia or intrauterinegrowth restriction. Hypertens Pregnancy. 2007;26:39-50. [PMID:17454217]20. Smith GN, Walker MC, Liu A, Wen SW, Swansburg M, RamshawH, et al; Pre-Eclampsia New Emerging Team (PE-NET). A history ofpreeclampsia identifies women who have underlying cardiovascularrisk factors. Am J Obstet Gynecol. 2009;200:58. [PMID: 18691690]doi:10.1016/j.ajog.2008.06.03521. Wolf M, Hubel CA, Lam C, Sampson M, Ecker JL, Ness RB, et al.Preeclampsia and future cardiovascular disease: potential role of al-tered angiogenesis and insulin resistance. J Clin Endocrinol Metab.2004;89:6239-43. [PMID: 15579783]22. Wu P, Kwok CS, Haththotuwa R, Kotronias RA, Babu A, Fryer AA,et al. Pre-eclampsia is associated with a twofold increase in diabetes:a systematic review and meta-analysis. Diabetologia. 2016;59:2518-26. [PMID: 27646865]23. Drost JT, van der Schouw YT, Maas AH, Verschuren WM. Longi-tudinal analysis of cardiovascular risk parameters in women with ahistory of hypertensive pregnancy disorders: the DoetinchemCohort Study. BJOG. 2013;120:1333-9. [PMID: 23639174] doi:10.1111/1471-0528.1225424. Rich-Edwards JW, Ness RB, Roberts JM. Epidemiology ofpregnancy-related hypertension. In: Taylor RN, Roberts JM, Cun-ningham G, Lindheimer MD, eds. Chesley's Hypertensive Disordersin Pregnancy. 4th ed. Waltham, MA: Elsevier; 2015:37-56.25. Sattar N, Ramsay J, Crawford L, Cheyne H, Greer IA. Classic andnovel risk factor parameters in women with a history of preeclamp-sia. Hypertension. 2003;42:39-42. [PMID: 12743016]26. ACOG Committee on Practice Bulletins—Obstetrics. ACOG prac-tice bulletin. Diagnosis and management of preeclampsia and ec-lampsia. Number 33, January 2002. Obstet Gynecol. 2002;99:159-67. [PMID: 16175681]
27. Forman JP, Curhan GC, Taylor EN. Plasma 25-hydroxyvitamin Dlevels and risk of incident hypertension among young women.Hypertension. 2008;52:828-32. [PMID: 18838623] doi:10.1161/HYPERTENSIONAHA.108.11763028. Report of the expert committee on the diagnosis and classifica-tion of diabetes mellitus. Diabetes Care. 1997;20:1183-97. [PMID:9203460]29. Classification and diagnosis of diabetes mellitus and other cate-gories of glucose intolerance. National Diabetes Data Group. Diabe-tes. 1979;28:1039-57. [PMID: 510803]30. Rich-Edwards JW, Colditz GA, Stampfer MJ, Willett WC, GillmanMW, Hennekens CH, et al. Birthweight and the risk for type 2 diabe-tes mellitus in adult women. Ann Intern Med. 1999;130:278-84.[PMID: 10068385]31. Colditz GA, Martin P, Stampfer MJ, Willett WC, Sampson L, Ros-ner B, et al. Validation of questionnaire information on risk factorsand disease outcomes in a prospective cohort study of women. AmJ Epidemiol. 1986;123:894-900. [PMID: 3962971]32. Troy LM, Hunter DJ, Manson JE, Colditz GA, Stampfer MJ, Wil-lett WC. The validity of recalled weight among younger women. Int JObes Relat Metab Disord. 1995;19:570-2. [PMID: 7489028]33. Chiuve SE, Fung TT, Rimm EB, Hu FB, McCullough ML, Wang M,et al. Alternative dietary indices both strongly predict risk of chronicdisease. J Nutr. 2012;142:1009-18. [PMID: 22513989] doi:10.3945/jn.111.15722234. Durrleman S, Simon R. Flexible regression models with cubicsplines. Stat Med. 1989;8:551-61. [PMID: 2657958]35. Govindarajulu US, Malloy EJ, Ganguli B, Spiegelman D, EisenEA. The comparison of alternative smoothing methods for fittingnon-linear exposure-response relationships with Cox models in asimulation study. Int J Biostat. 2009;5:Article 2. [PMID: 20231865]doi:10.2202/1557-4679.110436. Govindarajulu US, Spiegelman D, Thurston SW, Ganguli B,Eisen EA. Comparing smoothing techniques in Cox models forexposure-response relationships. Stat Med. 2007;26:3735-52. [PMID:17538974]37. Localio AR, Stack CB, Griswold ME. Sensitivity analysis for un-measured confounding: E-values for observational studies. Ann In-tern Med. 2017;167:285-6. [PMID: 28693037] doi:10.7326/M17-148538. Mathur MB, Ding P, Riddell CA, VanderWeele TJ. Website and Rpackage for computing E-values. Epidemiology. 2018. [Forthcoming].39. VanderWeele TJ, Ding P. Sensitivity analysis in observational re-search: introducing the E-value. Ann Intern Med. 2017;167:268-74.[PMID: 28693043] doi:10.7326/M16-260740. Marın R, Gorostidi M, Portal CG, Sanchez M, Sanchez E, AlvarezJ. Long-term prognosis of hypertension in pregnancy. HypertensPregnancy. 2000;19:199-209. [PMID: 10877988]41. Wilson BJ, Watson MS, Prescott GJ, Sunderland S, CampbellDM, Hannaford P, et al. Hypertensive diseases of pregnancy and riskof hypertension and stroke in later life: results from cohort study.BMJ. 2003;326:845. [PMID: 12702615]42. Stuart JJ, Bairey Merz CN, Berga SL, Miller VM, Ouyang P,Shufelt CL, et al. Maternal recall of hypertensive disorders in preg-nancy: a systematic review. J Womens Health (Larchmt). 2013;22:37-47. [PMID: 23215903] doi:10.1089/jwh.2012.374043. Seely EW, Tsigas E, Rich-Edwards JW. Preeclampsia and futurecardiovascular disease in women: how good are the data and howcan we manage our patients? Semin Perinatol. 2015;39:276-83.[PMID: 26117165] doi:10.1053/j.semperi.2015.05.00644. American Diabetes Association. 2. Classification and diagnosis ofdiabetes: standards of medical care in diabetes—2018. DiabetesCare. 2018;41:S13-27. [PMID: 29222373] doi:10.2337/dc18-S002
Hypertensive Disorders of Pregnancy and CVD Risk Factor Development ORIGINAL RESEARCH
Annals.org Annals of Internal Medicine 9
Downloaded From: http://annals.org/ by Aland Bisso Andrade on 07/03/2018
Current Author Addresses: Drs. Stuart, Tanz, and Rich-Edwards: Division of Women's Health, Brigham and Women'sHospital, 1620 Tremont Street, OBC 3-34, Boston, MA 02120.Dr. Missmer: Department of Obstetrics, Gynecology, and Re-productive Biology, College of Human Medicine, MichiganState University, Secchia Center, 15 Michigan Street, NE,Grand Rapids, MI 49503.Dr. Rimm: Department of Nutrition, Harvard T.H. Chan Schoolof Public Health, 655 Huntington Avenue, Building II, Room373a, Boston, MA 02115.Dr. Spiegelman: Harvard T.H. Chan School of Public Health,677 Huntington Avenue, Kresge Building, Room 802, Boston,MA 02115.Dr. James-Todd: Harvard T.H. Chan School of Public Health,665 Huntington Avenue, Building 1, 14th Floor, Room 1411,Boston, MA 02115.
Author Contributions: Conception and design: J.J. Stuart, S.A.Missmer, E.B. Rimm, D. Spiegelman, J.W. Rich-Edwards.Analysis and interpretation of the data: J.J. Stuart, L.J. Tanz, D.Spiegelman, J.W. Rich-Edwards.Drafting of the article: J.J. Stuart.Critical revision of the article for important intellectual content:J.J. Stuart, L.J. Tanz, S.A. Missmer, E.B. Rimm, D. Spiegelman,T.M. James-Todd, J.W. Rich-Edwards.Final approval of the article: J.J. Stuart, L.J. Tanz, S.A. Missmer,E.B. Rimm, D. Spiegelman, T.M. James-Todd, J.W. Rich-Edwards.Statistical expertise: D. Spiegelman.Obtaining of funding: J.J. Stuart.
APPENDIX: EXPANDED METHODSBMI Derivation
In the NHS II, the 1989 baseline questionnaire ascer-tained height; current weight; weight at age 18 years; andsomatograms at ages 5, 10, 20, 30, and 40 years and atthe time of completion of the questionnaire (AppendixFigure). Subsequent biennial questionnaires collectedcurrent weight. Body mass index was calculated on thebasis of height and weight (kg/m2). To derive prepreg-nancy BMIs for this analysis, we used the following infor-mation provided by participants: self-reported BMI at age18 years; BMI at the time of completion of each biennialquestionnaire; and somatograms at ages 20, 30, and 40years and at the time of completion of the baselinequestionnaire.
First, we used all available information from the bien-nial questionnaires to assign BMIs for ages 18 through 69years (the age of the oldest participant at the time of the2013 questionnaire submission [end of follow-up for thecurrent analysis]). As such, the BMI calculated at the timeof completion of each biennial questionnaire was as-signed as the BMI for the age of the participant at the timeof completion of that questionnaire (for example, the BMI
at age 31 years for a woman who was that age in 1991was taken from the 1991 questionnaire). If a woman didnot complete a biennial questionnaire and provide cur-rent weights at ages 20, 30, and 40 years and/or at thetime of the baseline questionnaire (which were used tocalculate BMIs at those ages), she was assigned the me-dian BMI among participants with known BMIs who re-ported the same somatogram category for those ages.For example, if a woman's BMI at age 40 years was notknown and she had indicated category 5 for her somato-gram at that age on the baseline questionnaire, she wasassigned the median BMI among women who also indi-cated category 5 for their somatogram at age 40 yearsand who provided their current weight on a biennialquestionnaire at that age. (If a woman was missing so-matogram information, her BMI was interpolated as de-scribed in the next paragraph.)
Second, we interpolated BMIs across ages forwhich BMI was not known using the formula B2 = B1 +([B3 � B1]/[A3 � A1]) × (A2 � A1). B2 represents the un-known BMI being estimated (at time 2), B1 representsthe last known BMI (at time 1), and B3 represents thenext known BMI (at time 3). Similarly, A1 represents theage at the last known BMI (at time 1), A2 representsthe age for the unknown BMI being estimated (at time2), and A3 represents the age at the time of the nextknown BMI (at time 3). Therefore, for each unknownBMI at a given age falling temporally between 2 knownBMIs, the unknown BMI was estimated as the lastknown BMI (B1), plus the difference between the 2known BMIs (B3 � B1), divided by the difference in ages(time) between the 2 known BMIs (A3 � A1), multipliedby the number of years between the last known BMIand the unknown BMI being estimated (A2 � A1). Thisinterpolation was repeated until age 69 years or the lastage at which the BMI for a given participant was known(based on the BMIs and somatograms from the biennialquestionnaires).
Additional ResultsMean length of follow-up and age at censoring varied
due to risk factor–specific censoring. Mean follow-up was26.9 years (SD, 8.8; range, 2 to 49 years) for chronic hy-pertension, 31.6 years (SD, 7.3; range, 2 to 50 years) forT2DM, and 25.1 years (SD, 9.5; range, 2 to 49 years) forhypercholesterolemia. Mean age at censoring was 52.8years (SD, 7.9; range, 21 to 67 years) for chronic hyper-tension, 57.4 years (SD, 5.3; range, 22 to 67 years) forT2DM, and 51.0 years (SD, 8.7; range, 20 to 67 years) forhypercholesterolemia.
Annals.org Annals of Internal Medicine
Downloaded From: http://annals.org/ by Aland Bisso Andrade on 07/03/2018
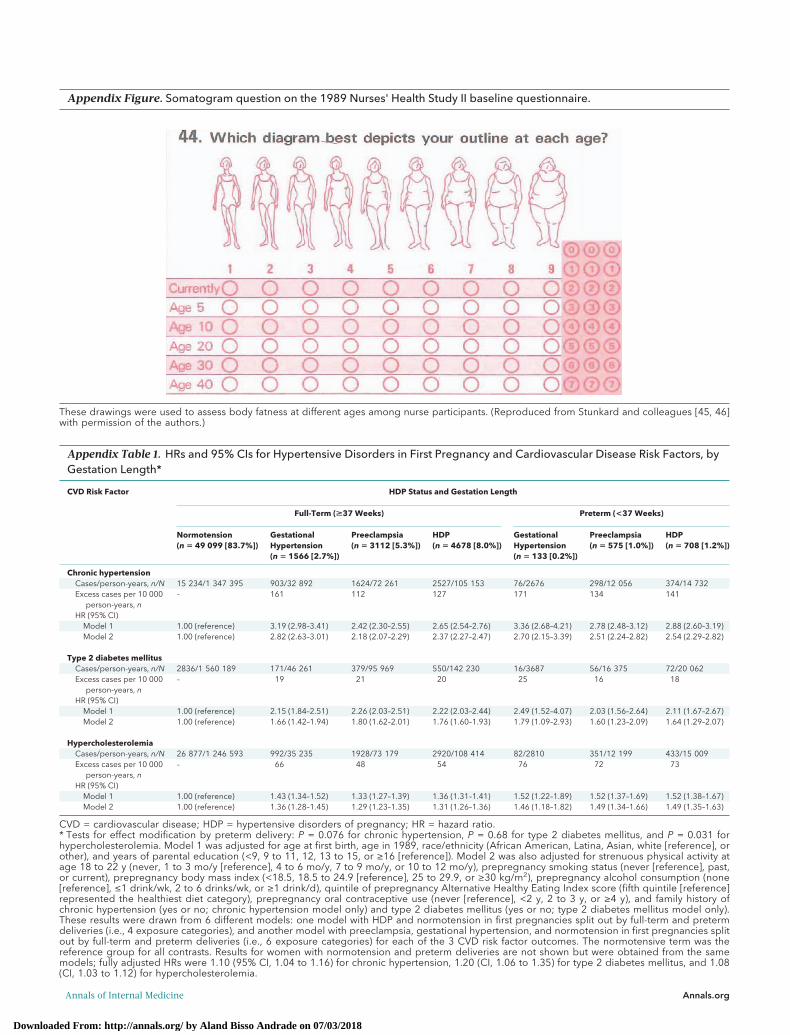
Appendix Table 1. HRs and 95% CIs for Hypertensive Disorders in First Pregnancy and Cardiovascular Disease Risk Factors, byGestation Length*
CVD Risk Factor HDP Status and Gestation Length
Full-Term (>37 Weeks) Preterm (<37 Weeks)
Normotension(n � 49 099 [83.7%])
GestationalHypertension(n � 1566 [2.7%])
Preeclampsia(n � 3112 [5.3%])
HDP(n � 4678 [8.0%])
GestationalHypertension(n � 133 [0.2%])
Preeclampsia(n � 575 [1.0%])
HDP(n � 708 [1.2%])
Chronic hypertensionCases/person-years, n/N 15 234/1 347 395 903/32 892 1624/72 261 2527/105 153 76/2676 298/12 056 374/14 732Excess cases per 10 000
person-years, n– 161 112 127 171 134 141
HR (95% CI)Model 1 1.00 (reference) 3.19 (2.98–3.41) 2.42 (2.30–2.55) 2.65 (2.54–2.76) 3.36 (2.68–4.21) 2.78 (2.48–3.12) 2.88 (2.60–3.19)Model 2 1.00 (reference) 2.82 (2.63–3.01) 2.18 (2.07–2.29) 2.37 (2.27–2.47) 2.70 (2.15–3.39) 2.51 (2.24–2.82) 2.54 (2.29–2.82)
Type 2 diabetes mellitusCases/person-years, n/N 2836/1 560 189 171/46 261 379/95 969 550/142 230 16/3687 56/16 375 72/20 062Excess cases per 10 000
person-years, n– 19 21 20 25 16 18
HR (95% CI)Model 1 1.00 (reference) 2.15 (1.84–2.51) 2.26 (2.03–2.51) 2.22 (2.03–2.44) 2.49 (1.52–4.07) 2.03 (1.56–2.64) 2.11 (1.67–2.67)Model 2 1.00 (reference) 1.66 (1.42–1.94) 1.80 (1.62–2.01) 1.76 (1.60–1.93) 1.79 (1.09–2.93) 1.60 (1.23–2.09) 1.64 (1.29–2.07)
HypercholesterolemiaCases/person-years, n/N 26 877/1 246 593 992/35 235 1928/73 179 2920/108 414 82/2810 351/12 199 433/15 009Excess cases per 10 000
person-years, n– 66 48 54 76 72 73
HR (95% CI)Model 1 1.00 (reference) 1.43 (1.34–1.52) 1.33 (1.27–1.39) 1.36 (1.31–1.41) 1.52 (1.22–1.89) 1.52 (1.37–1.69) 1.52 (1.38–1.67)Model 2 1.00 (reference) 1.36 (1.28–1.45) 1.29 (1.23–1.35) 1.31 (1.26–1.36) 1.46 (1.18–1.82) 1.49 (1.34–1.66) 1.49 (1.35–1.63)
CVD = cardiovascular disease; HDP = hypertensive disorders of pregnancy; HR = hazard ratio.* Tests for effect modification by preterm delivery: P = 0.076 for chronic hypertension, P = 0.68 for type 2 diabetes mellitus, and P = 0.031 forhypercholesterolemia. Model 1 was adjusted for age at first birth, age in 1989, race/ethnicity (African American, Latina, Asian, white [reference], orother), and years of parental education (<9, 9 to 11, 12, 13 to 15, or ≥16 [reference]). Model 2 was also adjusted for strenuous physical activity atage 18 to 22 y (never, 1 to 3 mo/y [reference], 4 to 6 mo/y, 7 to 9 mo/y, or 10 to 12 mo/y), prepregnancy smoking status (never [reference], past,or current), prepregnancy body mass index (<18.5, 18.5 to 24.9 [reference], 25 to 29.9, or ≥30 kg/m2), prepregnancy alcohol consumption (none[reference], ≤1 drink/wk, 2 to 6 drinks/wk, or ≥1 drink/d), quintile of prepregnancy Alternative Healthy Eating Index score (fifth quintile [reference]represented the healthiest diet category), prepregnancy oral contraceptive use (never [reference], <2 y, 2 to 3 y, or ≥4 y), and family history ofchronic hypertension (yes or no; chronic hypertension model only) and type 2 diabetes mellitus (yes or no; type 2 diabetes mellitus model only).These results were drawn from 6 different models: one model with HDP and normotension in first pregnancies split out by full-term and pretermdeliveries (i.e., 4 exposure categories), and another model with preeclampsia, gestational hypertension, and normotension in first pregnancies splitout by full-term and preterm deliveries (i.e., 6 exposure categories) for each of the 3 CVD risk factor outcomes. The normotensive term was thereference group for all contrasts. Results for women with normotension and preterm deliveries are not shown but were obtained from the samemodels; fully adjusted HRs were 1.10 (95% CI, 1.04 to 1.16) for chronic hypertension, 1.20 (CI, 1.06 to 1.35) for type 2 diabetes mellitus, and 1.08(CI, 1.03 to 1.12) for hypercholesterolemia.
Appendix Figure. Somatogram question on the 1989 Nurses' Health Study II baseline questionnaire.
These drawings were used to assess body fatness at different ages among nurse participants. (Reproduced from Stunkard and colleagues [45, 46]with permission of the authors.)
Annals of Internal Medicine Annals.org
Downloaded From: http://annals.org/ by Aland Bisso Andrade on 07/03/2018
Web-Only References45. Stunkard AJ, Sørensen T, Schulsinger F. Use of the Danish Adop-tion Register for the study of obesity and thinness. Res Publ AssocRes Nerv Ment Dis. 1983;60:115-20. [PMID: 6823524]46. Sørensen TI, Stunkard AJ. Does obesity run in families becauseof genes? An adoption study using silhouettes as a measure of obe-sity. Acta Psychiatr Scand Suppl. 1993;370:67-72. [PMID: 8452057]
Appendix Table 2. HRs and 95% CIs for Hypertensive Disorders of Pregnancy Before Age 40 Years and CardiovascularDisease Risk Factors After Age 40 Years (n = 45 815)*
Pregnancy History at Age40 Years
Chronic Hypertension Type 2 Diabetes Mellitus Hypercholesterolemia
Cases, n Person-Years, n HR (95% CI) Cases, n Person-Years, n HR (95% CI) Cases, n Person-Years, n HR (95% CI)
Normotension in first pregnancySecond or later pregnancy:
normotension in all9504 554 504 1.00 (reference) 1428 659 537 1.00 (reference) 16 209 526 278 1.00 (reference)
Second or later pregnancy:no further pregnancies
1756 101 586 1.02 (0.97–1.08) 289 122 653 1.01 (0.89–1.15) 3071 95 855 1.05 (1.01–1.09)
Second or later pregnancy:any HDP
434 11 272 2.40 (2.18–2.64) 90 16 224 2.12 (1.71–2.63) 481 12 353 1.30 (1.19–1.43)
HDP in first pregnancySecond or later pregnancy:
normotension in all896 29 288 1.85 (1.73–1.98) 147 38 626 1.63 (1.38–1.94) 1071 30 384 1.21 (1.13–1.28)
Second or later pregnancy:no further pregnancies
357 9682 2.24 (2.01–2.49) 72 13 609 1.83 (1.44–2.33) 420 10 121 1.45 (1.32–1.60)
Second or later pregnancy:any HDP
357 6628 3.53 (3.17–3.93) 65 10 545 2.17 (1.69–2.79) 319 8159 1.32 (1.18–1.48)
CVD = cardiovascular disease; HDP = hypertensive disorders of pregnancy; HR = hazard ratio.* The 6 exposure categories included in this table are normotension in all pregnancies, normotension in first pregnancy and no additional preg-nancies, normotension in first pregnancy and HDP (preeclampsia or gestational hypertension) in ≥1 later pregnancy, HDP in first pregnancy andnormotension in all subsequent pregnancies, HDP in first pregnancy and no additional pregnancies, and HDP in first pregnancy with recurrence in≥1 later pregnancy. Women who did not have the end point at age 40 y and with no births after this age contributed person-time to the modelsstarting at age 40 y. Models were adjusted for age at first birth, age in 1989, race/ethnicity (African American, Latina, Asian, white [reference], orother), years of parental education (<9, 9 to 11, 12, 13 to 15, or ≥16 [reference]), strenuous physical activity at age 18 to 22 y (never, 1 to 3 mo/y[reference], 4 to 6 mo/y, 7 to 9 mo/y, or 10 to 12 mo/y), prepregnancy smoking status (never [reference], past, or current), prepregnancy body massindex (<18.5, 18.5 to 24.9 [reference], 25 to 29.9, or ≥30 kg/m2), prepregnancy alcohol consumption (none [reference], ≤1 drink/wk, 2 to 6drinks/wk, or ≥1 drink/d), quintile of prepregnancy Alternative Healthy Eating Index score (fifth quintile [reference] represented the healthiest dietcategory), prepregnancy oral contraceptive use (never [reference], <2 y, 2 to 3 y, or ≥4 y), and family history of chronic hypertension (yes or no;chronic hypertension model only) and type 2 diabetes mellitus (yes or no; type 2 diabetes mellitus model only).
Appendix Table 3. E-Values for the Observed AssociationsBetween Hypertensive Disorders in First Pregnancy andCardiovascular Disease Risk Factors*
CVD Risk Factor GestationalHypertension
Preeclampsia
Chronic hypertensionObserved association 2.79 (2.61–2.97) 2.21 (2.10–2.32)E-value (point estimate) 3.45 2.85E-value (CI) 3.27 2.72
Type 2 diabetes mellitusObserved association 1.65 (1.42–1.91) 1.75 (1.58–1.93)E-value (point estimate) 2.69 2.90E-value (CI) 2.19 2.54
HypercholesterolemiaObserved association 1.36 (1.28–1.45) 1.31 (1.25–1.36)E-value (point estimate) 1.78 1.70E-value (CI) 1.66 1.61
CVD = cardiovascular disease.* The observed associations are the fully adjusted hazard ratios pre-sented in Table 1 and are shown here for reference. E-values werecalculated using the publicly available online calculator (www.hsph.harvard.edu/tyler-vanderweele/tools-and-tutorials) for chronic hyper-tension and hypercholesterolemia based on a “hazard ratio (outcomeprevalence >15%)” and for type 2 diabetes mellitus based on a “haz-ard ratio (outcome prevalence <15%).” E-values for the point estimateand for the limit of the 95% CI closest to the null (i.e., the lower limit forthe above CIs) represent the magnitude of the association that anunmeasured confounder would have to have with both the exposure(hypertensive disorders in first pregnancy) and the outcome (CVD riskfactor) above and beyond measured confounding to explain away theobserved association and to render the observed association no lon-ger statistically significant, respectively.
Annals.org Annals of Internal Medicine
Downloaded From: http://annals.org/ by Aland Bisso Andrade on 07/03/2018