Embed Size (px)
Citation preview
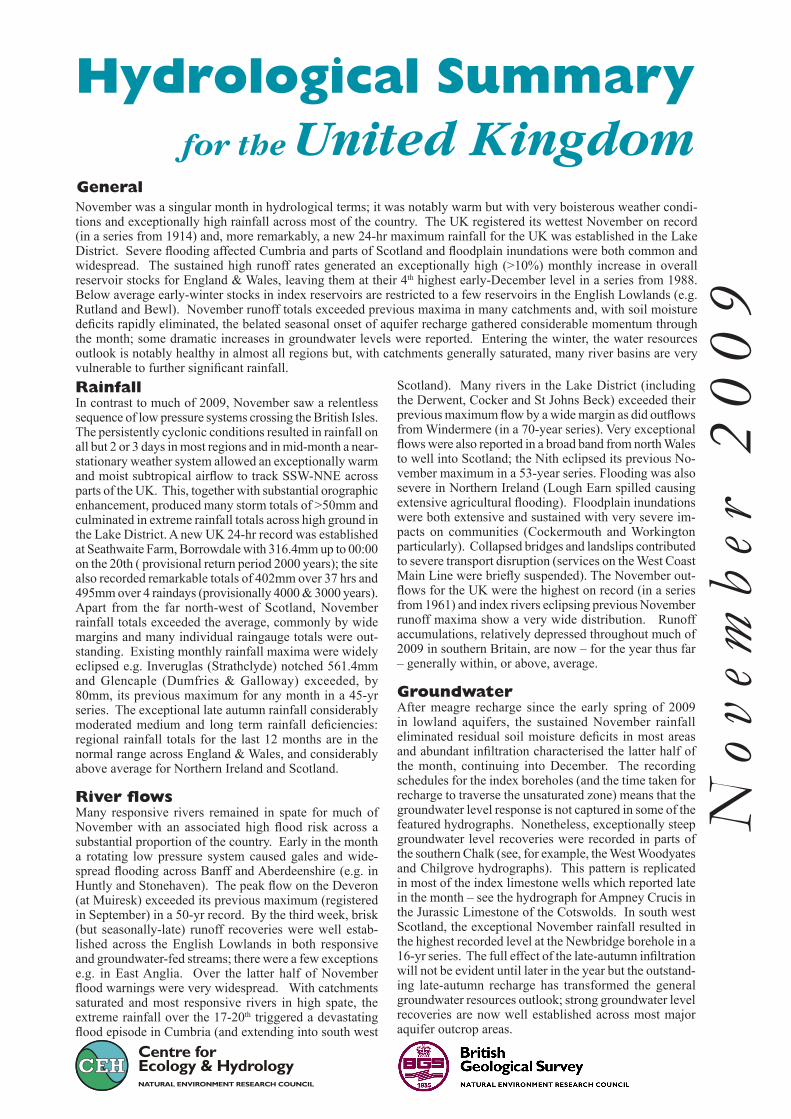
General
Nov
emb
er 2
00
9
Hydrological Summary for the United Kingdom
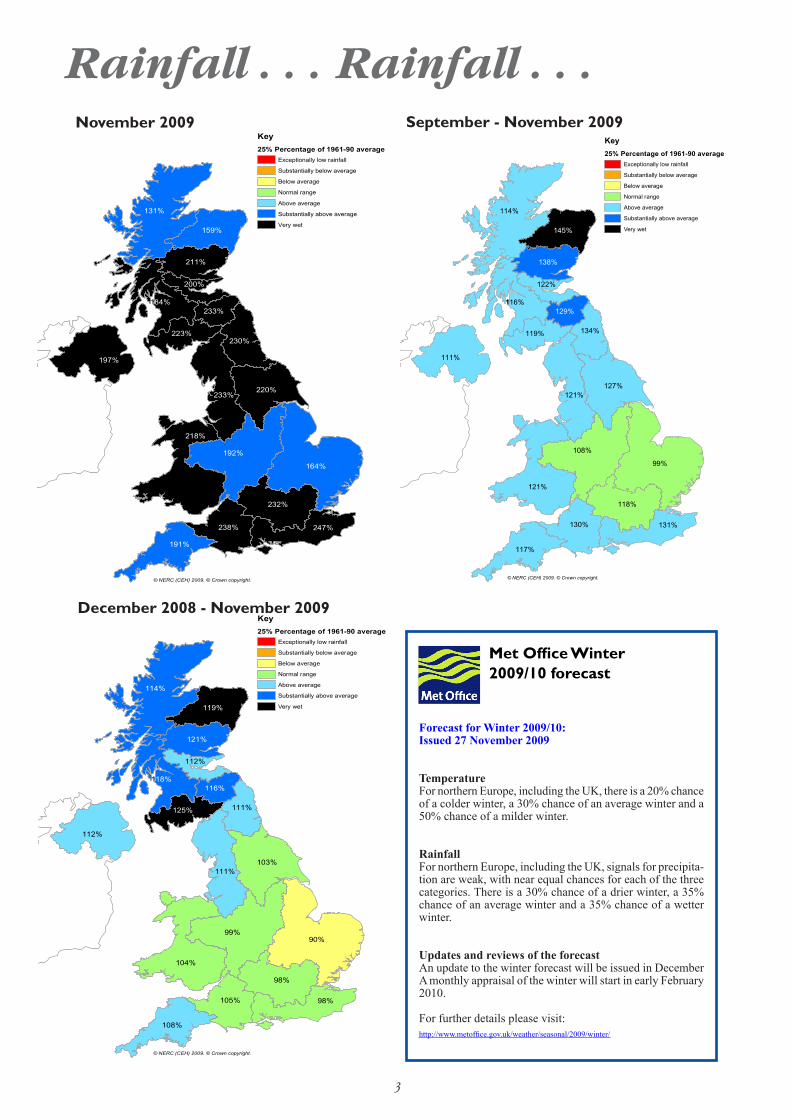
November was a singular month in hydrological terms; it was notably warm but with very boisterous weather condi-tions and exceptionally high rainfall across most of the country. The UK registered its wettest November on record (in a series from 1914) and, more remarkably, a new 24-hr maximum rainfall for the UK was established in the Lake District. Severe flooding affected Cumbria and parts of Scotland and floodplain inundations were both common and widespread. The sustained high runoff rates generated an exceptionally high (>10%) monthly increase in overall reservoir stocks for England & Wales, leaving them at their 4th highest early-December level in a series from 1988. Below average early-winter stocks in index reservoirs are restricted to a few reservoirs in the English Lowlands (e.g. Rutland and Bewl). November runoff totals exceeded previous maxima in many catchments and, with soil moisture deficits rapidly eliminated, the belated seasonal onset of aquifer recharge gathered considerable momentum through the month; some dramatic increases in groundwater levels were reported. Entering the winter, the water resources outlook is notably healthy in almost all regions but, with catchments generally saturated, many river basins are very vulnerable to further significant rainfall. RainfallIn contrast to much of 2009, November saw a relentless sequence of low pressure systems crossing the British Isles. The persistently cyclonic conditions resulted in rainfall on all but 2 or 3 days in most regions and in mid-month a near-stationary weather system allowed an exceptionally warm and moist subtropical airflow to track SSW-NNE across parts of the UK. This, together with substantial orographic enhancement, produced many storm totals of >50mm and culminated in extreme rainfall totals across high ground in the Lake District. A new UK 24-hr record was established at Seathwaite Farm, Borrowdale with 316.4mm up to 00:00 on the 20th ( provisional return period 2000 years); the site also recorded remarkable totals of 402mm over 37 hrs and 495mm over 4 raindays (provisionally 4000 & 3000 years). Apart from the far north-west of Scotland, November rainfall totals exceeded the average, commonly by wide margins and many individual raingauge totals were out-standing. Existing monthly rainfall maxima were widely eclipsed e.g. Inveruglas (Strathclyde) notched 561.4mm and Glencaple (Dumfries & Galloway) exceeded, by 80mm, its previous maximum for any month in a 45-yr series. The exceptional late autumn rainfall considerably moderated medium and long term rainfall deficiencies: regional rainfall totals for the last 12 months are in the normal range across England & Wales, and considerably above average for Northern Ireland and Scotland.
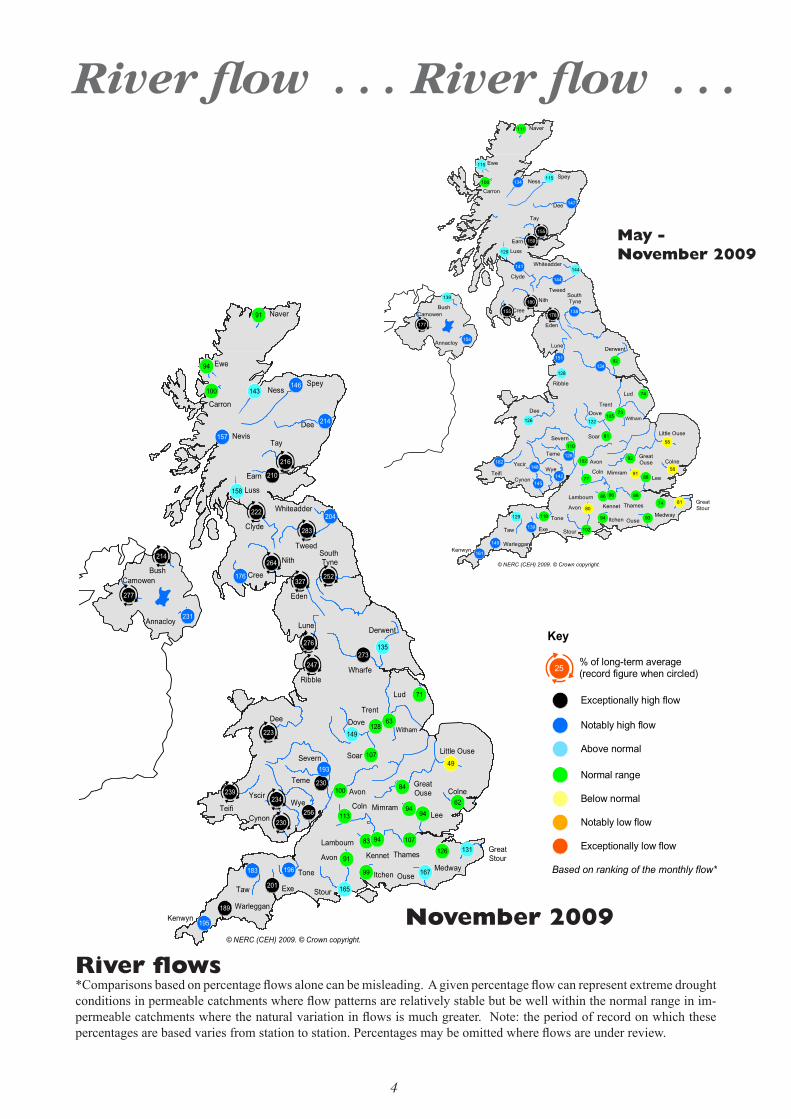
River flowsMany responsive rivers remained in spate for much of November with an associated high flood risk across a substantial proportion of the country. Early in the month a rotating low pressure system caused gales and wide-spread flooding across Banff and Aberdeenshire (e.g. in Huntly and Stonehaven). The peak flow on the Deveron (at Muiresk) exceeded its previous maximum (registered in September) in a 50-yr record. By the third week, brisk (but seasonally-late) runoff recoveries were well estab-lished across the English Lowlands in both responsive and groundwater-fed streams; there were a few exceptions e.g. in East Anglia. Over the latter half of November flood warnings were very widespread. With catchments saturated and most responsive rivers in high spate, the extreme rainfall over the 17-20th triggered a devastating flood episode in Cumbria (and extending into south west
Scotland). Many rivers in the Lake District (including the Derwent, Cocker and St Johns Beck) exceeded their previous maximum flow by a wide margin as did outflows from Windermere (in a 70-year series). Very exceptional flows were also reported in a broad band from north Wales to well into Scotland; the Nith eclipsed its previous No-vember maximum in a 53-year series. Flooding was also severe in Northern Ireland (Lough Earn spilled causing extensive agricultural flooding). Floodplain inundations were both extensive and sustained with very severe im-pacts on communities (Cockermouth and Workington particularly). Collapsed bridges and landslips contributed to severe transport disruption (services on the West Coast Main Line were briefly suspended). The November out-flows for the UK were the highest on record (in a series from 1961) and index rivers eclipsing previous November runoff maxima show a very wide distribution. Runoff accumulations, relatively depressed throughout much of 2009 in southern Britain, are now – for the year thus far – generally within, or above, average.
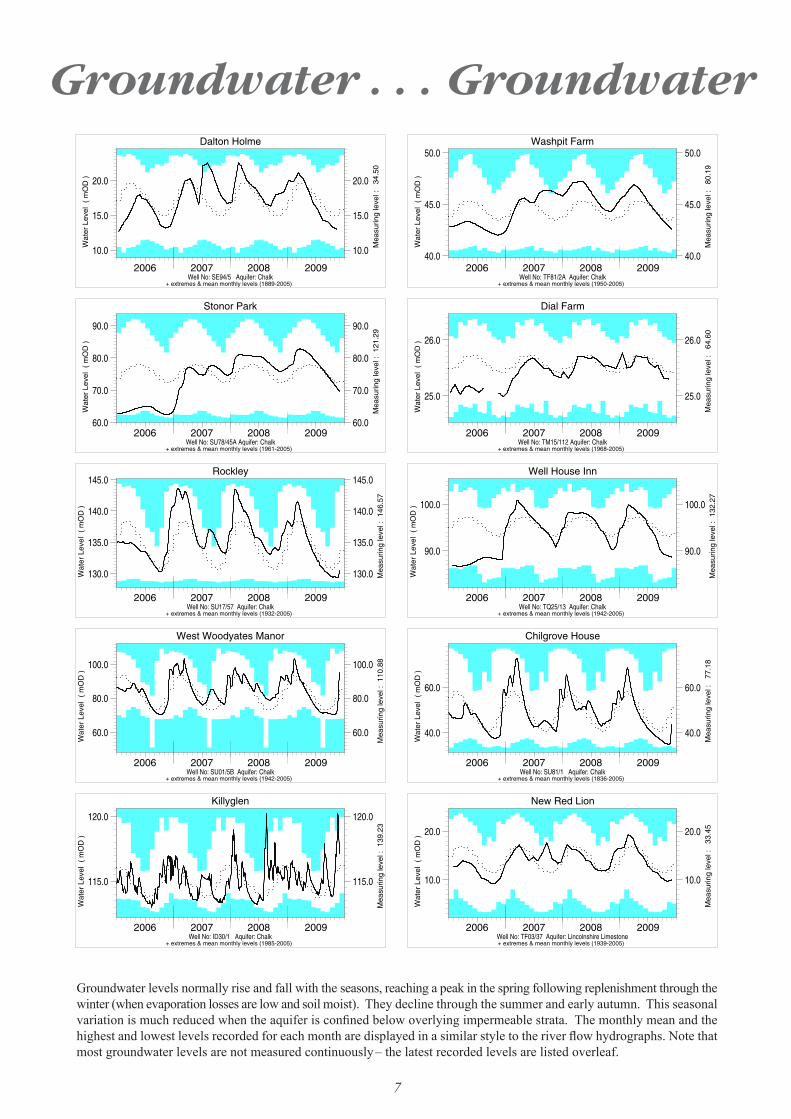
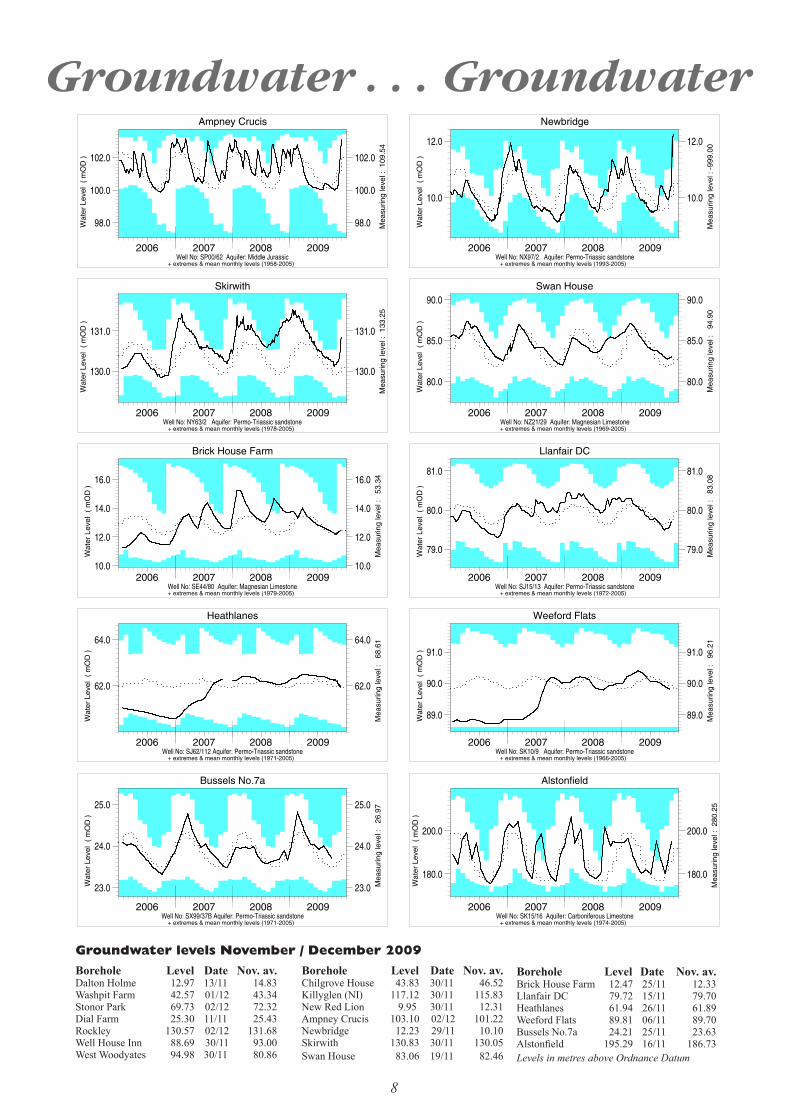
GroundwaterAfter meagre recharge since the early spring of 2009 in lowland aquifers, the sustained November rainfall eliminated residual soil moisture deficits in most areas and abundant infiltration characterised the latter half of the month, continuing into December. The recording schedules for the index boreholes (and the time taken for recharge to traverse the unsaturated zone) means that the groundwater level response is not captured in some of the featured hydrographs. Nonetheless, exceptionally steep groundwater level recoveries were recorded in parts of the southern Chalk (see, for example, the West Woodyates and Chilgrove hydrographs). This pattern is replicated in most of the index limestone wells which reported late in the month – see the hydrograph for Ampney Crucis in the Jurassic Limestone of the Cotswolds. In south west Scotland, the exceptional November rainfall resulted in the highest recorded level at the Newbridge borehole in a 16-yr series. The full effect of the late-autumn infiltration will not be evident until later in the year but the outstand-ing late-autumn recharge has transformed the general groundwater resources outlook; strong groundwater level recoveries are now well established across most major aquifer outcrop areas.
2
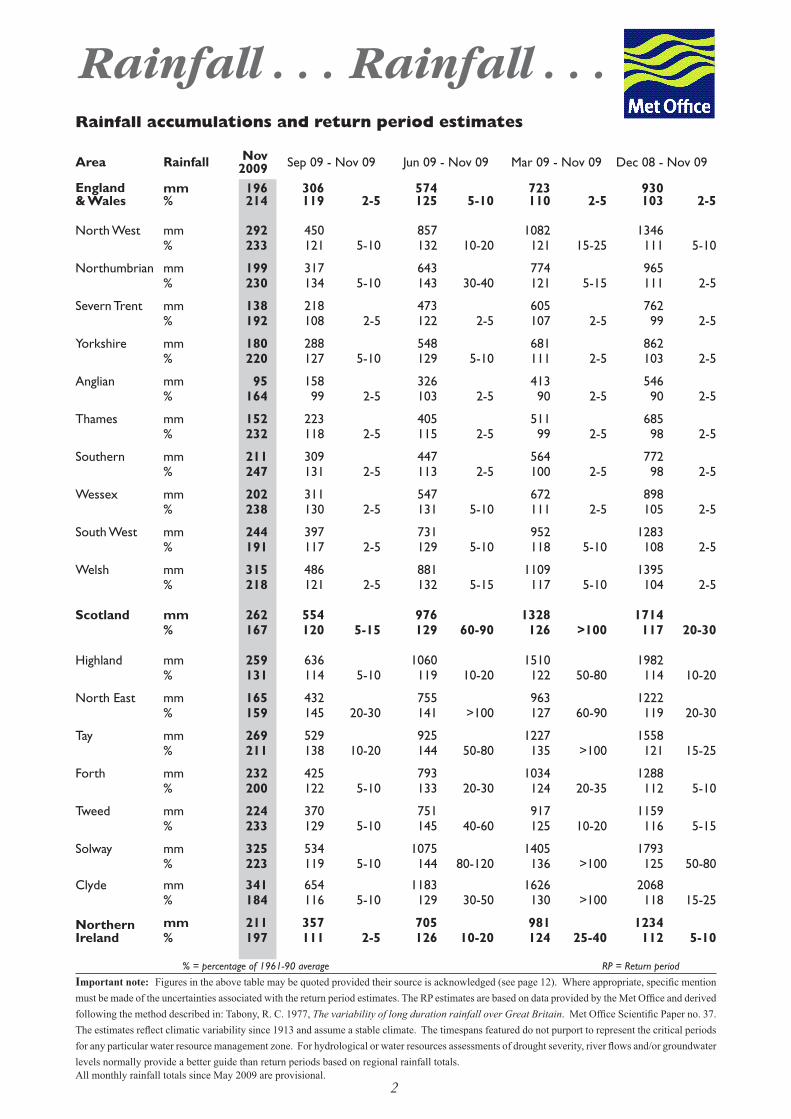
Area Rainfall Nov 2009 Sep 09 - Nov 09 Jun 09 - Nov 09 Mar 09 - Nov 09 Dec 08 - Nov 09
England & Wales
mm 196 306 574 723 930 % 214 119 2-5 125 5-10 110 2-5 103 2-5
North West mm 292 450 857 1082 1346 % 233 121 5-10 132 10-20 121 15-25 111 5-10
Northumbrian mm 199 317 643 774 965 % 230 134 5-10 143 30-40 121 5-15 111 2-5
Severn Trent mm 138 218 473 605 762 % 192 108 2-5 122 2-5 107 2-5 99 2-5
Yorkshire mm 180 288 548 681 862 % 220 127 5-10 129 5-10 111 2-5 103 2-5
Anglian mm 95 158 326 413 546 % 164 99 2-5 103 2-5 90 2-5 90 2-5
Thames mm 152 223 405 511 685 % 232 118 2-5 115 2-5 99 2-5 98 2-5
Southern mm 211 309 447 564 772 % 247 131 2-5 113 2-5 100 2-5 98 2-5
Wessex mm 202 311 547 672 898 % 238 130 2-5 131 5-10 111 2-5 105 2-5
South West mm 244 397 731 952 1283 % 191 117 2-5 129 5-10 118 5-10 108 2-5
Welsh mm 315 486 881 1109 1395 % 218 121 2-5 132 5-15 117 5-10 104 2-5
Scotland mm 262 554 976 1328 1714 % 167 120 5-15 129 60-90 126 >100 117 20-30
Highland mm 259 636 1060 1510 1982 % 131 114 5-10 119 10-20 122 50-80 114 10-20
North East mm 165 432 755 963 1222 % 159 145 20-30 141 >100 127 60-90 119 20-30
Tay mm 269 529 925 1227 1558 % 211 138 10-20 144 50-80 135 >100 121 15-25
Forth mm 232 425 793 1034 1288 % 200 122 5-10 133 20-30 124 20-35 112 5-10
Tweed mm 224 370 751 917 1159 % 233 129 5-10 145 40-60 125 10-20 116 5-15
Solway mm 325 534 1075 1405 1793 % 223 119 5-10 144 80-120 136 >100 125 50-80
Clyde mm 341 654 1183 1626 2068 % 184 116 5-10 129 30-50 130 >100 118 15-25
Northern Ireland
mm 211 357 705 981 1234 % 197 111 2-5 126 10-20 124 25-40 112 5-10
Rainfall . . . Rainfall . . . Rainfall accumulations and return period estimates
% = percentage of 1961-90 average RP = Return period
Important note: Figures in the above table may be quoted provided their source is acknowledged (see page 12). Where appropriate, specific mention must be made of the uncertainties associated with the return period estimates. The RP estimates are based on data provided by the Met Office and derived following the method described in: Tabony, R. C. 1977, The variability of long duration rainfall over Great Britain. Met Office Scientific Paper no. 37. The estimates reflect climatic variability since 1913 and assume a stable climate. The timespans featured do not purport to represent the critical periods for any particular water resource management zone. For hydrological or water resources assessments of drought severity, river flows and/or groundwater levels normally provide a better guide than return periods based on regional rainfall totals. All monthly rainfall totals since May 2009 are provisional.
3
99%
108%
118%
121%
127%121%
111%
117%
131%130%
114%
116%
119% 134%
122%
138%
129%
145%
Key
25% Percentage of 1961-90 average
Exceptionally low rainfall
Substantially below average
Below average
Normal range
Above average
Substantially above average
Very wet
© NERC (CEH) 2009. © Crown copyright.
1
164%
192%
191%
131%
159%
218%
233%
197%
220%
247%238%
232%
184%
230%
211%
223%
200%
233%
Key
25% Percentage of 1961-90 average
Exceptionally low rainfall
Substantially below average
Below average
Normal range
Above average
Substantially above average
Very wet
© NERC (CEH) 2009. © Crown copyright.
1
90%99%
104%
98%
103%
98%105%
111%
112%
108%
111%
112%
114%
118%
121%
116%
119%
125%
Key
25% Percentage of 1961-90 average
Exceptionally low rainfall
Substantially below average
Below average
Normal range
Above average
Substantially above average
Very wet
© NERC (CEH) 2009. © Crown copyright.
1
Rainfall . . . Rainfall . . . Rainfall . . . Rainfall . . .November 2009 September - November 2009
Met Office Winter2009/10 forecast
Forecast for Winter 2009/10: Issued 27 November 2009
TemperatureFor northern Europe, including the UK, there is a 20% chance of a colder winter, a 30% chance of an average winter and a 50% chance of a milder winter.
RainfallFor northern Europe, including the UK, signals for precipita-tion are weak, with near equal chances for each of the three categories. There is a 30% chance of a drier winter, a 35% chance of an average winter and a 35% chance of a wetter winter.
Updates and reviews of the forecast An update to the winter forecast will be issued in December A monthly appraisal of the winter will start in early February 2010.
For further details please visit:http://www.metoffice.gov.uk/weather/seasonal/2009/winter/
December 2008 - November 2009
4
58
58
8180
91
92
73
74
81
92
94 93
77 88
86 86
7486
105
110
111
106
102
118
102
144
122
139
115
115
129
126
129
128
154
144
128
138
134
147
134
151
161
139
149
162
145
148
141
142
159
155
177
178155
180
Naver
NessSpey
Ewe
Dee
Tay
Tweed
Luss
Carron
Earn
Whiteadder
Clyde
Cree
South Tyne
Derwent
Eden
Lune
Dee Dove
Trent
Lud
Soar
Witham
GreatOuse
Little Ouse
GreatStour
Stour
Itchen
Lambourn
Teifi
Yscir
Cynon
Teme
Severn
Coln
Tone
Taw Exe
Avon
Ouse
Thames
Mimram
Colne
WarlegganKenwyn
Bush
Annacloy
Camowen
© NERC (CEH) 2009. © Crown copyright.
Lee
Kennet
Medway
Wye
Ribble
Nith
Avon
49
62
84
63
71
91
94
99
91
9494
9483
128
107
100
113
107
100
126
149
135
143
167
131
165
158
231
204
193
214
157
146
195
196183
176
210
216
283
230
252
273
277
214
327
276
201
189
223
239
230
234
222
247
256
264
Naver
NessSpey
Ewe
Dee
TayNevis
Tweed
Luss
Carron
Earn
Whiteadder
Clyde
Cree
South Tyne
Derwent
Wharfe
Eden
Lune
Dee Dove
Trent
Lud
Soar
Witham
GreatOuse
Little Ouse
GreatStour
Stour
Itchen
Lambourn
Teifi
Yscir
Cynon
Teme
Severn
Coln
Tone
Taw Exe
Avon
Ouse
Thames
Mimram
Colne
Warleggan
Kenwyn
Bush
Annacloy
Camowen
© NERC (CEH) 2009. © Crown copyright.
Lee
Kennet
Medway
Wye
Ribble
Nith
Avon
Key
% of long-term average(record figure when circled)
!( Exceptionally low flow
!( Notably low flow
!( Exceptionally high flow
!( Below normal
!( Normal range
!( Notably high flow
!( Above normal
J25
Based on ranking of the monthly flow*
River flow . . . River flow . . . River flow . . . River flow . . .
River flows *Comparisons based on percentage flows alone can be misleading. A given percentage flow can represent extreme drought conditions in permeable catchments where flow patterns are relatively stable but be well within the normal range in im-permeable catchments where the natural variation in flows is much greater. Note: the period of record on which these percentages are based varies from station to station. Percentages may be omitted where flows are under review.
May - November 2009
November 2009
5
500
1000
2000
5000
10000
20000
50000
Jan Feb Mar Apr May Jun Jul Aug Sep Oct NovDec
m3 s-1
Gau
ged
Dis
char
ge
Great Britain 2008/2009
Station No: 600021 Daily mean flows+ extreme daily flows (1961 to 2009)
200
500
1000
2000
5000
10000
20000
Jan Feb Mar Apr May Jun Jul Aug Sep Oct NovDec
m3 s-1
Gau
ged
Dis
char
ge
England and Wales 2008/2009
Station No: 600041 Daily mean flows+ extreme daily flows (1961 to 2009)
200
500
1000
2000
5000
10000
20000
50000
Jan Feb Mar Apr May Jun Jul Aug Sep Oct NovDec
m3 s-1
Gau
ged
Dis
char
ge
Scotland 2008/2009
Station No: 600061 Daily mean flows+ extreme daily flows (1961 to 2009)
20
50
100
200
500
1000
2000
5000
Jan Feb Mar Apr May Jun Jul Aug Sep Oct NovDec
m3 s-1
Gau
ged
Dis
char
ge
Northern Ireland 2008/2009
Station No: 600081 Daily mean flows+ extreme daily flows (1980 to 2009)
1
2
5
10
20
50
100
200
500
Jan Feb Mar Apr May Jun Jul Aug Sep Oct NovDec
m3 s-1
Gau
ged
Dis
char
ge
Ewe at Poolewe 2008/2009
Station No: 094001 Daily mean flows+ extreme daily flows (1970 to 2009)
10
20
50
100
200
500
1000
2000
Jan Feb Mar Apr May Jun Jul Aug Sep Oct NovDec
m3 s-1
Gau
ged
Dis
char
ge
Tay at Ballathie 2008/2009
Station No: 015006 Daily mean flows+ extreme daily flows (1952 to 2009)
5
10
20
50
100
200
500
1000
Jan Feb Mar Apr May Jun Jul Aug Sep Oct NovDec
m3 s-1
Gau
ged
Dis
char
ge
Clyde at Daldowie 2008/2009
Station No: 084013 Daily mean flows+ extreme daily flows (1963 to 2009)
2
5
10
20
50
100
200
Jan Feb Mar Apr May Jun Jul Aug Sep Oct NovDec
m3 s-1
Gau
ged
Dis
char
ge
Derwent at Buttercrambe 2008/2009
Station No: 027041 Daily mean flows+ extreme daily flows (1973 to 2009)
0.2
0.5
1
2
5
10
20
50
100
200
Jan Feb Mar Apr May Jun Jul Aug Sep Oct NovDec
m3 s-1
Gau
ged
Dis
char
ge
Camowen at Camowen Terrace 2008/2009
Station No: 201005 Daily mean flows+ extreme daily flows (1972 to 2009)
0.2
0.5
1
2
5
10
20
50
100
Jan Feb Mar Apr May Jun Jul Aug Sep Oct NovDec
m3 s-1
Gau
ged
Dis
char
ge
Bush at Seneirl Bridge 2008/2009
Station No: 204001 Daily mean flows+ extreme daily flows (1972 to 2009)
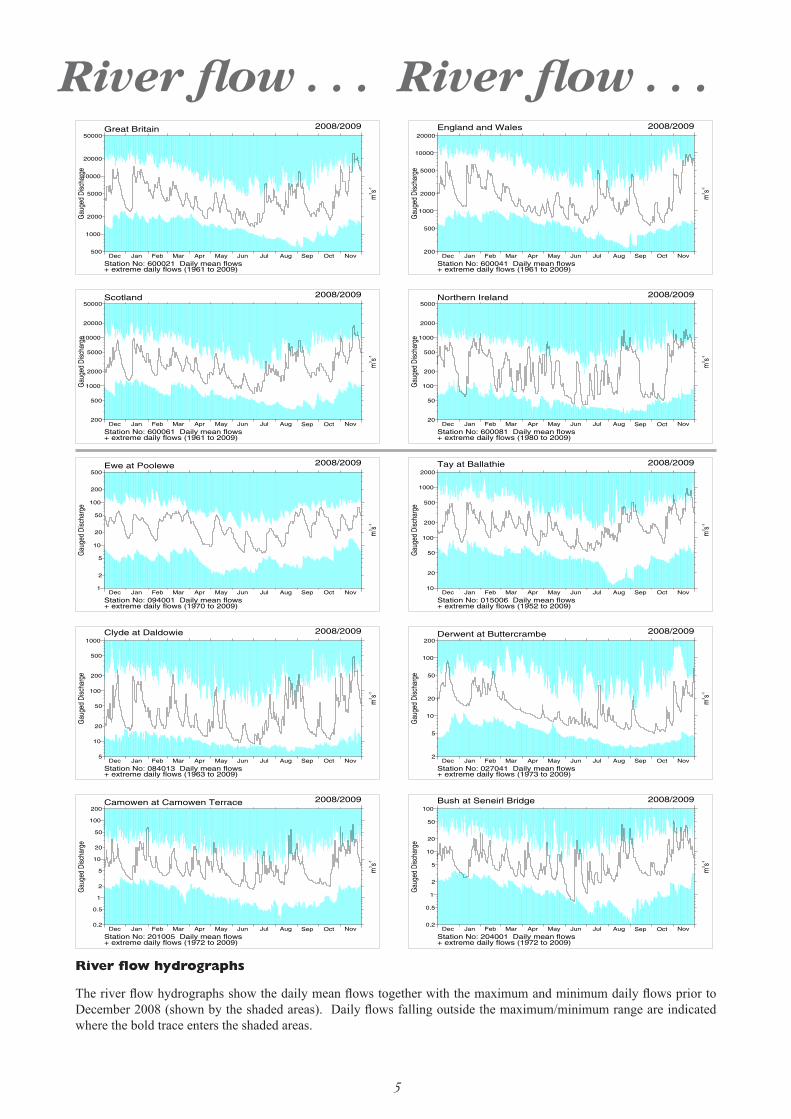
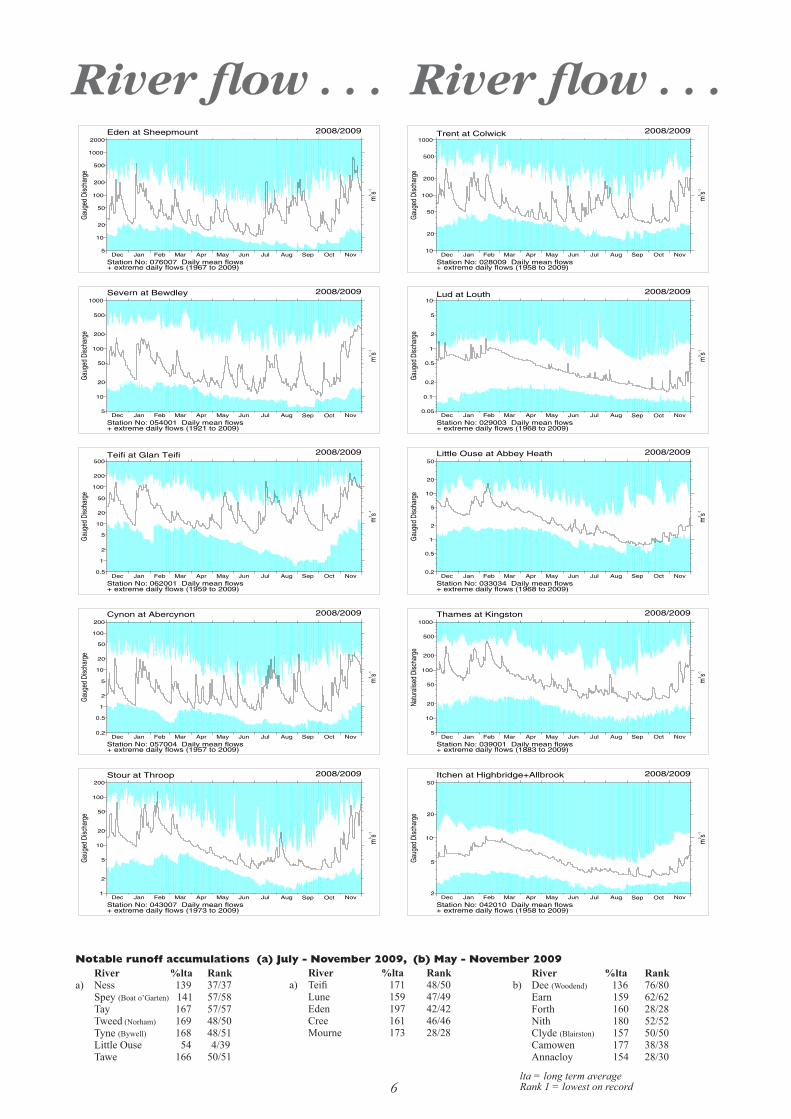
The river flow hydrographs show the daily mean flows together with the maximum and minimum daily flows prior to December 2008 (shown by the shaded areas). Daily flows falling outside the maximum/minimum range are indicated where the bold trace enters the shaded areas.
River flow hydrographs
River flow . . . River flow . . . River flow . . . River flow . . .
6
5
10
20
50
100
200
500
1000
2000
Jan Feb Mar Apr May Jun Jul Aug Sep Oct NovDec
m3 s-1
Gau
ged
Disc
harg
e
Eden at Sheepmount 2008/2009
Station No: 076007 Daily mean flows+ extreme daily flows (1967 to 2009)
10
20
50
100
200
500
1000
Jan Feb Mar Apr May Jun Jul Aug Sep Oct NovDec
m3 s-1
Gau
ged
Disc
harg
e
Trent at Colwick 2008/2009
Station No: 028009 Daily mean flows+ extreme daily flows (1958 to 2009)
5
10
20
50
100
200
500
1000
Jan Feb Mar Apr May Jun Jul Aug Sep Oct NovDec
m3 s-1
Gau
ged
Disc
harg
e
Severn at Bewdley 2008/2009
Station No: 054001 Daily mean flows+ extreme daily flows (1921 to 2009)
0.05
0.1
0.2
0.5
1
2
5
10
Jan Feb Mar Apr May Jun Jul Aug Sep Oct NovDec
m3 s-1
Gau
ged
Disc
harg
e
Lud at Louth 2008/2009
Station No: 029003 Daily mean flows+ extreme daily flows (1968 to 2009)
0.5
1
2
5
10
20
50
100
200
500
Jan Feb Mar Apr May Jun Jul Aug Sep Oct NovDec
m3 s-1
Gau
ged
Disc
harg
e
Teifi at Glan Teifi 2008/2009
Station No: 062001 Daily mean flows+ extreme daily flows (1959 to 2009)
0.2
0.5
1
2
5
10
20
50
Jan Feb Mar Apr May Jun Jul Aug Sep Oct NovDec
m3 s-1
Gau
ged
Disc
harg
e
Little Ouse at Abbey Heath 2008/2009
Station No: 033034 Daily mean flows+ extreme daily flows (1968 to 2009)
0.2
0.5
1
2
5
10
20
50
100
200
Jan Feb Mar Apr May Jun Jul Aug Sep Oct NovDec
m3 s-1
Gau
ged
Disc
harg
e
Cynon at Abercynon 2008/2009
Station No: 057004 Daily mean flows+ extreme daily flows (1957 to 2009)
5
10
20
50
100
200
500
1000
Jan Feb Mar Apr May Jun Jul Aug Sep Oct NovDec
m3 s-1
Natu
ralis
ed D
ischa
rge
Thames at Kingston 2008/2009
Station No: 039001 Daily mean flows+ extreme daily flows (1883 to 2009)
1
2
5
10
20
50
100
200
Jan Feb Mar Apr May Jun Jul Aug Sep Oct NovDec
m3 s-1
Gau
ged
Disc
harg
e
Stour at Throop 2008/2009
Station No: 043007 Daily mean flows+ extreme daily flows (1973 to 2009)
2
5
10
20
50
Jan Feb Mar Apr May Jun Jul Aug Sep Oct NovDec
m3 s-1
Gau
ged
Disc
harg
e
Itchen at Highbridge+Allbrook 2008/2009
Station No: 042010 Daily mean flows+ extreme daily flows (1958 to 2009)
lta = long term averageRank 1 = lowest on record
River flow . . . River flow . . .
Notable runoff accumulations (a) July - November 2009, (b) May - November 2009 River %lta Rank b) Dee (Woodend) 136 76/80 Earn 159 62/62 Forth 160 28/28 Nith 180 52/52 Clyde (Blairston) 157 50/50 Camowen 177 38/38 Annacloy 154 28/30
River %lta Rank a) Teifi 171 48/50 Lune 159 47/49 Eden 197 42/42 Cree 161 46/46 Mourne 173 28/28
River %lta Rank a) Ness 139 37/37 Spey (Boat o’Garten) 141 57/58 Tay 167 57/57 Tweed (Norham) 169 48/50 Tyne (Bywell) 168 48/51 Little Ouse 54 4/39 Tawe 166 50/51
7
Dalton Holme
Well No: SE94/5 Aquifer: Chalk+ extremes & mean monthly levels (1889-2005)
2006 2007 2008 2009
10.0
15.0
20.0
Wat
er L
evel
( m
OD
)
10.0
15.0
20.0
Mea
surin
g le
vel :
34
.50
Washpit Farm
Well No: TF81/2A Aquifer: Chalk+ extremes & mean monthly levels (1950-2005)
2006 2007 2008 200940.0
45.0
50.0
Wat
er L
evel
( m
OD
)
40.0
45.0
50.0
Mea
surin
g le
vel :
80
.19
Stonor Park
Well No: SU78/45A Aquifer: Chalk+ extremes & mean monthly levels (1961-2005)
2006 2007 2008 200960.0
70.0
80.0
90.0
Wat
er L
evel
( m
OD
)
60.0
70.0
80.0
90.0
Mea
surin
g le
vel :
121
.29
Dial Farm
Well No: TM15/112 Aquifer: Chalk+ extremes & mean monthly levels (1968-2005)
2006 2007 2008 2009
25.0
26.0
Wat
er L
evel
( m
OD
)
25.0
26.0
Mea
surin
g le
vel :
64
.60
Rockley
Well No: SU17/57 Aquifer: Chalk+ extremes & mean monthly levels (1932-2005)
2006 2007 2008 2009
130.0
135.0
140.0
145.0
Wat
er L
evel
( m
OD
)
130.0
135.0
140.0
145.0
Mea
surin
g le
vel :
146
.57
Well House Inn
Well No: TQ25/13 Aquifer: Chalk+ extremes & mean monthly levels (1942-2005)
2006 2007 2008 2009
90.0
100.0
Wat
er L
evel
( m
OD
)
90.0
100.0
Mea
surin
g le
vel :
132
.27
West Woodyates Manor
Well No: SU01/5B Aquifer: Chalk+ extremes & mean monthly levels (1942-2005)
2006 2007 2008 2009
60.0
80.0
100.0
Wat
er L
evel
( m
OD
)
60.0
80.0
100.0
Mea
surin
g le
vel :
110
.88
Chilgrove House
Well No: SU81/1 Aquifer: Chalk+ extremes & mean monthly levels (1836-2005)
2006 2007 2008 2009
40.0
60.0
Wat
er L
evel
( m
OD
)
40.0
60.0
Mea
surin
g le
vel :
77
.18
Killyglen
Well No: ID30/1 Aquifer: Chalk+ extremes & mean monthly levels (1985-2005)
2006 2007 2008 2009
115.0
120.0
Wat
er L
evel
( m
OD
)
115.0
120.0
Mea
surin
g le
vel :
139
.23
New Red Lion
Well No: TF03/37 Aquifer: Lincolnshire Limestone+ extremes & mean monthly levels (1939-2005)
2006 2007 2008 2009
10.0
20.0
Wat
er L
evel
( m
OD
)
10.0
20.0
Mea
surin
g le
vel :
33
.45
Groundwater levels normally rise and fall with the seasons, reaching a peak in the spring following replenishment through the winter (when evaporation losses are low and soil moist). They decline through the summer and early autumn. This seasonal variation is much reduced when the aquifer is confined below overlying impermeable strata. The monthly mean and the highest and lowest levels recorded for each month are displayed in a similar style to the river flow hydrographs. Note that most groundwater levels are not measured continuously – the latest recorded levels are listed overleaf.
Groundwater . . . Groundwater
8
Ampney Crucis
Well No: SP00/62 Aquifer: Middle Jurassic+ extremes & mean monthly levels (1958-2005)
2006 2007 2008 2009
98.0
100.0
102.0
Wat
er L
evel
( m
OD
)
98.0
100.0
102.0
Mea
surin
g le
vel :
109
.54
Newbridge
Well No: NX97/2 Aquifer: Permo-Triassic sandstone+ extremes & mean monthly levels (1993-2005)
2006 2007 2008 2009
10.0
12.0
Wat
er L
evel
( m
OD
)
10.0
12.0
Mea
surin
g le
vel :
-99
9.00
Skirwith
Well No: NY63/2 Aquifer: Permo-Triassic sandstone+ extremes & mean monthly levels (1978-2005)
2006 2007 2008 2009
130.0
131.0
Wat
er L
evel
( m
OD
)
130.0
131.0
Mea
surin
g le
vel :
133
.25
Swan House
Well No: NZ21/29 Aquifer: Magnesian Limestone+ extremes & mean monthly levels (1969-2005)
2006 2007 2008 2009
80.0
85.0
90.0
Wat
er L
evel
( m
OD
)
80.0
85.0
90.0
Mea
surin
g le
vel :
94
.90
Brick House Farm
Well No: SE44/80 Aquifer: Magnesian Limestone+ extremes & mean monthly levels (1979-2005)
2006 2007 2008 200910.0
12.0
14.0
16.0
Wat
er L
evel
( m
OD
)
10.0
12.0
14.0
16.0
Mea
surin
g le
vel :
53
.34
Llanfair DC
Well No: SJ15/13 Aquifer: Permo-Triassic sandstone+ extremes & mean monthly levels (1972-2005)
2006 2007 2008 2009
79.0
80.0
81.0
Wat
er L
evel
( m
OD
)
79.0
80.0
81.0
Mea
surin
g le
vel :
83
.08
Heathlanes
Well No: SJ62/112 Aquifer: Permo-Triassic sandstone+ extremes & mean monthly levels (1971-2005)
2006 2007 2008 2009
62.0
64.0
Wat
er L
evel
( m
OD
)
62.0
64.0
Mea
surin
g le
vel :
68
.61
Weeford Flats
Well No: SK10/9 Aquifer: Permo-Triassic sandstone+ extremes & mean monthly levels (1966-2005)
2006 2007 2008 2009
89.0
90.0
91.0
Wat
er L
evel
( m
OD
)
89.0
90.0
91.0
Mea
surin
g le
vel :
96
.21
Bussels No.7a
Well No: SX99/37B Aquifer: Permo-Triassic sandstone+ extremes & mean monthly levels (1971-2005)
2006 2007 2008 2009
23.0
24.0
25.0
Wat
er L
evel
( m
OD
)
23.0
24.0
25.0
Mea
surin
g le
vel :
26
.97
Alstonfield
Well No: SK15/16 Aquifer: Carboniferous Limestone+ extremes & mean monthly levels (1974-2005)
2006 2007 2008 2009
180.0
200.0
Wat
er L
evel
( m
OD
)
180.0
200.0
Mea
surin
g le
vel :
280
.25
Borehole Level Date Nov. av.Brick House Farm 12.47 25/11 12.33Llanfair DC 79.72 15/11 79.70Heathlanes 61.94 26/11 61.89Weeford Flats 89.81 06/11 89.70Bussels No.7a 24.21 25/11 23.63Alstonfield 195.29 16/11 186.73
Groundwater . . . Groundwater
Borehole Level Date Nov. av.Dalton Holme 12.97 13/11 14.83Washpit Farm 42.57 01/12 43.34Stonor Park 69.73 02/12 72.32Dial Farm 25.30 11/11 25.43Rockley 130.57 02/12 131.68Well House Inn 88.69 30/11 93.00West Woodyates 94.98 30/11 80.86
Borehole Level Date Nov. av.Chilgrove House 43.83 30/11 46.52Killyglen (NI) 117.12 30/11 115.83New Red Lion 9.95 30/11 12.31Ampney Crucis 103.10 02/12 101.22Newbridge 12.23 29/11 10.10Skirwith 130.83 30/11 130.05Swan House 83.06 19/11 82.46
Groundwater levels November / December 2009
Levels in metres above Ordnance Datum
9
7/669/38
6/38
13/46
11/45
14/49
22/121
20/31
27/41
16/30
10/31
15/41
26/36
18/36
27/41
24/44
21/38
21/3746/68
38/77
17/58
93/17450/115
55/120
31/36
21/25
24/26
58/64
32/34
17/17
38/39
50/51
Key
Newbridge
SwanHouse
Skirwith
Killyglen
DaltonHolme
Wetwang
Yew TreeFarm
LlanfairD.C.
NuttallsFarm
Weeford Flats New Red Lion
WashpitFarm
Alstonfield
Heathlanes
AmpneyCrucis
StonorPark
TherfieldRectory
RedlandsHall
Dial Farm
LittleBucketFarm
Chilgrove House
Westdean No 3
ComptonHouse
AshtonFarm
WestWoodyatesManor
BusselsNo 7A
Rockley
LimeKilnWay
Aylesby
Monthly rank/Period of record(record figure when circled)1/25
Exceptionally low levels
Notably low levels
Exceptionally high levels
Significantly below average
Normal range
Notably high levels
Significantly above average
Brick HouseFarm
Aquifer
Chalk
Jurassic limestones
Magnesian Limestone
Permo-Triassic sandstones
Houndean
WellHouse
InnTilshead
1
© NERC 2009. © Crown copyright.
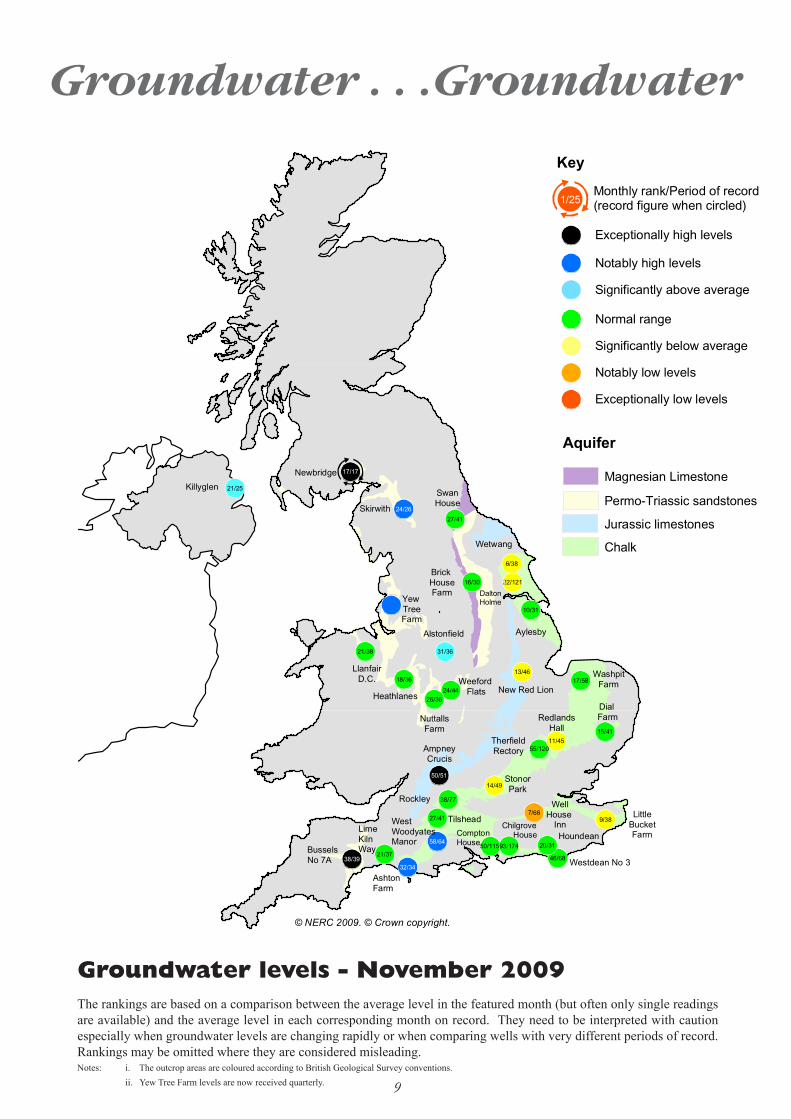
Groundwater levels - November 2009 The rankings are based on a comparison between the average level in the featured month (but often only single readings are available) and the average level in each corresponding month on record. They need to be interpreted with caution especially when groundwater levels are changing rapidly or when comparing wells with very different periods of record. Rankings may be omitted where they are considered misleading.Notes: i. The outcrop areas are coloured according to British Geological Survey conventions. ii. Yew Tree Farm levels are now received quarterly.
Groundwater . . .Groundwater
10
1999 2000 2001 2002 2003 2004 2005 2006 2007 2008 2009−25
−20
−15
−10
−5
0
5
10
15
20
25
% d
evn.
from
198
8−20
08 m
onth
ly m
ean
Dec Jan Feb Mar Apr May Jun Jul Aug Sep Oct Nov40
50
60
70
80
90
100
Per
cent
age
live
capa
city
1988−2008 mean1995−19962000−20012007−20082008−2009
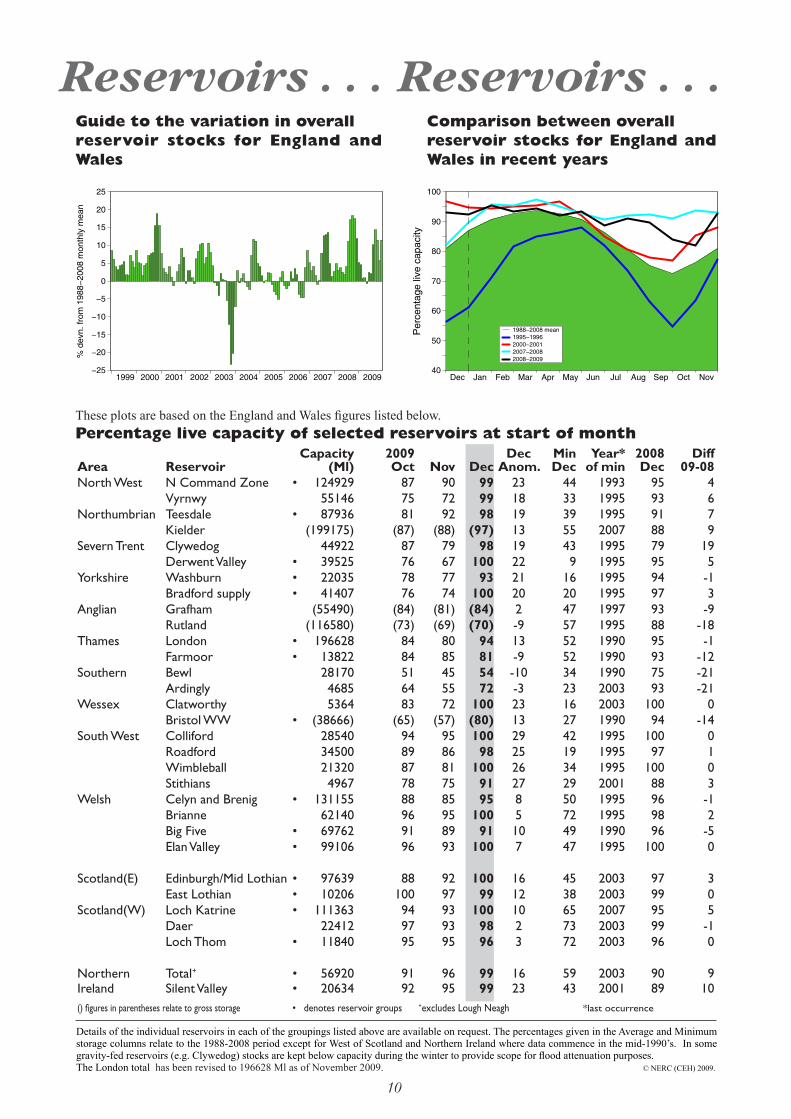
These plots are based on the England and Wales figures listed below.
Reservoirs . . . Reservoirs . . .
Details of the individual reservoirs in each of the groupings listed above are available on request. The percentages given in the Average and Minimum storage columns relate to the 1988-2008 period except for West of Scotland and Northern Ireland where data commence in the mid-1990’s. In some gravity-fed reservoirs (e.g. Clywedog) stocks are kept below capacity during the winter to provide scope for flood attenuation purposes. The London total has been revised to 196628 Ml as of November 2009. © NERC (CEH) 2009.
Guide to the variation in overall reservoir stocks for England and Wales
Comparison between overall reservoir stocks for England and Wales in recent years
Percentage live capacity of selected reservoirs at start of month
Area Reservoir
Capacity
(Ml)2009Oct Nov Dec
Dec Anom.
Min Dec
Year* of min
2008Dec
Diff 09-08
North West N Command Zone • 124929 87 90 99 23 44 1993 95 4 Vyrnwy 55146 75 72 99 18 33 1995 93 6Northumbrian Teesdale • 87936 81 92 98 19 39 1995 91 7 Kielder (199175) (87) (88) (97) 13 55 2007 88 9Severn Trent Clywedog 44922 87 79 98 19 43 1995 79 19 Derwent Valley • 39525 76 67 100 22 9 1995 95 5Yorkshire Washburn • 22035 78 77 93 21 16 1995 94 -1 Bradford supply • 41407 76 74 100 20 20 1995 97 3Anglian Grafham (55490) (84) (81) (84) 2 47 1997 93 -9 Rutland (116580) (73) (69) (70) -9 57 1995 88 -18Thames London • 196628 84 80 94 13 52 1990 95 -1 Farmoor • 13822 84 85 81 -9 52 1990 93 -12Southern Bewl 28170 51 45 54 -10 34 1990 75 -21
Ardingly 4685 64 55 72 -3 23 2003 93 -21Wessex Clatworthy 5364 83 72 100 23 16 2003 100 0 Bristol WW • (38666) (65) (57) (80) 13 27 1990 94 -14South West Colliford 28540 94 95 100 29 42 1995 100 0 Roadford 34500 89 86 98 25 19 1995 97 1 Wimbleball 21320 87 81 100 26 34 1995 100 0 Stithians 4967 78 75 91 27 29 2001 88 3Welsh Celyn and Brenig • 131155 88 85 95 8 50 1995 96 -1 Brianne 62140 96 95 100 5 72 1995 98 2 Big Five • 69762 91 89 91 10 49 1990 96 -5 Elan Valley • 99106 96 93 100 7 47 1995 100 0
Scotland(E) Edinburgh/Mid Lothian • 97639 88 92 100 16 45 2003 97 3 East Lothian • 10206 100 97 99 12 38 2003 99 0Scotland(W) Loch Katrine • 111363 94 93 100 10 65 2007 95 5
Daer 22412 97 93 98 2 73 2003 99 -1 Loch Thom • 11840 95 95 96 3 72 2003 96 0
Northern Total+ • 56920 91 96 99 16 59 2003 90 9Ireland Silent Valley • 20634 92 95 99 23 43 2001 89 10() figures in parentheses relate to gross storage • denotes reservoir groups +excludes Lough Neagh *last occurrence
11
1999 2000 2001 2002 2003 2004 2005 2006 2007 2008 2009−25
−20
−15
−10
−5
0
5
10
15
20
25
% d
evn.
from
198
8−20
08 m
onth
ly m
ean
Dec Jan Feb Mar Apr May Jun Jul Aug Sep Oct Nov40
50
60
70
80
90
100
Per
cent
age
live
capa
city
1988−2008 mean1995−19962000−20012007−20082008−2009
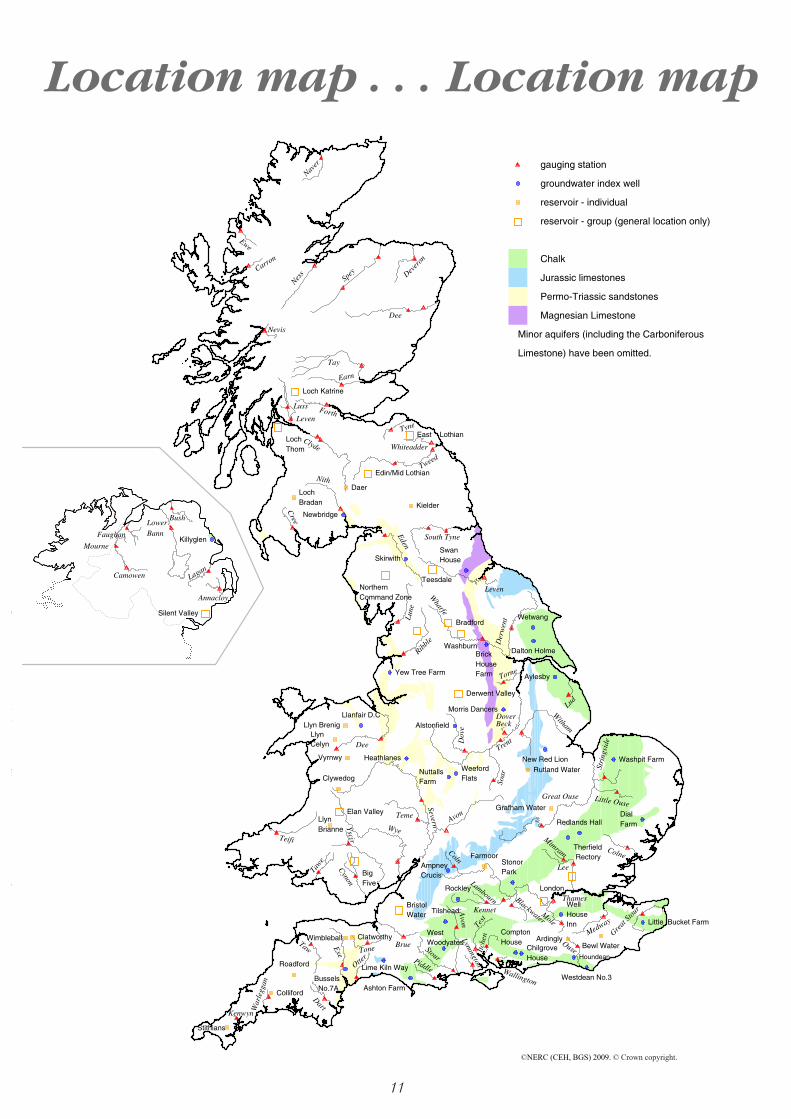
Location map . . . Location map
©NERC (CEH, BGS) 2009. © Crown copyright.
gauging station
groundwater index well
reservoir - individual
reservoir - group (general location only)
Chalk
Jurassic limestones
Permo-Triassic sandstones
Magnesian Limestone
Minor aquifers (including the Carboniferous
Limestone) have been omitted.
Dalton Holme
Wetwang
Washpit Farm
Therfield Rectory
Redlands Hall
Rockley
Little Bucket FarmComptonHouse
ChilgroveHouse
Westdean No.3Lime Kiln Way
Ashton Farm
WestWoodyates
New Red Lion
AmpneyCrucis
Yew Tree Farm
Llanfair D.CMorris Dancers
WeefordFlats
Skirwith
Newbridge
Bussels No.7A
SwanHouse
BrickHouseFarm
Alstonfield
Heathlanes
NuttallsFarm
DialFarm
StonorPark
Aylesby
WellHouseInn
Tilshead
Houndean
Vyrnwy
Kielder
Clywedog
Grafham Water
Rutland Water
Bewl WaterArdinglyClatworthy
Colliford
Roadford
Wimbleball
Stithians
LlynCelyn
Llyn Brenig
LlynBrianne
Farmoor
DaerLochBradan
Teesdale
Derwent Valley
East Lothian
Edin/Mid Lothian
NorthernCommand Zone
Bradford
Washburn
Elan Valley
BigFive
London
BristolWater
Loch Katrine
LochThom
Dee
Tay
Luss
Clyde Whiteadder
Tweed
Eden
South Tyne
Leven
Lune
Wharfe
Der
wen
t
Trent
Lud
Dee Dov
e
Witham
Soar
Severn
Teme
Yscir
Cynon
Coln
Great Ouse
Stri
ngsi
de
Little Ouse
Colne
Mimram
Lee
Thames
Mole
BlackwaterKennet
Brue
Medway
Great
Stou
r
OuseItch
en
StourPiddle
ToneExe
Taw
Kenwyn
Dart
Carron
EweW
arle
ggan
Avon
Cree
Spey
Earn
Teifi
Naver
Dever
on
Lambourn
Nith
Ness
Wye
Otter
Tawe
Wallington
Lymington
Test
Tyne
Torne
Avon
Leven
DoverBeck
Nevis
Ribbl
e
Forth
Killyglen
Silent Valley
Annacloy
Camowen
BushLowerBannFaughan
Mourne
Lagan
12
National Hydrological Monitoring Programme
The National Hydrological Monitoring Programme (NHMP) was instigated in 1988 and is undertaken jointly by the Centre for Ecology and Hydrology Wallingford (formerly the Institute of Hydrology - IH) and the Brit-ish Geological Survey (BGS). Financial support for the production of the monthly Hydrological Summaries is provided by the Department for Environment, Food and Rural Affairs (Defra), the Environment Agency (EA), the Scottish Environment Protection Agency (SEPA), the Rivers Agency (RA) in Northern Ireland, and the Office of Water Services (OFWAT).
Data SourcesRiver flow and groundwater level data are provided by the Environment Agency, the Environment Agency Wales, the Scottish Environment Protection Agency and, for Northern Ireland, the Rivers Agency and the Northern Ireland Environment Agency. In all cases the data are subject to revision following validation (flood and drought data in particular may be subject to significant revision).Reservoir level information is provided by the Water Service Companies, the EA, Scottish Water and Northern Ireland Water.
The National River Flow Archive (maintained by CEH Wallingford) and the National Groundwater Level Ar-chive (maintained by BGS) provide the historical perspec-tive within which to examine contemporary hydrological conditions.
Rainfall Most rainfall data are provided by the Met Office (see op-posite). To allow better spatial differentiation the rainfall data for Britain are presented for the regional divisions of the precursor organisations of the EA and SEPA. Follow-ing the discontinuation of the Met Office’s CARP system in July 1998, the areal rainfall figures have been derived using several procedures, including initial estimates based on MORECS*. Recent figures have been produced by the Met Office, National Climate Information Centre (NCIC), using a technique similar to CARP. A significant number of additional monthly raingauge totals are provided by the EA and SEPA to help derive the contemporary regional rainfalls. Revised monthly national and regional rainfall totals for the post-1960 period (together with revised 1961-90 averages) were made available by the Met Of-fice in 2004; these have been adopted by the NHMP. As with all regional figures based on limited raingauge networks the monthly tables and accumulations (and the return periods associated with them) should be regarded as a guide only.The monthly rainfall figures are provided by the Met Of-fice (National Climate Information Centre) and are Crown Copyright and may not be passed on to, or published by, any unauthorised person or organisation.
*MORECS is the generic name for the Met Office services involving the routine calculation of evaporation and soil moisture throughout Great Britain.
For further details please contact: The Met OfficeFitzRoy RoadExeterDevonEX1 3PB
Tel.: 0870 900 0100 Fax: 0870 900 5050E-mail: [email protected]
The National Hydrological Monitoring Programme depends on the active cooperation of many data suppli-ers. This cooperation is gratefully acknowledged; the November Summary, in particular, stands as a testament to the assistance provided by many hydrometric person-nel working in exceptionally challenging circumstances.
Subscription Subscription to the Hydrological Summaries costs £48 per year. Orders should be addressed to:
Hydrological SummariesCEH WallingfordMaclean BuildingCrowmarsh GiffordWallingfordOxfordshireOX10 8BB
Tel.: 01491 838800Fax: 01491 692424E-mail: [email protected]
Selected text and maps are available on the WWW at http://www.nerc-wallingford.ac.uk/ih/nrfa/index.htm Navigate via Water Watch
Some of the features displayed on the maps contained in this report are based on the following data with permission of the controller of HMSO.(i) Ordnance Survey data. © Crown copyright and/or da-tabase right 2005. Licence no. 100017897.(ii) Land and Property Services data. © Crown copyright and database right, S&LA 145. (iii) Met Office rainfall data. © Crown copyright. All rights reserved. Unauthorised reproduction infringes crown copyright and may lead to prosecution or civil proceedings.
Text and maps in this document are © NERC (CEH) 2009 unless otherwise stated and may not be reproduced without permission.
12/09