Embed Size (px)
Citation preview

Hydrological Summary for the United Kingdom
Nov
emb
er 2
01
7
GeneralNovember was another unsettled month, particularly in the west, with wintry conditions towards month-end in the east. At the national scale rainfall was moderately below average; only parts of northern Scotland, northern England and western Wales received above average rainfall. It was particularly dry in the Midlands, south-east England and central Scotland, with parts registering less than half the November average. Soil moisture deficits (SMDs) generally decreased across the UK during November, but at month-end soils were wetter than average in the north and drier than average in the south. River flows were generally in the normal range or below, despite the new November peak flow records established in the north-west. Flows were notably low in parts of southern England, with some catchments registering less than a third of the November average. Groundwater levels in the majority of index boreholes increased or remained stable during November, but levels remained substantially below normal across southern and eastern England. Reservoir stocks decreased relative to average at the majority of impoundments (markedly so at some, e.g. Clatworthy) but were near average at the national scale. Stocks were substantially below average at the London group (24% below) and Bewl registered the lowest November stocks on record (in a series from 1988). With limited recharge in the autumn, and depressed runoff in some parts of the south, the long-term water resources outlook will depend on rainfall over the winter and early spring. Given current groundwater levels, which reflect rainfall deficiencies built up over the last 12–18 months, appreciably above average winter rainfall will be needed to return conditions to the normal range in parts of the English Lowlands. Conversely, a continuation of the dry weather, amounting to a second successive dry winter, would increase the potential for environmental and water resources stress in 2018.
RainfallIn the north and west November was dominated by westerly airflows bringing unsettled weather with dry, sunny (and sometimes mild) periods in between. Following a settled start to November in the south, the weather turned autumnal, although most frontal systems made little impression on the monthly rainfall totals. On the 22nd a deep low pressure system brought heavy rainfall to northern and western Britain (74mm was recorded at Hazelrigg, Lancashire). More than 70 people were rescued from their homes in Lancashire, rail services were disrupted in north Wales and western England and more than 500 properties lost power in the Blackpool area. A northerly airflow brought colder temperatures to the UK in the last week with snow settling on higher ground. On the 29th/30th, snow settled on lower ground in eastern counties of the UK with a snow depth of 10cm recorded at Fettercairn (Aberdeenshire). November rainfall was moderately below average for the UK as a whole (91%), with less than 70% registered in large parts of southern and eastern England, the Midlands and central Scotland. In contrast, more than 150% was registered in localised areas of north-west England, western Wales and northern Scotland. Despite the wet start, autumn (September-November) rainfall was near-average at the national scale but this masks the regional variations: Thames and Southern regions recorded less than 70% of long-term average rainfall, while the North West region recorded 125%. While the summer was damp for much of the UK, the dry autumn adds to notable long-term deficiencies which also reflect the dry conditions from late summer 2016 to late spring 2017.
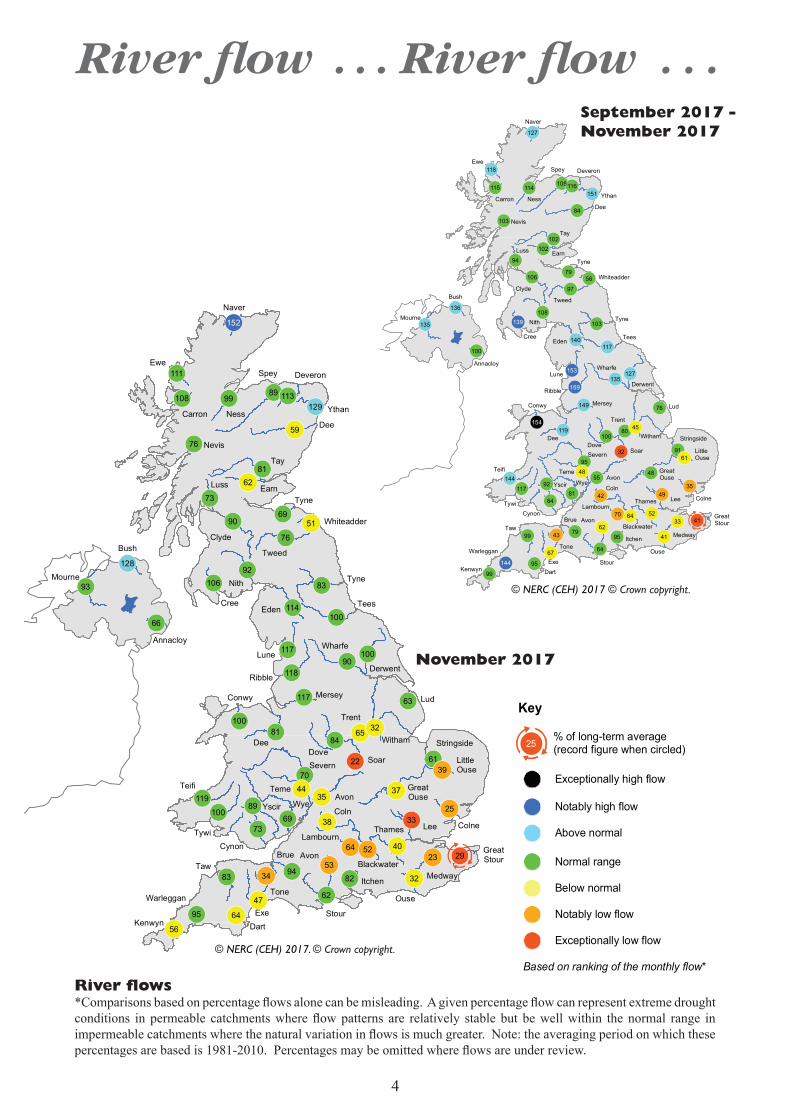
River flowsWith continuing dry weather in the south-east, flows in the more slowly responding catchments remained below average throughout November. In some groundwater-fed rivers in the Chalk, the stream network is significantly more contracted than usual for the time of year. In contrast, November flows in the north and west were characterised by moderate spates, with new daily flow maxima set in 18 catchments. Flood alerts were issued in north Wales
and northern England on the 22nd/23rd, when 50 properties were flooded in Lancashire and roads were closed due to flooding. The Lune and Eden recorded their highest November peak flows (in series from 1968 and 1964, respectively), on the Eden exceeding those recorded in the regionally significant flooding episode of November 2009. Mean flows for November were largely in the normal range across Wales and northern Britain. In contrast, below normal flows dominated the English Lowlands, parts of the south-west and eastern Scotland. Flows were exceptionally low on the Great Stour, where a new minimum November average flow was recorded (in a series from 1964), and on the Lee, which recorded the lowest November monthly mean flow since 1945 (in a series from 1883). The dry autumn in south-east England has reinforced long-term river flow deficiencies which can now be traced back over the last 12-18 months.
GroundwaterAcross the major aquifer areas, SMDs decreased slightly during November but soils remained drier than average for the time of year, approaching or exceeding twice the average in some areas of south-east England. In the Chalk of East Anglia and southern England groundwater levels fell at half the index sites and were all in the normal range or below for the time of year, exceptionally so at Little Bucket Farm (which is dry). Elsewhere in the chalk levels were stable or continued to rise. Levels in the more rapidly responding Jurassic and Magnesian limestones generally fell and remained within the normal range, except at Ampney Crucis where a small rise was recorded but the level fell below the normal range for November. In the Permo-Triassic sandstones, levels were stable or rose and generally remained in the normal range or below (still notably so at Bussels No. 7a), with the exception of Newbridge where levels were notably high for the time of year (after four months of record high levels). Levels in the Carboniferous Limestone rose overall during November but remained within the normal range. At Royalty Observatory, levels in the Fell Sandstone were stable and are now in the normal range for the time of year.

2
Rainfall . . . Rainfall . . . Rainfall accumulations and return period estimatesPercentages are from the 1981-2010 average.
Region RainfallNov
2017Sep17 – Nov17 Jun17 – Nov17 Dec16 – Nov17 Jul16 – Nov17
RP RP RP RP
United mm 108 327 652 1091 1601Kingdom % 91 97 2-5 115 5-10 97 2-5 94 2-5England mm 69 217 473 781 1178
% 80 88 2-5 108 2-5 93 2-5 92 2-5Scotland mm 160 474 892 1520 2191
% 100 103 2-5 119 10-20 100 2-5 97 2-5Wales mm 157 442 829 1394 2014
% 100 102 2-5 116 5-10 98 2-5 94 2-5Northern mm 103 355 712 1116 1596Ireland % 92 110 2-5 123 10-20 98 2-5 93 2-5England & mm 81 248 522 866 1293Wales % 84 91 2-5 110 2-5 94 2-5 92 2-5
North West mm 143 457 848 1320 1947% 113 125 5-10 134 10-20 108 2-5 105 2-5
Northumbria mm 94 271 571 893 1333% 104 110 2-5 125 5-10 102 2-5 100 2-5
Severn-Trent mm 58 194 409 705 1090% 78 88 2-5 101 2-5 90 2-5 92 2-5
Yorkshire mm 68 238 531 827 1241% 81 103 2-5 123 5-10 98 2-5 97 2-5
Anglian mm 43 126 331 560 877% 72 71 5-10 97 2-5 90 2-5 91 2-5
Thames mm 50 144 357 615 932% 67 68 5-10 97 2-5 86 5-10 86 5-10
Southern mm 46 147 382 660 982% 51 59 8-12 94 2-5 83 5-10 81 8-12
Wessex mm 69 203 436 755 1120% 71 77 2-5 99 2-5 86 5-10 84 8-12
South West mm 96 310 619 1053 1542% 69 84 2-5 103 2-5 86 5-10 84 8-12
Welsh mm 148 415 786 1330 1926 % 98 99 2-5 114 2-5 97 2-5 94 2-5Highland mm 223 596 1031 1811 2576
% 115 109 2-5 120 10-15 100 2-5 96 2-5North East mm 127 329 643 1022 1554
% 115 104 2-5 119 5-10 101 2-5 100 2-5Tay mm 97 334 703 1199 1755
% 69 82 2-5 106 2-5 89 2-5 88 5-10Forth mm 76 281 685 1124 1615
% 64 79 2-5 113 5-10 93 2-5 89 2-5Tweed mm 80 267 625 1036 1527
% 77 90 2-5 118 5-10 101 2-5 98 2-5Solway mm 142 487 984 1596 2207
% 90 108 2-5 131 15-25 107 5-10 98 2-5Clyde mm 165 559 1072 1823 2628
% 87 101 2-5 118 8-12 100 2-5 96 2-5 % = percentage of 1981-2010 average RP = Return periodImportant note: Figures in the above table may be quoted provided their source is acknowledged (see page 12). Where appropriate, specific mention must be made of the uncertainties associated with the return period estimates. The RP estimates are based on data provided by the Met Office and reflect climatic variability since 1910; they also assume a stable climate. The quoted RPs relate to the specific timespans only; for the same timespans, but beginning in any month the RPs would be substantially shorter. The timespans featured do not purport to represent the critical periods for any particular water resource management zone. For hydrological or water resources assessments of drought severity, river flows and/or groundwater levels normally provide a better guide than return periods based on regional rainfall totals. Note that precipitation totals in winter months may be underestimated due to snowfall undercatch. All monthly rainfall totals since January 2017 are provisional.

Rainfall . . . Rainfall . . .
The Hydrological Outlook provides an insight into future hydrological conditions across the UK. Specifically it describes likely trajectories for river flows and groundwater levels on a monthly basis, with particular focus on the next three months.
The complete version of the Hydrological Outlook UK can be found at: www.hydoutuk.net/latest-outlook/
Period: from December 2017Issued: 12.12.2017 using data to the end of November 2017
In south-east England groundwater levels are likely to be below normal, and potentially exceptionally low in places, during December and for the next three months. In south-central and south-eastern parts of the UK river flows are likely to be normal to below normal during December and for the next three months. Elsewhere in the UK river flows and groundwater levels are likely to be normal to above normal in the same period.
November 2017 rainfallas % of 1981-2010 average
© NERC 2017. © Crown copyright.
SMD (mm)0 - 10
10 - 30
30 - 50
50 - 70
70 - 90
90 - 110
110 - 130
Over 130
September 2017 - November 2017 rainfallas % of 1981-2010 average
MORECS Soil Moisture Deficits*November 2017
* For a grass cover
© NERC (CEH) 2017 © Crown copyright.
17015013011090705030
% o
f ave
rage
% o
f ave
rage
3
17015013011090705030
!( !(!(!(
!(
!(!(
!(!(
!(
!(
!(
!(!(
!(!(!(
!(
!(
!(
!(!(
!(
!(
!(!(!( !(!(
!(!(
!(
!(!(
!(
!(!(
!(
!(!(
!(
!(
!(
!(
!(!(
!(
!(
!(!(
!(
!(
!(
!(
!(
!(
!(
!(
!( !(
!(!(!(!( !(
!(
J41
32
43
354942
70
48
67
61
62
64 5233
41
45
9281
84
94
79
95
48
91
99
55
95
99
64
95
76
80
56
97
79
84
100
117
106
115
103
108
100
103
102102
116108114
144
119
149
140
135
127
118
136
127135
117
151
153
159
139
144
154
© NERC 2017. © Crown copyright.
Naver
Ness
SpeyEwe
Dee
Tay
Nevis
Tweed
Luss
Carron
Whiteadder
Clyde
Cree
Tyne
Derwent
WharfeLune
DeeDove
Trent
Lud
Soar
Witham
GreatOuse
Little Ouse
GreatStour
Stour
Itchen
Lambourn
Teifi
Yscir
Cynon
Teme
Severn
Coln
Tone
Taw
Exe
Avon
Ouse
Thames Colne
Warleggan
Kenwyn
Bush
Annacloy
Mourne
Lee
BlackwaterMedway
Wye
Ribble
Avon
Conwy
Stringside
Tyne
Deveron
Brue
Dart
Tywi
Ythan
Tees
Nith
Earn
Mersey
Eden
4
River flow . . . River flow . . .
River flows *Comparisons based on percentage flows alone can be misleading. A given percentage flow can represent extreme drought conditions in permeable catchments where flow patterns are relatively stable but be well within the normal range in impermeable catchments where the natural variation in flows is much greater. Note: the averaging period on which these percentages are based is 1981-2010. Percentages may be omitted where flows are under review.
Key
% of long-term average(record figure when circled)
Exceptionally low flow
Notably low flow
Exceptionally high flow
Below normal
Normal range
Notably high flow
Above normal
25
Based on ranking of the monthly flow*
November 2017
September 2017 -November 2017
!( !(!(!(
!(
!(!(
!(!(
!(
!(
!(
!(!(
!(!(!(
!(
!(
!(
!(!(
!(
!(
!(!(!( !(!(
!(!(
!(
!(!(
!(
!(!(
!(
!(!(
!(
!(
!(
!(
!(!(
!(
!(
!(!(
!(
!(
!(
!(
!(
!(
!(
!(
!(!(
!(!(!(!( !(
!(
J29
33
22
34
25
39
53
5223
64
44
64
37
47
35
56
40
32
38
3265
51
62
59
66
8969
81
73
93
90
76
92
73
94
61
83
70
95
62
82
63
84
90
83
76
69
81
8999
119
100
100
117
117
114
118
111
108
106
100
100
113
128
129
152
© NERC 2017. © Crown copyright.
Naver
Ness
SpeyEwe
Dee
Tay
Nevis
Tweed
Luss
Carron
Whiteadder
Clyde
Cree
Tyne
Derwent
WharfeLune
DeeDove
Trent
Lud
Soar
Witham
GreatOuse
Little Ouse
GreatStour
Stour
Itchen
Lambourn
Teifi
Yscir
Cynon
Teme
Severn
Coln
Tone
Taw
Exe
Avon
Ouse
Thames Colne
Warleggan
Kenwyn
Bush
Annacloy
Mourne
Lee
BlackwaterMedway
Wye
Ribble
Avon
Conwy
Stringside
Tyne
Deveron
Brue
Dart
Tywi
Ythan
Tees
Nith
Earn
Mersey
Eden
© NERC (CEH) 2017 © Crown copyright.
© NERC (CEH) 2017. © Crown copyright.

5
River flow . . . River flow . . .
*The river flow hydrographs show the daily mean flows (measured in m3s-1) together with the maximum and minimum daily flows prior to December 2016 (shown by the shaded areas). Daily flows falling outside the maximum/minimum range are indicated where the bold trace enters the shaded areas. The dashed line represents the period-of-record average daily flow.
River flow hydrographs

6
River flow . . . River flow . . .

7
Groundwater . . . Groundwater
Groundwater levels (measured in metres above ordnance datum) normally rise and fall with the seasons, reaching a peak in the spring following replenishment through the winter (when evaporation losses are low and soil moist). They decline through the summer and early autumn. This seasonal variation is much reduced when the aquifer is confined below overlying impermeable strata. The monthly mean and the highest and lowest levels recorded for each month are displayed in a similar style to the river flow hydrographs. Note that most groundwater levels are not measured continuously and, for some index wells, the greater frequency of contemporary measurements may, in itself, contribute to an increased range of variation.

8
Groundwater . . . Groundwater

9
Groundwater . . . Groundwater
!(
!(!(
!(
!(!(!(
!(!(
!(!( !(!(!(!(
!(
!(
!(
!(
!(
!(!(!(
!(
!(!(
!(
!(!(
!(
!(
!(
!(
!(
J
Killyglen
Chipstead
Frying PanLodge
RoyaltyObservatory
Aylesby
BussellsNo.7a
Rockley
Wetwang
Houndean
Tilshead
Skirwith
LlanfairD.C
Westdean No.3
Newbridge
DialFarm
Heathlanes
Aycliffe
Alstonfield
AshtonFarm
StonorPark
New RedLion
WashpitFarm
DaltonHolme
NuttallsFarm
AmpneyCrucis
LimeKilnWay
ComptonHouse
ChilgroveHouse
BrickHouseFarm
Greenfield GarageTherfieldRectory
LittleBucketFarm
WestWoodyates
Manor
RedlandsHall
1/477/75
6/49
4/50
5/473/48
5/77
4/54
6/57
8/40
7/46
11/46
17/59
12/85
14/66
32/123
25/130
7/24
18/27
18/43
14/38
19/44
18/45
16/44
24/39
17/54
31/73
21/42
17/33
57/182
87/129
30/39
36/46
22/25
Key
Monthly rank/Period of record(record figure when circled)J1/25
!( Exceptionally low levels!( Notably low levels
!( Exceptionally high levels
!( Below normal
!( Normal range
!( Notably high levels
!( Above normal
© NERC 2017.
AquiferChalk
Jurassic limestones
Permo-Triassic sandstones
Magnesian Limestone
Carboniferous Limestone
© BGS NERC 2017
Groundwater levels - November 2017The calculation of ranking has been modified from that used in summaries published prior to October 2012. It is now based on a comparison between the most recent level and levels for the same date during previous years of record. Where appropriate, levels for earlier years may have been interpolated. The rankings are designed as a qualitative indicator, and ranks at extreme levels, and when levels are changing rapidly, need to be interpreted with caution.

10
Reservoirs . . . Reservoirs . . .Guide to the variation in overall reservoir stocks for England andWales
Comparison between overall reservoir stocks for England and Wales in recent years
Area Reservoir
Capacity
(Ml)2017 Sep
2017Oct
2017Nov
Nov Anom.
Min Nov
Year* of min
2016Nov
Diff 17-16
North West N Command Zone • 124929 77 88 82 3 44 1993 69 12 Vyrnwy 55146 97 98 93 11 33 1995 82 12Northumbrian Teesdale • 87936 98 98 98 15 39 1995 90 8 Kielder (199175) 82 87 83 -3 55 2007 82 2Severn-Trent Clywedog 44922 92 85 87 6 43 1995 89 -2 Derwent Valley • 39525 68 80 85 6 9 1995 94 -9Yorkshire Washburn • 22035 79 87 86 10 16 1995 74 12 Bradford Supply • 41407 80 91 91 9 20 1995 81 10Anglian Grafham (55490) 94 94 94 11 47 1997 86 8 Rutland (116580) 90 85 81 1 57 1995 85 -4Thames London • 202828 71 60 59 -24 52 1990 81 -23 Farmoor • 13822 93 95 94 5 52 1990 87 7Southern Bewl 28170 43 36 33 -31 33 2017 58 -25
Ardingly 4685 81 81 87 13 14 2011 48 39Wessex Clatworthy 5364 69 68 65 -14 16 2003 58 7 Bristol • (38666) 61 61 67 -1 27 1990 66 1South West Colliford 28540 81 98 88 15 42 1995 66 22 Roadford 34500 71 74 79 4 19 1995 67 12 Wimbleball 21320 76 53 55 -19 34 1995 51 4 Stithians 4967 75 81 80 14 29 2001 75 5Welsh Celyn & Brenig • 131155 93 91 94 6 50 1995 91 3 Brianne 62140 100 100 100 5 72 1995 91 9 Big Five • 69762 77 79 84 1 49 1990 80 4 Elan Valley • 99106 80 89 100 7 47 1995 91 9
Scotland(E) Edinburgh/Mid-Lothian • 96518 84 87 89 3 45 2003 83 6 East Lothian • 9374 98 95 97 8 38 2003 100 -3Scotland(W) Loch Katrine • 110326 95 99 100 9 65 2007 88 12
Daer 22412 86 98 99 2 73 2003 79 20 Loch Thom 10798 89 100 100 5 72 2003 93 7
Northern Total+ • 56800 98 99 98 12 59 2003 73 25Ireland Silent Valley • 20634 100 99 96 15 43 2001 64 32
( ) figures in parentheses relate to gross storage • denotes reservoir groups *last occurrence
+ excludes Lough Neagh
Details of the individual reservoirs in each of the groupings listed above are available on request. The percentages given in the Average and Minimum storage columns relate to the 1988-2012 period except for West of Scotland and Northern Ireland where data commence in the mid-1990s. In some gravity-fed reservoirs (e.g. Clywedog) stocks are kept below capacity during the winter to provide scope for flood attenuation purposes. Monthly figures may be artificially low due to routine maintenance or turbidity effects in feeder rivers. © NERC (CEH) 2017.
Percentage live capacity of selected reservoirs at end of month

11
© NERC (CEH, BGS) 2016 © Crown copyright
Minor aquifers have been omitted
G
"
"
"
"
G
G
"
"
"
"
"
G
G
"
"
GG
"
GG
G
G
G
"
G
"
G
G
"
""
"
"
!
!
!
!
!
!!
!
!
!
!
!
!
!
!
!
!
!
!
!
!
!
!
!
!
!
!
!
!
!
!
!
!
!
!
#
#
#
#
#
#
#
#
#
#
#
#
#
#
##
#
##
#
#
#
#
#
#
#
#
#
#
#
#
#
#
#
##
#
#
#
#
#
#
#
#
#
#
#
#
#
#
#
#
##
##
#
# #
##
#
#
#
##
#
#
##
#
#
#
#
#
#
#
##
#
#
#
#
##
#
#
#
#
#
#
#
#
#
#
#
#
#
Tay
Earn
Ness SpeyDeve
ron
Don
Ewe
Naver
Carron
Nevis
Dee
Ythan
ForthLuss
Tyne
Clyde
Tweed
Whiteadder
CreeNith
South Tyne
EdenLu
ne
Ribble
Dove
Derw
ent
Ouse
Wharfe
Conwy
Dee
Dyfi
TemeWyeYscir
UskCynon
Tawe
TywiTeifi
Torne
Tren
t
Soar
Lud
Witham
Stringside
Little Ouse
Great Ouse
Colne
Lee
Thames Medway
Great Stour
Ouse
Mole
Blackwater
Coln
LambournKennet
Wallington
ItchenTest
Avon
StourPiddle
Brue
Tone
Otter
Exe
TawDartWarleggan
Kenwyn
Avon
Severn
Dover Beck
Dove
Bervie
Camowen
LowerBann
Bush
Faughan
Mourne
Lagan
Annacloy
Lossie
Tees
Lymington
Tyne
North Tyne
Pang
Derwent
Silent Valley
Katrine
Thom
East Lothian
Edinburgh/ Mid-Lothian
Daer
KielderBraden
Northern Command
Zone
Derwent Valley
Bradford Supply
Washburn
Rutland
Grafham
Farmoor
London
BewlArdingly
Bristol
Stithians
Colliford
Roadford
Wimbleball Clatworthy
BigFive
ElanValley
Clywedog
Vyrnwy
Brianne
Celyn & Brenig
Teesdale
Pennines
West Lothian
Haweswater & Thirlmere
Newbridge
AycliffeSkirwith
Wetwang
DaltonHolmeBrick
HouseFarm
WashpitFarm
DialFarm
Redlands HallTherfield Rectory
NewRedLion
Aylesby
Alstonfield
NuttallsFarm
Heathlanes
Llanfair D.C.
GreenfieldGarage
Pant y Lladron
StonorPark
AmpneyCrucis
Rockley
Little BucketFarm
Tilshead
WestWoodyates
Manor
Lime Kiln Way
AshtonFarm
BussellsNo.7A
WestdeanNo.3
Houndean Bottom
ChilgroveHouse
ComptonHouse
Killyglen
Royalty Observatory
Frying Pan Lodge
Chipstead
# Gauging station
! Groundwater index well
G Reservoir - individual
" Reservoir - group (general location only)
Chalk
Jurassic limestones
Permo-Triassic sandstones
Magnesian Limestone
Carboniferous Limestone
North EastScotland
Highland
Tay
Clyde
Forth
Tweed
SolwayNorthumbrian
NorthWest
EnglandYorkshire
MidlandsAnglian
Thames
SouthernWessex
South West
England
Welsh
NorthernIreland
OrkneyIsles
ShetlandIsles
WesternIsles
(River name)
© NERC (CEH, BGS) 2017. © Crown copyright.
Location map . . . Location map

12
NHMP
The National Hydrological Monitoring Programme (NHMP) was started in 1988 and is undertaken jointly by the Centre for Ecology & Hydrology (CEH) and the British Geological Survey (BGS). The NHMP aims to provide an authoritative voice on hydrological conditions throughout the UK, to place them in a historical context and, over time, identify and interpret any emerging hydrological trends. Hydrological analysis and interpretation within the Programme is based on the data holdings of the National River Flow Archive (NRFA; maintained by CEH) and National Groundwater Level Archive (NGLA; maintained by BGS), including rainfall, river flows, borehole levels, and reservoir stocks.
Data Sources
The NHMP depends on the active cooperation of many data suppliers. This cooperation is gratefully acknowledged.River flow and groundwater level data are provided by the Environment Agency (EA), Natural Resources Wales - Cyfoeth Naturiol Cymru (NRW), the Scottish Environment Protection Agency (SEPA) and, for Northern Ireland, the Rivers Agency and the Northern Ireland Environment Agency. In all cases the data are subject to revision following validation (high flow and low flow data in particular may be subject to significant revision).
Details of reservoir stocks are provided by the Water Service Companies, the EA, Scottish Water and Northern Ireland Water.
The Hydrological Summary and other NHMP outputs may also refer to and/or map soil moisture data for the UK. These data are provided by the Meteorological Office Rainfall and Evaporation Calculation System (MORECS). MORECS provides estimates of monthly soil moisture deficit in the form of averages over 40 x 40 km grid squares over Great Britain and Northern Ireland. The monthly time series of data extends back to 1961.
Rainfall data are provided by the Met Office. To allow better spatial differentiation the rainfall data for Britain are presented for the regional divisions of the precursor organisations of the EA, NRW and SEPA. The areal rainfall figures have been produced by the Met Office National Climate Information Centre (NCIC), and are based on 5km resolution gridded data from rain gauges. The majority of the full rain gauge network across the UK is operated by the EA, NRW, SEPA and Northern Ireland Water; supplementary rain gauges are operated by the Met Office. The Met Office NCIC monthly rainfall series extend back to 1910 and form the official source of UK areal
rainfall statistics which have been adopted by the NHMP. The gridding technique used is described in Perry MC and Hollis DM (2005) available at http://www.metoffice.gov.uk/climate/uk/about/methods
Long-term averages are based on the period 1981-2010 and are derived from the monthly areal series.
The regional figures for the current month in the hydrological summaries are based on a limited rain gauge network so these (and the associated return periods) should be regarded as a guide only.
The monthly rainfall figures are provided by the Met Office NCIC and are Crown Copyright and may not be passed on to, or published by, any unauthorised person or organisation.
For further details on rainfall or MORECS data, please contact the Met Office:
Tel: 0870 900 0100Email: [email protected]
Enquiries
Enquiries should be directed to the NHMP:
Tel: 01491 692599Email: [email protected]
A full catalogue of past Hydrological Summaries can be accessed and downloaded at:
http://nrfa.ceh.ac.uk/monthly-hydrological-summary-uk
Some of the features displayed on the maps contained in this report are based on the following data with permission of the controller of HMSO.
i. Ordnance Survey data. © Crown copyright and/or database right 2005. Licence no. 100017897.
ii. Land and Property Services data. © Crown copyright and database right, S&LA 145.
iii. Met Office rainfall data. © Crown copyright.
All rights reserved. Unauthorised reproduction infringes crown copyright and may lead to prosecution or civil proceedings.
Text and maps in this document are © NERC (CEH) 2017 unless otherwise stated and may not be reproduced without permission.
12/2017


![Zionism Unsettled - Presbyterian Church [USA]](https://img.pdfslide.us/doc/110x75/577ccf7a1a28ab9e788fd043/zionism-unsettled-presbyterian-church-usa.jpg)