Embed Size (px)
Citation preview

Hydrological Summary for the United Kingdom
Ma
y 2
01
8
GeneralMay felt like an early start to the summer, with prolonged periods of warm, dry weather which culminated in thunderstorms at month-end. Large parts of the UK registered monthly mean temperatures more than 1.5°C above average, and a maximum temperature of 28.7°C was recorded at Northolt (Greater London) on the Early May bank holiday. For the UK as whole, May rainfall was around three quarters of average with large areas of northern Britain registering less than half of average. In central and southern England, rainfall was above average and dominated by rainfall from thunderstorms in the last week. With the continued dry weather and above average soil moisture deficits (SMDs) in northern Britain, river flows were generally in the normal range or below, whilst in southern Britain river flows were in the normal range and often above normal in the south-east. Due to the delayed end to the recharge season, groundwater levels were in the normal range or above for the time of year. Reservoir stocks fell in the majority of index impoundments, substantially so at some in the north and west, although most remained only moderately below average for the end of May (Northern Command Zone and Daer were more than 10% below). Given the above average spring rainfall, groundwater levels and reservoir stocks, the water resources outlook remains healthy for the summer in the south and east, a significant transformation from the situation at the start of 2018. Conversely, a continuation of dry weather in the north and west would accentuate current rainfall deficiencies and increase the potential for low flows and localised water resource pressure in the summer.
RainfallThe start of May was unsettled with westerly airflows bringing frontal rainfall, whilst warm and dry conditions prevailed for the rest of the month under predominantly anticyclonic weather patterns. In the last week, precipitation was dominated by localised thundery downpours in the Midlands and south-east England. On the 27th, 81mm of rainfall was recorded at Winterbourne (Birmingham) - 56mm of which fell in one hour - causing flash flooding (around 80 properties were flooded in the city), disruption and damage to road networks and power cuts to 1,000 homes in the West Midlands. South-east England bore the brunt of the impacts of further thunderstorms on the 29th (roads were flooded in Kent and flights were delayed at Stansted and Gatwick airports) and 31st with 38mm recorded at Brize Norton (Oxfordshire), severe rail disruption on Great Western services in the Thames Valley and flooding at Didcot Parkway train station. For May overall rainfall was below average across Scotland, northern and south-west England and parts of Wales; five regions registered half of average or less. In contrast, the intense downpours yielded patches of more than 170% of average rainfall in parts of the West Midlands and south-east England. For the UK as a whole, spring (March-May) rainfall was near average, but there was a distinct spatial difference in rainfall anomalies. Spring rainfall was below average in north-west Britain (it was the tenth driest spring in the Highlands region) and above average in the south and east (it was the eighth wettest spring in the South West region).
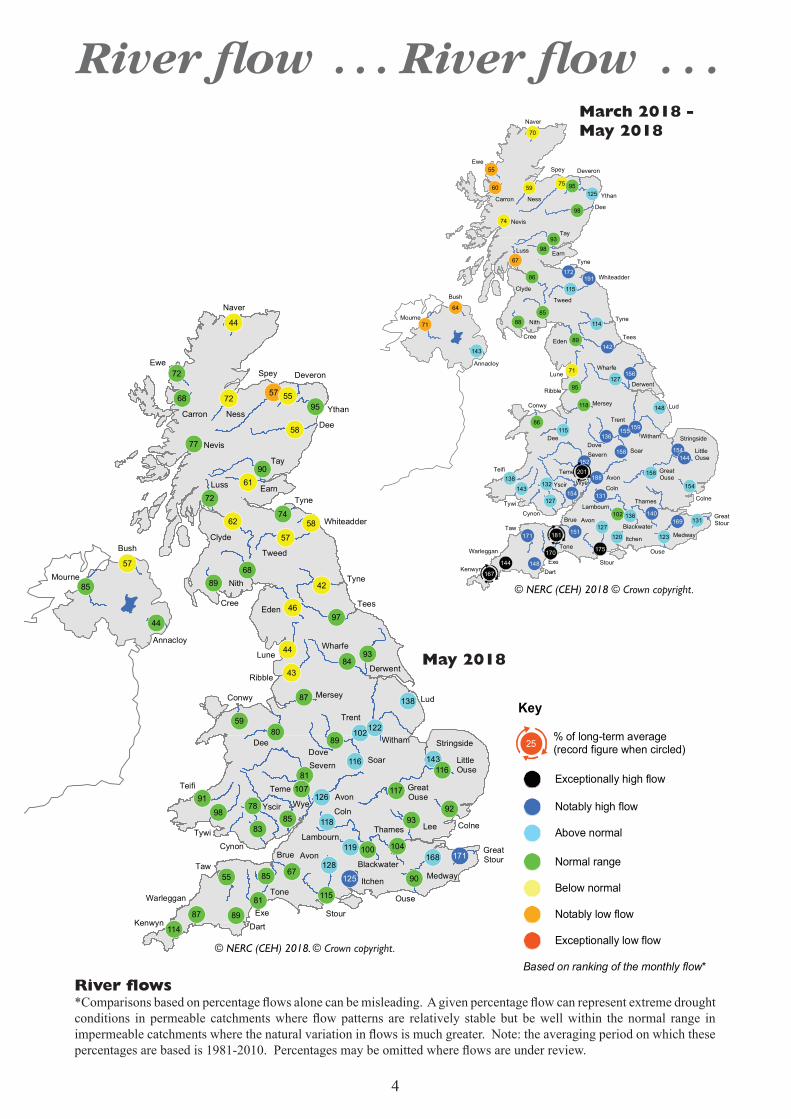
River flowsRecessions dominated river flows in May and lasted through the month across much of Scotland and northern and south-west England. By month-end flows on the Spey, Scottish Dee, Forth, Nevis and South Tyne approached or went below their daily minima. Elsewhere, flows remained around or above average throughout May, with moderate flow responses to individual rainfall events. Following the wet end to April in south-east England, a new May daily flow maximum was set on the 1st on the Great Stour (in a record from 1965). On the 29th, 40 Flood Alerts and Warnings were issued in the Midlands, record levels were recorded on many rivers in Birmingham, although most property flooding was from surface water. May monthly mean flows were below average across northern
and western Britain, with flows on the Annacloy, Naver, Lune, Eden, Ribble and English Tyne less than half the May average. In contrast, flows were above average in the Midlands, East Anglia and south-east England; flows were notably high on the Great Stour (due to rainfall early and late in the month) and on the Itchen (as a result of high groundwater levels). This spatial contrast was mirrored and exaggerated for spring (March-May) river flows. Several catchments in western Scotland and Northern Ireland recorded notably low flows (the Ewe registered around half of the spring average flow) and three catchments in the Welsh borders and south-west England registered new record spring average flows (the Teme, Tone and Kenwyn).
GroundwaterSMDs increased across the UK, substantially so in some areas and at month-end were above average in the north-west and below average in the south-east. Groundwater levels generally fell in the Chalk, following their usual seasonal recession, with the exception of some slower responding boreholes or where some late recharge occurred (in the Chilterns, East Anglia and North Downs). Despite falling, groundwater levels remained exceptionally high at Tilshead and notably high at Dalton Holme, Compton House and Chilgrove House. Elsewhere, levels were generally in the normal range or above, with the exception of Dial Farm where they remained below normal for the time of year. In the more rapidly responding Magnesian and Jurassic limestones levels fell and were in the normal range or above, except at Aycliffe where levels rose and were exceptionally high. In the Upper Greensand, levels at Lime Kiln Way rose slightly but remained in the normal range. In the Fell Sandstone and throughout the north-western and south-western Permo-Triassic sandstones, levels fell but remained above normal (exceptionally so at Royalty Observatory) reflecting the slow response to above average rainfall for winter and spring in these areas. In the Permo-Triassic sandstone in the Midlands and Wales, levels remained in the normal range, receding at Llanfair DC, remaining stable at Heathlanes and rising at Nuttalls Farm. Levels in the rapidly responding Carboniferous Limestone fell during May, but remained in the normal range or above for the time of year.

2
Rainfall . . . Rainfall . . . Rainfall accumulations and return period estimatesPercentages are from the 1981-2010 average.
Region RainfallMay
2018Mar18 – May18 Dec17– May18 Sep17 – May18 Jun17 – May18
RP RP RP RP
United mm 49 239 559 887 1202Kingdom % 72 104 2-5 100 2-5 99 2-5 106 5-10England mm 46 230 463 676 922
% 80 129 8-12 114 5-10 104 2-5 109 2-5Scotland mm 46 232 654 1140 1551
% 58 77 2-5 85 2-5 93 2-5 102 5-10Wales mm 64 336 776 1203 1568
% 77 119 5-10 110 2-5 105 2-5 110 5-10Northern mm 58 225 586 951 1301Ireland % 80 92 2-5 105 2-5 108 8-12 114 20-30England & mm 49 244 506 749 1011Wales % 80 127 8-12 113 5-10 104 2-5 109 2-5
North West mm 36 204 556 1019 1387% 50 85 2-5 94 2-5 106 2-5 113 5-10
Northumbria mm 28 208 412 657 939% 50 114 2-5 99 2-5 99 2-5 108 2-5
Severn-Trent mm 63 248 455 636 847% 110 145 15-25 122 5-10 107 2-5 108 2-5
Yorkshire mm 33 232 429 668 946% 63 130 5-10 105 2-5 104 2-5 112 2-5
Anglian mm 42 188 363 485 686% 86 135 8-12 127 8-12 105 2-5 110 2-5
Thames mm 61 225 424 558 760% 109 141 10-20 122 5-10 100 2-5 106 2-5
Southern mm 57 240 483 631 856% 107 146 15-25 124 5-10 98 2-5 107 2-5
Wessex mm 49 260 509 709 931% 82 140 10-20 116 2-5 100 2-5 105 2-5
South West mm 42 322 709 1027 1335% 56 130 10-15 113 2-5 103 2-5 109 2-5
Welsh mm 63 330 752 1155 1506 % 77 121 5-10 111 2-5 105 2-5 110 5-10Highland mm 52 216 740 1364 1804
% 59 60 8-12 78 2-5 91 2-5 99 2-5North East mm 33 194 379 717 1030
% 50 93 2-5 79 8-12 91 2-5 101 2-5Tay mm 40 248 539 866 1216
% 51 91 2-5 79 2-5 80 5-10 91 2-5Forth mm 31 229 533 811 1181
% 44 95 2-5 89 2-5 85 2-5 98 2-5Tweed mm 31 238 502 765 1095
% 47 114 2-5 101 2-5 97 2-5 107 2-5Solway mm 50 253 700 1172 1655
% 60 85 2-5 95 2-5 99 2-5 111 10-20Clyde mm 57 273 838 1424 1922
% 64 77 2-5 92 2-5 97 2-5 105 5-10 % = percentage of 1981-2010 average RP = Return periodImportant note: Figures in the above table may be quoted provided their source is acknowledged (see page 12). Where appropriate, specific mention must be made of the uncertainties associated with the return period estimates. The RP estimates are based on data provided by the Met Office and reflect climatic variability since 1910; they also assume a stable climate. The quoted RPs relate to the specific timespans only; for the same timespans, but beginning in any month the RPs would be substantially shorter. The timespans featured do not purport to represent the critical periods for any particular water resource management zone. For hydrological or water resources assessments of drought severity, river flows and/or groundwater levels normally provide a better guide than return periods based on regional rainfall totals. Note that precipitation totals in winter months may be underestimated due to snowfall undercatch. All monthly rainfall totals since January 2018 are provisional.

3
Rainfall . . . Rainfall . . .
The Hydrological Outlook provides an insight into future hydrological conditions across the UK. Specifically it describes likely trajectories for river flows and groundwater levels on a monthly basis, with particular focus on the next three months.
The complete version of the Hydrological Outlook UK can be found at: www.hydoutuk.net/latest-outlook/
Period: from June 2018Issued: 08.06.2018 using data to the end of May 2018
The outlook for June is for normal to below normal flows in the northern parts of Great Britain, and eastern Northern Ireland. River flows in the southern parts of Great Britain, and western Northern Ireland are likely to be normal to above normal for both June, and June-July-August. Groundwater levels across the UK are likely to be normal to above normal for the next three months.
May 2018 rainfallas % of 1981-2010 average
© NERC 2018. © Crown copyright.
SMD (mm)0 - 10
10 - 30
30 - 50
50 - 70
70 - 90
90 - 110
110 - 130
Over 130
March 2018 - May 2018 rainfallas % of 1981-2010 average
MORECS Soil Moisture Deficits*May 2018
* For a grass cover
© NERC (CEH) 2018 © Crown copyright.
17015013011090705030
% o
f ave
rage
% o
f ave
rage
17015013011090705030
!( !(!(!(
!(
!(!(
!(!(
!(
!(
!(
!(!(
!(!(!(
!(
!(
!(
!(!(
!(!(
!(!( !(!(
!(!(
!(
!(!(
!(
!(!(
!(
!(!(
!(
!(
!(
!(
!(!(
!(
!(
!(!(
!(
!(
!(
!(
!(
!(
!(
!(
!( !(
!(!(!(!( !(
!(
J
J
J
71
55
60
64
67
71
70
74
7559
86
89
95
86
8885
9398
98
95
118
102
143
132138
143
115
127
154
158
127131
136
123120
148
127
114
115
125
154
151
148
144154
171
188
152
140169
131
158
159136
155
156
142
191172
201
181
170
167
144
175
© NERC 2018. © Crown copyright.
Naver
Ness
SpeyEwe
Dee
Tay
Nevis
Tweed
Luss
Carron
Whiteadder
Clyde
Cree
Tyne
Derwent
WharfeLune
DeeDove
Trent
Lud
Soar
Witham
GreatOuse
Little Ouse
GreatStour
Stour
Itchen
Lambourn
Teifi
Yscir
Cynon
Teme
Severn
Coln
Tone
Taw
Exe
Avon
Ouse
Thames Colne
Warleggan
Kenwyn
Bush
Annacloy
Mourne
BlackwaterMedway
Wye
Ribble
Avon
Conwy
Stringside
Tyne
Deveron
Brue
Dart
Tywi
Ythan
Tees
Nith
Earn
Mersey
Eden
4
River flow . . . River flow . . .
River flows *Comparisons based on percentage flows alone can be misleading. A given percentage flow can represent extreme drought conditions in permeable catchments where flow patterns are relatively stable but be well within the normal range in impermeable catchments where the natural variation in flows is much greater. Note: the averaging period on which these percentages are based is 1981-2010. Percentages may be omitted where flows are under review.
Key
% of long-term average(record figure when circled)
Exceptionally low flow
Notably low flow
Exceptionally high flow
Below normal
Normal range
Notably high flow
Above normal
25
Based on ranking of the monthly flow*
May 2018
March 2018 -May 2018
!( !(!(!(
!(
!(!(
!(!(
!(
!(
!(
!(!(
!(!(!(
!(
!(
!(
!(!(
!(
!(
!(!(!( !(!(
!(!(
!(
!(!(
!(
!(!(
!(
!(!(
!(
!(
!(
!(
!(!(
!(
!(
!(!(
!(
!(
!(
!(
!(
!(
!(
!(
!(!(
!(!(!(!( !(
!(
57
44
46
43
62
44
57
58
42
57
61
58
5572
44
7891
9885
8059
83
87
85
72
68
89
77
68
72
67
89
85
92
81
55
81
87
93
90
89
9384
97
74
90
95
107 117
116
114
115
100 104
143
126
128168
118
119
138
116
122102
171
125
© NERC 2018. © Crown copyright.
Naver
Ness
SpeyEwe
Dee
Tay
Nevis
Tweed
Luss
Carron
Whiteadder
Clyde
Cree
Tyne
Derwent
WharfeLune
DeeDove
Trent
Lud
Soar
Witham
GreatOuse
Little Ouse
GreatStour
Stour
Itchen
Lambourn
Teifi
Yscir
Cynon
Teme
Severn
Coln
Tone
Taw
Exe
Avon
Ouse
Thames Colne
Warleggan
Kenwyn
Bush
Annacloy
Mourne
Lee
BlackwaterMedway
Wye
Ribble
Avon
Conwy
Stringside
Tyne
Deveron
Brue
Dart
Tywi
Ythan
Tees
Nith
Earn
Mersey
Eden
© NERC (CEH) 2018 © Crown copyright.
© NERC (CEH) 2018. © Crown copyright.

5
River flow . . . River flow . . .
*The river flow hydrographs show the daily mean flows (measured in m3s-1) together with the maximum and minimum daily flows prior to June 2017 (shown by the shaded areas). Daily flows falling outside the maximum/minimum range are indicated where the bold trace enters the shaded areas. The dashed line represents the period-of-record average daily flow.
River flow hydrographs

River flow . . . River flow . . .
6

7
Groundwater . . . Groundwater
Groundwater levels (measured in metres above ordnance datum) normally rise and fall with the seasons, reaching a peak in the spring following replenishment through the winter (when evaporation losses are low and soil moist). They decline through the summer and early autumn. This seasonal variation is much reduced when the aquifer is confined below overlying impermeable strata. The monthly mean and the highest and lowest levels recorded for each month are displayed in a similar style to the river flow hydrographs. Note that most groundwater levels are not measured continuously and, for some index wells, the greater frequency of contemporary measurements may, in itself, contribute to an increased range of variation.

Groundwater . . . Groundwater
8

9
Groundwater . . . Groundwater
!(
!(!(
!(
!(!(!(
!(!(
!(!( !(!(!(!(
!(
!(
!(
!(
!(
!(!(!(
!(
!(!(
!(
!(!(
!(!(
!(
!(
!(
!(
Killyglen
Chipstead
Frying PanLodge
RoyaltyObservatory
Aylesby
BussellsNo.7a
Rockley
Wetwang
Houndean
Tilshead
Skirwith
LlanfairD.C
Westdean No.3
Newbridge
DialFarm
Heathlanes
Aycliffe
Alstonfield
AshtonFarm
StonorPark
New RedLion
WashpitFarm
DaltonHolme
NuttallsFarm
AmpneyCrucis
LimeKilnWay
ComptonHouse
Pant yLladron
ChilgroveHouse
BrickHouseFarm
Greenfield GarageTherfieldRectory
LittleBucketFarm
WestWoodyates
Manor
RedlandsHall 11/51
9/24
39/73
17/25
16/43
24/46
14/47
41/60
32/49
33/48
32/54
20/58
33/47
11/33
57/133
34/46
32/42
31/37
34/45
29/39
44/55
62/75
37/4560/77
53/68
23/26
34/39
42/47
80/87
165/183114/124
120/130
27/28
39/41
48/50
Key
Monthly rank/Period of record(record figure when circled)J1/25
!( Exceptionally low levels!( Notably low levels
!( Exceptionally high levels
!( Below normal
!( Normal range
!( Notably high levels
!( Above normal
© NERC 2018.
AquiferChalk
Jurassic limestones
Permo-Triassic sandstones
Magnesian Limestone
Carboniferous Limestone
© BGS NERC 2018
Groundwater levels - May 2018The calculation of ranking has been modified from that used in summaries published prior to October 2012. It is now based on a comparison between the most recent level and levels for the same date during previous years of record. Where appropriate, levels for earlier years may have been interpolated. The rankings are designed as a qualitative indicator, and ranks at extreme levels, and when levels are changing rapidly, need to be interpreted with caution.

10
Reservoirs . . . Reservoirs . . .Guide to the variation in overall reservoir stocks for England andWales
Comparison between overall reservoir stocks for England and Wales in recent years
Area Reservoir
Capacity
(Ml)2018 Mar
2018Apr
2018May
May Anom.
Min May
Year* of min
2017May
Diff 18-17
North West N Command Zone • 124929 83 86 69 -12 50 1984 76 -7 Vyrnwy 55146 100 100 93 4 69 1984 92 1Northumbrian Teesdale • 87936 99 92 82 -4 64 1991 67 16 Kielder (199175) 91 93 91 -1 85 1989 87 4Severn-Trent Clywedog 49936 100 100 100 3 83 1989 98 2 Derwent Valley • 46692 100 98 86 -2 56 1996 76 10Yorkshire Washburn • 23373 99 95 85 -2 72 1990 84 1 Bradford Supply • 40942 99 96 84 -2 70 1996 73 11Anglian Grafham (55490) 96 94 92 -2 72 1997 96 -4 Rutland (116580) 95 97 96 4 75 1997 97 -1Thames London • 202828 96 98 97 3 83 1990 97 0 Farmoor • 13822 96 92 98 1 90 2002 97 2Southern Bewl 31000 100 99 98 10 57 1990 68 30
Ardingly 4685 100 100 100 1 89 2012 99 1Wessex Clatworthy 5364 100 100 93 7 67 1990 84 9 Bristol • (38666) 99 97 93 4 70 1990 88 5South West Colliford 28540 100 99 98 12 52 1997 81 17 Roadford 34500 95 96 92 9 48 1996 72 20 Wimbleball 21320 100 100 98 7 74 2011 82 16 Stithians 4967 95 100 96 9 66 1990 90 6Welsh Celyn & Brenig • 131155 100 100 96 -1 82 1996 92 4 Brianne 62140 100 97 94 -2 84 2011 93 1 Big Five • 69762 96 95 88 -2 70 1990 86 2 Elan Valley • 99106 99 99 93 0 81 2011 89 4
Scotland(E) Edinburgh/Mid-Lothian • 96518 99 98 93 2 52 1998 80 13 East Lothian • 9374 100 100 99 2 84 1990 93 6Scotland(W) Loch Katrine • 110326 94 96 88 1 66 2001 75 13
Daer 22412 91 92 79 -11 69 2017 69 10 Loch Thom 10798 100 100 95 4 72 2017 72 23
Northern Total+ • 56800 98 95 88 2 69 2008 81 6Ireland Silent Valley • 20634 100 95 86 4 56 2000 78 8
( ) figures in parentheses relate to gross storage • denotes reservoir groups *last occurrence
+ excludes Lough Neagh
Details of the individual reservoirs in each of the groupings listed above are available on request. The percentages given in the Average and Minimum storage columns relate to the 1988-2012 period except for West of Scotland and Northern Ireland where data commence in the mid-1990s. In some gravity-fed reservoirs (e.g. Clywedog) stocks are kept below capacity during the winter to provide scope for flood attenuation purposes. Monthly figures may be artificially low due to routine maintenance or turbidity effects in feeder rivers. © NERC (CEH) 2018.
Percentage live capacity of selected reservoirs at end of month

11
© NERC (CEH, BGS) 2018 © Crown copyright
Minor aquifers have been omitted
G
"
"
"
"
G
G
"
"
"
"
"
G
G
"
"
GG
"
GG
G
G
G
"
G
"
G
G
"
""
"
"
!
!
!
!
!
!!
!
!
!
!
!
!
!
!
!
!
!
!
!
!
!
!
!
!
!
!
!
!
!
!
!
!
!
!
#
#
#
#
#
#
#
#
#
#
#
#
#
#
##
#
##
#
#
#
#
#
#
#
#
#
#
#
#
#
#
#
##
#
#
#
#
#
#
#
#
#
#
#
#
#
#
#
#
##
##
#
# #
##
#
#
#
##
#
#
##
#
#
#
#
#
#
#
##
#
#
#
#
##
#
#
#
#
#
#
#
#
#
#
#
#
#
#
#
Tay
Earn
Ness SpeyDeve
ron
Don
Ewe
Naver
Carron
Nevis
Dee
Ythan
ForthLuss
Tyne
Clyde
Tweed
Whiteadder
Cree
Nith
South Tyne
EdenLu
ne
Ribble
Dove
Der
wentOuse
Wharfe
Conwy
Dee
Dyfi
TemeWyeYscir
UskCynon
Tawe
TywiTeifi
Torne
Tren
t
Soar
Lud
Witham
Stringside
Little Ouse
Great Ouse
Colne
Lee
Thames Medway
Great Stour
Ouse
Mole
Blackwater
Coln
LambournKennet
Wallington
ItchenTest
Avon
StourPiddle
Brue
Tone
Otter
Exe
TawDartWarleggan
Kenwyn
Avon
Severn
Dover Beck
Dove
Bervie
Camowen
LowerBann
Bush
Faughan
Mourne
Lagan
Annacloy
Lossie
Tees
Lymington
Tyne
North Tyne
Pang
Derwent
Mersey
Silent Valley
Katrine
Thom
East Lothian
Edinburgh/ Mid-Lothian
Daer
KielderBraden
Northern Command
Zone
Derwent Valley
Bradford Supply
Washburn
Rutland
Grafham
Farmoor
London
BewlArdingly
Bristol
Stithians
Colliford
Roadford
Wimbleball Clatworthy
BigFive
ElanValley
Clywedog
Vyrnwy
Brianne
Celyn & Brenig
Teesdale
Pennines
West Lothian
Haweswater & Thirlmere
Newbridge
AycliffeSkirwith
Wetwang
DaltonHolmeBrick
HouseFarm
WashpitFarm
DialFarm
Redlands HallTherfield Rectory
NewRedLion
Aylesby
Alstonfield
NuttallsFarm
Heathlanes
Llanfair D.C.
GreenfieldGarage
Pant y Lladron
StonorPark
AmpneyCrucis
Rockley
Little BucketFarm
Tilshead
WestWoodyates
Manor
Lime Kiln Way
AshtonFarm
BussellsNo.7A
HoundeanBottom
WestdeanNo.3
ChilgroveHouse
ComptonHouse
Killyglen
Royalty Observatory
Frying Pan Lodge
Chipstead
# Gauging station
! Groundwater index well
G Reservoir - individual
" Reservoir - group (general location only)
Chalk
Jurassic limestones
Permo-Triassic sandstones
Magnesian Limestone
Carboniferous Limestone
North EastScotland
Highland
Tay
Clyde
Forth
Tweed
SolwayNorthumbrian
NorthWest
EnglandYorkshire
MidlandsAnglian
Thames
SouthernWessex
South West
England
Welsh
NorthernIreland
OrkneyIsles
ShetlandIsles
WesternIsles
(River name)
© NERC (CEH, BGS) 2018. © Crown copyright.
Location map . . . Location map

12
NHMP
The National Hydrological Monitoring Programme (NHMP) was started in 1988 and is undertaken jointly by the Centre for Ecology & Hydrology (CEH) and the British Geological Survey (BGS). The NHMP aims to provide an authoritative voice on hydrological conditions throughout the UK, to place them in a historical context and, over time, identify and interpret any emerging hydrological trends. Hydrological analysis and interpretation within the Programme is based on the data holdings of the National River Flow Archive (NRFA; maintained by CEH) and National Groundwater Level Archive (NGLA; maintained by BGS), including rainfall, river flows, borehole levels, and reservoir stocks.
Data Sources
The NHMP depends on the active cooperation of many data suppliers. This cooperation is gratefully acknowledged.River flow and groundwater level data are provided by the Environment Agency (EA), Natural Resources Wales - Cyfoeth Naturiol Cymru (NRW), the Scottish Environment Protection Agency (SEPA) and, for Northern Ireland, the Department for Infrastructure - Rivers and the Northern Ireland Environment Agency. In all cases the data are subject to revision following validation (high flow and low flow data in particular may be subject to significant revision).
Details of reservoir stocks are provided by the Water Service Companies, the EA, Scottish Water and Northern Ireland Water.
The Hydrological Summary and other NHMP outputs may also refer to and/or map soil moisture data for the UK. These data are provided by the Meteorological Office Rainfall and Evaporation Calculation System (MORECS). MORECS provides estimates of monthly soil moisture deficit in the form of averages over 40 x 40 km grid squares over Great Britain and Northern Ireland. The monthly time series of data extends back to 1961.
Rainfall data are provided by the Met Office. To allow better spatial differentiation the rainfall data for Britain are presented for the regional divisions of the precursor organisations of the EA, NRW and SEPA. The areal rainfall figures have been produced by the Met Office National Climate Information Centre (NCIC), and are based on 5km resolution gridded data from rain gauges. The majority of the full rain gauge network across the UK is operated by the EA, NRW, SEPA and Northern Ireland Water; supplementary rain gauges are operated by the Met Office. The Met Office NCIC monthly rainfall series
extend back to 1910 and form the official source of UK areal rainfall statistics which have been adopted by the NHMP. The gridding technique used is described in Perry MC and Hollis DM (2005) available at http://www.metoffice.gov.uk/climate/uk/about/methods
Long-term averages are based on the period 1981-2010 and are derived from the monthly areal series.
The regional figures for the current month in the hydrological summaries are based on a limited rain gauge network so these (and the associated return periods) should be regarded as a guide only.
The monthly rainfall figures are provided by the Met Office NCIC and are Crown Copyright and may not be passed on to, or published by, any unauthorised person or organisation.
For further details on rainfall or MORECS data, please contact the Met Office:
Tel: 0870 900 0100Email: [email protected]
Enquiries
Enquiries should be directed to the NHMP:
Tel: 01491 692599Email: [email protected]
A full catalogue of past Hydrological Summaries can be accessed and downloaded at:
http://nrfa.ceh.ac.uk/monthly-hydrological-summary-uk
Some of the features displayed on the maps contained in this report are based on the following data with permission of the controller of HMSO.
i. Ordnance Survey data. © Crown copyright and/or database right 2005. Licence no. 100017897.
ii. Land and Property Services data. © Crown copyright and database right, S&LA 145.
iii. Met Office rainfall data. © Crown copyright.
All rights reserved. Unauthorised reproduction infringes crown copyright and may lead to prosecution or civil proceedings.
Text and maps in this document are © NERC (CEH) 2018 unless otherwise stated and may not be reproduced without permission.
06/2018