Embed Size (px)
Citation preview

Hydrologic Data Summary for the St. Lucie River Estuary, Martin and St. Lucie Counties, Florida, 1998-2001
By Michael J. Byrne and Eduardo Patino
U.S. Department of the Interior U.S. Geological Survey
Prepared in cooperation with theSOUTH FLORIDA WATER MANAGEMENT DISTRICT
Open-File Report 2004-1265

U.S. Department of the InteriorGale A. Norton, Secretary
U.S. Geological SurveyCharles G. Groat, Director
U.S. Geological Survey, Reston, Virginia: 2004
For more information about the USGS and its products: Telephone: 1-888-ASK-USGS World Wide Web: http://www.usgs.gov/
Any use of trade, product, or firm names in this publication is for descriptive purposes only and does not imply endorsement by the U.S. Government.
Although this report is in the public domain, permission must be secured from the individual copyright owners to repro-duce any copyrighted materials contained within this report.
Suggested citation: Byrne, M.J.,, and Patino, Eduardo, 2004, Hydrologic Data Summary for the St. Lucie River Estuary, Martin and St. Lucie Counties, Florida: U.S. Geological Survey Scientific Investigations Report 2004-1265, 19 p., plus ap-pendixes.

iii
Contents
Abstract. . . . . . . . . . . . . . . . . . . . . . . . . . . . . . . . . . . . . . . . . . . . . . . . . . . . . . . . . . . . . . . . . . . . . . . . . . . . . . . . . . . . . . . . . . . . . . . . . . . . . 1Introduction . . . . . . . . . . . . . . . . . . . . . . . . . . . . . . . . . . . . . . . . . . . . . . . . . . . . . . . . . . . . . . . . . . . . . . . . . . . . . . . . . . . . . . . . . . . . . . . . . 1
Description of Study Area . . . . . . . . . . . . . . . . . . . . . . . . . . . . . . . . . . . . . . . . . . . . . . . . . . . . . . . . . . . . . . . . . . . . . . . . . . . . . 3Previous Studies . . . . . . . . . . . . . . . . . . . . . . . . . . . . . . . . . . . . . . . . . . . . . . . . . . . . . . . . . . . . . . . . . . . . . . . . . . . . . . . . . . . . . . 5Acknowledgments. . . . . . . . . . . . . . . . . . . . . . . . . . . . . . . . . . . . . . . . . . . . . . . . . . . . . . . . . . . . . . . . . . . . . . . . . . . . . . . . . . . . 7
Methods of Data Collection and Analysis . . . . . . . . . . . . . . . . . . . . . . . . . . . . . . . . . . . . . . . . . . . . . . . . . . . . . . . . . . . . . . . . . . . . 7Collection of Field and Laboratory Data. . . . . . . . . . . . . . . . . . . . . . . . . . . . . . . . . . . . . . . . . . . . . . . . . . . . . . . . . . . . . . . . 7Computation of Continuous Flow Data. . . . . . . . . . . . . . . . . . . . . . . . . . . . . . . . . . . . . . . . . . . . . . . . . . . . . . . . . . . . . . . . 10Feasibility of Estimating Suspended-Solids Concentrations . . . . . . . . . . . . . . . . . . . . . . . . . . . . . . . . . . . . . . . . . . . 10
Summary of Hydrologic Data and Storm Events. . . . . . . . . . . . . . . . . . . . . . . . . . . . . . . . . . . . . . . . . . . . . . . . . . . . . . . . . . . . . 13Stage and Flow . . . . . . . . . . . . . . . . . . . . . . . . . . . . . . . . . . . . . . . . . . . . . . . . . . . . . . . . . . . . . . . . . . . . . . . . . . . . . . . . . . . . . . 13Salinity and Water Temperature. . . . . . . . . . . . . . . . . . . . . . . . . . . . . . . . . . . . . . . . . . . . . . . . . . . . . . . . . . . . . . . . . . . . . . 14Turbidity and Suspended-Solids Concentration. . . . . . . . . . . . . . . . . . . . . . . . . . . . . . . . . . . . . . . . . . . . . . . . . . . . . . . 15Effects of Storm Events. . . . . . . . . . . . . . . . . . . . . . . . . . . . . . . . . . . . . . . . . . . . . . . . . . . . . . . . . . . . . . . . . . . . . . . . . . . . . . . 16
Conclusions. . . . . . . . . . . . . . . . . . . . . . . . . . . . . . . . . . . . . . . . . . . . . . . . . . . . . . . . . . . . . . . . . . . . . . . . . . . . . . . . . . . . . . . . . . . . . . . . 18References Cited. . . . . . . . . . . . . . . . . . . . . . . . . . . . . . . . . . . . . . . . . . . . . . . . . . . . . . . . . . . . . . . . . . . . . . . . . . . . . . . . . . . . . . . . . . . 18Appendix. . . . . . . . . . . . . . . . . . . . . . . . . . . . . . . . . . . . . . . . . . . . . . . . . . . . . . . . . . . . . . . . . . . . . . . . . . . . . . . . . . . . . . . . . . . . . . . . . . . 19
Figures
1. Map showing location of monitoring sites in the St. Lucie River Estuary study area, Florida. . . . . . . . . .22. Map showing South Florida Water Management District control structures providing flow
to the St. Lucie River Estuary. . . . . . . . . . . . . . . . . . . . . . . . . . . . . . . . . . . . . . . . . . . . . . . . . . . . . . . . . . . . . . . . . . . . . . . .33. Photograph of the North Fork site at Veteran’s Memorial Park along the North Fork of the
St. Lucie River . . . . . . . . . . . . . . . . . . . . . . . . . . . . . . . . . . . . . . . . . . . . . . . . . . . . . . . . . . . . . . . . . . . . . . . . . . . . . . . . . . . . . .44. Orthophoto quad image showing confluence of the North and South Forks of the St. Lucie River. . . .55. Photograph showing old Roosevelt Bridge, railroad bridge, and new Roosevelt Bridge . . . . . . . . . . . . .66. Orthophoto quad image showing location of the Steele Point and Indian River Lagoon sites. . . . . . . . .6
7-12. Photographs showing:7. Indian River Bridge . . . . . . . . . . . . . . . . . . . . . . . . . . . . . . . . . . . . . . . . . . . . . . . . . . . . . . . . . . . . . . . . . . . . . . . . . . .78. High flow through the double gate at structure S-49 on the C-24 Canal . . . . . . . . . . . . . . . . . . . . . . . .79. SonTek side-looking Doppler used to measure velocity. . . . . . . . . . . . . . . . . . . . . . . . . . . . . . . . . . . . . . .8
10. Cleaning a flow-through cage and calibrating two probes . . . . . . . . . . . . . . . . . . . . . . . . . . . . . . . . . . . .811. Turbidity sensor with 30 days of biological fouling. . . . . . . . . . . . . . . . . . . . . . . . . . . . . . . . . . . . . . . . . . . . .912. Collection of an integrated water sample for suspended-solids concentration analysis . . . . . . .9
13. Graph showing relation between estimated mean velocity and measured mean velocityat the North Fork site . . . . . . . . . . . . . . . . . . . . . . . . . . . . . . . . . . . . . . . . . . . . . . . . . . . . . . . . . . . . . . . . . . . . . . . . . . . . . 11
14-16. Graphs showing index velocity rating for the:14. Steele Point site . . . . . . . . . . . . . . . . . . . . . . . . . . . . . . . . . . . . . . . . . . . . . . . . . . . . . . . . . . . . . . . . . . . . . . . . . . . . 1115. Indian River Lagoon site . . . . . . . . . . . . . . . . . . . . . . . . . . . . . . . . . . . . . . . . . . . . . . . . . . . . . . . . . . . . . . . . . . . . 1216. Speedy Point site. . . . . . . . . . . . . . . . . . . . . . . . . . . . . . . . . . . . . . . . . . . . . . . . . . . . . . . . . . . . . . . . . . . . . . . . . . . 12
17. Graph showing relation between suspended-solids concentration and turbidity atstructures S-48, S-49, and S-80 . . . . . . . . . . . . . . . . . . . . . . . . . . . . . . . . . . . . . . . . . . . . . . . . . . . . . . . . . . . . . . . . . . . 13

iv
18-20. Graphs showing comparison of:18. Turbidity at S-80, Speedy Point, and Steele Point during April and May 2000. . . . . . . . . . . . . . 1519. Discharge at S-80 and salinity at Speedy Point during April and May 2000. . . . . . . . . . . . . . . . 1820. Discharge at S-80 and turbidity at Speedy Point during April and May 2000 . . . . . . . . . . . . . . 19
Tables
1. Description of monitoring sites and types of data collected for the study . . . . . . . . . . . . . . . . . . . . . . . . . . . .42. Flow and salinity characteristics at the monitoring sites in the St. Lucie River Estuary. . . . . . . . . . . . . . 143. Suspended-solids concentration data during a discharge event (April and May 2000) from Lake
Okeechobee . . . . . . . . . . . . . . . . . . . . . . . . . . . . . . . . . . . . . . . . . . . . . . . . . . . . . . . . . . . . . . . . . . . . . . . . . . . . . . . . . . . . . 154. Comparison of instantaneous discharge, salinity, and turbidity for major storm events during
1998 and 1999 . . . . . . . . . . . . . . . . . . . . . . . . . . . . . . . . . . . . . . . . . . . . . . . . . . . . . . . . . . . . . . . . . . . . . . . . . . . . . . . . . . . . 165. Mean daily salinity and mean daily discharge for periods of large-volume discharge during
1998 and 2000 . . . . . . . . . . . . . . . . . . . . . . . . . . . . . . . . . . . . . . . . . . . . . . . . . . . . . . . . . . . . . . . . . . . . . . . . . . . . . . . . . . . . 17
Conversion Factors, Abbreviations, Acronyms, and Datums
Additional Abbreviations and Acronyms
Multiply By To obtain
inch (in.) 2.54 centimeter
foot (ft) 0.3048 meter
mile (mi) 1.609 kilometer
square mile (mi2) 2.589 square kilometer
cubic foot per second (ft3/s) 0.02832 cubic meter per second
NTU Nephelometric turbidity units
ppt parts per thousand
ABS Acoustic backscatter strength
ADCP Acoustic Doppler current profiler
EDI Equal discharge increments
PVC Polyvinyl chloride
SFWMD South Florida Water Management District
SWIM Surface Water Improvement and Management Plan
USGS U.S. Geological Survey
Temperature in degrees Celsius (°C) may be converted to degrees Fahrenheit (°F) as follows: °F = (1.8 x °C) + 32
Vertical coordinate information is referenced to the National Geodetic Vertical Datum of 1929 (NGVD of 1929); horizontal coordinate information is referenced to the North American Datum of 1983 (NAD83).

Hydrologic Data Summary for the St. Lucie River Estuary, Martin and St. Lucie Counties, Florida, 1998-2001
By Michael J. Byrne and Eduardo Patino
Abstract
A hydrologic analysis was made at three canal sites and four tidal sites along the St. Lucie River Estuary in southeastern Florida from 1998 to 2001. The data included for analysis are stage, 15-minute flow, salinity, water temperature, turbidity, and suspended-solids concentration. During the period of record, the estuary experienced a drought, major storm events, and high-water discharge from Lake Okeechobee.
Flow mainly occurred through the South Fork of the St. Lucie River; however, when flow increased through control structures along the C-23 and C-24 Canals, the North Fork was a larger than usual contributor of total freshwater inflow to the estuary. At one tidal site (Steele Point), the majority of flow was southward toward the St. Lucie Inlet; at a second tidal site (Indian River Bridge), the majority of flow was northward into the Indian River Lagoon.
Large-volume stormwater discharge events greatly affected the St. Lucie River Estuary. Increased discharge typically was accompanied by salinity decreases that resulted in water becom-ing and remaining fresh throughout the estuary until the discharge events ended. Salinity in the estuary usually returned to prestorm levels within a few days after the events. Turbidity decreased and salinity began to increase almost immediately when the gates at the control structures closed. Salinity ranged from less than 1 to greater than 35 parts per thousand during the period of record (1998-2001), and typically varied by several parts per thousand during a tidal cycle.
Suspended-solids concentrations were observed at one canal site (S-80) and two tidal sites (Speedy Point and Steele Point) during a discharge event in April and May 2000. Results suggest that most deposition of suspended-solids concentration occurs between S-80 and Speedy Point. The turbidity data collected also support this interpretation. The ratio of inorganic to organic suspended-solids concentration observed at S-80, Speedy Point, and Steele Point during the discharge event indi-cates that most flocculation of suspended-solids concentration occurs between Speedy Point and Steele Point.
Introduction
The St. Lucie River Estuary is a major tributary of the Indian River Lagoon, which extends about 155 mi along the central-east coast in Martin and St. Lucie Counties, Florida (fig. 1). Drainage modifications and urbanization in the St. Lucie watershed have: (1) substantially increased wet-season flows and decreased dry-season flows entering the estuary, and (2) increased the occurrence of high-volume stormwater discharge events that produce extreme salinity fluctuations and sedimentation rates. The transport of these sediments as suspended load decreases light penetration with increased turbidity, and deposition of the sediments creates layers of fine-grained, nutrient-rich muck within the estuary. These processes have had detrimental effects on sea grass communities and on the overall health of the estuarine system (Steward and others, 1993).
The St. Lucie River Estuary, which is part of the Indian River Lagoon ecosystem, contains suspended material with high organic content (Steward and others, 1993). Estimation tech-niques to calculate sediment loads on a continuous basis with sufficient accuracy, however, are lacking. Specifically, water managers need a method to accurately determine: (1) suspended-solids loads entering the estuary, (2) suspended-solids transport and deposition characteristics within the estuary, and (3) the relation of suspended-solids transport to tidal flows and fresh-water inflows.
The U.S. Geological Survey (USGS), in cooperation with the South Florida Water Management District (SFWMD), began a study in 1999 to develop and test an estimation model for the computation of suspended-solids concentration based on time-series data of acoustic backscatter strength (ABS) and turbidity. This study is presented in two reports. The first report (Patino and Byrne, 2004) describes the feasibility of using acoustic and optic methods to estimate suspended-solids concentrations in the St. Lucie River Estuary. The second report (this report) describes all hydrologic data collected during the study and summarizes all methods and techniques used in the collection and analysis of these data. Data collected or observed include stage, flow, salinity, water temperature, turbidity, ABS, and suspended-solids concentration.

2 Hydrologic Data Summary for the St. Lucie River Estuary, Martin and St. Lucie Counties, Florida, 1998-2001
FLO
RID
A’S
TU
RN
PIK
E
95
95
95
1
STUDYAREA
MONITORING SITES
80°30´
27°30´
27°00´
27°15´
St. Lucie Canal (C-44)
MARTIN COUNTY
MA
PALM
ST. LUCIE COUNTYIN
DIA
NR
IVE
R
B
Fort
Veteran’s MemorialPark (KellstadtBridge, North Fork)
C-25 Canal
C-24 Canal
North
Fork
So
TenM
ileC
reek
Five
Mile
Creek
C-23 Canal
S-80
S-48
(
EXPLANATION
S-49
Study area
Flow, salinity and temperature monitoring
Flow, salinity, turbidity and temperaturemonitoring, and suspended solids sampling
Control structures (gates). Flow, salinity,turbidity and temperature monitoring. S-48and S-49 flow computed by the South FloridaWater Management District
Base from U.S. Geological Survey digital data, 1972Universal Transverse Mercator projection, Zone 17, Datum NAD
Figure 1. Location of monitoring sites in the St. Lu
A1A
1
80°15´ 80°00´
0
0
6 MILES
6 KILOMETERS
2 4
2 4
RTIN COUNTY
BEACH COUNTY
AT
LA
NT
ICO
CE
AN
JupiterInlet
Hobe Sound
North JupiterNarrows
Sailfish Point(St. Lucie Inlet)
Hutchinson Island
ear Point
Pierce Inlet
St. Lucie
River
uth
Fork
Old
SouthF
orkJensenBridge
Speedy PointRoosevelt Bridge)
Steele Point(Evans Crary, Sr., Bridge)
Indian River Lagoon(Indian River Bridge)
Nuclear Power Plant
LA
GO
ON
83
cie River Estuary study area, Florida.

Introduction 3
For the present study (this report), data were collected from four tidal flow sites (North Fork, Speedy Point, Steele Point, and Indian River Lagoon) using salinity and temperature probes in profile; three of these sites have turbidity sensors. Additionally, three existing canal sites (S-49, S-48, and S-80) were instrumented with salinity, temperature, and turbidity probes. Data collected from all seven sites are presented in the appendix as text, Microsoft Excel, and comma-separated value (csv) files that can be imported into most spreadsheet programs. Index velocity flow ratings also are provided in this report for the North Fork, Speedy Point, Steele Point, and Indian River Lagoon tidal sites.
Description of Study Area
The St. Lucie River Estuary encompasses about 11 mi2 in St. Lucie and Martin Counties (Steward and others, 1993), and consists of the North and South Forks of the St. Lucie River (fig. 1). The two forks converge near the Roosevelt Bridge along US-1, and the estuary extends another 6 mi downstream to the Indian River Lagoon, which is connected to the Atlantic Ocean through the St. Lucie Inlet. Five tributaries to the estuary
0
0
80°30´
27°15´
27°00´
S-308
LakeO
keechobee
ST. LUCIE COUNTY
MARTIN COUNTY
MARTIN COUNTY
PALM BEACH COUNTY
710
JCONTROL STRUCTURE AND NUMBER
EXPLANATION
St. Lucie Can
C-24 C
C-23 Canal
Base from U.S. Geological Survey digital data, 1972Universal Transverse Mercator projection, Zone 17, Datum NAD 83
Figure 2. South Florida Water Management District contro
provide drainage for a watershed that encompasses about 820 mi2. Ten Mile Creek Canal, C-24 Canal, and C-23 Canal flow into the North Fork of the St. Lucie River; the Old South Fork and St. Lucie Canal (C-44) flow into the South Fork.
The C-24, C-23 and C-44 Canals (fig. 1) were improved after tropical storms caused extensive flooding in southeastern Florida during the 1940s. The improvements were designed to: (1) increase drainage in the watershed, (2) supplement the local water supply, and (3) help maintain elevated ground-water levels near the coastal control structures to prevent saltwater intrusion (Steward and others, 1993). The C-24 and C-23 Canals receive water from urban and agriculture lands, and the C-44 Canal receives water from Lake Okeechobee through structure S-308 (fig. 2).
Four sites (North Fork, Speedy Point, Steele Point, and Indian River Lagoon) in areas with tidally influenced flow were constructed for this study (fig. 1 and table 1). The North Fork site is located at Veteran’s Memorial Park along the North Fork of the St. Lucie River (figs. 1 and 3). Flow at the North Fork site includes urban and agricultural runoff from Ten Mile Creek and Five Mile Creek. The Speedy Point site is located at the conflu-ence of the North and South Forks of the St. Lucie Estuary (figs. 1 and 4). The instrumentation for this site is located
6 MILES
6 KILOMETERS
2 4
2 4
80°15´
S-80
S-48
S-97
S-49
ATLA
NTIC
OC
EA
N
1
FLORID
A’S
TU
RN
PIK
E
North
Fork
St. Lucie
River
South
Fork
al (C-44)
anal
l structures providing flow to the St. Lucie River Estuary.

4 Hydrologic Data Summary for the St. Lucie River Estuary, Martin and St. Lucie Counties, Florida, 1998-2001
Figure 3. North Fork site at Veteran’s Memorial Park along the North Fork of the St. Lucie River.
Table 1. Description of monitoring sites and types of data collected for the study.[Sites are listed from north to south. Tidal sites were constructed for this study. Types of data: 1, flow; 2, salinity; 3, turbidity; 4, suspended-solids concentration; 5, water temperature. USGS, U.S. Geological Survey; SFWMD, South Florida Water Management District; NA, not applicable; --, data not available]
Sitenumber or
name
USGS site identifi-cation
number
Type of site Period of record Location
Channeldimensions at
instrumentationlocation (in feet)
Types of data collected
and remarks
Width Depth
North Fork 02276575 Tidal 07/30/97 - 10/05/00 North Fork of St. Lucie River 290 8 1-5
S-49 NA Canal (freshwater)
04/01/00 - 10/05/00 Upstream of S-49 along C-24 Canal near gate
-- 15 1-5; flow computed by the SFWMD
S-48 NA Canal (freshwater)
04/01/00 - 10/05/00 Upstream of S-48 along C-23 Canal on side of weir
-- 5 1-5; flow computed by the SFWMD
S-80 NA Canal (freshwater)
04/01/00 - 10/05/00 Upstream of S-80 along C-44 Canal
-- 8 1-5
Speedy Point 02277100 Tidal 09/15/97 - Present Roosevelt Bridge catwalk 1,000 20 1-5; stage and salinity only as of 10/1/00
Steele Point 02277110 Tidal 07/31/97 - Present Evans Crary St. Bridge on east piling
2,800 12 1-5; stage and salinity only as of 10/1/00
Indian River Lagoon
02253800 Tidal 08/03/97 - 10/05/0010/01/01 - Present
Sewalls Point on Indian River Bridge catwalk
6,000 12 1, 2, and 5; stage and salinity only as of 10/1/01

Introduction 5
Figure 4. Confluence of the North and South Forks of the St. Lucie River. This image predates the construction of the new Roosevelt Bridge and Speedy Point Site.
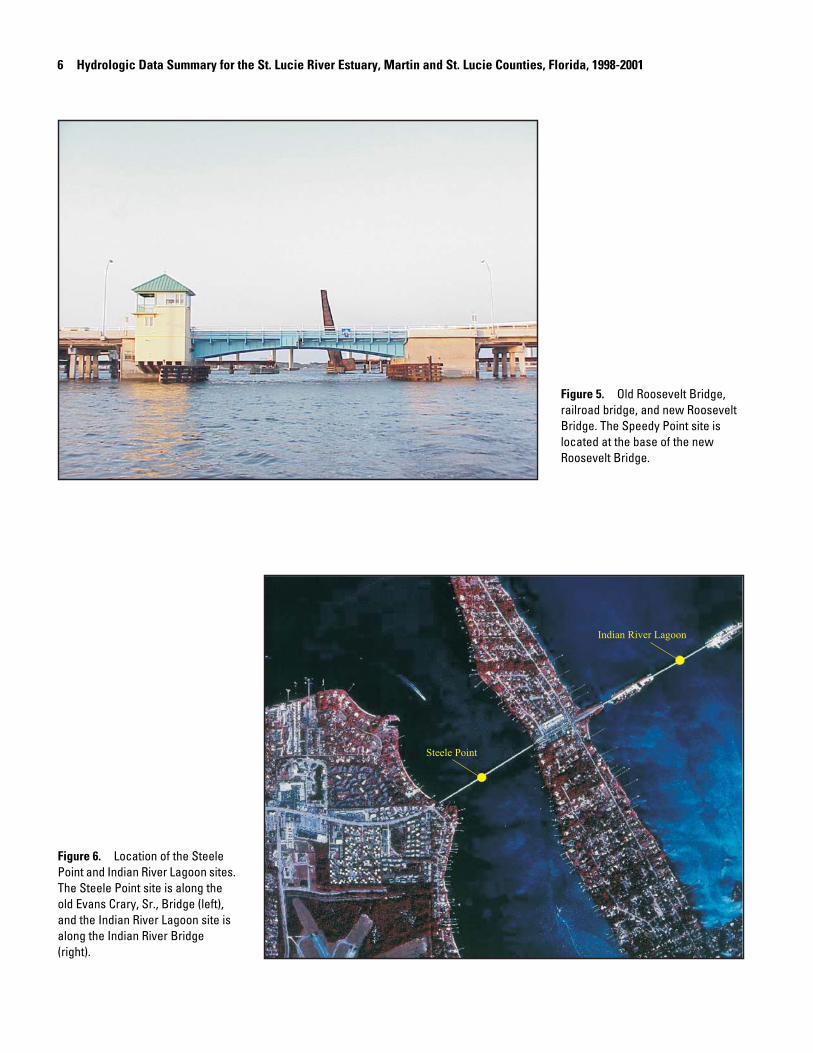
beneath the new Roosevelt Bridge, which is about 800 ft down-stream from the old Roosevelt Bridge and 500 ft downstream from the railroad bridge (fig. 5). Flow around the bridges is often turbulent because of channel geometry in the estuary. The Steele Point site is beneath the Evans Crary, Sr., Bridge, about 3.5 mi downstream of the new Roosevelt Bridge (figs. 1 and 6). The instrumentation was moved 200 ft south from the old Evans Crary, Sr., Bridge to the new Evans Crary, Sr., Bridge in July 2000 water. The Indian River Lagoon site is located beneath the Indian River Bridge, 3 mi north of the St. Lucie Inlet (figs. 1, 6 and 7).
Three preexisting “canal” sites were used for this study at control structures S-49, S-48 and S-80 (fig. 1 and table 1). Discharge from the C-24 Canal into the North Fork of the St. Lucie River Estuary (fig. 1) is controlled by the double-lift gate at S-49 (figs. 2 and 8). Discharge from the C-23 canal into the North Fork of the St. Lucie River is controlled by the double lift gate at S-97 and coastal weir at S-48 (fig. 2). Discharge from the C-44 Canal into the South Fork of the St. Lucie River is controlled by S-80 (St. Lucie Locks).
Previous Studies
Several previous studies have highlighted the most serious issues regarding water quality in the St. Lucie River Estuary as outlined in the The Indian River Lagoon Surface Water Improvement and Management (SWIM) Plan (Steward and others, 1993). The goal of this plan was to establish minimum and maximum flows to keep the estuary upstream of the Roosevelt Bridge within a salinity range of 5 to 18 ppt. Davies-Colley and Smith (2001) reviewed methodologies used to deter-mine suspended sediment concentration and water clarity, and noted that a poor correlation typically exists between water clar-ity and turbidity. The conclusion was that visual water clarity or beam attenuation should supplant nephelometric turbidity in many water-quality applications, including environmental stan-dards. Simpson and Bland (2000) described the methods for accurate estimation of net flow in a tidal channel. The descrip-tion also included explanations of the principles behind index velocity ratings and limiting errors in flow computations. Instantaneous flow was low-pass filtered to remove tidal effects.
6 Hydrologic Data Summary for the St. Lucie River Estuary, Martin and St. Lucie Counties, Florida, 1998-2001
Steele Point
Indian River Lagoon
Figure 6. Location of the Steele Point and Indian River Lagoon sites. The Steele Point site is along the old Evans Crary, Sr., Bridge (left), and the Indian River Lagoon site is along the Indian River Bridge (right).
Figure 5. Old Roosevelt Bridge, railroad bridge, and new Roosevelt Bridge. The Speedy Point site is located at the base of the new Roosevelt Bridge.

Methods of Data Collection and Analysis 7
Figure 7. Indian River Bridge. The Indian River Lagoon site is located at the base of the left tower.
Figure 8. High flow through the double gate at structure S-49 on the C-24 Canal. The gate is used to control discharge to the North Fork of the St. Lucie Estuary.
Acknowledgments
The authors gratefully acknowledge the cooperation and assistance of Gordon Hu from the Upper East Coast Planning Divi-sion of the SFWMD. Much appre-ciation also is extended to the following USGS hydrologic tech-nicians who installed the instru-mentation and aided in the data collection: Keith Overton, Lars Soderqvist, Rick Solis, Marc Stewart, Gene Krupp, and Stephanie Obley.
Methods of Data Collection and Analysis
Monitoring sites in the study area were used to collect stage, salinity, water temperature, optical backscatter (turbidity), ABS, and suspended-solids concentration data. Regression analyses were used to develop ratings for the computation of continuous flow data. The feasibility of estimating
suspended-solids concentration from turbidity and ABS data also was examined; however, no estimation of suspended-solids concentrations using these techniques is presented in this report.
Collection of Field and Laboratory Data
Continuously recorded data were collected at 15-minute intervals, and a satellite data collection platform (Sutron 8210) was used to log and transmit the data. Water samples for deter-mination of suspended-solids concentration were collected on a monthly and event-driven basis over most of the full range of flow and stage conditions, including storm or high flow events. Descriptions of the types of data collected are discussed here.
• Acoustic Backscatter Strength (ABS)—An acoustic side-looking Doppler was used to continuously mea-sure ABS, which is a measure of return signal strength and reported in counts.
• Stage and flow—Stage was measured using a pressure transducer or encoder inside an 8-in.-diameter poly-vinyl chloride (PVC) stilling well, and velocity was measured using a side-looking Doppler (fig. 9). Contin-uously measured stage and index velocity were used to compute continuous flow data (described later). The accuracy of stage data is +0.1 ft because of the stated accuracy of benchmarks used for leveling, and the difficult terrain in which the surveys were made.

8 Hydrologic Data Summary for the St. Lucie River Estuary, Martin and St. Lucie Counties, Florida, 1998-2001
YSI 6820
Figure 9. SonTek side-looking Doppler used to measure velocity. Copyrighted photograph by SonTek/YSI, Inc. Used with permission.
• Salinity and water temperature—Probes at two depths were used to continuously measure conductance and temperature (fig. 10) in profile to determine if the water column was stratified at selected sites. Salinity was computed automatically by the sensor from the conductance and temperature measurements using the default algorithms in Greenberg (1995). Salinity instru-ment accuracy is +1.0 per-cent of the reading or 0.1 ppt, whichever is greater. Temperature instrument accuracy is +0.15 percent of the reading, which is in degrees Celsius (Yellow Springs Incorporated, undated).
• Optical backscatter (turbidity)—A probe (Yellow Springs Incorpo-rated Model 6820 or 6920) was used to continuously measure turbidity in
Figure 10. Cleaning a flow-through cage and calibrating two probes. Both propes (YSI 600 and YSI 6820) were used to continuously measure conductance and temperature; the YSI 6820 was also used to measure turbidity.
nephelometric turbidity units. The turbidity probe has an optical 90 degree scatter, a mechanical cleaning wiper, and an accuracy of +5 percent of the reading or 2 NTUs, whichever is greater (Yellow Springs Incorpo-rated, undated). The quality of record is reduced with increased biofouling (fig. 11), which occurs when salinity is greater than 15 ppt and water temperature is greater than 25° C.
• Suspended-solids concentration—Suspended-solids sampling and laboratory analysis were used to measure suspended-solids concentration at the time intervals specified earlier. Point samples were collected near the site instrumentation (Patino and Byrne, 2004) with a horizontal Van Dorn Bottle (Wildlife Supply Com-pany, 1999). Depth- integrated samples were collected near the instrumentation using a DH-59 (fig. 12) sam-pler (U.S. Interagency Committee on Water Resources, Subcommittee on Sedimentation, 1965) and in the cross section using the equal discharge increments (EDI) method (Guy, 1970). Traditional laboratory techniques used to determine total suspended-solids concentration were modified to address potential bias in the results as compared to the laboratory methods used for suspended-sediment con-centration analyses (Gray and others, 2000). Analyses performed at the USGS Ocala Laboratory in Florida were modified to process: (1) entire water samples, rather than aliquots from samples; and (2) all bottles from depth-integrated cross-sectional samples, rather than a subsample. The suspended-solids concentrations were obtained by drying sample contents at 105° C.
YSI 600
Flowthrough
cage

Methods of Data Collection and Analysis 9
Figure 11. Turbidity sensor with 30 days of biological fouling.
Figure 12. Collection of an integrated (top to bottom) water sample for sus-pended-solids concentration analysis.

10 Hydrologic Data Summary for the St. Lucie River Estuary, Martin and St. Lucie Counties, Florida, 1998-2001
The volatile component was determined by baking the contents at 500° C and subtracting the inorganic resi-due from the suspended-solids concentration value. To avoid misinterpretation, laboratory results are pre-sented as suspended-solids concentrations in this report.
Computation of Continuous Flow Data
Computation of continuous flow data at tidal sites required the determination of channel cross-sectional area and mean velocity every 15 minutes. Channel cross-sectional area was calculated using a stage-area relation as described by Hittle and others (2001) and Regan and Schaffranek (1985). Mean veloc-ity calculations required the development of index-velocity ratings, which relate index velocity (measured with an in situ velocity meter) to mean channel velocity computed from ADCP discharge measurements (Hittle and others, 2001). The ADCP measurements were made over the tidal range at each site, with periodic measurements made for verification purposes.
The North Fork site required the use of multiple variables to describe the index-velocity relation. A multivariate regres-sion analysis was performed using index velocity and stage as independent variables, and measured mean velocity as the dependent variable. The index-velocity rating for the North Fork site is described as follows:
V = (0.706 + 0.21GHT)* Vi , (1)
R2 = 0.991,
where V is the computed mean velocity, GHT is stage, Vi is the index velocity, and R2 is the coefficient of determination. The relation between index and mean velocity at this site varies with changing water levels and cannot be shown on a two-dimen-sional graph; instead, the relation is presented as a plot of estimated mean velocity to measured mean velocity (fig. 13).
Index-velocity ratings for the Steele Point and Indian River Lagoon sites were also developed using regression anal-yses. These analyses, however, included only index velocity and measured mean velocity as variables because stage had no substantial effect on the velocity relations. Multiple index-velocity ratings were necessary for Steele Point due to bridge construction and instrument relocations. These ratings are shown in figure 14 and given below:
Period of record EquationCoefficient of determination
11/15/98 - 7/30/99 V = 0.611Vi + 0.0904 R2 = 0.965
7/30/99 - 7/10/00 V = 0.592Vi + 0.0361 R2 = 0.956
7/11/00 - 9/30/00 V = 0.638Vi + 0.0692 R2 = 0.960
The index-velocity rating used for the Indian River Lagoon site is shown in figure 15 and given below:
V = 0.896Vi + 0.149, (2)
R2 = 0.963.
The index-velocity rating developed for the Speedy Point Site (fig. 16) was considered to be too poor to compute contin-uous flow record, which could be attributed to the site location. The site is at a bottleneck in the estuary, just downstream from the confluence of the North and South Forks of the St. Lucie River (figs. 1 and 4), where water passing between (and deflected by) large footings of the new Roosevelt Bridge is measured. Consequently, the hydraulic setting creates turbulent flow that is too inconsistent to provide for a consistent velocity index through all ranges of both stage and velocity.
Feasibility of Estimating Suspended-Solids Concentrations
Acoustic and optic methods were used to study the feasi-bility of estimating suspended-solids concentrations in the St. Lucie River Estuary, with results documented in a separate report by Patino and Byrne (2004). The feasibility study required the development of relations between surrogate data (ABS and turbidity) and suspended-solids concentration data collected at the North Fork, Speedy Point, and Steele Point sites. These relations were examined to determine how well data from acoustic and (or) optic instruments could describe suspended-solids concentrations in the local space. In this report, local space represents an area that is at the altitude of the acoustic Doppler velocity meter transducer and about 9 ft from the transducer toward the center of the stream.
To calculate mean concentrations of suspended solids that are representative of the entire stream, it was also necessary to extrapolate these relations vertically and horizontally. This extrapolation was accomplished by taking concurrent samples at a fixed point near the sensors, and vertically integrated (top to bottom) samples at several locations across the stream, using techniques described earlier. The samples then were used to develop point-to-mean relations.
The quality of point-to-mean relations was obtained and showed considerable variation between sites. A good relation was obtained for the North Fork site (R2 = 0.81), and a poor rela-tion was obtained for Speedy Point (R2 = 0.57). A relation could not be obtained for Steele Point due to multiple instrument relo-cations and a consequent lack of sufficient measurements. The number of suspended-solids samples collected at the canal sites (S-48, S-49, and S-80) were limited because the instrumentation was only in place for about 6 months. Consequently, there were not enough samples to develop point-to-mean relations for these sites.

Methods of Data Collection and Analysis 11
y = 0.611x + 0.0904
R2
= 0.965
Rating 1
November 15, 1998 - July 30, 1999
y = 0.592x - 0.0361
R2
= 0.956
Rating 2
July 30, 1999 - July 10, 2000
y = 0.638x - 0.0692
R2 = 0.960
Rating 3
July 11, 2000 - Sept. 30, 2000
-1.0
-0.8
-0.6
-0.4
-0.2
0
0.2
0.4
0.6
0.8
1.0
-1.5 -1.0 -0.5 0 0.5 1.0 1.5
MEASURED INDEX VELOCITY, IN FEET PER SECOND
ME
AS
UR
ED
ME
AN
VE
LO
CIT
Y,
INF
EE
TP
ER
SE
CO
ND
MEASURED (RATING 1)MEASURED (RATING 2)
MEASURED (RATING 3)
EXPLANATIONCALIBRATION RATING
R2 COEFFICIENT OF DETERMINATION
-1.5
-1.0
-0.5
0
0.5
1.0
1.5
-1.5 -1.0 -0.5 0.0 0.5 1.0 1.5
MEASURED MEAN VELOCITY, IN FEET PER SECOND
ES
TIM
AT
ED
ME
AN
VE
LO
CIT
Y,
INF
EE
TP
ER
SE
CO
ND
ONE-TO-ONE LINE
EXPLANATION
ADCP MEASURED MEAN VELOCITY
Figure 14. Index velocity rating for the Steele Point site. Multiple ratings were required because of instrument relocations during the study. Measured mean velocity was obtained from Acoustic Doppler Current Profiler discharge measurements.
Figure 13. Relation between estimated mean velocity and measured mean velocity at the North Fork site. Estimated mean velocity was computed using an index-velocity rating; measured mean velocity was obtained from Acoustic Doppler Current Profiler (ADCP) discharge measurements.

12 Hydrologic Data Summary for the St. Lucie River Estuary, Martin and St. Lucie Counties, Florida, 1998-2001
y = 0.896x - 0.149
R 2= 0.963
-1.5
-1.0
-0.5
0
0.5
1.0
1.5
-1.5 -1.0 -0.5 0 0.5 1.0 1.5 2.0
MEASURED
EXPLANATION
CALIBRATION RATING
R2 COEFFICIENT OF DETERMINATION
ME
AS
UR
ED
ME
AN
VE
LO
CIT
Y,
INF
EE
TP
ER
SE
CO
ND
MEASURED INDEX VELOCITY, IN FEET PER SECOND
y = 1.17x - 0.0047
R2= 0.808
-0.5
0
0.5
1.0
1.5
MEASURED
EXPLANATION
CALIBRATION RATING
R2 COEFFICIENT OF DETERMINATION
-1.5
-1.0
-1.5 -1.0 -0.5 0 0.5 1.0 1.5
ME
AS
UR
ED
ME
AN
VE
LO
CIT
Y,
INF
EE
TP
ER
SE
CO
ND
MEASURED INDEX VELOCITY, IN FEET PER SECOND
Figure 16. Index velocity rating for the Speedy Point site. Measured mean velocity was obtained from Acoustic Doppler Current Profiler discharge measurements.
Figure 15. Index velocity rating for the Indian River Lagoon site. Measured mean velocity was obtained from Acoustic Doppler Current Profiler discharge measurements.

Summary of Hydrologic Data and Storm Events 13
The quality of the ABS data collected during the study was affected by biological fouling on the transducer faces, and the data were not quality assured nor reviewed; therefore, the data are not presented in this report. Additionally, ABS data were not used to compute time-series suspended-solids concentra-tions due to: (1) the limitations with the ABS data just mentioned, (2) the unverified nature of the relations obtained, and (3) the limited concentration range of samples collected at the sites.
Computations of suspended-solids time-series data using turbidity were not possible for the tidal sites (North Fork, Speedy Point, and Steele Point) because the continuous turbid-ity data were intermittent owing to fouling problems (fig. 11), and samples collected at these sites had a limited concentration range. The canal sites (S-48, S-49, and S-80) yielded good turbidity data during the brief period the instruments were in use. Although only a limited number of suspended-solids measurements were obtained at these sites, the data were collected over a wide range of concentrations; results suggest that turbidity can be used to estimate suspended-solids concen-trations at these locations. Further data collection and investi-gation are warranted, however, to confirm this finding. The relation of turbidity to suspended-solids concentration for data from the three canal sites is shown in figure 17.
0
10
15
20
25
30
35
40
45
50
0 10 20
TURBIDITY, IN NEPHEL
SU
SP
EN
DE
D-S
OL
IDS
CO
NC
EN
TR
AT
ION
,IN
MIL
LIG
RA
MS
PE
RL
ITE
R
MEASURED S-48
EXPLANATION
R2 COEFFICIENT OF DETERMINATION
MEASURED ANDS-49 S-80
REGRESSION LINE (S-49 AND S-80
5
Figure 17. Relation between suspended-solids concenregression), S-49, and S-80.
Summary of Hydrologic Data and Storm Events
The subsequent sections present a brief summary of the hydrologic data collected during the study. Over the period of record (1998-2001), the St. Lucie River Estuary experienced a drought, several major storm events, and high-water discharges from Lake Okeechobee. The monitoring sites were strategically located to capture the effects of these events, which are discussed herein. The data collected at the monitoring sites (given in the appendix) can be used to determine how water moved throughout the estuary during the major storm events.
Stage and Flow
Stage at all tidal sites (North Fork, Speedy Point, Steele Point, and Indian River Lagoon) was affected by tides, storm surge, and large freshwater releases from sites S-48, S-49 and S-80. All flow records collected for this study are presented as 15-minute time-series data. Mean daily values are not presented because flow data were not filtered to remove the effects of tide.
During the study, the majority of inflow to the St. Lucie River Estuary occurred through the South Fork of the St. Lucie River. When flow increased through control structures at the
R2= 0.939
30 40 50 60
OMETRIC TURBIDITY UNITS
)
y = 0.72x + 0.85
tration and turbidity at structures S-48 (not used in

14 Hydrologic Data Summary for the St. Lucie River Estuary, Martin and St. Lucie Counties, Florida, 1998-2001
C-23 and C-24 Canals, however, the North Fork of the St. Lucie River contributed a larger than usual percentage of the total freshwater inflow to the estuary.
The quality of velocity data at the Speedy Point monitor-ing site was probably affected by the nearby location of veloc-ity instruments and turbulence caused by large bridge footings. Because of these complications, the index-velocity rating at this site had large associated errors, and was not used for calcu-lating flow at this location. Therefore, time-series discharge data for Speedy Point are not presented as part of this report.
Time-series discharge data indicate that water flows in opposite directions at the Steele Point and Indian River Lagoon sites. At Steele Point, most of the water flows in a southerly direction at the outfall of the estuary and toward the St. Lucie Inlet. At the Indian River Lagoon site, water flows in a north-erly direction, away from the outfall of the St. Lucie River Estuary and St. Lucie Inlet. This finding suggests that the St. Lucie River Estuary is a source of water for the southern end of the Indian River Lagoon.
Salinity and Water Temperature
Salinity at the North Fork, Speedy Point, Steele Point, and Indian River Lagoon tidal sites was affected by upstream canal freshwater discharge, rainfall, and tides. Results of the data
Table 2. Flow and salinity characteristics at the mon[All data were collected from August 1997 to September 2000. Sites areppt, parts per thousand; <, less than; >, greater than; NA, not applicable
Site number or name
Tidal Mixin
North Fork Yes
Well mixed hoand verti
S-49 No
S-48 No
S-80 No
Speedy Point YesStratified du
discharge Steele Point Yes
Indian River Lagoon Yes
1The values provided are for qualitative comparison only, becat tidal sites. The mean daily discharge for these sites may be afnot indicative of net downstream discharge.
collected at all monitoring sites in the St. Lucie River Estuary indicate that rapid decreases in salinity occurred during periods of heavy rain and during large freshwater discharges from Lake Okeechobee and other areas within the watershed. At Speedy Point, salinity near the top and bottom of the water column often decreased below 1 ppt during large freshwater releases to the estuary. Salinity data at Steele Point indicate that the water column became highly stratified during these events, with differences between top and bottom salinities occasionally exceeding 10 ppt. Rapid declines in salinity occurred at the Indian River Lagoon site during these discharge events and occasionally exceeded 10 ppt. During periods of drought, salin-ity at Speedy Point exceeded the SWIM recommended maxi-mum level of 18 ppt (Steward and others, 1993), and salinity at Steele Point exceeded 35 ppt.
In summary, data from this study indicate that salinity within the St. Lucie River Estuary can range from less than 1 ppt to greater than 35 ppt (table 2) as a result of hydrologic events and water-management practices within the St. Lucie River watershed. Vertical salinity stratification also is a common occurrence, especially during storm events, and is characterized by freshwater lying above more saline water. Temperature data collected within the estuary show a cyclic diurnal pattern, but can also be affected by the large freshwater releases just described.
itoring sites in the St. Lucie River Estuary. listed from north to south. ft3/s, cubic feet per second; ]
gMean daily flow
(ft3/s)1
Mean daily salinity
(ppt)
rizontallycally
-1,280 - 3,080 0.1 - 20.5
0 - 2,300 <0.1
0 - 3,000 <0.1
150 - 7,800 <0.1
ring high events
NA <0.1 - 30
-1,140 - 16,200 0.2 - >35
-18,800 - 10,200 14 - 37
ause mean daily values do not represent actual ranges in flow fected by aliasing due to tides, or contain fluctuations that are

Summary of Hydrologic Data and Storm Events 15
Turbidity and Suspended-Solids Concentration
The suspended-solids concentrations observed at S-80, Speedy Point, and Steele Point during the April and May 2000 discharge event suggest that most deposition of suspended solids occurs between S-80 and Speedy Point; turbidity data also support this interpretation. During the event, suspended-solids concentrations observed at S-80 were about twice the
0
10
20
30
40
50
60
70
80
90
100
4/14 4/19 4/24 4/29 5/04
ME
AN
DA
ILY
TU
RB
IDIT
Y,
INN
EP
HE
LO
ME
TR
ICT
UR
BID
ITY
UN
ITS
Sp
Speedy Point(no. 2)
S-80
Table 3. Suspended-solids concen(April and May 2000) from Lake Okee[Concentrations are in milligrams per liter]
Site DateS
Tota
S-80 4/29/00 96
4/29/00 100
5/4/00 79
Speedy Point 4/28/00 51
5/4/00 49
Steele Point 4/28/00 43
5/4/00 40
Figure 18. Comparison of turbidity at S-80, Speedy Point, aindicates missing data.
concentration observed downstream at the Speedy Point site (table 3). Suspended-solids concentrations farther downstream at Steele Point were about 20 percent lower than at Speedy Point (table 3). A comparison of turbidity peaks for April 28 suggests that turbidity at S-80 was more than twice the observed turbidity downstream at Speedy Point (fig. 18). Farther down-stream, turbidity at Steele Point rose slightly during this period (fig. 18); however, instrument fouling may have prevented measuring higher turbidity values.
5/09 5/14 5/19 5/24 5/29
2000
COMPARISON LINE OF 4/28/00
COMPARISON LINE OF 4/29/00
eedy Point(no. 1)
Steele Point(no. 2)
Steele Point(no. 1)
EXPLANATION
tration data during a discharge event chobee.
uspended-solids concentration
l Organic Inorganic
65 31
67 33
55 24
36 15
33 16
33 10
30 10
nd Steele Point during April and May 2000. Break in line

16 Hydrologic Data Summary for the St. Lucie River Estuary, Martin and St. Lucie Counties, Florida, 1998-2001
The ratios of inorganic to organic suspended-solids concentration observed at S-80, Speedy Point, and Steele Point during the April and May 2000 discharge event suggest that most flocculation of suspended-solids concentration occurs between Speedy Point and Steele Point. The ratio of inorganic to organic suspended-solids concentration at S-80 and Speedy Point was about 2:1; however, the ratio at Steele Point was 3:1 (table 3).
Effects of Storm Events
The hydrologic effects of major storms events, such as hurricanes and tropical storms, are influenced in the study area by water-management decisions to control surrounding water bodies for flood protection. Several days are required to lower water levels sufficiently to provide satisfactory flood protec-tion; therefore, large water releases begin several days before a potential event. Following an event, several days to a month are typically required for water levels to return to normal. Several hurricanes and tropical storms affected the area during this
study: Hurricane Mitch on November 6, 1998; Hurricane Floyd on September 15, 1999; and Hurricane Irene on October 15, 1999 (Schweigart and others, 1999). These dates are for landfall or closest approach to the St. Lucie River Estuary.
Extended periods of freshwater discharge through the S-49 gates, S-48 weir, and S-80 locks (fig. 1) are associated with decreased salinity (from brackish water to freshwater) and increased turbidity in the estuary. During the wet season and associated periods of increased hurricane activity, large fresh-water releases by the SFWMD can last as long as a month, as was the case with Hurricane Irene on October 8, 1999, when freshwater discharge continued through November 18, 1999 (table 4). During the dry season (November to April), two large off-season water releases from the C-44 Canal occurred: one from January 7, 1998, to April 21, 1998, and the other from April 12, 2000, to May 21, 2000. These discharges caused estu-ary salinity to decrease rapidly from highly saline water to freshwater (table 5). The discharged freshwater extended north past the Indian River Lagoon site, lowering salinities at the bridge from 35 ppt to less than 25 ppt.
Table 4. Comparison of instantaneous discharge, salinity, and turbidity or major storm events during 1998 and 1999. [Sites are listed from north to south. Date ranges shown for hurricanes refer to periods these storms affected St. Lucie River Estuary hydrology. Discharge is in cubic feet per second, salinity is in parts per thousand, and turbidity is in nephelometric turbidity units. N, number of measurements; NA, not applicable or not available; blank, no measurements made]
Measurement type
Hurricane Mitch 11/4/98-11/13/98 Hurricane Floyd 9/15/99-9/25/99 Hurricane Irene 10/8/99-11/18/99
NMaxi-mum
Mini-mum
Me-dian
NMaxi-mum
Mini-mum
Me-dian
NMaxi-mum
Mini-mum
Me-dian
North Fork
Discharge 858 4,932 -3,518 791 606 5,465 -5,148 1,328 3,401 7,409 -5,632 1,335
Salinity no. 1 960 8.7 .2 .3 873 .8 .3 .4 3,902 1.7 .12 .3
Salinity no. 2 960 9.9 .2 .3 870 .8 .3 .7 3,898 4.9 .12 .3
Turbidity NA 864 25.6 .7 6.5 2,753 18.4 .6 3.6
S-49
Discharge1 10 2,323 467 1,005 10 1,004 141 545 40 3,380 74.2 826
S-48
Discharge1 10 3,126 16 764 11 1,469 20 314 49 4,174 12 414
S-80
Discharge 960 7,947 35 1,072 1,056 2,657 35 240 4,032 9,079 35 2,376
Speedy Point
Salinity no. 1 960 23.8 .3 1.3 1,008 8.52 1.5 4.6 3,315 8.0 .1 .6
Salinity no. 2 732 18.7 .9 2.4 1,007 17.1 1.4 5.9 3,444 18.6 .1 .6
Turbidity no. 1 NA 1,006 76.8 4.2 9.2 2,861 63.6 .2 13.8
Turbidity no. 2 NA 31.4 3.4 9.8 3,427 64.3 .8 17.5
Steele Point
Discharge 960 38,632 -34,118 13,575 1,044 32,821 -37,695 6,192 3,642 40,664 -39,910 11,183
Salinity no. 1 960 27.2 1.0 3.7 1,038 26.9 3.2 10.3 3,625 21.4 .1 4.4

Summary of Hydrologic Data and Storm Events 17
Table 5. Mean daily salinity and mean daily discharge for periods of large-volume discharge during 1998 and 2000.
[Sites are listed from north to south. Salinity is in parts per thousand, a--, data not available]Measurement type
Pe
01/07/98 — 4/21/9
NMaxi-mum
Mini-mum
North Fork
Salinity no. 1 105 1.0 0.3
Salinity no. 2 105 1.1 .3
S-49
Discharge1 70 1,596 19.9
S-48
Discharge1 105 1,959 7.1
S-80
Discharge 105 7,807 1,874
Speedy Point
Salinity no. 1 103 3.6 .2
Salinity no. 2 105 6.4 .2
Steele Point
Salinity no. 1 90 12 0.3
Salinity no. 2 105 23 .9
Indian River Lagoon
Salinity no. 1 105 30 17
Salinity no. 2 105 31 18
1Data provided by the South Florida Water Management Di
nd discharge is in cubic feet per second. N, number of measurements,
riod of large-volume discharge
8 4/12/00 — 5/21/00
Me-dian
NMaxi-mum
Mini-mum
Me-dian
.4 40 10.4 4.3 6.6
.4 40 11.9 4.5 7.8
431 40 0 0 0
163 -- -- -- --
4,519 40 2,566 105 1,751
.3 40 19.6 1.7 4.7
.3 40 19.9 2.7 6.8
0.3 40 28 7.8 14
9.9 40 29 14.0 20
23 40 32 24 26
25 40 32 26 27
strict.
Salinity no. 2 960 30.7 1.2 12.4 1,039 31.1 4.2 17.4 3,150 28.7 .1 10.8
Turbidity no. 1 NA 301 29.6 .1 7.3 3,357 58.0 1.8 19.4
Turbidity no. 2 NA 778 59.4 5.5 19.8 1,740 60.3 3.1 16.8
Indian River Lagoon
Discharge 960 46,121 -35,461 1,433 894 29,049 -41,123 -4,598 3,389 38,654 -40,621 -5,088
Salinity no. 1 NA 1,054 27.1 20.7 23.3 3,388 32.8 8.0 21.0
Salinity no. 2 958 33.6 19.2 25.2 1,053 33.4 18.9 25.1 3,386 33.6 14.4 22.9
1Data provided by the South Florida Water Management District.
Table 4. Comparison of instantaneous discharge, salinity, and turbidity or major storm events during 1998 and 1999. (Continued)[Sites are listed from north to south. Date ranges shown for hurricanes refer to periods these storms affected St. Lucie River Estuary hydrology. Discharge is in cubic feet per second, salinity is in parts per thousand, and turbidity is in nephelometric turbidity units. N, number of measurements; NA, not applicable or not available; blank, no measurements made]
Measurement type
Hurricane Mitch 11/4/98-11/13/98 Hurricane Floyd 9/15/99-9/25/99 Hurricane Irene 10/8/99-11/18/99
NMaxi-mum
Mini-mum
Me-dian
NMaxi-mum
Mini-mum
Me-dian
NMaxi-mum
Mini-mum
Me-dian
18 Hydrologic Data Summary for the St. Lucie River Estuary, Martin and St. Lucie Counties, Florida, 1998-2001
0
500
1,000
1,500
2,000
2,500
3,000
2000
ME
AN
DA
ILY
SA
LIN
ITY,
INP
AR
TS
PE
RT
HO
US
AN
D
ME
AN
DA
ILY
DIS
CH
AR
GE
,IN
CU
BIC
FE
ET
PE
RS
EC
ON
D
0
5
10
15
20
25
S-80 (discharge)
Speedy Point(salinity no. 1)
Speedy Point(salinity no. 2)
4/144/09 4/19 4/24 4/29 5/04 5/09 5/14 5/19 5/24 5/29
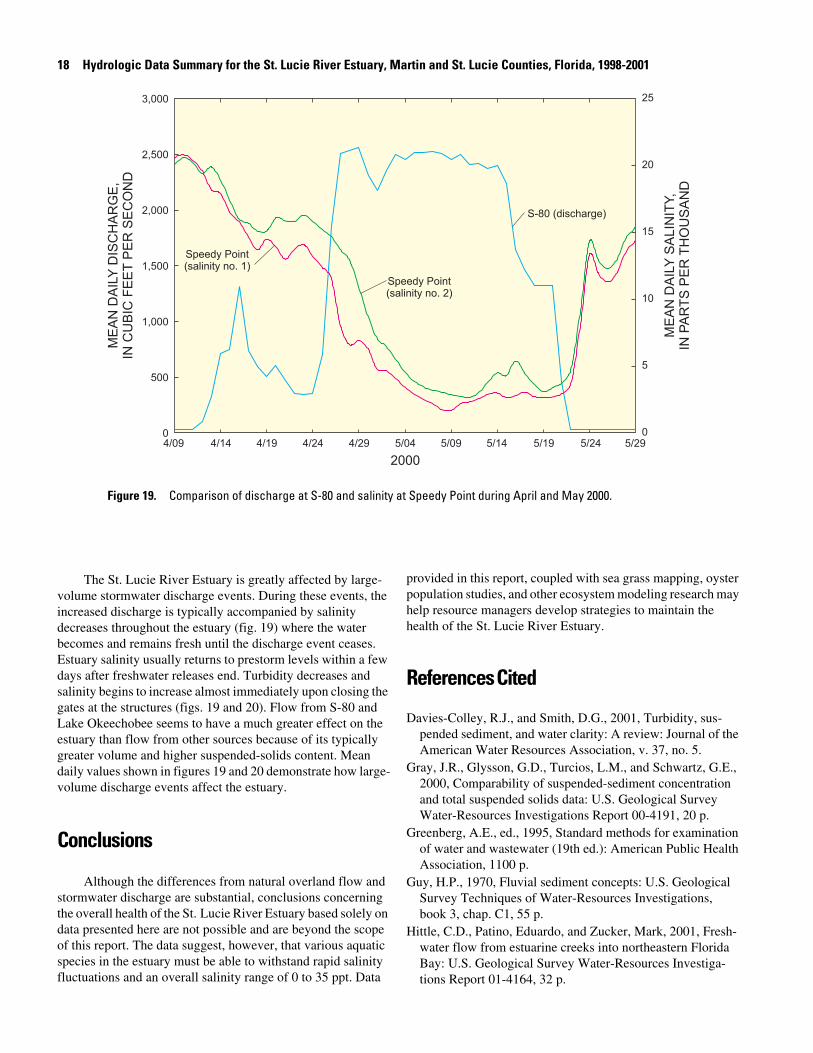
Figure 19. Comparison of discharge at S-80 and salinity at Speedy Point during April and May 2000.
The St. Lucie River Estuary is greatly affected by large-volume stormwater discharge events. During these events, the increased discharge is typically accompanied by salinity decreases throughout the estuary (fig. 19) where the water becomes and remains fresh until the discharge event ceases. Estuary salinity usually returns to prestorm levels within a few days after freshwater releases end. Turbidity decreases and salinity begins to increase almost immediately upon closing the gates at the structures (figs. 19 and 20). Flow from S-80 and Lake Okeechobee seems to have a much greater effect on the estuary than flow from other sources because of its typically greater volume and higher suspended-solids content. Mean daily values shown in figures 19 and 20 demonstrate how large-volume discharge events affect the estuary.
Conclusions
Although the differences from natural overland flow and stormwater discharge are substantial, conclusions concerning the overall health of the St. Lucie River Estuary based solely on data presented here are not possible and are beyond the scope of this report. The data suggest, however, that various aquatic species in the estuary must be able to withstand rapid salinity fluctuations and an overall salinity range of 0 to 35 ppt. Data
provided in this report, coupled with sea grass mapping, oyster population studies, and other ecosystem modeling research may help resource managers develop strategies to maintain the health of the St. Lucie River Estuary.
References Cited
Davies-Colley, R.J., and Smith, D.G., 2001, Turbidity, sus-pended sediment, and water clarity: A review: Journal of the American Water Resources Association, v. 37, no. 5.
Gray, J.R., Glysson, G.D., Turcios, L.M., and Schwartz, G.E., 2000, Comparability of suspended-sediment concentration and total suspended solids data: U.S. Geological Survey Water-Resources Investigations Report 00-4191, 20 p.
Greenberg, A.E., ed., 1995, Standard methods for examination of water and wastewater (19th ed.): American Public Health Association, 1100 p.
Guy, H.P., 1970, Fluvial sediment concepts: U.S. Geological Survey Techniques of Water-Resources Investigations, book 3, chap. C1, 55 p.
Hittle, C.D., Patino, Eduardo, and Zucker, Mark, 2001, Fresh-water flow from estuarine creeks into northeastern Florida Bay: U.S. Geological Survey Water-Resources Investiga-tions Report 01-4164, 32 p.

Appendix 19
0
500
1,000
1,500
2,000
2,500
3,000
2000
ME
AN
DA
ILY
TU
RB
IDIT
Y,
INN
EP
HE
LO
ME
TR
ICT
UR
BID
ITY
UN
ITS
ME
AN
DA
ILY
DIS
CH
AR
GE
,IN
CU
BIC
FE
ET
PE
RS
EC
ON
D
0
5
10
15
20
25
30
35
40
45
S-80 (discharge)
Speedy Point(turbidity no. 1)
Speedy Point(turbidiity no. 2)
4/14 4/19 4/24 4/29 5/04 5/09 5/14 5/19 5/24 5/29
Figure 20. Comparison of discharge at S-80 and turbidity at Speedy Point during April and May 2000. Break in line indicates missing data.
Patino, Eduardo, and Byrne M.J., 2004, Application of acoustic and optic methods for estimating total suspended solids con-centrations in the St. Lucie River Estuary, Florida: U.S. Geo-logical Survey Scientific Investigations Report 2004-5028, 23 p.
Regan, R., and Schaffranek, R.W., 1985, A computer program for analyzing channel geometry: U.S. Geological Survey Water-Resources Investigations Report 85-4335, 49 p.
Schweigart, J.A., Flierl, Christian, and Hyres, J.A., 1999, Hurricane Irene: After-action assessment: West Palm Beach, South Florida Water Management District Report, 62 p.
Simpson, M.R., and Bland, Roger, 2000, Methods for accurate estimation of net discharge in a tidal channel: IEEE Journal of Oceanic Engineering, v. 25, no. 4, p. 437-445.
Steward, Joel, Virnstein, Robert, Haunert, Dan, and Lund, Frank, 1993, Draft Surface Water Improvement and Man-agement (SWIM) Plan for the Indian River Lagoon: West Palm Beach, South Florida Water Management District Report, 120 p.
U.S. Interagency Committee on Water Resources, Subcommit-tee on Sedimentation, 1965, Instructions for sampling with depth-integrating sediment samples US D-49 and US DH-59: Report O, 175 p.
Wildlife Supply Company, 1999, Wildco 1999-2000 supply catalog.
Yellow Springs Incorporated, [undated], 6-series Environmen-tal Monitoring Systems Operations Manual: Yellow Springs, Ohio, 45387, 256 p.
Appendix (link accessible from web)
All data collected for this study are presented in the appen-dix as computed unit value data. All sites recorded 15-minute data for their respective periods of record. The data formats used are text, Microsoft Excel, and comma-separated value (csv) text files, which can be imported into most spreadsheet programs. A number follows the site name for sites with two salinity, temperature and turbidity probes. A “1” indicates the top probe (usually located 1 to 3 ft below low tide), and “2” indicates the bottom probe (usually located 5 ft below the top probe). The data are separated by individual sites and water year (October 1 to September 30). Discharge data are not published for the Speedy Point site because of the poor index-velocity rating obtained. Salinity and turbidity data are reported in parts per thousand (ppt) and nephelometric turbidity units (NTUs), respectively.