Embed Size (px)
Citation preview

U.S. Department of the InteriorU.S. Geological Survey
Development of Regional Curves ofBankfull-Channel Geometry and Dischargefor Streams in the Non-Urban,Piedmont Physiographic Province,Pennsylvania and Marylandby Peter J. Cinotto
Water-Resources Investigations Report 03-4014
In cooperation with the
PENNSYLVANIA DEPARTMENT OF ENVIRONMENTAL PROTECTION
New Cumberland, Pennsylvania2003

ii
U.S. DEPARTMENT OF THE INTERIOR
GALE A. NORTON, Secretary
U.S. GEOLOGICAL SURVEY
Charles G. Groat, Director
For additional information, write to: Copies of this report may bepurchased from:
District Chief U.S. Geological SurveyU.S. Geological Survey Branch of Information Services215 Limekiln Road Box 25286New Cumberland, Pennsylvania 17070-2424 Denver, Colorado 80225-0286Email: [email protected] Telephone: 1-888-ASK-USGSInternet Address: http://pa.water.usgs.gov

iii
Glossary . . . . . . . . . . . . . . . . . . . . . . . . . . . . . . . . . . . . . . . . . . . . . . . . . . . . . . . . . . . . . . . . . . . . . . . . . . . . . . . . . . . .vAbstract . . . . . . . . . . . . . . . . . . . . . . . . . . . . . . . . . . . . . . . . . . . . . . . . . . . . . . . . . . . . . . . . . . . . . . . . . . . . . . . . . . . . 1Introduction . . . . . . . . . . . . . . . . . . . . . . . . . . . . . . . . . . . . . . . . . . . . . . . . . . . . . . . . . . . . . . . . . . . . . . . . . . . . . . . . 1
Background . . . . . . . . . . . . . . . . . . . . . . . . . . . . . . . . . . . . . . . . . . . . . . . . . . . . . . . . . . . . . . . . . . . . . . . . . . . 2Purpose and scope . . . . . . . . . . . . . . . . . . . . . . . . . . . . . . . . . . . . . . . . . . . . . . . . . . . . . . . . . . . . . . . . . . . . . 2Description of the study area . . . . . . . . . . . . . . . . . . . . . . . . . . . . . . . . . . . . . . . . . . . . . . . . . . . . . . . . . . . . 2
Study design . . . . . . . . . . . . . . . . . . . . . . . . . . . . . . . . . . . . . . . . . . . . . . . . . . . . . . . . . . . . . . . . . . . . . . . . . . . . . . . . 4Regional-curve development . . . . . . . . . . . . . . . . . . . . . . . . . . . . . . . . . . . . . . . . . . . . . . . . . . . . . . . . . . . . . . . . . . 6
Characteristics of assessed stream reaches and streamflow-measurement stations . . . . . . . . . . . . . . 8Evaluation of regional curves . . . . . . . . . . . . . . . . . . . . . . . . . . . . . . . . . . . . . . . . . . . . . . . . . . . . . . . . . . . 22
Comparison of estimates from Piedmont Physiographic Province regional curves andDunne and Leopold regional curves . . . . . . . . . . . . . . . . . . . . . . . . . . . . . . . . . . . . . . . . . . . . . . . . . . . . . . . . 24
Limitations of the investigation . . . . . . . . . . . . . . . . . . . . . . . . . . . . . . . . . . . . . . . . . . . . . . . . . . . . . . . . . . . . . . . 25Summary and conclusions . . . . . . . . . . . . . . . . . . . . . . . . . . . . . . . . . . . . . . . . . . . . . . . . . . . . . . . . . . . . . . . . . . . 26References cited . . . . . . . . . . . . . . . . . . . . . . . . . . . . . . . . . . . . . . . . . . . . . . . . . . . . . . . . . . . . . . . . . . . . . . . . . . . . 27
ILLUSTRATIONS
Figure 1. Map showing locations of the Piedmont Physiographic Province, Sections, andU.S. Geological Survey streamflow-measurement stations selected forregional-curve development, Pennsylvania and Maryland . . . . . . . . . . . . . . . . . . . . . . 3
2-15. Photographs showing:
2. View looking upstream at reach for Manatawny Creek near Pottstown,Pennsylvania . . . . . . . . . . . . . . . . . . . . . . . . . . . . . . . . . . . . . . . . . . . . . . . . . . . . . . . . . . . 9
3. View looking downstream at reach for French Creek near Phoenixville,Pennsylvania . . . . . . . . . . . . . . . . . . . . . . . . . . . . . . . . . . . . . . . . . . . . . . . . . . . . . . . . . . . 9
4. View looking downstream at reach for Perkiomen Creek at East Greenville,Pennsylvania . . . . . . . . . . . . . . . . . . . . . . . . . . . . . . . . . . . . . . . . . . . . . . . . . . . . . . . . . . 11
5. View looking upstream at reach for West Branch Perkiomen Creek atHillegas, Pennsylvania . . . . . . . . . . . . . . . . . . . . . . . . . . . . . . . . . . . . . . . . . . . . . . . . . . 11
6. View looking downstream at reach for Crum Creek near Newtown, Pennsylvania. . 13
7. View looking downstream at reach for Chester Creek near Chester, Pennsylvania . . 13
8. View looking upstream at reach for West Branch Brandywine Creeknear Honey Brook, Pennsylvania . . . . . . . . . . . . . . . . . . . . . . . . . . . . . . . . . . . . . . . . . 15
9. View looking downstream at reach for West Branch BrandywineCreek at Coatesville, Pennsylvania . . . . . . . . . . . . . . . . . . . . . . . . . . . . . . . . . . . . . . . . 15
10. View looking downstream at reach for Sucker Run near Coatesville,Pennsylvania . . . . . . . . . . . . . . . . . . . . . . . . . . . . . . . . . . . . . . . . . . . . . . . . . . . . . . . . . . 17
11. View looking upstream at reach for West Branch Brandywine Creekat Modena, Pennsylvania . . . . . . . . . . . . . . . . . . . . . . . . . . . . . . . . . . . . . . . . . . . . . . . . 17
12. View looking upstream at reach for Conowingo Creek near Buck, Pennsylvania. . . . 19
13. View looking upstream at reach for Beaver Run near Finksburg, Maryland. . . . . . . . 19
CONTENTSPage

iv
Figure 2-15. Photographs showing—Continued:
14. View looking downstream at reach for Morgan Run near Louisville, Maryland . . . . 21
15. View looking upstream at reach for Big Pipe Creek at Bruceville, Maryland . . . . . . . 21
16-19. Graphs showing:
16. Regional curve representing relation between bankfull cross-sectional area anddrainage area in non-urban, Piedmont Physiographic Province, Pennsylvaniaand Maryland. . . . . . . . . . . . . . . . . . . . . . . . . . . . . . . . . . . . . . . . . . . . . . . . . . . . . . . . . . 22
17. Regional curve representing relation between bankfull discharge and drainagearea in non-urban, Piedmont Physiographic Province, Pennsylvania andMaryland. . . . . . . . . . . . . . . . . . . . . . . . . . . . . . . . . . . . . . . . . . . . . . . . . . . . . . . . . . . . . . 23
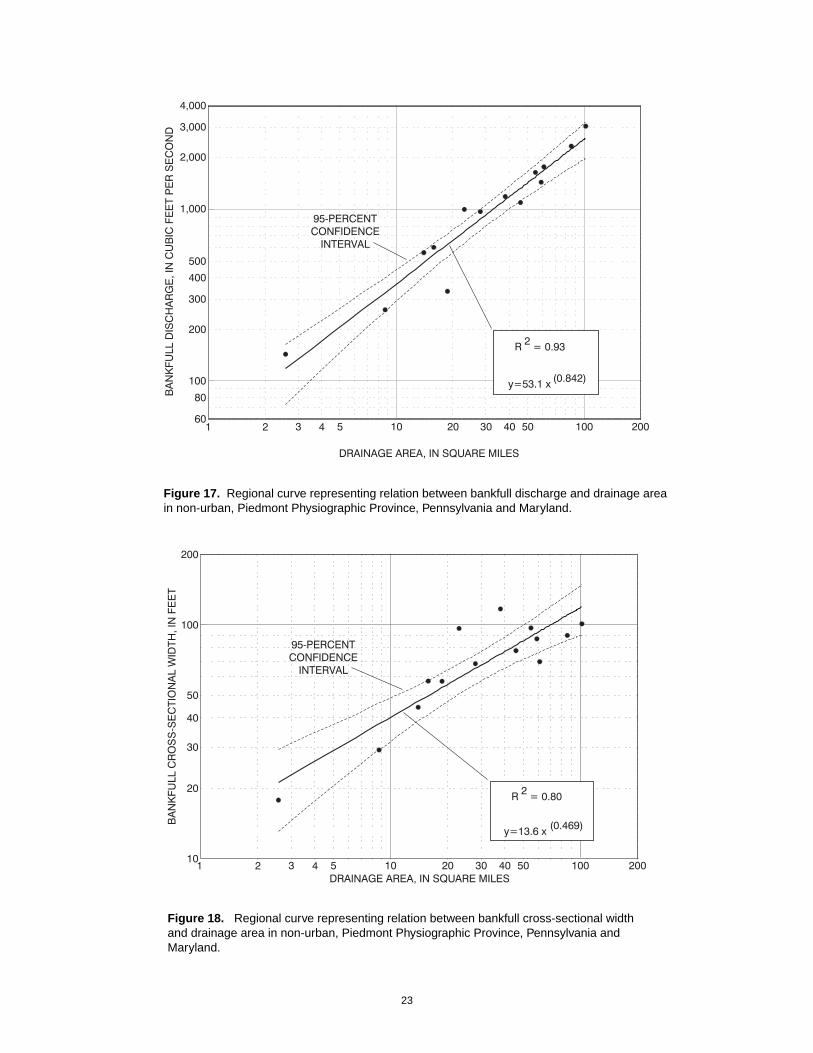
18. Regional curve representing relation between bankfull cross-sectional widthand drainage area in non-urban, Piedmont Physiographic Province,Pennsylvania and Maryland . . . . . . . . . . . . . . . . . . . . . . . . . . . . . . . . . . . . . . . . . . . . . 23
19. Regional curve representing relation between bankfull cross-sectional meandepth and drainage area in non-urban, Piedmont Physiographic Province,Pennsylvania and Maryland . . . . . . . . . . . . . . . . . . . . . . . . . . . . . . . . . . . . . . . . . . . . . 24
TABLES
Table 1. Streamflow-measurement stations used for regional-curve development in thePiedmont Physiographic Province, Pennsylvania and Maryland . . . . . . . . . . . . . . . . . 5
2. Data collected during assessment of the stream reaches at the streamflow-measurementstations used for regional-curve development in the Piedmont PhysiographicProvince, Pennsylvania and Maryland . . . . . . . . . . . . . . . . . . . . . . . . . . . . . . . . . . . . . . . 7
3. Comparison of estimates from Piedmont Physiographic Province Regional Curves,Piedmont Lowlands Regional Curves, and Dunne and LeopoldRegional Curves . . . . . . . . . . . . . . . . . . . . . . . . . . . . . . . . . . . . . . . . . . . . . . . . . . . . . . . . . 25
CONVERSION FACTORS AND DATUMS
Multiply By To obtain
Length
foot (ft) 0.3048 meter
mile (mi) 1.609 kilometer
Area
square foot (ft2) 0.09290 square meter
square mile (mi2) 2.590 square kilometer
Flow
cubic foot per second (ft3/s) 0.02832 cubic meter per second
Vertical coordinate information is referenced to the National Geodetic Vertical Datum of 1929 (NGVD 29);horizontal coordinate information is referenced to the North American Datum of 1927 (NAD 27).
ILLUSTRATIONS—ContinuedPage

v
The terms in this glossary were compiled from numerous sources. Some definitions have been modifiedfor use within this report.
Bankfull channel—The active stream channel during the bankfull discharge.
Bankfull cross-sectional area—The cross-sectional area of the bankfull channel measured perpendicularto the streamflow.
Bankfull discharge—The most effective streamflow for moving sediment, forming or removing bars,forming or changing bends and meanders, and generally doing work that results in the averagemorphological characteristics of channels (Dunne and Leopold, 1978).
Bankfull mean depth—The mean depth of the bankfull channel measured perpendicular to thestreamflow.
Bankfull stage—The elevation of the water surface during bankfull discharge.
Bankfull width—The width of the bankfull channel measured perpendicular to the streamflow.
Drainage area—That area, measured in a horizontal plane, enclosed by a topographic divide from whichdirect surface runoff from precipitation normally drains by gravity into the stream above the specifiedpoint.
Gage height—Water-surface elevation referred to some arbitrary station datum. Gage height commonly isused interchangeably with the more general term “stage.”
Physiographic province—A region of which all parts are similar in geologic structure and climate andwhich has consequently had a unified geomorphic history; a region whose pattern of relief features orlandforms differs significantly from that of adjacent regions.
Regional curve—A regression of the relations among drainage area, selected cross-sectional parameters,and streamflow.
Regulation—A condition where streamflow is controlled by an upstream human-made feature.
Stream reach—A section of stream extending between 10 and 20 bankfull widths in length.
Stream restoration—For this report, adjusting stream dimensions, pattern, and profile to a conditionwhere it effectively accommodates a range of streamflow and sediment and supports diverse habitat.
Watershed—For this report, used interchangeably with drainage area.
GLOSSARY

vi

1
ABSTRACT
Stream-restoration projects utilizing natural-stream designs frequently are based on the bank-full-channel characteristics of stream reaches thatcan accommodate streamflow and sediment trans-port without excessive erosion or deposition andlie within a watershed that has similar runoff char-acteristics. The bankfull channel at an ungagedimpaired site or reference reach is identified by useof field indicators and is confirmed with tools suchas regional curves. Channel dimensions were sur-veyed at 14 streamflow-measurement stationsoperated by the U.S. Geological Survey (USGS) inthe Gettysburg-Newark Lowland Section, Pied-mont Lowland Section, and the Piedmont UplandSection of the Piedmont Physiographic Province1
in Pennsylvania and Maryland. From the surveyedchannel dimensions, regional curves were devel-oped from regression analyses of the relationsbetween drainage area and the cross-sectional area,mean depth, width, and streamflow of the bankfullchannel at these sites.
Bankfull cross-sectional area and bankfulldischarge have the strongest relation to drainagearea as evidenced by R2 values of 0.94 and 0.93,respectively. The relation between bankfull cross-sectional area and drainage area has a p-value ofless than 0.001; no p-value is presented for the rela-tion between bankfull discharge and drainage areabecause of a non-normal residual distribution. Therelation between bankfull width and drainage areahas an R2 value of 0.80 and a p-value of less than0.001 indicating a moderate linear relation betweenall stations. The relation between bankfull meandepth and drainage area, with an R2 value of 0.72and a p-value of less than 0.001, also indicates amoderate linear relation between all stations.
The concept of regional curves can be a valu-able tool to support efforts in stream restoration.Practitioners of stream restoration need to recog-nize it as such and realize the limitations. Thesmall number of USGS streamflow-measurement
stations available for analysis is a major limitingfactor in the strength of the results of this investi-gation, as is the inherent problem of directly asso-ciating streamflow-measurement station data togeomorphic analysis of a stream reach. Subjectiveselection criteria may have unnecessarily elimi-nated streamflow-measurement stations that couldhave been included in the regional curves and (or)added those that may belong within a differentregion. A bankfull discharge with a recurrenceinterval within the 1- to 2-year range commonly isused as a criterion for the confirmation of the bank-full stage at each streamflow-measurement station.Many researchers accept this range for recurrenceinterval of the bankfull discharge; however, litera-ture provides contradictory evidence.
INTRODUCTION
Restoration of stream channels with exces-sive erosion, deposition, or degraded habitat isproposed and is implemented by federal, state,local, and private organizations in an effort toreturn the impaired streams to more stable andbiologically productive conditions. Traditionalengineering practices for stream stabilization fre-quently rely on hardening the stream channel insections that are affected by erosive forces. Recentstream-restoration projects propose to utilize anatural-stream design approach that emphasizesworking in concert with natural-stream processesas opposed to combating them. For the purposes ofthis study, natural-stream design is defined as adesign intended to restore an impaired streamreach to a state such that the stream can transportthe current sediment load and runoff provided to itfrom upstream without excessive aggradation ordegradation while maintaining habitat and aes-thetics consistent with that found in an unimpairedreach within an area of similar physiography.
The bankfull discharge is considered to bethe most effective flow for moving sediment, form-ing or removing bars, forming or changing bendsand meanders, and generally doing work thatresults in the average morphological characteris-tics of channels (Dunne and Leopold, 1978). Thebankfull discharge is, therefore, the channel-form-
1 Words that are in bold are found in the Glossarysection of this report.
DEVELOPMENT OF REGIONAL CURVES OF BANKFULL -CHANNEL GEOMETRY ANDDISCHARGE FOR STREAMS IN THE NON-URBAN, PIEDMONT PHYSIOGRAPHIC PROVINCE,
PENNSYLVANIA AND MARYLAND
by Peter J. Cinotto

2
ing discharge and is responsible for the formationof the bankfull channel. As the basis of the resto-ration design, the bankfull channel is defined andverified by field reconnaissance and direct mea-surement of channel features. In addition to identi-fying the bankfull channel on the basis of fieldindicators, an independent source of information isrequired to support the findings, such as dataobtained from a U.S. Geological Survey (USGS)streamflow-measurement station. According toLeopold (1994), the bankfull discharge has an aver-age recurrence interval of 1.5 years. The recurrenceinterval for bankfull discharge for this studyranged from the 1-year to 1.5-year event, with anaverage of 1.3 years.
Some of the more common tools availablefor supporting the selection of the bankfull channelare regional curves. Several studies haveattempted to create regional curves for variousparts of the United States; one set of regionalcurves, developed by Dunne and Leopold (1978),is intended to be representative of the bankfull-channel dimensions throughout the eastern UnitedStates. The applicability of one set of regionalcurves to multiple physiographic provinces and(or) other bounding conditions has not been veri-fied.
Characteristics of the bankfull channel arequantified using parameters such as bankfullcross-sectional area, bankfull width, bankfullmean depth, and streamflow. These characteristicsare correlated strongly with drainage area (Dunneand Leopold, 1978). Regional curves are developedby regression analysis of the bankfull characteris-tics and drainage area, and provide estimatedbankfull channel dimensions and streamflowwhen drainage area is known. Estimates of bank-full dimensions are helpful for confirming fieldidentification of the bankfull channel.
Backgr ound
In 1999, the Pennsylvania Department ofEnvironmental Protection (PaDEP) proposed astudy to develop regional curves representative ofchannel geometry in the Piedmont Lowland andGettysburg-Newark Lowland Sections of the Pied-mont Physiographic Province and to quantifychannel characteristics of a stream reach for use asa template in a stream-restoration design. The ini-tial field work was completed in 2000 and thereport “Regional Curve Development and Selec-tion of a Reference Reach in the Non-Urban, Low-land Sections of the Piedmont Physiographic
Province, Pennsylvania and Maryland” by K.E.White (2001) was published. This report buildsupon the previous work by White (2001) by addingdata from eight additional streamflow-measure-ment stations, predominantly within the PiedmontUpland Section, and completing a regional curvefor the entire Piedmont Physiographic Provincethat is thought to provide a better representation ofthe province as a whole. PaDEP and the USGS con-ducted this study as a cooperative effort.
Purpose and Scope
This report describes the methods used, datacollected, and the application of regional curvesdeveloped for the Piedmont Physiographic Prov-ince. Regional curves developed from channel-characteristic data collected from December 1999to April 2002 that represent channel dimensions inthe Piedmont Physiographic Province withinPennsylvania and Maryland are presented. Thisreport is intended to present regional curves thateither confirm the findings of, or more accuratelyrepresent, the Piedmont Physiographic Provincethan existing curves by White (2001) and (or)Dunne and Leopold (1978).
Description of the Stud y Area
The Piedmont Physiographic Province(fig. 1) is separated into three sections on the basisof changes in physiography within the province:the Piedmont Upland Section, the Piedmont Low-land Section, and the Gettysburg-Newark LowlandSection. Locations of USGS streamflow-measure-ment stations used in this study are shown infigure 1.
The Piedmont Lowland Section study area inPennsylvania consists of broad, moderately dis-sected valleys separated by broad low hills. Thesection is developed primarily on limestone anddolomite rock. Karst topography is common. Localrelief in the section generally is less than 100 ft butmay be as high as 300 ft. Land-surface altitudes inthe section range from 170 to 630 ft. Drainage isbasically dendritic in pattern, but some areaswithin the section have virtually no patternbecause of the well-developed subsurface drainage(Sevon, 2000).
The Gettysburg-Newark Lowland Sectionstudy area in Pennsylvania and Maryland consistsmainly of rolling hills and valleys developed onsedimentary rocks. There are also isolated higherhills developed on diabase, baked sedimentary

3
Figure 1. Locations of the Piedmont Physiographic Province, Sections, and U.S. Geological Surveystreamflow-measurement stations selected for regional-curve development, Pennsylvania and Maryland.

4
rock, and conglomerates. Almost all the underly-ing sedimentary rock dips to the north or north-west, and many smaller drainage ways are orien-ted normal to the direction of dip so that some ofthe topography has a northeast-southwest linear-ity. The basic drainage pattern is dendritic. Relief isgenerally 100 to 200 ft but locally is up to 600 ft onsome of the isolated hills. Altitude in the sectionranges from 40 to 1,335 ft (Sevon, 2000).
The Piedmont Upland Section study area inPennsylvania and Maryland consists mainly ofbroad, rounded to flat-topped hills and shallowvalleys developed on schist, gneiss, and quartzitewith some saprolite. The local relief is low to mod-erate with the lowest altitude approximately 100 ftand the highest point approximately 1,220 ft. Therocks in this section are intensely folded andfaulted and the resulting drainage pattern is pri-marily dendritic (Sevon, 2000).
STUDY DESIGN
This study builds on the previous work byWhite (2001). Data from eight new USGS stream-flow-measurement stations were added to com-plete regional curves for the entire PiedmontPhysiographic Province. Data from USGS stream-flow-measurement stations within the PiedmontPhysiographic Province (Sevon, 2000) were used todevelop the regional curves for this study. Datafrom stations outside of the Piedmont Physio-graphic Province were omitted from the study;however, three streamflow-measurement stationsused in this study had some part of the watersheddraining to them outside of the Piedmont Physio-graphic Province. Subjective filtering criteria utiliz-ing Geographic Information System (GIS) land-use(U.S. Geological Survey, 1996) and stream cover-ages (Pennsylvania Department of Transportation,1997; Alexander and others, 1999), and additionalstation-information criteria, were used to identifystreamflow-measurement stations with potentiallysimilar runoff characteristics in Pennsylvania. Therange of gaged-watershed size used in the regionalcurves is required to be large enough to provideconfidence in the relation over a range of drainageareas; this range is limited, however, by the exist-ing number of streamflow-measurement stations.The filtering criteria used for selecting streamflow-measurement stations in Pennsylvania used in theanalyses in this study are listed below:
• The station is within the boundaries of thePiedmont Physiographic Province; however,a significant percentage of the watersheddraining to the station may be outside of thePiedmont Physiographic Province.
• The station has at least 10 years of record.
• If the station has been discontinued, the sta-tion must have been operational until at least1985 to minimize the extent to which anychanges in land use may have affected thechannel since the station was active.
• No more than 25 percent of the upstreamwatershed is classified as “urban” land use.
• Streamflow at the station is subjected to nogreater than approximately 20 percentregulation. No greater than approximately20 percent of the flowpath in the upstreamwatershed is subject to regulation.
• The stream must be wadeable.
The filtering criteria above were applied to acomprehensive listing of active and discontinuedcontinuous- and partial-record streamflow-mea-surement stations operated by the USGS in Penn-sylvania. Stations meeting all criteria wereconsidered for inclusion in the analysis. Streamsincluded in this analysis may be subject to anthro-pogenic influences, such as the sporadic placementof rip rap; however, they must not be channelized,such as concrete-lined or trapezoidal channels.This analysis also did not exclude streams withbedrock outcrops appearing in, or near, the chan-nel. Station descriptions, describing flow condi-tions and site characteristics, from records in USGSoffices and, in some instances, field reconnaissancewere used to finalize the list of stations included inthe formulation of the regional curves. Streamflow-measurement stations within Maryland were notsubjected to the same filtering criteria applied tostations within Pennsylvania because of limitedGIS data. The stations in Maryland were, therefore,selected only on the basis of location, land use, anddrainage area as per written and oral communica-tions from USGS personnel in the Maryland Dis-trict Office. On the basis of the listed criteria,14 streamflow-measurement stations were selectedfor inclusion in the regional-curves development(table 1). Ancillary descriptors such as land use,percentage of regulation, percentage of the basinunderlain by carbonate rocks, and others also arepresented in table 1 to assist in the interpretation ofthe regional curves. For example, the presence of

5
Table 1. Streamflow-measurement stations used for regional-curve development in the Piedmont Physiographic Province, Pennsylvania and Maryland
[<, less than]
U.S.Geological
Surveystation
identificationnumber
(see fig. 1)
Station nameLatitude/longitude
Drainagearea
(squaremiles)
Land use(percentage
of basin)
Percentage of flowpath in thePiedmont Physiographic
Province1,2Percentage of
flowpath outsidethe PiedmontPhysiographic
Province
Percentageof flowpathsubject toregulationin basin
Percentageof basin
underlainby
carbonaterocks
Urban ForestGettysburg
NewarkLowland
PiedmontLowland
PiedmontUpland
301471980 Manatawny Creek near Pottstown, Pa. Lat 40°16′22″Long 75°40′49″
85.5 <2 56 15 — — 85 — 26
301472157 French Creek near Phoenixville, Pa. Lat 40°09′05″Long 75°36′06″
59.1 <1 64 38 — 62 — 2 —
301472198 Perkiomen Creek at East Greenville, Pa. Lat 40°23′38″Long 75°30′57″
38.0 2 54 51 — — 49 — 3
301472199 West Branch Perkiomen Creek atHillegas, Pa.
Lat 40°22′26″Long 75°31′22″
23.0 2 61 43 — — 57 — 4
01475850 Crum Creek near Newtown Square, Pa. Lat 39°58′35″Long 75°26′13″
15.8 16 61 — — 100 — — —
01477000 Chester Creek near Chester, Pa. Lat 39°52′10″Long 75°24′30″
61.1 23 50 — — 100 — 1 —
01480300 West Branch Brandywine Creek nearHoney Brook, Pa.
Lat 40°04′22″Long 75°51′40″
18.7 1.5 27 — — 100 — — 3.4
01480500 West Branch Brandywine Creek atCoatesville, Pa.
Lat 39°59′08″Long 75°49′40″
45.8 2.1 42 — — 100 — <1 1.3
301480610 Sucker Run near Coatesville, Pa. Lat 39°58′20″Long 75°51′03″
2.57 11.6 45 — 53 47 — — 35.7
01480617 West Branch Brandywine Creek atModena, Pa.
Lat 39°57′42″Long 75°48′06″
55.0 6 42 — 7 93 — <1 6
01578200 Conowingo Creek near Buck, Pa. Lat 39°50′35″Long 76°11′45″
8.7 .9 20 — — 100 — — —
01586210 Beaver Run near Finksburg, Md.4 Lat 39°29′22″Long 76°54′12″
14.0 — 28 — — 100 — <1 —
01586610 Morgan Run near Louisville, Md.4 Lat 39°27′07″Long 76°57′20″
28.0 — 29 — — 100 — <1 —
301639500 Big Pipe Creek at Bruceville, Md.4 Lat 39°36′45″Long 77°14′10″
102 — 17 32 — 68 — — —
1 Pennsylvania Department of Transportation, 1997; Sevon, 2000.2 Percentage is based on flowpath and not total basin area.3 Field assessment data previously published in White, 2001.4 Data provided by R.W. James, Jr., U.S. Geological Survey, oral commun., 2001.

6
carbonate rocks within the watershed leads to thepossibility of significant, undetected, undergroundflow that may alter surficial runoff patterns andaffect the regional curves.
Procedures for measurements of hydraulicgeometry and stream-type assessment, outlined byLeopold (1994) and Rosgen (1996), were followedfor the data collection at each station. Deviationsfrom the established procedure, warranted becauseof site conditions, are discussed along with the spe-cific details describing the characteristics of eachstream reach. Surveyed altitudes are recorded tothe hundredth of a foot as per the accuracy of theequipment and survey techniques; however,stream slope data are presented to the thousandthof a foot to provide the user with relative differ-ences between stream slopes and sufficient data forrounding purposes.
REGIONAL-CURVE DEVELOPMENT
Many restoration designs have been devel-oped on the basis of bankfull-channel dimensionsbecause the bankfull channel has the correct pat-tern, profile, and dimension to accommodate thestreamflow and sediment load provided fromupstream without excessive erosion or deposition.According to Dunne and Leopold (1978), the bank-full-channel dimensions of width, mean depth,and cross-sectional area are highly correlated withthe size of the basin (drainage area) in a givenregion. A regional curve is a regression of the rela-tion of bankfull-channel dimensions and bankfulldischarge to drainage area and provides estimatedbankfull-channel dimensions and streamflow forthe bankfull channel when drainage area is known.Regional curves are, therefore, useful for verifyingthe correct bankfull stage in the field, and subse-quently, for confirming the correct bankfull-chan-nel dimensions and streamflow within regionshaving similar runoff characteristics.
USGS streamflow-measurement stationsprovide a source of readily available and reliableinformation from which regional curves can bedeveloped. The drainage area has been determinedaccurately for each station, and discharge measure-ments at each station provide a long-term record ofchannel dimensions over a broad range of flows.Analysis of station records provides the frequen-cies of occurrence for a range of streamflows. Byidentifying the bankfull stage at a streamflow-mea-surement station, the investigator can determinethe recurrence interval of the associated flow. Use
of the USGS streamflow-measurement data doesnot necessarily provide absolute confirmation ofthe bankfull channel but does support the identifi-cation of the bankfull channel when used alongwith other field indicators. Caution should beobserved when using data from a USGS stream-flow-measurement station for geomorphic analysisbecause the measurement section is selected byUSGS personnel to provide accurate velocity andarea determinations for the computation of stream-flow only. These measuring sections may be inslow-velocity, pool-dominated sections and not inriffles as required by most computations involvedin fluvial geomorphology. Therefore, the user ofthese data should review the station descriptionscarefully before use and be sure of whether themeasurement section used by USGS personnel is ariffle, run, pool, or glide.
Field indicators used in development of theregional curves include longitudinal-profile surveydata, cross-section survey data collected in one ormore riffle sections, and particle distribution datafor each cross section. From these data, the cross-sectional dimensions were determined, the streamreach was classified according to the Rosgen classi-fication system (Rosgen, 1996), and bankfull dis-charge was calculated and, if possible, alsorecorded directly from the USGS streamflow-measurement station. Regression of the bankfull-channel dimensions and streamflow for eachstreamflow-measurement station in relation to itsdrainage area provided the data necessary fordefining the regional-curve relation.
Field data collected during the site assess-ments are included in table 2. Rosgen stream typeand Rosgen valley type refer to a stream and valleyclassification system based on the morphologicalcharacteristics (Rosgen, 1996). When two differentstream types are listed for the same streamflow-measurement station (table 2), the stream typechanged over the length of the study reach.A change in stream type could possibly lead toincreased variance within the associated regionalcurves. Particle-distribution data, as presented intable 2, are required for classification purposes. Incertain cases, dams, or other anthropogenic influ-ences, prevented the stream slope from being com-puted for the entire study reach; in these cases,stream slope was computed from a smaller, repre-sentative reach of unaffected channel. Characteris-tics of the 14 stream reaches and the data collectedare discussed in the following sections.

7
Table 2. Data collected during assessment of the stream reaches at the streamflow-measurement stations used forregional-curve development in the Piedmont Physiographic Province, Pennsylvania and Maryland
[WY, water year; mi2, square miles; ft, feet; ft2, square feet; ft3/s, cubic feet per second; ft/ft, feet per foot; mm,millimeter; D50, particle size larger than 50 percent of the cumulative sample; D84, particle size larger than 84 percentof the cumulative sample]
U.S.Geological
Surveystation
identificationnumber
(see fig. 1)
Per
iod
of r
ecor
d us
ed fo
r an
alys
is(W
Y)
Ros
gen
stre
am ty
pe1
Ros
gen
valle
y ty
pe1
Ban
kful
l cro
ss-s
ectio
nal a
rea
(ft2 )
Ban
kful
l wid
th(f
t)
Ban
kful
l mea
n de
pth
(ft)
Est
imat
ed b
ankf
ull s
tage
(ft)
Est
imat
ed b
ankf
ull d
isch
arge
(ft3 /
s)
Rec
urre
nce
inte
rval
(ye
ars)
Str
eam
slo
pe(f
t/ft) Average
D50(mm)
AverageD84(mm)
201471980 1974–2000 C4 VIII 468 90.1 5.19 6.26 2,340 1.3 0.001 27.7 103201472157 1969–2000 C3 VIII 316 87.1 3.63 7.78 1,440 1.3 .004 89.4 311201472198 1982–2000 C4 VIII 304 117 2.65 3.83 1,190 1.4 .002 3.80 42.4201472199 1982–2000 C4 VIII 202 96.5 1.94 4.79 1,000 1.5 .004 .80 70.4
01475850 1970-2001 3C4/C5 VIII 161 57.5 2.79 5.62 601 1.2 .002 3.20 38.9
01477000 1931-2001 B4c VI 303 69.6 4.35 7.02 1,772 1.2 .002 48.1 153
01480300 1960-2001 C4 VIII 128 57.4 2.24 4.91 333 1.0 .001 7.33 35.2
01480500 1969-2001 F4/B4c VI 179 77.6 2.33 5.60 1,097 1.3 .009 42.2 140201480610 1964–2000 B5c VI 24.0 17.8 1.36 4.83 143 1.2 .009 .25 55.7
01480617 1969-2001 C4 VIII 268 97 2.77 6.40 1,643 1.3 .004 24.3 82.4
01578200 1962-2002 E4/C4 VIII 63.7 29.2 2.22 5.44 260 1.3 .004 43.6 146
01586210 1982-2001 B4c VI 106 44.4 2.38 3.60 559 1.4 .006 25.3 114
01586610 1982-2001 C4/B4c VI 189 68.2 2.77 4.71 970 1.4 .004 27.0 78.9201639500 1948–2000 C4 VIII 616 101 6.12 7.93 3,060 1.5 .001 22.4 95.8
1 Rosgen, 1996.2 Field assessment data previously published in White, 2001.3 If two stream types are listed, the first is for the upstream-most cross section.

8
Characteristics of Assessed Stream Reac hesand Streamflo w-Measurement Stations
Manatawny Creek near Pottstown -01471980.—The continuous streamflow-measure-ment station is about 180 ft upstream from abridge. The bridge does not appear to constrict orredirect the bankfull discharge. Discharge mea-surements at this station usually are made whilewading in the approximate location of the cross-section survey. High-water measurements aremade from the bridge.
The bankfull channel was defined clearlythroughout most of the reach by field indicatorssuch as riparian vegetation, abrupt change in bankangle, and change in depositional material. Fourriffles were present within the study reach; how-ever, the cross-section survey was limited to onecross section in a “run” (an area of intermediaterelative velocity) because of the presence of adivided channel throughout the upstream half ofthe reach. A view of the study reach is shown infigure 2. The elevation of the bankfull stage wassurveyed to the outside vertical staff gage fromwhich the gage height and associated bankfull dis-charge were determined. The measured geometryof the channel within the estimated range of bank-full discharge, as taken from streamflow-measure-ment data in the USGS database, was used to assistwith confirmation of bankfull selection (White,2001).
French Creek near Phoenixville -01472157.—The continuous streamflow-measure-ment station is about 70 ft downstream from abridge. The bridge may have a slight effect on thebankfull discharge due to constriction of higherflows and the subsequent hydraulic jump uponexiting the bridge structure. Discharge measure-ments usually are made while wading in the vicin-ity of the station. High-water measurements aremade from the bridge.
The bankfull channel, in the vicinity of thestreamflow-measurement station, was definedpoorly because of excessive bank erosion. Directlyacross from the streamflow-measurement shelter isan auxiliary channel, separated from the mainchannel by a berm that extends 500 ft downstream.This auxiliary channel is a component of the bank-full channel and contains flowing water duringmoderate and high streamflow events. Riffleswithin this area were not surveyed because of theresulting divided channel at the bankfull dis-charge. Excellent bankfull indicators were identi-fied on a point bar beginning about 700 ft down-stream from the station. Two cross sections weresurveyed at riffles within this downstream reach.A view of the study reach is shown in figure 3. Thebankfull widths, mean depths, and cross-sectionalareas of the two cross sections were averaged todetermine the input for the regional curves. Thebankfull elevation was extended upstream to thestreamflow-measurement station to determine thegage height and streamflow associated with thebankfull stage. The measured geometry of thechannel within the estimated range of bankfull dis-charge, as taken from streamflow-measurementdata in the USGS database, was used to assist withconfirmation of bankfull selection (White, 2001).

9
Figure 2. View looking upstream at reach for Manatawny Creek nearPottstown, Pennsylvania (From White, 2001).
Figure 3. View looking downstream at reach for French Creek nearPhoenixville, Pennsylvania (From White, 2001).

10
Perkiomen Creek at East Greenville -01472198.—The continuous streamflow-measure-ment station is adjacent to a pool created by a weirimmediately downstream from the shelter.A multi-span bridge is 100 ft downstream from theweir and does not appear to constrict the bankfulldischarge. Discharge measurements usually aremade while wading downstream from the weirand the bridge. High-water measurements aremade from the bridge.
The bankfull channel throughout the entirestudy reach was defined fairly well by an abruptchange in bank angle and intermittent depositionalfeatures. Two cross sections were surveyed atriffles within the reach. A section of the streamreach was stabilized previously; however, the sur-veyed cross sections were beyond the affectedstream section. A view of the study reach is shownin figure 4. The bankfull widths, mean depths, andcross-sectional areas of the two cross sections wereaveraged to determine the input for the develop-ment of the regional curves. The bankfull water-surface elevation could not be extended upstreamto the streamflow-measurement station because ofthe relatively high-profile weir. The measuredgeometry of the channel within the estimatedrange of bankfull discharge, as taken from stream-flow-measurement data in the USGS database, wasused to assist with confirmation of bankfull selec-tion (White, 2001).
West Branch Perkiomen Creek at Hillegas -01472199.—The continuous streamflow-measure-ment station is adjacent to a pool created by a weirimmediately downstream from the shelter. The rat-ing is considered to be poorly defined above560 ft3/s because of the lack of a good locationfrom which to make high-water measurements.Discharge measurements are conducted through-out the stream reach while wading both upstreamand downstream from the weir.
The assessed reach was separated from thestreamflow-measurement station by a high-profilerock outcrop approximately 300 ft upstream. Thebankfull channel was defined clearly throughoutmost of the assessed reach by riparian vegetation,abrupt changes in bank angle, and depositionalfeatures. Two cross sections were surveyed at rif-fles within the assessed reach. A view of the studyreach is shown in figure 5. The bankfull widths,mean depths, and cross-sectional areas of the twocross sections were averaged to determine theinput for the development of the regional curves.Despite the presence of the rock outcrop, the bank-full elevation could be extended to the outside ver-tical staff gage adjacent to the streamflow-measurement station to determine the gage heightand streamflow associated with the bankfull stage.The measured geometry of the channel within theestimated range of bankfull discharge, as takenfrom streamflow-measurement data in the USGSdatabase, was used to assist with confirmation ofbankfull selection (White, 2001).

11
Figure 4. View looking downstream at reach for Perkiomen Creek at EastGreenville, Pennsylvania (From White, 2001).
Figure 5. View looking upstream at reach for West Branch Perkiomen Creekat Hillegas, Pennsylvania (From White, 2001).

12
Crum Creek near Newtown Square -01475850.—The continuous streamflow-measure-ment station is approximately 120 ft upstreamfrom a bridge that may have a slight effect on thebankfull discharge due to constriction of higherflows and the associated backwater effect. Dis-charge measurements usually are made whilewading in the vicinity of the station. High-watermeasurements are made from the bridge.
The bankfull channel was defined clearlythroughout most of the reach by field indicatorssuch as riparian vegetation and depositional fea-tures. Two cross sections were surveyed at riffleswithin the reach. A view of the study reach isshown in figure 6. The lower third of the streamreach was affected by fill on the right bank due todevelopment, but both cross sections wereupstream and beyond the immediate effect of thisfill. The bankfull widths, mean depths, and cross-sectional areas were averaged to determine theinput for the development of the regional curves.The elevation of the bankfull stage was surveyedto the outside vertical staff gage from which thegage height and streamflow associated with thebankfull discharge were determined. The mea-sured geometry of the channel within the esti-mated range of bankfull discharge, as taken fromstreamflow-measurement data in the USGS data-base, was used to assist with confirmation of bank-full selection.
Chester Creek near Chester - 01477000.—Thecontinuous streamflow-measurement station isabout 30 ft downstream from a bridge that appearsto have little or no effect on the bankfull discharge.Discharge measurements usually are made whilewading in the vicinity of the station. High-watermeasurements are made from the bridge. Thebankfull channel, in the vicinity of the streamflow-measurement station and throughout the reach,was defined poorly because of heavy bank erosion.The left bank is affected throughout the reach by aroad that parallels the stream, and sporadic riprapis present along that bank. Two cross sections weresurveyed at riffles within the reach. A view of thestudy reach is shown in figure 7. The bankfullwidths, mean depths, and cross-sectional areas ofthe two cross sections were averaged to determinethe input for the development of the regionalcurves. The elevation of the bankfull stage wasextended to the outside vertical staff gage fromwhich the gage height and streamflow associatedwith the bankfull discharge were determined. Themeasured geometry of the channel within theestimated range of bankfull discharge, as takenfrom streamflow-measurement data in the USGSdatabase, was used to assist with confirmation ofbankfull selection.

13
Figure 6. View looking downstream at reach for Crum Creek near NewtownSquare, Pennsylvania.
Figure 7. View looking downstream at reach for Chester Creek near Chester,Pennsylvania.

14
West Branch Brandywine Creek near HoneyBrook - 01480300.—The continuous streamflow-measurement station is about 100 ft upstream froma bridge that appears to have a slight effect on thebankfull discharge due to constriction of higherflows and the associated backwater effect. Dis-charge measurements usually are made whilewading in the vicinity of the station. High-watermeasurements are made from the bridge.
The bankfull channel throughout the reachwas well defined by changes in riparian vegeta-tion, depositional features, and a well-definedflood plain above which no features were present.Two cross sections were surveyed at riffles withinthe reach. A view of the study reach is shown infigure 8. A road is directly adjacent to the rightbank along the upper third of the study reach andsporadic riprap alters the natural channel withinthis area; however, surveyed cross sections weredownstream and beyond the effects of this streamreach. The bankfull widths, mean depths, andcross-sectional areas of the two cross sections wereaveraged to determine the input for the develop-ment of the regional curves. The bankfull elevationwas extended to the outside vertical staff gagefrom which the gage height and streamflow associ-ated with the bankfull discharge were determined.
The measured channel geometry at the esti-mated bankfull discharge, as indicated by stream-flow-measurement data in the USGS database, wasproblematic in the confirmation of bankfull at thisstation. The recurrence interval of the bankfull dis-charge at this site (1-year flood event) was at thelower boundary of the 1- to 2-year flood-eventrange commonly associated with the bankfull dis-charge. This 1-year recurrence interval was alsolower than had been noted at all other sites withinthis study (table 2). However, throughout theentire reach, there are no higher geomorphic fea-tures above the well-developed flood plain and thebankfull stage could be extended clearly, withoutobstruction, to the outside vertical staff gage at theUSGS streamflow-measurement station. Thesefindings confirm the association of the bankfullchannel to the 1-year flood event.
West Branch Brandywine Creek atCoatesville - 01480500.—The continuous stream-flow-measurement station is within the impound-ment area of a small dam approximately 150 ftdownstream from the gage. Several bridges crossthe stream within the range of 400 ft upstream to1,200 ft downstream from the station. All of thesebridges appear to have an effect on the bankfulldischarge either by redirecting or constrictingflows. The confluence of Rock Run into the WestBranch of the Brandywine Creek is approximately0.6 mi upstream from the gage. Discharge mea-surements usually are made while wading either1,000 ft upstream or 600 ft downstream from thegage. High-water measurements are made fromthe bridge 400 ft upstream from the gage.
The bankfull channel in the vicinity of thegage was defined poorly because of excessivewidth caused by the dam; therefore, the studyreach was downstream and below the dam. Thedam currently is filled with sediment and has verylittle storage or regulation effect on the bankfulldischarge. The bankfull channel throughout thestudy reach was moderately well defined by depo-sitional features, riparian vegetation, and a subtlechange in bank angle. Two cross sections were sur-veyed at riffles within the reach. A view of thestudy reach is shown in figure 9. The bankfullwidths, mean depths, and cross-sectional areas ofthe two cross sections were averaged to determinethe input for the development of the regionalcurves. The bankfull elevation could not beextended to the outside vertical staff gage becauseof the dam, and calculated values for bankfull dis-charge subsequently were used to determine thebankfull recurrence interval (1.3-year flood event).The channel geometry at the estimated bankfulldischarge, as indicated by streamflow-measure-ment data in the USGS database, proved not to beeffective with bankfull confirmation at this stationbecause discharge measurements commonly aremade while wading within a pool-dominatedreach. Measurements of streamflow within a poolresult in a slightly higher area than an equivalentstreamflow in a riffle.

15
Figure 8. View looking upstream at reach for West Branch BrandywineCreek near Honey Brook, Pennsylvania.
Figure 9. View looking downstream at reach for West Branch BrandywineCreek at Coatesville, Pennsylvania.

16
Sucker Run near Coatesville - 01480610.—The crest-stage, partial-record station does notcollect continuous data but is operated primarily todocument peak streamflow. Discharge measure-ments are made while wading approximately 50 ftdownstream of the streamflow-measurementstation; cross-section surveys were conducted inthis same reach. High-water measurements aremade from the bridge immediately upstream fromthe station. Two bridges, which are 227 ft apart,bound the reach and may constrict the bankfulldischarge slightly.
Definition of the bankfull channel, in thevicinity of the streamflow-measurement station,was fair, as evidenced by a subtle change in bankangle. Two cross sections were surveyed at riffleswithin the reach. A view of the study reach isshown in figure 10. The bankfull widths, meandepths, and cross-sectional areas of the two crosssections were averaged to determine the input forthe development of the regional curves. The bank-full water-surface elevation was extrapolated tothe outside vertical staff gage to determine thegage height and streamflow associated with thebankfull stage. The measured geometry of thechannel within the estimated range of bankfull dis-charge, as taken from streamflow-measurementdata in the USGS database, was used to assist withconfirmation of bankfull selection (White, 2001).
West Branch Brandywine Creek at Modena -01480617.—The continuous streamflow-measure-ment station is approximately 15 ft downstreamfrom a multi-span bridge and approximately 300 ftupstream from a small tributary (Dennis Run). Thebridge appears to have a slight effect on the bank-full discharge as indicated by a mid-channel barthat forms directly downstream from the bridge.Discharge measurements commonly are madewhile wading in the vicinity of the station. High-water measurements are made from the bridge.
The bankfull channel in the vicinity of thegage was moderately well defined by changes inriparian vegetation and depositional features. Twocross sections were surveyed at riffles within thereach. A view of the study reach is shown infigure 11. The cross sections were at 146 and 242 ftdownstream from the bridge, respectively, in orderto be above the confluence of Dennis Run and alsoabove the effects of fill from an industrial complexon the left streambank approximately 275 ft down-stream. The bankfull widths, mean depths, andcross-sectional areas of the two cross sections wereaveraged to determine the input for the develop-ment of the regional curves. The elevation of thebankfull stage was extended to surveyed referencemarks at the streamflow-measurement stationfrom which the gage height and streamflow associ-ated with the bankfull discharge were determined.The channel geometry at the estimated bankfulldischarge, as indicated by streamflow-measure-ment data in the USGS database, proved not to beeffective with bankfull confirmation at this stationbecause wading measurements of streamflow aremade within a pool-dominated reach adjacent tothe station.

17
Figure 10. View looking downstream at reach for Sucker Run nearCoatesville, Pennsylvania (From White, 2001).
Figure 11. View looking upstream at reach for West Branch BrandywineCreek at Modena, Pennsylvania.

18
Conowingo Creek near Buck - 01578200.—The crest-stage partial-record station consists oftwo crest-stage gages mounted approximately 70 ftupstream of a bridge on the left bank and on thedownstream left wingwall of the bridge. Thebridge appears to have very little effect on bankfulldischarge. Discharge measurements commonly aremade while wading in the vicinity of the station.High-water measurements are made from thebridge.
The bankfull channel throughout the reachwas well defined by riparian vegetation, both sub-tle and abrupt changes in bank angle, and deposi-tional features. Two cross sections were surveyedat riffles within the study reach approximately200 ft upstream and 400 ft downstream of thebridge. A view of the study reach is shown infigure 12. The bankfull widths, mean depths, andcross-sectional areas of the two cross sections wereaveraged to determine the input for the develop-ment of the regional curves. The elevation of thebankfull stage was extended to surveyed referencemarks at the streamflow-measurement stationfrom which the gage height and streamflow associ-ated with the bankfull discharge were determined.The study reach was bounded on the upstream endby the confluence of a small tributary and down-stream by a large evulsion indicative of acceleratedbank erosion. Approximately half of the studyreach, upstream from the bridge, was well vege-tated and bounded on the left overbank by a largefarm pond that appeared to be well above thebankfull stage. The remainder of the study reach,or that part downstream from the bridge, exhibitedvery little vegetation on the banks and (or) flood-plain and showed evidence, in the form of mean-der scars, of extensive lateral movement of thechannel. The measured geometry of the channelwithin the estimated range of bankfull discharge,as taken from streamflow-measurement data in theUSGS database, was used to assist with confirma-tion of bankfull selection.
Beaver Run near Finksburg - 01586210.—Thecontinuous streamflow-measurement station ismounted directly to the downstream face of amulti-span bridge and approximately 250 ftupstream of a small stone dam. Both the bridgeand dam appear to effect the bankfull discharge.The dam increases resistance to streamflow that, inturn, causes increased an flood stage during peri-ods of high flows and an increased bank erosionrate directly adjacent to the structure. The bridgeconstricts flow and causes both scour and the asso-ciated deposition of sediment downstream fromthe bridge structure.
The bankfull channel in the vicinity of thegage was defined poorly because of the effects ofthe bridge and dam; however, the bankfull channelwas well defined farther downstream by riparianvegetation, subtle changes in bank angle, and dep-ositional features. Two cross sections were sur-veyed at riffles within the study reach approxi-mately 400 and 600 ft downstream from the gage.A view of the study reach is shown in figure 13.The cross sections were downstream of the smallstone dam that has been bypassed along the rightbank by bank erosion. This dam, while small andlargely filled with sediment, appears to have a sig-nificant effect on the bankfull discharge. A farmpond lies in the flood plain beyond the left bank ofthe stream for almost the entire study reach. Theberm around this pond obstructs the floodplainbut is above the bankfull channel and has no effectat less-than flood stage. The bankfull widths, meandepths, and cross-sectional areas of the two crosssections were averaged to determine the input forthe development of the regional curves. The bank-full elevation could not be extended to the outsidevertical staff gage because of the dam, and calcu-lated values for bankfull discharge subsequentlywere used to determine the bankfull recurrenceinterval (1.4-year flood event). The channel geome-try at the estimated bankfull discharge, as indi-cated by streamflow-measurement data in theUSGS database, proved not to be effective withbankfull confirmation because wading measure-ments of streamflow are made within a pool-domi-nated reach slightly downstream of the bride.

19
Figure 12. View looking upstream at reach for Conowingo Creek near Buck,Pennsylvania.
Figure 13. View looking upstream at reach for Beaver Run near Finksburg,Maryland.

20
Morgan Run near Louisville - 01586610.—Thecontinuous streamflow-measurement station is30 ft downstream from the face of a bridge on theright bank. The outside vertical staff gage ismounted directly to the downstream-right wing-wall of the bridge. The bridge appears to both con-strict and redirect flows that affect the bankfulldischarge in the vicinity of the bridge.
The bankfull channel upstream and down-stream of the gage was moderately well defined byriparian vegetation and depositional features;however, because of the effect of the bridge, thebankfull channel was not well defined within thebridge right-of-way. Two cross sections were sur-veyed at riffles within the reach. A view of thestudy reach is shown in figure 14. The cross sec-tions were at 600 ft upstream and 450 ft down-stream of the gage because of irregular banks in thevicinity of the bridge. This irregularity appears tobe caused by deflected flow through the bridgestructure and runoff from the adjacent roadway.The bankfull widths, mean depths, and cross-sec-tional areas of the two cross sections were aver-aged to determine the input for the developmentof the regional curves. The bankfull elevationcould not be extended to the outside vertical staffgage because of the bridge, and calculated valuesfor bankfull discharge subsequently were used todetermine the bankfull recurrence interval(1.4-year flood event). The measured geometry ofthe channel within the estimated range of bankfulldischarge, as taken from streamflow-measurementdata in the USGS database, was used to assist withconfirmation of bankfull selection.
Big Pipe Creek at Bruceville - 01639500.—Thecontinuous streamflow-measurement station isadjacent to a pool created by a low-profile weir25 ft downstream from the shelter. A multi-spanbridge is 300 ft upstream from the station and doesnot appear to constrict the bankfull discharge. Dis-charge measurements usually are made whilewading upstream from the station. High-watermeasurements are made from the bridge.
The site assessment was limited to one cross-section survey within the reach because of a stormevent and resulting elevated streamflow midwaythrough the assessment. A view of the study reachis shown in figure 15. The bankfull channel wasdefined clearly throughout most of the reach, withthe exception of within the bridge right-of-way, byriparian vegetation and a subtle change in bankangle. The bankfull water-surface elevation passedthe outside vertical staff gage from which the gageheight and streamflow associated with the bank-full stage were determined. The measured geome-try of the channel within the estimated range ofbankfull discharge, as taken from streamflow-mea-surement data in the USGS database, was used toassist with confirmation of bankfull selection(White, 2001).

21
Figure 14. View looking downstream at reach for Morgan Run near Louisville,Maryland.
Figure 15. View looking upstream at reach for Big Pipe Creek at Bruceville,Maryland (From White, 2001).

22
Evaluation of Regional Cur ves
The regional curves presented in figures 16through 19 show the relation between drainagearea and bankfull cross-sectional area, bankfulldischarge, bankfull width, and bankfull meandepth, respectively. The 95-percent confidenceinterval indicates a band within which there is a95-percent probability that estimates of the meanbankfull-channel geometry or bankfull-channelflow for that particular drainage area will occur.The coefficient of determination, R2, is a measureof variability accounted for by the regression rela-tions in the observed channel-geometry, and (or)discharge compared to the drainage area. Thep-value measures the “believability” of the level ofsignificance of the statistical test. If the p-value isless than 0.05, the test is considered significant andthe trend, as represented by the regression line, canbe assumed to be real.
Bankfull cross-sectional area (fig. 16) andbankfull discharge (fig. 17) have the strongest rela-tion to drainage area as evidenced by R2 values of0.94 and 0.93, respectively. The relation betweenbankfull cross-sectional area and drainage area has
a p-value of less than 0.001. The p-value for therelation between bankfull discharge and drainagearea could not be presented because of a non-nor-mal distribution of residuals within this data setand is discussed later. The relation between bank-full width and drainage area (fig. 18) has an R2
value of 0.80 and a p-value of less than 0.001, indi-cating a moderate linear relation between all sta-tions. The relation between bankfull mean depthand drainage area (fig. 19), with an R2 value of 0.72and a p-value of less than 0.001, also indicates amoderate linear relation between all stations. Themoderate relation indicated by the bankfull meandepth and bankfull width regional curves may bedue, in part, to variation in Rosgen stream type asnoted in table 2. The Cook’s Distance statistic is ameasure of the influence a particular point has onthe regression relations of observed channel-geom-etry, and (or) discharge compared to the drainagearea. Analysis of the Cook’s Distance statistic foreach regional curve yielded no values greater than1; therefore, none of the 14 data points has signifi-cant influence, or leverage effect, in any regional-curve data set.
Figure 16. Regional curve representing relation between bankfull cross-sectional area anddrainage area in non-urban, Piedmont Physiographic Province, Pennsylvania andMaryland.
23
Figure 17. Regional curve representing relation between bankfull discharge and drainage areain non-urban, Piedmont Physiographic Province, Pennsylvania and Maryland.
Figure 18. Regional curve representing relation between bankfull cross-sectional widthand drainage area in non-urban, Piedmont Physiographic Province, Pennsylvania andMaryland.

24
Statistical tests for the normality of residualsby analysis of the p-value statistic obtained fromthe Kolmogorov-Smirnov Goodness-of-fit (GOF)test yielded a value of 0.003 for the relationbetween bankfull discharge and drainage area.P-values from the Kolmogorov-Smirnov GOF testequal to or less than 0.05 indicate the residualsfrom the data set should be considered not normal.All other relations reported values above this limit.Non-normal residuals do not necessarily indicate apoor relation; however, they do result in incorrectp-values because the residual distribution does notfit the normal t-distribution used to compute thep-value. For this reason, no p-value is presentedfor the relation between bankfull discharge anddrainage area, and the curve should be used withcaution. This non-normality also causes the 95-per-cent confidence bands presented in figure 17 to bequestionable because they are constructed usingthe assumption of a normal distribution. The95-percent confidence bands are shown in figure 17for reference but also should be used with caution.On the basis of regression diagnostics and visualevaluation, users of the bankfull cross-sectional
area and bankfull discharge regional curves wouldexpect to obtain better estimates than those ofbankfull width and bankfull mean depth.
COMPARISON OF ESTIMATES FROMPIEDMONT PHYSIOGRAPHIC PROVINCEREGIONAL CURVES AND DUNNE AND
LEOPOLD REGIONAL CURVES
Bankfull-channel dimensions and stream-flows determined from the relations discussed pre-viously herein, those determined from White(2001), and those estimated from Dunne andLeopold (1978) for drainage areas of 5, 25, 50, 75,100, and 200 mi2 are shown in table 3. Comparisonof estimates computed from regional curves pre-sented by White (2001) and Dunne and Leopold(1978) to those computed from the Piedmont Phys-iographic Province regional curves yield differ-ences for bankfull cross-sectional area rangingfrom 29 to -7.2 percent, differences for bankfullmean-depth ranging from 30 to -6.7 percent, differ-ences for bankfull width ranging from 9.1 to-33 percent, and differences for bankfull dischargeranging from 16 to -4.0 percent.
Figure 19. Regional curve representing relation between bankfull cross-sectionalmean depth and drainage area in non-urban, Piedmont Physiographic Province,Pennsylvania and Maryland.

25
LIMITATIONS OF THE INVESTIGATION
Subjective filtering criteria may have elimi-nated, unnecessarily, streamflow-measurementstations that could have been included in thedevelopment of the regional curves. Conversely,land-use percentages characterizing the watershedmay affect runoff characteristics at a much lowerpercentage than the criteria would indicate. Forexample, numerous studies suggest channel stabil-ity may be affected by urban land use and regula-tion at percentages lower than the 20 percent usedin this report. While this study has added eightadditional data points to the previous work byWhite (2001), this data set is still statistically small.The continued addition of data from streamflow-
measurement stations in this and other physio-graphic provinces may provide better estimates ofthe relation of channel characteristics to drainagearea in all provinces by increasing the size of thedata set.
Physiography is used in this study as oneway to categorically analyze the assessment ofstreamflow-measurement stations. This approachmay, or may not, be a significant factor in deter-mining the regional relation of runoff characteris-tics of a watershed to the geomorphic characteris-tics at a specific station; for example, large percent-ages of the drainage areas to some streamflow-measurement stations are in a different physio-graphic section or province than the station itself.
Table 3. Comparison of estimates from Piedmont Physiographic Province Regional Curves, Piedmont LowlandsRegional Curves, and Dunne and Leopold Regional Curves
[mi2, square miles; ft3/s, cubic feet per second; ft2, square feet; ft, feet]
Drainagearea
Channel characteristics
PiedmontPhysiographic
Provinceregionalcurves—Values
computed fromequations
PiedmontLowlands
regional curvesfrom White,
2001—Valuescomputed from
equations
Dunne andLeopold
Regional Curvesfor southeastPennsylvaniaand eastern
United States—Values from
graphs
Comparison ofestimates fromWhite (2001) to
PiedmontPhysiographic
Province curvesin percentdifference
Comparison ofestimates from
Dunne andLeopold (1978)
to PiedmontPhysiographic
Province curvesin percentdifference
5 - mi2 Bankfull discharge - ft3/s 210 250 220 16 4.5
5 - mi2 Bankfull cross-sectional area - ft2 46 46 65 0.0 29
5 - mi2 Bankfull mean depth - ft 1.6 1.5 2.3 -6.7 30
5 - mi2 Bankfull width - ft 29 31 30 6.5 3.3
25 - mi2 Bankfull discharge - ft3/s 800 890 800 10 0.0
25 - mi2 Bankfull cross-sectional area - ft2 170 180 180 5.6 5.6
25 - mi2 Bankfull mean depth - ft 2.7 2.8 3.8 3.6 29
25 - mi2 Bankfull width - ft 62 65 50 4.6 -24
50 - mi2 Bankfull discharge - ft3/s 1,400 1,500 1,500 6.7 6.7
50 - mi2 Bankfull cross-sectional area - ft2 300 330 320 9.1 6.3
50 - mi2 Bankfull mean depth - ft 3.4 3.6 4.5 5.6 24
50 - mi2 Bankfull width - ft 85 90 70 5.6 -21
75 - mi2 Bankfull discharge - ft3/s 2,000 2,100 2,000 4.8 0.0
75 - mi2 Bankfull cross-sectional area - ft2 410 460 400 11 -2.5
75 - mi2 Bankfull mean depth - ft 4.0 4.2 4.9 4.8 18
75 - mi2 Bankfull width - ft 100 110 80 9.1 -25
100 - mi2 Bankfull discharge - ft3/s 2,600 2,700 2,500 3.7 -4.0
100 - mi2 Bankfull cross-sectional area - ft2 510 590 500 14 -2.0
100 - mi2 Bankfull mean depth - ft 4.4 4.7 5.5 6.4 20
100 - mi2 Bankfull width - ft 120 120 90 0.0 -33
200 - mi2 Bankfull discharge - ft3/s 4,600 4,600 4,500 0.0 -2.2
200 - mi2 Bankfull cross-sectional area - ft2 890 1,100 830 19 -7.2
200 - mi2 Bankfull mean depth - ft 5.5 6.2 7.0 11 21
200 - mi2 Bankfull width - ft 160 170 130 6 -23

26
The regional curves presented in this reportshould be used only for the confirmation of thebankfull channel conditions in non-urban streamsof the Piedmont Physiographic Province. Due tothe variation inherent in hydrologic data, regionalcurves should not be used for direct computationof channel dimensions in steam restorationdesigns. The assumption made for this investiga-tion is that the bankfull discharge is within the1- to 2-year recurrence range. Thorne and others(1997) state, “The widely reported assertion thatbankfull discharge occurs on average once every1 to 2 years is now seen as an oversimplification.”If runoff patterns at a streamflow-measurementstation are such that the bankfull discharge mayoccur more, or less, often than this 1- to 2-year fre-quency, the recurrence-interval criteria did notsubstantiate identification of the bankfull channelas it was intended. In addition, land use and otherbasin characteristics upstream from the reachwhere regional curves are to be applied should besimilar to those used for the selection criteria inthis assessment.
The stability of the reaches included in thisstudy—in terms of sediment transport, hydraulicconveyance, and degradation and (or) aggradationof the stream reaches—has not been confirmed,and long-term monitoring of the reaches has notbeen completed. Stream channels in transitionalstates may have introduced increased variance intothe regional curves, especially the bankfull widthand bankfull mean depth curves. Stream-restora-tion projects must rely on reference reaches indica-tive on long-term stability for design criteria anduse regional-curve data only to initially confirm orrefute the field identification of the bankfull chan-nel conditions.
SUMMARY AND CONCLUSIONS
The U.S. Geological Survey (USGS), in coop-eration with the Pennsylvania Department of Envi-ronmental Protection, conducted a study todevelop regional curves of bankfull-channel geom-etry and discharge for use in support of stream-res-toration efforts. This study took place from 1999 to2000 in the Lowland Sections of the PiedmontPhysiographic Province and continued into 2002 tocomplete the Upland Section and, therefore, theentire Piedmont Physiographic Province withinPennsylvania and Maryland. Those regionalcurves were developed from channel-geometryand streamflow data collected at 14 USGS stream-flow-measurement stations in the PiedmontPhysiographic Province. These streamflow-mea-surement stations included six from the previousstudy of the Piedmont Lowland Sections and eightadditional streamflow-measurement stations in thePiedmont Upland Section. The watersheds rangein size from 2.57 to 102 mi2. The bankfull channelwas identified at each station by use of field indica-tors and confirmed by use of historical streamflow-measurement data when possible. Width, meandepth, cross-sectional area and discharge of thebankfull channel were plotted as a function ofdrainage area and a “best fit” regression line wasapplied to the data. The resulting regression line,and the corresponding equation defining that line,can be used to confirm field identification of bank-full-channel conditions at non-urban stream siteshaving similar runoff characteristics throughoutthe Piedmont Physiographic Province given aknown drainage area. On the basis of regressiondiagnostics and visual evaluation, bankfull areaand bankfull discharge have a stronger relation todrainage area than do bankfull width and bankfullmean depth.
Regional-curve sets that provide an estimateof bankfull-channel dimensions and streamflowcan be a valuable tool to support efforts in streamrestoration by assisting in identification of thebankfull channel; however, practitioners of streamrestoration need to realize their limitations. Thecurves developed for this study are based on lim-ited, highly variable data. The small number ofstreamflow-measurement stations used to createthese regressions limits the strength of the regionalcurves presented.

27
REFERENCES CITED
Alexander, R.B., Brakebill, J.W., Brew, R.E., Smith,R.A., 1999, ERF1-Enhanced River Reach File1.2: U.S. Geological Survey Open-FileReport 99-457, accessed May 17, 2001, athttp://water.usgs.gov/GIS/metadata/usgswrd/erf1.html.
Dunne, T., and Leopold, L.B., 1978, Water in envi-ronmental planning: San Francisco, Calif.,W.H. Freeman, 818 p.
Leopold, L.B., 1994, A view of the river:Cambridge, Mass., Harvard UniversityPress, 298 p.
Pennsylvania Department of Transportation, 1997,1997 Pennsylvania cartographic/GISinformation: Harrisburg, Pa., Bureau ofPlanning and Research, Publication BPR-CD-97.
Rosgen, D., 1996, Applied river morphology:Minneapolis, Minn., Printed Media Compa-nies, 352 p.
Sevon, W.D., comp., 2000, Physiographic provincesof Pennsylvania (4th ed.): PennsylvaniaGeologic Survey, map 13, scale 1:2,000,000,accessed Oct. 24, 2000, athttp://www.dcnr.state.pa.us/topogeo/map13/13pls.htm.
Thorne, C.R., Het, R.D., and Newson, M.D., 1997,Applied fluvial geomorphology for riverengineering and management: Chichester,England, John Wiley and Sons, 376 p.
U.S. Geological Survey, 1996, National land coverdata: U.S. Geological Survey, accessedMay 17, 2001, at http://edcwww.cr.usgs.gov/programs/lccp/nationallandcover.html.
White, K.E., 2001, Regional curve developmentand selection of a reference reach in the non-urban, lowland sections of the PiedmontPhysiographic Province, Pennsylvania andMaryland: U.S. Geological Survey Water-Resources Investigations Report 01-4146,20 p.