Embed Size (px)
Citation preview

1
Hydrogeology of an Upper Montane Tropical Forest
Emily Davis
CloudBridge Nature Reserve & SUNY New Paltz San Gerardo de Rivas, Perez Zeledón, Costa Rica
June 2009
Table of Contents: 1. Introduction 2
2. Rocks, Minerals, and Geological Features 3
3. Physical & Chemical Soil Properties 11
4. Terrain Features 15
5. Water Quality Analysis 16
6. Aquifer Analysis 19
7. Land Use Assessment 22
8. Conclusion 24
9. Appendices 25
10. References 32

2
Introduction: The purpose of this study is to better understand the hydrogeologic systems of the upper montane tropical forests, or cloud forests. CloudBridge Nature Reserve provided an ideal site for this research, as it is located on the foothills of Cordillera de la Talamanca, which is one of the few regions on earth that contains this specific bioregion. Cloud forests boast a high ecological diversity, and this complex ecology translates into the geologic and hydrologic properties. For example, because of the high amount of lichenous, and epiphytic biomass that utilize atmospheric water vapor to survive, the water budget is harder to quantify because of incalculable changes in evapotranspiration. Also, because of a great diversity of plants, and therefore tree litter, minute terrain differences create varying microclimates on the forest floor. These changes in the microclimates affect how run-off water flows through the topography, terrain, and soils. The geologic processes that created the celebrated Cordillera de la Talamanca not only affect the topography of this region. The Cocos Plate subduction zone on the Pacific coast of Costa Rica produced the peaks of Talamanca, as well as cooled magma into solid rock, generating granite and other extrusive igneous rocks as the dominant geologic material. This rock material weathers to become a part of the soil, fractures, to hold water within itself, moves upward to create steep slopes which causes high run-off rates and low slope-stability, and provides the basis of all environmental conditions of the upper montane tropical forest. The geology and hydrology of the cloud forest impart themselves to the rest of the ecology, and the study of one is incomplete without the other. CloudBridge Nature Reserve is located in the “tierra de las aguas enternales,” or “land of eternal waters”. Mountain rivers dissect the high peaked Talamanca range, and rush down through the valleys. Clouds nestle and condense right into the trees and forests, providing lichens and epiphytes their water and nutrition. Seeps and springs dot the surface with water sources, fed from local aquifers with sources on the continental divide. Rains blanket with earth with essential, although sometimes excessive, water, which runs through the soil as through-flow off the steep mountainous forests. Without these vital water sources, the cloud forest system will collapse, since its fragility is dependent on minute changes in the water cycle. Therefore, it is virtually impossible to understand the sensitive and subtle workings of tropical cloud forests without understanding the hydrogeologic processes. Equally, one cannot preserve the forests without understanding, and therefore maintaining the delicate water systems. This study includes elements that examine soil structure, through observations of soil outcrops and identification of horizons. It studies the water chemistry properties, such as nitrates, phosphates, and pH to describe the quality of the water, and how it changes in different environments. Local land use was observed to determine possible causes of environmental change. Rocks were identified and studied for mineral compositions, to understand their affect on the soil, water, and ecology. Overall, this research was focused on water and rock relationships, and how these relationships influence the environment and local community.
3
Rocks, Minerals, and Geological Features of CloudBridge Nature Reserve The purpose of this study was to collect rocks in the field at different locations, identify them, identify the minerals present, and draw conclusions about how the geological features influence the environment. To completely understand how the different geological features affect the environment, one must include an analysis of the historical geology of the Cordillera de la Talamanca. Geological History: The principal geological features in Costa Rica are relatively young, and range from the Jurassic to Quaternary periods, see Appendix A for a geologic time scale diagram. Specifically to CloudBridge Reserve, the rock groups that concern the Cordillera de la Talamanca are the Tertiary Intrusive Rocks, Tertiary Sedimentary Rocks, and in some smaller instances the Tertiary Volcanic Rocks1. These events are relatively young, beginning the Cenozoic era only 65 million years ago. First, there is the Tertiary Sedimentary Rocks. These rocks that appear in the southern central region of Costa Rica, in Valle de El General, and in the western foothills of Cordillera de la Talamanca. They formed in marine depositional environments, and are primarily sandstones, siltstones, shales, claystones, and limestone. This lithification of marine sediment, usually mud and silt, occurred before the Cocos Plate moved eastward into the Caribbean Plate. The terrestrial Tertiary sedimentary rocks are conglomerates that formed on the foothills of Cordillera de la Talamanca. Locally, the specific rocks that can be found from this period are coarse to fine-grained sandstones, calcareous gray siltstones, shaly limestones, and some fossiliferous sandstone. Later, Tertiary Plutonic Rocks appeared. In this sequence, the rocks found along the crest of the Cordillera de la Talamanca were probably derived from one common cooling magma body. Therefore, geologists refer to this as the Talamanca Comagmatic Series. It is principally comprised of gradodiroties, gabbros, and granites; with lesser proportions of mangerites, monzonites, diorites, and gabbrodiorites. This series intrudes into the Tertiary Sedimentary sequence in the central part of Costa Rica and in Cordillera de la Talamanca. The intrusive stock that is closest to CloudBridge is the Chirripó Intrusive, as it extends to the highest peak in the Talamanca, and almost exclusively consists of granodiorite. The Talamanca Comagmatic Series occurred during a strong deformation period, in the beginning of the Miocene. This activity produced a series of mineralizations, mostly metallic, that currently characterizes the area. The Late Miocene Talamanca Intrusive Suite (TIS) represents one of the youngest and most extensively exposed plutonic suites associated with orogenesis in the world. Rapid uplift associated with subduction of the Cocos Ridge is primarily responsible for exposing this plutonic core. In addition, a combination of Pleistocene glacial and recent rain forest conditions provided an efficient erosional mechanism for unroofing the 1 In Costa Rican geology, there are six principal geological provinces paralleling the Mesoamerican trench: 1) the Cretaceous to Middle Tertiary ophiolitic suite; 2) Tertiary basins; 3) Tertiary volcanic ranges; 4) Active Quaternary volcanic ranges; 5) Intra-arc basins; and 6) the Caribbean coastal plain. The Tertiary groups that concern Cordillera de la Talamanca have occurred within the Tertiary basins. To see an image of where these provinces are, in relation to the Cocos Plate and Mesoamerican trench, see Appendix B.

4
Cordillera de Talamanca and generating a diverse mix of geomorphologic features. Four major lithologic groupings are made on igneous rocks of the Cordillera de Talamanca, which include mid-Oligocene tholeiitic gabbros, mid-Oligocene El Baru plutonic rocks, Late Miocene calc-alkaline TIS, and a Plio-Pleistocene volcanic group.
Glacial Deposits:
More recently, the Cordillera de la Talamanca also experienced glacial activity during the Pleistocene Epoch. The last glaciers retreated from this area about 10,000 years ago, but evidence of their presence can be seen by the region’s many lakes and u-shaped valleys, such as Moraine’s Valley, the Lake’s Valley, and the Rabbit’s Valley2. Striations can be observed on several of the rock beds in these valleys. The highest peaks of Costa Rica were glaciated during the late Quaternary, attesting to a significantly
cooler climate in Central America than today. During the last local glacial maximum (LLGM), an ice cap (35 km2 in extent) covered the highest peaks of the Cordillera de Talamanca around Cerro Chirripó and Cerro de la Muerte. In Chirripó National Park, three moraine groups define three glacial stages. The Talamanca Stage extends to 3040 m and represents the last local glacial maximum. Chirripó Stage moraines reach elevations of 3300 m, and Talari Stage moraines formed at 3300m and 3420 m. Also, many sedimentary rocks and conglomerates exist in these valleys, suggesting a lithification of glacial deposits. More specifically to the CloudBridge reserve, glacial till can be seen along Río Chirripó and other rivers. Here, the sizes of the rock range from very large boulders between 1-10 meters and fine silt. Here are a few photos of glacial evidence.
2 For CloudBridge, Chirripó River valley is V-shaped, signifying that it was formed by the river itself, not a glacier. Although the valley topography does not suggest glaciers, other topographical features, such as glacial horns and kettle lakes, exist.
Boulder containing cemented pebbles and sand, most likely glacial deposits.
Rió Chirripó alluvial bed, example of glacial outwash.

5
Rock Samples: The following is a series of rocks that were collected along the Chirripó River in the CloudBridge Reserve. These rocks were chosen because they provided an appropriate range of examples of the dominant rocks in the reserve. The high majority of the rocks present in CloudBridge are extrusive igneous rocks, and more commonly granites. However, there are (quite rarely) some sedimentary rocks that were formed either from the lithification of glacial deposits or deep marine sediments. Sample A: Porphyritic Micro-Granite
Extrusive Igneous Texture: coarse grained, medium color index (30-70) Minerals present: hornblende, biotite, quartz, plagioclase feldspar, and muscovite Phenocrysts present are most likely alkali feldspar, surrounded by biotite granite Sample B: Biotite Granite
Extrusive Igneous Texture: coarse grained, granular texture, medium color index (20-50) Minerals: hornblende, biotite, quartz, plagioclase feldspar, silicates

6
Sample C: Sedimentary Conglomerate
Lithified Sediment Most likely created from the lithification of glacial deposits, or from shallow marine environments Pebbles set in a fine-grained sedimentary matrix; Bedding absent Minerals: dominantly quartz; pebbles consist of various rocks including sandstones Sample D: Calcareous Siltstone
Sedimentary Texture: homogenous, fine-grained, sub-conchoidal fracture, gray-blue color Minerals: Probably calcite, other fine-grained detrital material

7
Formed in relatively deep-water marine environments Sample E: Diorite
Extrusive Igneous Texture: granular texture, coarse grained, medium-high color index (50-120) Minerals: muscovite, biotite mica, hornblende, quartz, plagioclase feldspar Usually found in environments that also have granites Sample F: Porphyritic Rhyolite
Extrusive Igneous Texture: fine grained, holds larger phenocrysts, light color index (0-20) Minerals: Phenocrysts either quartz or feldspar; fine-grained material of quartz, potassium feldspar, and muscovite

8
Light vertical flow banding apparent, not unusual of rhyolites Phenocrysts are <. 5mm long, and <. 1mm wide Sample G: Syenite/ Granite
Extrusive Igneous Texture: granular, coarse grained, low-medium color index (20-60) Minerals: plagioclase feldspar, quartz, biotite, hornblende, amphibole Coloring: grey, white, black, pink. Associated with granites, and can grade into granite Sample H: Granodiorite
Extrusive Igneous Texture: granular, coarse grained, medium color index (30-60)

9
Minerals: muscovite, quartz, hornblende, biotite Sample I: Muscovite Granite
Extrusive Igneous Texture: granular, coarse grained, low color index (0-30) Minerals: muscovite, alkali feldspar, quartz, hornblende Colors: pink, white, grey Chemical Composition of Minerals: -Quartz: SiO2
-Hornblende: Ca2 (Mg, Fe2+) 4(Al, Fe3+) Si2AlO2 (OH) 2
-Plagioclase Feldspar: Na (Al, Si)4 O8
-Muscovite: KAl2 (Al, Si3) O10 (OH, F) 2
-Biotite: K (Mg, Fe2+) 3(Al, Fe3+) Si3O10 (OH, F)2
-Olivine: (Mg, Fe)2SiO4
For granite, the average weights of chemical components from granites around the world is: * SiO2 — 72.04% * Al2O3 — 14.42% * K2O — 4.12% * Na2O — 3.69% * CaO — 1.82% * FeO — 1.68%
* Fe2O3 — 1.22% * MgO — 0.71% * TiO2 — 0.30% * P2O5 — 0.12% * MnO — 0.05%

10
These are the chemical formulas for the most abundant minerals that occur in the rock samples. It is clear that with the exception of calcic hornblende, there is no calcium material, including calcium bicarbonate, present in the parent rock. This has a direct effect on the environment, since the surface water bodies experience a clear increase in acidity as it increasingly interacts with the environment. There are no buffer capabilities of the rock, and so the water is prone to acidification. Also, this affects the soil chemistry greatly. The average pH of the soils in the CloudBridge Reserve is 5, and drops down to 4.5 at about 80cm deep into the soil. Again, the rocks have no abilities to buffer the acid in the soil. This high soil acidity is common of Ultisols, the classification name given to iron-rich, acidic, low-nutrient soil found in tropical regions. These soil systems will be examined in greater detail in the next section. The high iron concentration of the soil can also be traced to the material in the rocks present. With the exception of quartz and plagioclase feldspar, all of the listed minerals contain an iron molecule or iron ion. In addition to this, the metallic mineralization activity that occurred in the Miocene period provided the area with plenty of these minerals. The amount of iron in the soil from parent material can be seen clearly by the un-trained eye at the red and yellow tint of soil outcrops, depression storage areas, and soil dust.

11
Physical and Chemical Properties of Soil: A very important aspect to analyzing the water systems in the cloud forest ecology is determining how the water flows through the soil, and therefore how the plants use this water. To accomplish this, one must identify the soil horizons, characterize the type of soil, and calculate the hydraulic properties of the soil. A soil outcrop section was used for this purpose. Its dimensions are about 240 cm wide, and 130 cm deep. Once the horizons are identified, soil samples are take from the surface, and then at 10 cm intervals deep into the outcrop. It was found that after 80 cm deep, the soil was homogenous, as can be seen by the image describing the soil horizons. Therefore, 9 samples of soil were gathered from this one location, and the moist mass, saturation mass, and dry mass are measured3. Using this information, one can calculate the porosity, gravimetric water content, volumetric water content, saturation ratio, dry bulk density, and particle density of the soils. This gives a clear picture of the soil’s ability to retain, transport, or release water into the environment. Also, based on these characteristics, one can surely identify the type of soil, and which ecological conditions are most harmonious for this soil On the following page is a data chart with the results of the calculations for the physical properties of the soils. First, the moist, dry, and saturated masses were measured for each of the 9 samples. Later, using these values, the rest of the physical hydraulic properties of the soils were determined.
3 Moist mass is the mass of the soil taken directly from the earth. It represents the environmental conditions from which it came from. Saturation mass is found when all of the empty pore spaces are filled with water, when it hold the maximum amount of water without dripping. Dry mass can be found when the soil sample it completely dried, and reaches a constant mass.

12
There are a few trends in the values obtained for these soil samples. For example, the porosity has a general decline as the soil goes deeper. A graph showing the visual decline of porosity is provided. This is caused by the high amount of clay in the soil. With greater depth, the clay layers compact, and provide less pore space. Ultisols of this region are characterized for high mounts of clay. Also, the gravimetric water content, which is the mass of the water per unit mass of dry soil, experiences a decline, with the exception of a sudden increase at 70cm. Because in the weeks before this sample was taken, an unusually long drought was experienced in the region. Therefore, there was no water that was saturating the soils at a greater depth. And because of the high ecological competition in the cloud forests, water is usually wicked up from roots before they can infiltrate such depths. Dry bulk density, which is the measure of the weight of the soil per unit volume, increases steadily until 70 cm. This makes sense, because reviewing the soil horizon information, with increasing depth (at about Horizon B,) there is more parent rock material, and less organic material. Therefore, the density of the soil will be greater due to an increase of larger, more solid rock material.
In addition to completing this portion of the study, it is important to analyze the size of the grains present in the soil. In different soils and in different environmental conditions, the particle sizes of the soils explain a lot about how the soils function. For example, if a soil contains particles of equal size, the porosity will be high, since there will be many open spaces between the grains. But, if the soil has a mixture of grain sizes,
13
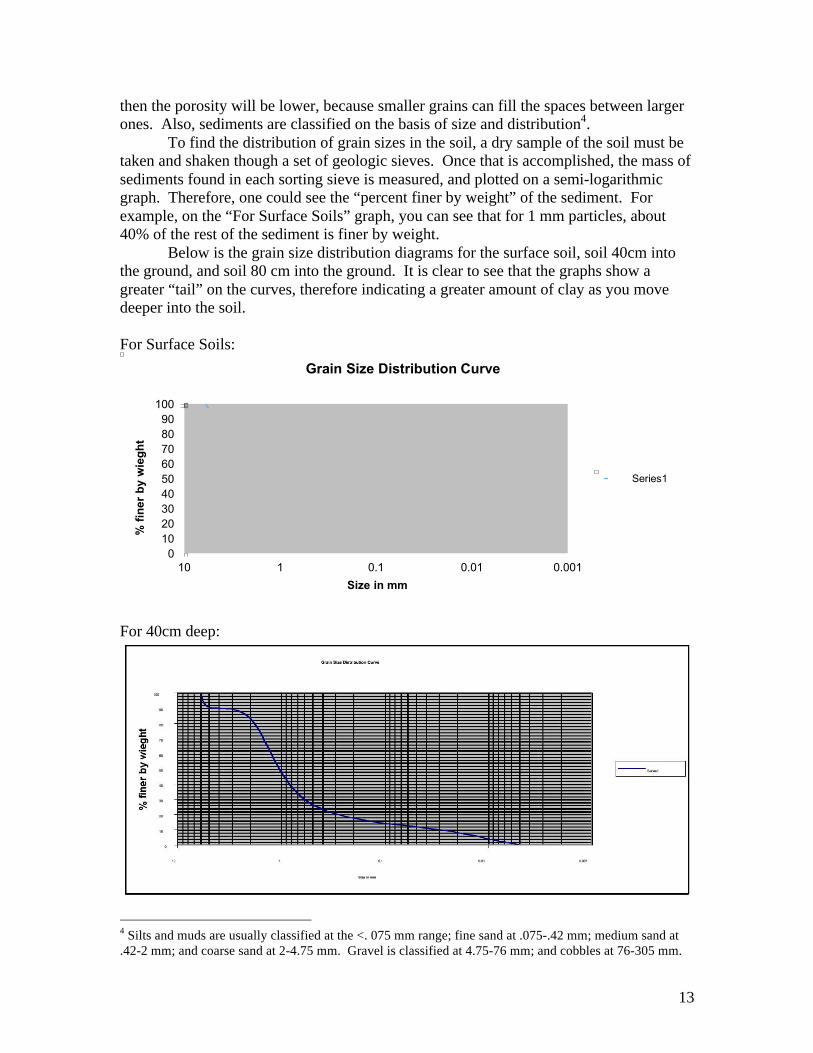
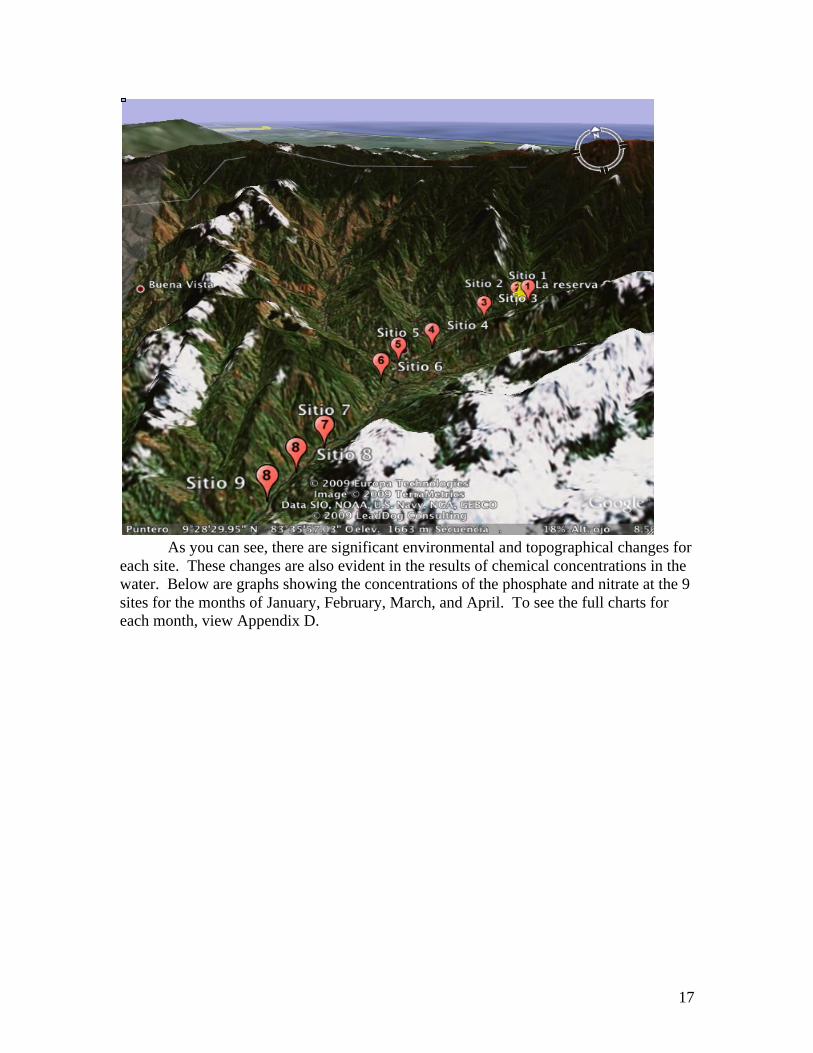
then the porosity will be lower, because smaller grains can fill the spaces between larger ones. Also, sediments are classified on the basis of size and distribution4. To find the distribution of grain sizes in the soil, a dry sample of the soil must be taken and shaken though a set of geologic sieves. Once that is accomplished, the mass of sediments found in each sorting sieve is measured, and plotted on a semi-logarithmic graph. Therefore, one could see the “percent finer by weight” of the sediment. For example, on the “For Surface Soils” graph, you can see that for 1 mm particles, about 40% of the rest of the sediment is finer by weight. Below is the grain size distribution diagrams for the surface soil, soil 40cm into the ground, and soil 80 cm into the ground. It is clear to see that the graphs show a greater “tail” on the curves, therefore indicating a greater amount of clay as you move deeper into the soil. For Surface Soils:
For 40cm deep:
4 Silts and muds are usually classified at the <. 075 mm range; fine sand at .075-.42 mm; medium sand at .42-2 mm; and coarse sand at 2-4.75 mm. Gravel is classified at 4.75-76 mm; and cobbles at 76-305 mm.
0102030405060708090100
0.0010.010.1110
% fi
ner b
y w
iegh
t
Size in mm
Grain Size Distribution Curve
Series1

14
For 80cm deep:
With the information found by the particle size analysis and physical hydraulic properties, once can conclude that the soils present have a high mass of clay, especially at greater depths. On the surface, they conduce water well, but the porosity and the hydraulic conductivity decreases with depth. Also, the soil is dryer at depths of 50 cm downward, most likely due to high plant competition poor vertical infiltration of the water. In addition to finding the grain sizes and hydraulic properties of the soil, I tested for the pH, nitrogen, phosphorus, and potassium of the soil for the 9 different samples. This is a chart showing the clear trends of the chemical properties.
The highest concentrations of phosphorus, nitrogen, and potassium exist with the top 20 cm of the soil, and after that, there is too much leaching of the soil for there to be any nutrients. Also, the pH of the soil is quite acidic, and the pH decreases deeper into the soil. Based on the grain sizes of the soil, the pH, and the low concentrations of nutrients, I’ve classified this soil as Ultisol based on USDA standards. Usually, Ultisols have a pH of about 5 or less, have a yellow or reddish color due to iron oxides, and have no calcareous materials. Also, the dominant mineral is kaolinite, which lends itself to the clayey texture of the soil. This is also congruent with the information gathered on the grain size distributions, and with the particle densities of the different horizons.

15
Terrain Features: Distinctive terrain features exist in the montane forest system of Cordillera de la Talamanca, including swamps, small pools of water, quebradas, ridges, waterfalls, and landslides. These features contribute greatly to the unique landscape and microclimate diversity found in these forests. Certain geomorphologic processes such as stream incision and mass wasting influence the terrain. Small swampy areas occur along the flat ridgetops and summits along the Continental Divide in the Cordillera de la Talamanca. They usually occur at the extreme topographical highs of the local watersheds. These highland swamps are formed by high altitude wind-driven cloud-water, precipitation inputs, and low rates of evapotranspiration. Permanent puddles are common to this area, and are filled with between .30-1 m of soft organic material. These highland swamps provide the initial recharge into the local aquifers, and filter the water as it infiltrates into the ground. Although less common, there are lower elevation swamps, which occur in forested areas below the higher peaks. The microtopographical relieves in these forests systems are quite diverse, being influenced by biotic processes and abiotic processes. Biotic processes include treefalls, leaf litter deposits, and animal movement. Abiotic processes include overland flow of water, throughflow, and slope erosion. In steeper areas, especially in steep developed areas, small ledges or terracettes are commonly, and propagated by animal trampling. Overall, microtopographical variations in the forest floor accentuate the variation in litter accumulation, rates of decomposition, and nutrient release. Spring and stream incision is influenced heavily by the soil structure. The A horizon is quite porous and has a high volumetric moisture content and hydraulic conductivity, however the underlying B and C are less permeable. Therefore, water readily infiltrates the A horizon but continues to move laterally along the deeper horizons. This flow tends to concentrate at depressions in the head of primary watersheds, and emerges as springs at the A-B horizon boundary at the head of incised stream channels. Landslides in montane tropical forests are often caused by torrential rains, which increase soil water potential and decrease soil stability. Regionally, earthquakes could also trigger larger episodic landslides. In addition to this, many small slumps exist (3-5 m across) that typically involve rotational failure of the slope along creek banks. These smaller slumps do not heavily influence forest floor structure, but they do contribute to the fluvial sediment load. Once a landslide occurs, water seepage may selectively remove fine-grained sediments and leave cobbles and boulders. As this happens, stony mounds may exist at the upper bowl of valleys in tropical montane forests. Although landslides are more typical on steeper slopes, there are factors that cause landslides on different terrain types. These factors include geological substrate, soil development, vegetation structure and human activities. For photos of small landslides and slumps occurring on developed steep slopes, view Appendix C.

16
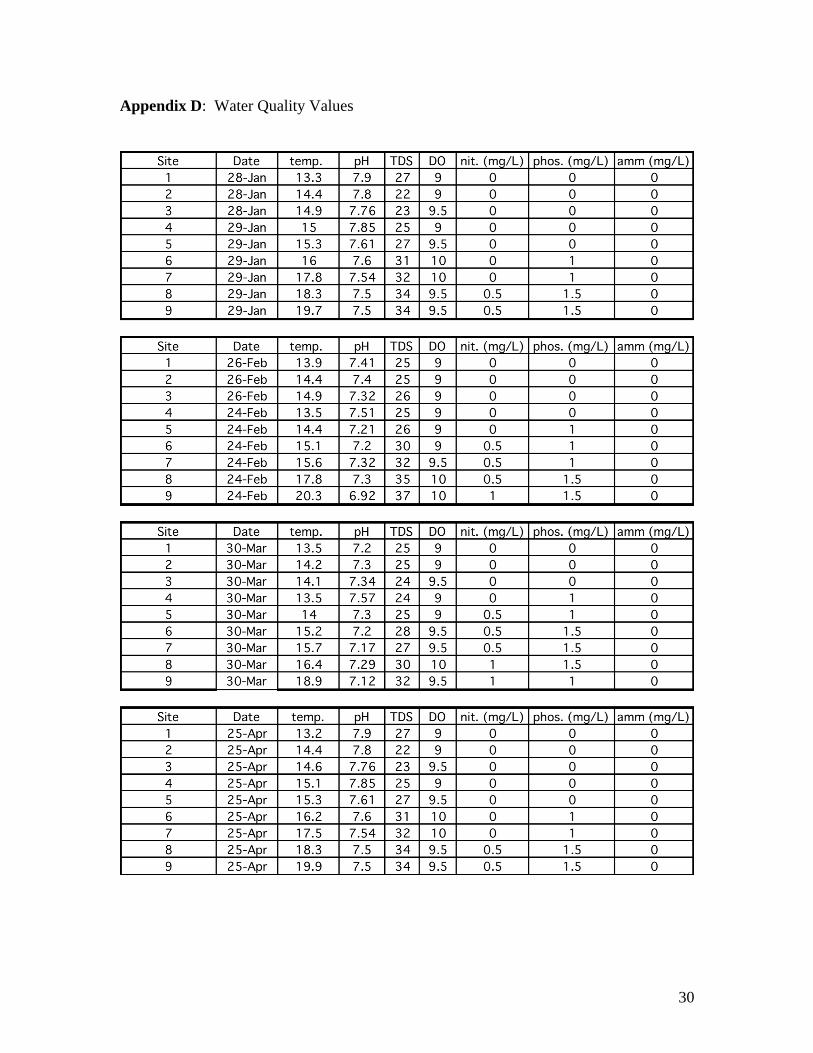
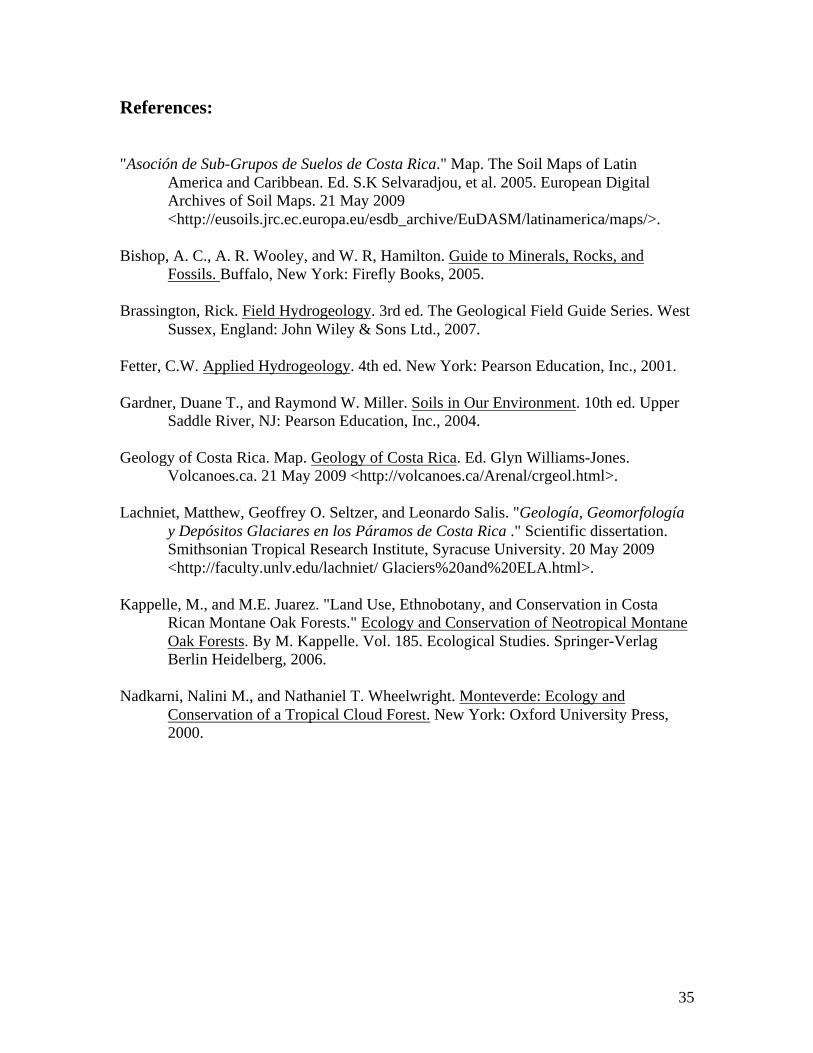
Water Quality Analysis: Changes in Chemistry of Río Chirripó Another goal of this research projects is to monitor the water quality of Río Chirripó as it moves downstream. There are 9 sites along this river that move gradually down in elevation. Also, the land uses change on these sites. As the river moves downstream, it intersects with more homes, private property, and cattle pastures. To obtain a clear image of the quality of the water, one must measure the concentrations of nitrate, phosphate, ammonia, and dissolved oxygen; and examine the temperature and pH. These water quality tests are conducted once a month, in order to gather a wide range of information. Below is a chart describing the characteristics of these 9 sites, and an image showing topographical changes between them.
17
As you can see, there are significant environmental and topographical changes for each site. These changes are also evident in the results of chemical concentrations in the water. Below are graphs showing the concentrations of the phosphate and nitrate at the 9 sites for the months of January, February, March, and April. To see the full charts for each month, view Appendix D.

18
There is a clear trend in the concentrations of these specific pollutants in Río Chirripó. For nitrate and phosphate specifically, the concentrations are about 0 mg/L in the first few sites, and then gradually increase as they move downstream. Although the concentrations certainly increase, they are still quite low. At least for the EPA’s drinking standards, these water quality values are quite good. For

19
example, the Maximum Contamination Level for nitrates in drinking water is 10 mg/L. The highest concentration measured in all months for nitrate in Río Chirripó is 1 mg/L. The average TDS measured is 26 ppm, and the highest being 37 ppm. The EPA’s standards for drinking water for TDS are 500 ppm. In addition, the pH of the river lies right within the standards of between 6.5-8.5. Currently, in Río Chirripó, there is a definite human impact on the water quality. However, the impact is not yet so strong that it strongly degrades the quality of the drinking water. One can assume that this is because the sheer volume of the water is so great, that pollution is quickly dispersed into lower concentrations. Also, because of a high competition for nutrients in this ecology, the plants quickly absorb any nutrients that are deposited by either poor drainage systems or farm run-off before they reach the water systems. This, however, does not excuse the deposition of these contaminants in the first place. The population of San Gerardo de Rivas is currently very low, and so there is little room for a high human impact. But, if this changes, and more people contaminant the water, then we will see larger, more harmful changes. Right now, the largest polluters of the water and soil are poor residential drainage systems and farm run-off of fertilizers. The community also must take care to not pollute the river because the river lacks certain self-cleaning and buffering abilities. For example, there is very little to no calcium bi-carbonate material present in the soil or in the bedrock. Therefore, if the water has continual acid contamination, or somehow an increase in water acidity, there will be no way for the river to naturally relieve this problem.5 Also, the community must be aware of the process and impacts of eutrophication. With the input of fertilizers, most commonly nitrates and phosphates into the water, organisms, especially algae, use the fertilizers to grow. This can be seen in still water bodies with a high amount of green material in the water. Eventually, this algae dies, and its decomposition is anaerobic, meaning it robs the water of its oxygen. With a proper amount of eutrophication, the water could be completely without oxygen, therefore supporting no life. Although for now, there is little environmental damage being done to Río Chirripó, I fear that with the lack of proper infrastructure and education that will change. Steps should be taken to inform the community about their impact.
5 Unfortunately, this was the case with the Adirondack Mountains in northern New York State. Both chronic and episodic anthropogenic acidification now strongly affects fish populations, microbial activity, ecological stability, drinking water quality, and plant health. Anthropogenic activity in addition to a lack of geologic calcium bi-carbonate material caused this toxic acidification.

20
Aquifer Analysis: Identification and Location To identify and locate the aquifers in this region is no easy task. Because of the lack of any geologic information for this area of the Cordillera de la Talamanca, including bedrock maps, fault maps, or any other references, most of this section is based off of assumptions on limited data. The only clues that are available to attempt to find where the aquifers are in CloudBridge reserve is information on the groundwater. Unfortunately, there are also no known water wells, or any easy way to access groundwater. Therefore, the methodology to complete this part of the project is mostly based on improvisation. To obtain groundwater samples, instead of collecting from a well, one must go to all known water springs in the reserve and collect the water at it comes from the ground. Then, immediately measure the pH, TDS, and temperature. Also at these sites, water samples were taken, and will be examined in the laboratory in SUNY New Paltz and test for ion concentrations. The concentrations of the ions in the water tell a story about what kind of rock it flowed through until the sample was taken. When comparing the concentrations on all samples, hopefully trends in the concentrations could be found, and in addition to topographical information, aquifers can be identified. And so, no ion concentration information is available at this time. However, the basic field information about the spring water suggests some possibilities for aquifer identification. Below is a chart showing the information gathered for each known spring in CloudBridge Reserve.
The 9 springs were divided into three sections, based on proximity and topography. As you can see form the following satellite image, these three sections are divided by the Chirripó and Urán River, which flows into the Chirripó. Because they are divided topographically by the ultimate topographic low (Chirripó), it is safe to assume that they come from different aquifer sources. To see topographic maps of the region, see Appendix F. Sites are marked to show the topographic divides between the springs. Also, one can get an idea of the size of the Río Chirripó watershed.

21
With this information, we assume that we have at least three separate groundwater bodies that are feeding the water cycle in CloudBridge Reserve. This is not unreasonable to assume, especially while looking at the temperature data gathered from the groundwater samples. For aquifers, there can be two types, either regional or local. As the name implies, regional aquifers usually span great distances, and cover an entire region. Therefore, they are usually deeper, and flow through the rock formations for a longer

22
time. That way, they are heated by the geothermal gradient for a longer time than local aquifers. Local aquifers are smaller, usually shallower, and interact with the geologic features less than regional aquifers. Now, as we examine the temperatures of the groundwater samples taken, we can see a pretty clear trend in the temperature. Note that Norte 1-4 springs all have the highest temperature, and within a range of .2° C. They are also located on the foothill of one of the reserve’s highest topographical peaks. It is possible that a higher recharge zone for the aquifer exists, and the water is warmed thoroughly as it flows done into the spring network. Also, Quetzales 1 and 2 have the lowest temperatures, and they are located on a relatively lower topographic high. Therefore, it is safe to conclude that they are fed from a smaller, local aquifer that doesn’t have enough time to warm water by the time it leaves the spring. Lastly, Lloro, Verde, and Jilguero springs are also very close in temperature values, and they sit close to each other, on the far southwester slopes of the reserve. I also assume that these springs are fed from a smaller, local aquifer. These judgments are based on temperature and topographic regions alone, since there are no trends in the values for pH, TDS, flow or elevations. The pH is relatively uniform throughout the whole spring network, and reflects a healthy ecological environment. The flows and elevations of the springs are irrelevant in trying to identify where the aquifers are. The TDS of the water is not dependent on the aquifer itself, but more of the nature of the spring through which the aquifer releases. For example, rocky springs, such as Quetzales 1, have a lower TDS (24 ppm) than do muddy, silty, or sandy springs, such as Norte 4 (30 ppm.) This is because there are more suspended solids at the moment that the water leaves the aquifer.
Quetzales 1: Rocky spring, where water rushes from the rock layers and fractures

23
Norte 4: A silty, muddy seep spring that emerges from a pile of leaf litter.
One more important step in the aquifer analysis is to measure the amount of water that is being released by the aquifers into the Río Chirripó. To do this, one must measure the discharge of the river over a period of at least two years, and measure the base-flow recession for river. This base-flow recession will give the amount of water that is fed by the aquifer to the river.
In order to measure the discharge of the river, it is necessary to install a staff gage into the river. This will simply tell the height of the water in the river. Obviously, the height will increase in a period of high precipitation, and decrease in dryer periods. With the staff gage installed, the discharge of the river must be calculated when there is a change in the height of the river. Therefore, a graph can be made, which, over a period of time, gives the height of the river, and what the discharge will be at that height. In
future years when all the information is gathered, a reference graph would be utilized to know the exact discharge of the river. But until then, discharge calculations are still being made, and full sets of calculations are given in Appendix E. In order to measure the discharge, first the volume of the river at one exact point needs to be determined, and then the velocity of the water at that point. Using this

24
information, discharge is found. Below is a chart displaying the height of the river read by the staff gage, and what the discharge is for that height. This chart is the preliminary step to creating a stage-discharge graph. Measurements will continue in this fashion until enough information is gathered, about two years.

25
Land Use in Chirripó Valley, Affect on Environment: Crucial to this study was also examining the land use. When we understand how humans have or have not used the land, we can better understand why there are unnatural environmental changes. Immediately around the reserve and in the town of San Gerardo, there are four distinct types of land uses. There is undeveloped (forested), developed (residential), cattle pasture, and agricultural. The soil and water quality information from the forested areas were used as a control, and the chemical properties of the soil and water in the developed areas were the variables. The photo is an example of how cleared pastureland, most commonly used for cattle grazing or farming, can exist in the midst of primary or secondary growth cloud forests.
Primarily, I wanted to see if the cattle pastures had any affect on the smaller streams that flow into the Chirripó River. In order to do this, two water samples were taken from Jilguero quebrada. The water chemistry of Jilguero was measured at an elevation above the cattle pasture, and then below that cattle pasture. The cattle farm is located on a steep slope, and it is
probable that the precipitation water that falls on the top of the hill moves as through-flow down the slope of the cattle pasture. Therefore, soil was gathered at the bottom of the slope as a good representative of how the cattle pasture impacts it. Below is a chart showing the difference of the Jilguero quebrada above and below the cattle pasture. It is clear that the cattle pasture does have an impact on the water chemistry. The concentrations of nitrate and phosphate are higher below the pasture, and therefore there is an impact on the water systems.
Although there was this clear impact on the water, there was a higher impact on the chemistry of the soil. Below is a chart with two soil chemistry samples taken from locations immediately below the cattle pasture, and away from the cattle pasture, where there is no threat of run-off.

26
Therefore, there is a significant impact of cattle pasture run-off on the soil and water systems in the CloudBridge reserve. Although the amounts of fertilizers are still relatively low, there is a clear increase, most likely caused by the presence of cow manure. In addition to the cattle pastures, samples were taken from sites around an agricultural area, which is locally know, though not formally verified, to have a high amount of insecticides, pesticides, and fertilizers. In the same manner with the cattle pasture study; a sample was gathered from above the farm area and below the farm area, in topographic highs and low. As there was no obtainable water system that flowed through this area, only a soil sample was taken for this examination. It is also assumed that taking soil samples alone would be a clear enough reflection on how it affects the environment as a whole.
This is a graph showing the concentrations of nitrogen, phosphorus, and potassium above and below the farmed area. Clearly, there is a large impact on the natural environment from this particular farm. Although the farm is also relatively far from the River Chirripó, and may have a large leach field in which the nutrients could filter out of the water systems, the amount of nutrients is very high, and still undoubtedly affects the water systems. Also, this chemical test only was
able to determine the relative concentrations for three parameters, and was unfortunately not able to test for harmful petrol-chemicals commonly used in agricultural products. Costa Rica has a priority for high produce export productivity, and accordingly, little regard is given to which chemicals are used in agriculture. Hopefully, through more scientific investigation and education, trends in the use of chemicals in food production can change.

27
Conclusion: In conclusion, the water and rock systems present in CloudBridge Nature Reserve have a significant impact on the ecology. From the initial geologic formations that formed the Costa Rican land mass, we being to see how such processes affect the environment. Beginning from the deep ocean sedimentary deposits, then later the igneous rock-forming event that created the present bedrock, the geology made this area unique. The dominantly granitic rock physically and chemically weathered, created clay-like, acidic, and iron-rich soils. These soils are the very foundations of the ecology, since it is the bed on which the plants grow. And because the soil is clayey in nature, the hydraulic properties are low. Therefore, there is poor drainage, and most of the soil moisture is found in the A horizon, where there is the majority of the organic material. The soil chemistry, including high pH and low nutrients, only allows for certain tropical plant species to grow. These species are adaptive to these types soils. Now, we also know how the human environment affected the water bodies. We do see an anthropogenic influence on Río Chirripó, however, the impact is not so great, and the quality of the water is very high. It is also assumed that there are no less than three aquifers in the CloudBridge reserve, being of different sizes. We know this because of the varying temperatures and different topographic sets of springs that were analyzed and measured. Further examination of the ion concentrations of these water samples will be conducted. Land-use studies and analysis of contaminated soil and water do show that the community is affecting the quality of the environment, and hopefully proper steps could be taken to curtail this influence.

28
Appendix A: Geologic Time Scale

29
Appendix B:
Appendix C: Landslides and Slumps on Developed Slopes
30
Appendix D: Water Quality Values

31
Appendix E: Calculations of River Discharge, Based on River Volume and Velocity

32

33
Appendix F: Topographic Map of CloudBridge Reserve & Vicinity
-Outline in red shows approximate area of CloudBridge reserve.

34
-Red dots indicate approximate groundwater spring locations, and their groupings.
South set
Norte set
Quetzales set
35
References: "Asoción de Sub-Grupos de Suelos de Costa Rica." Map. The Soil Maps of Latin America and Caribbean. Ed. S.K Selvaradjou, et al. 2005. European Digital Archives of Soil Maps. 21 May 2009 <http://eusoils.jrc.ec.europa.eu/esdb_archive/EuDASM/latinamerica/maps/>. Bishop, A. C., A. R. Wooley, and W. R, Hamilton. Guide to Minerals, Rocks, and Fossils. Buffalo, New York: Firefly Books, 2005. Brassington, Rick. Field Hydrogeology. 3rd ed. The Geological Field Guide Series. West Sussex, England: John Wiley & Sons Ltd., 2007. Fetter, C.W. Applied Hydrogeology. 4th ed. New York: Pearson Education, Inc., 2001. Gardner, Duane T., and Raymond W. Miller. Soils in Our Environment. 10th ed. Upper Saddle River, NJ: Pearson Education, Inc., 2004. Geology of Costa Rica. Map. Geology of Costa Rica. Ed. Glyn Williams-Jones. Volcanoes.ca. 21 May 2009 <http://volcanoes.ca/Arenal/crgeol.html>. Lachniet, Matthew, Geoffrey O. Seltzer, and Leonardo Salis. "Geología, Geomorfología y Depósitos Glaciares en los Páramos de Costa Rica ." Scientific dissertation. Smithsonian Tropical Research Institute, Syracuse University. 20 May 2009 <http://faculty.unlv.edu/lachniet/ Glaciers%20and%20ELA.html>. Kappelle, M., and M.E. Juarez. "Land Use, Ethnobotany, and Conservation in Costa Rican Montane Oak Forests." Ecology and Conservation of Neotropical Montane Oak Forests. By M. Kappelle. Vol. 185. Ecological Studies. Springer-Verlag Berlin Heidelberg, 2006. Nadkarni, Nalini M., and Nathaniel T. Wheelwright. Monteverde: Ecology and Conservation of a Tropical Cloud Forest. New York: Oxford University Press, 2000.